
Failure Analysis of Casing in Shale Oil Wells under Multistage Fracturing Conditions
1
State Key Laboratory for Performance and Structure Safety of Petroleum Tubular Goods and Equipment Materials, China National Petroleum Corporation Tubular Goods Research Institute, Xi’an 710077, China
2
China National Petroleum Corporation Chuanqing Drilling Engineering Co., Ltd., Chengdu 610051, China
3
Changqing Branch, China National Petroleum Corporation China National Logging Corporation, Xi’an 710201, China
4
China National Petroleum Corporation Tarim Oilfield Company, Korla 841000, China
5
China National Petroleum Corporation Exploration and Production Company, Beijing 100007, China
*
Authors to whom correspondence should be addressed.
Processes 2023, 11(8), 2250; https://doi.org/10.3390/pr11082250
Submission received: 25 June 2023
/
Revised: 23 July 2023
/
Accepted: 24 July 2023
/
Published: 26 July 2023
(This article belongs to the Special Issue Risk Assessment and Reliability Engineering of Process Operations)
Abstract
:During the multistage fracturing in shale oil and gas wells with tieback and liner, one of the major challenges is the wellbore temperature variation due to the high-rate fracturing. In such a case, the axial shrinkage trend of the casing string could be caused due to the sudden drop in temperature, but the actual axial length of the casing string would not change due to the cement constraints. Therefore, this could lead to cementation damage between the casing and cement due to excessive load from the casing string. A wellbore seal that is out of control often leads to irreversible consequences, even well abandonment. In order to study the mechanism of casing deformation in shale oil and gas wells with tieback and liner quantitatively, in this paper, take LS1 well (a typical shale oil and gas well with tieback and liner, and casing deformation is caused) for example, the transient changes of temperature and pressure in the whole wellbore during multistage fracturing are studied. Moreover, the cementing strength test of the interface between casing and cement is also tested. Then, the testing results are carried out and extended to model the finite element (FE) model with the whole vertical section casing string with tieback and liner. The model is used to simulate the internal force changes under fracturing conditions with different stages of fracturing. Meanwhile, the casing deformation mechanism in LS1 well is analyzed and studied in detail. Our simulation results indicated the failure process and mechanism of cementation between casing and cement in shale oil and gas wells with tieback and liner. Our work can provide a detailed theoretical reference and a basis for field application.
1. Introduction
In light of the depletion of traditional oil and gas reserves, as well as the sharp rise in global energy demand, unconventional reservoirs—characterized by their extremely low permeability—have garnered increasing interest within the industry for exploration and production endeavors [1,2]. The utilization of the extensive multistage fracturing technique has proven to be an efficacious approach to stimulating these reservoirs. Nonetheless, casing integrity issues induced by the fracturing process have been progressively exacerbating [3].
Recently, there has been significant research on casing failure during fracturing, with a particular emphasis on utilizing the finite element method to study shear deformation. However, a unified theoretical understanding of the underlying mechanism of this issue has not yet been achieved. In 2016, Liu et al. [4] established a calculation model for casing stress under local load to study casing damage in Changning–Weiyuan shale gas wells in Sichuan Province. They concluded that temperature stress during fracturing and local load caused by periodic changes in casing pressure led to casing deformation in shale gas wells. Yan et al. [5] also investigated the effect of temperature during the fracturing process and found that the temperature inside the casing drops significantly during high–flow hydraulic fracturing, causing the shrinkage of the retained liquid in the cement ring. This leads to a decrease in pressure inside the cement sheath, making it unable to supplement the pore pressure in a short time, resulting in a non-uniform external support state of the casing. Simultaneously, casing experiences high internal pressure during hydraulic fracturing. The combination of uneven external support and high internal pressure causes casing deformation. Yu et al. [2,6,7,8] proposed a microseismic data inversion method, suggesting that asymmetric fracturing creates a stress gap effect around the wellbore trajectory, leading to lateral extrusion of borehole rock and casing deformation. After repeated fracturing, various effects, such as a decrease in rock properties and an increase in geostress non-uniformity, result in radial elliptic deformation and axial S-shaped deformation of the casing. This represents a new theoretical understanding. In 2017, Liu and Gao et al. [9] developed a mechanical model to study the behavior of casing under local loads, and they verified its accuracy using numerical simulation, the Nester method, and field data. They discovered that during fracturing, the fracturing fluid flows into the wellbore annulus, becomes sealed and heated, and then enters the original reservoir, causing rock sliding. The local load applied to the casing is a crucial factor that leads to casing damage. With the extensive research conducted by scholars, the study of casing damage in fracturing operations has become more diverse, and many researchers have achieved unique insights. In 2019, Li et al. [10] disputed that the uneven load on the casing in the fracturing process is not the primary cause of casing deformation, as the casing deformation in the fracturing process is not due to casing yield. Instead, the deformation is mainly due to a substantial reduction in casing diameter, which is caused by the activation of existing fractures or faults in the fracturing process. The critical value of casing diameter reduction is a more precise criterion for casing failure than the critical value of casing strength yield. Restrepo et al. [11] investigated wellbore integrity during hydraulic fracturing and concluded that poorly concentrated cement creates drilling fluid voids during fracturing. They proposed a unique method for capturing the additional stresses generated by these voids, which can lead to casing deformation and failure. Additionally, the low-temperature fracturing fluid used during fracturing can cause cavity shrinkage, reduce pressure, and generate local non-uniform loads, all of which can lead to casing deformation. These findings are consistent with Yan et al.’s views in 2016. Li et al. [12] analyzed the Roewei shale gas well and found that the interaction between fracturing fluid and clay during the fracturing process can cause shale expansion. The difference between injection pressure and formation pressure can also lead to stress concentration at the lithologic interface. Furthermore, the accumulation of stress induced by hydraulic fractures increases the maximum principal stress near the wellbore. If this stress exceeds the compressive strength of the casing, it can lead to casing deformation. In 2021, Yang et al. [13] conducted a classification study on casing deformation or damage during fracturing in the Sichuan–Chongqing region of China. They found that collapse failure was more significant than shear failure and that formation displacement caused by fracturing resulted in casing shear failure. The interaction between the injection rate of fracturing fluid and the wellbore environment causes external load imbalance, leading to casing collapse. They recommended a strain-based casing design instead of the current maximum stress-based casing design for hydraulic fracturing wells in the Sichuan and Chongqing areas of China. In 2022, Zorica et al. [14] argued that the increase of axial force caused by active fractures during the hydraulic fracturing stage is the main cause of casing deformation. They found that the shear force generated by migration fractures on the casing reduces the critical force of casing deformation, thereby amplifying the effect of axial force on casing deformation. Improving cementing quality is an effective measure to reduce excessive casing deformation. In February 2023, Zhang et al. [15] used MIT–24 technology to analyze the planning surface of deformed casing in the Weiyuan area. They combined this with the relationship between casing deformation and engineering parameters and found that hydraulic fracturing caused an increase in fluid pressure in intersecting faults and large fractures, resulting in shear slip and asymmetric compression of casing on both sides of faults and large fractures, leading to casing deformation. Therefore, they proposed the integrated technology of temporary plugging fault fissure, multi-cluster perforation, and fracturing fluid flow-back. After a field test in the Weiyuan area, the casing deformation rate decreased from 54% to 9.1%.
Previous work thus clearly demonstrated the characteristic and mechanism of casing deformation; however, the whole well section string model with tieback and liner has not been exciting in previous research. Furthermore, such technical guidance and support are urgently needed in the oil field. Based on this, the field data of a well that has experienced casing failure was collected. Also, experiments and numerical simulations were designed to discuss possible factors of casing deformation and damage during fracturing in this study. Furthermore, the FE (finite element) model, which considered the tieback–liner–cement ring–rock formation in the well, was established in the part of numerical simulation for calculation and analysis so as to guide the field that using tieback and liner to reduce the occurrence of casing deformation and damage.
2. Failure Condition Settings
2.1. Wellbore Configuration
A typical well integrity failure occurred in LS1 well with tieback and liner during fracturing operations. Figure 1 presents the wellbore configuration of the LS1 well and its introduction of cement bond logging results. LS1 well is a sidetrack horizontal well, its measure depth is 4744 m, its vertical depth is 3274 m, and its configuration is a three-hole-ins well. Table 1 shows the parameters of the casing string in the LS1 well. It is worth noting that the liner (Φ139.7 × 10.54 − P110, depth: 2464–4744 m) and tieback (Φ139.7 × 10.54 − P110, depth: 0–2465 m) are used as production casing. The window depth is 2653 m, and the window is drilled in the intermediate casing (Φ244.5 × 11.99 − P110, depth: 0–2748 m). The original vertical well section below the window point is filled with cement, and the geothermal gradient is 3.0 °C/100 m.
On the other hand, it can be found that the cementing quality is significantly different along tieback according to the cement bond logging results: (i) well depth 0–1626 m continuous segment: high cementing quality along whole segment is continuous; (ii) well depth 1626–2464 m intermittent segment: high cementing quality along whole segment is intermittent, and the longest length of cement segment with high cementing quality is 12.5 m, and the shortest length is 1.5 m. Meanwhile, the solid filling rate in the empty space (cement segment with low cementing quality) is less than 25%.
2.2. Failure Introduction
The vertical depth of the reservoir is 3271–3276 m, and the lithology is shale (the resistance is 232.5–3279.9 Ω·m, and the porosity is 2.4–2.9%) in LS1 well. Meanwhile, the number of fracturing stages is 23 (each stage has four fracturing clusters), ranging from 3200 to 4744 m in the original fracturing design. Each stage is designed with a flow rate of 14 to 20 m3/min and the duration is 2 h, the sand by volume ratio is 20%, and its density is 1.4 g/cm3.
After the cementing is complete, the first 12 stages of the operation are successfully fractured. However, there was a sudden drop in wellhead fracturing pressure during the No. 13 fracturing operation (well depth: 3998.5–4018.5 m). After a systematic well control operation, a pressure test is conducted, then the production casing is found to be unable to hold pressure, and the wellbore flow path has failed. And then, wellbore inspection work is carried out. Figure 2 illustrates the 24 arm logging results of producing casing inner diameter between measure depth 2463–2464.8 m. It can be found that the body of the production casing has broken and separated by about 1.2 m at the mentioned location. In this 1.2 m section, the measured diameter reaches 170 mm, much larger than the production casing’s inner diameter (118.62 mm). As a result of this incident, the well was shut in for a long period of time (185 days so far), resulting in significant financial losses.
3. Experimental Study
In order to clarify the cause of casing deformation and failure during the fracturing stage, relevant experiments were first designed in this part. First of all, the mechanical properties of the casing itself were studied to clarify whether the material itself has an impact on the failure that occurs downhole. In addition, a casing–cement sheath cementing strength test was carried out to quantify the failure load of the casing–cement sheath combination. The designed experiments can provide parameter support for follow-up research and conclusions.
3.1. Mechanical Performance Test of Casing
To qualitatively and quantitatively characterize the properties of alloy steel casing pipe in LS1 well, several casing samples from the same manufacturer’s production line are tested to verify the quality of the alloy steel material in this work. The studied alloy steel casing pipe is manufactured according to 110 ksi (758 MPa) nominal yield strength. Hence, a series of experimental measurements of the P110 alloy steel are performed to characterize the metallographic structure, mechanical properties, etc. The casing material mentioned in this work is P110. An HCS 140 high-frequency infrared ray carbon sulfur analyzer (Shanghai Dekai Instruments Co., Shanghai, China) is used to measure its chemical composition: (wt.%) C—0.28, Si—0.23, Mn—1.32, P—0.01, S—0.011, Cr—0.0015, Mo—0.003, W—0.028, Ni—0.01, V—0.002, Fe—Balance. Figure 3 presents the optical micrographs revealing the typical microstructures of the base material, and the tempered sorbite is a remarkable microstructure feature. The chemical element composition of the casing material is in accordance with ASTM A732-1998, and failure caused by inconsistent chemical composition is ruled out.
In order to identify other possible factors, three types of specimens are prepared and characterized via a tensile test and impact test to the mechanical properties of P110 alloy steel. The dimensions of all the types of specimens are shown in Figure 4. The specimens are ground using an 800-grit SiC paper, followed by mechanical polishing with a suspension of SiO2 particles of 50-nm diameter. Finally, anhydrous ethanol was used to clean the specimen. The test results are also extended to the subsequent FE model.
MTS tensile testing machine was adopted to test the material strength of samples. Both ends of the sample are clamped on the testing machine. The testing machine applies a load along the central axis and stretches the sample uniformly. The stress–strain curve of the sample is derived by recording the tensile force and elongation. Figure 5 illustrates the stress–strain curves of the P110 alloy steel under different temperatures (20 °C and 80 °C). According to the key parameters in Table 2, the yield strength, tensile strength, and modulus of elasticity of the P110 alloy steel at 20 °C are greater than those at 80 °C (temperature at well depth 2464 m, according to 3.0 °C/100 m geothermal gradient). Obviously, the percentage elongation at fracture of the P110 alloy steel at 20 °C is less than that at 80 °C. It can be observed that there is a slight change in the mechanical properties of the P110 alloy steel under different temperatures (20 °C and 80 °C). From the perspective of material mechanics, the temperature increase could result in intense atomic movement, and the corresponding macroscopic manifestation is that the material becomes more prone to plastic deformation, resulting in a reduction in the strength of the material. However, both the tensile test and service temperature of the tieback casing materials are within 80 °C. Thus, temperature had little influence on the strength and was not the main factor that resulted in the wellbore failure.
The toughness of materials under impact load and multiaxial stress is measured by the Charpy impact test. Place the cleaned sample on the sample support of the impact testing machine so that the sample is in the state of a simply supported beam. The next step is to perform a single hammer blow to the test using a pendulum of a specified height. The essence of the test is to test the work absorbed by the sample when it breaks under the impact load through the principle of energy conversion. Figure 6 presents the load/energy versus displacement curves of P110 alloy steel. The related parameters are presented in Table 3. It can be seen that the P110 alloy steel remains reliably tough over a series of temperature changes in the field according to the results of the impact tests. Meanwhile, the mechanical strength and toughness of the casing alloy steel are not obviously weakened in the service environment based on tensile and impact tests. In general, the microstructures and macroscopic mechanical properties of the casing material used in the field could meet the requirements of service design.
3.2. Cementing Strength Test of Interface between Casing and Cement
In order to quantify the strength and the failure load of cementation, the test of cementing strength of casing–cement ring is carried out. The main equipment used is the wellbore integrity combined load system (capacity: (i) specimen size: ≤9 5/8″; (ii) non–uniform capacity: 1200 t; (iii) shear capacity: 600 t; (iv) axial tensile/compress load: 1000 t; (v) internal pressure: 200 MPa; (vi) bending: <20°/30 m; (vii) temperature: 200–1000 °C; (viii) torque ≥ 40,000 N.m; (ix) temperature and pressure alternate load), as shown in Figure 7. The test equipment can realize the service performance simulation of casing–cement ring in non-uniform collapse, shear, axial tension and compression, bending and internal pressure, high temperature, and other combined load conditions. Meanwhile, the specimen involved in this paper is a casing–cement system, which consists of production casing (OD (outer diameter) 139.7 mm + wall thickness 10.54 mm + 110 ksi), cement ring (OD 215.9 mm + ID 139.7 mm, G–grade cement), protective casing (OD 244.5 mm + ID 215.9 mm + 110 ksi), with a length of 1.3 m. The cement length of the specimen is 0.3 m, 0.5 m, 0.8 m, and 1 m, respectively.
The production process and loading process of the casing–cement ring specimen are presented in Figure 8. The production process of the specimen: (i) the G–grade cement with non–Newtonian fluid state is placed between the production casing and the protective casing and set for 48 h, and the upper end of the production casing is exposed 20 cm, the lower end of the production casing is exposed 10 cm, (ii) the rigid dam–board is placed under the cement ring protective casing, (iii) the axial downward push force from the wellbore integrity combined load system is applied to the upper end of the production casing until the cementation of production casing–cement is broken. When the cementation is broken, the production casing moves downward axially. Meanwhile, the push force value and displacement could be recorded by the wellbore integrity combined load system.
Figure 9a illustrates the load from push force vs. dam–board displacement (0.5 m cement length specimen), it can be seen that the law of cementation damage is divided into three stages: (i) the elastic stage: taking the specimen with 0.5 m cement length as an example, when the dam–board displacement is 0–1.25 mm, the push force increases rapidly and linearly to 101 kN, the casing–cement cementation is intact at this stage, (ii) the plastic stage: when the displacement of the dam–board exceeds 1.25 mm, the push force is almost constant with the increase of displacement, the casing–cement cementation begins to break down at this stage, meanwhile, when the displacement of the dam–board is increased to 2.5 mm, the push force reaches its maximum (110 kN) and the cementation begins to tear, and this force is defined as the cementation strength between casing and cement, (iii) the failure stage: when the displacement of the dam–board exceeds 3.8 mm, the push force decreases rapidly with the increase of displacement, the casing–cement cementation is completely broken at this stage. Meanwhile, Figure 9b illustrates the cementation strength of casing–cement vs. cement length. It can be seen that the cementation strength increases linearly as the length increases. Additionally, the average cementing strength of specimens with different cement lengths (0.3 m, 0.5 m, 0.8 m, 1 m, and there are three duplicate specimens of each length) reaches 72 kN, 105 kN, 189 kN, and 215 kN, respectively. In addition, the mathematical relationship between cementation strength (Sc) and cement length (Lc) can be fitted as Sc = 222.87 Lc + 0.998. Obviously, the longer the casing–cement cementing length, the stronger the cementing force.
To further quantify casing–cement cementation strength, an FE model with a cohesive element is established to obtain the constitutive relation of the element characterizing the strength. An FE model with a cohesive element (the size of the model is consistent with that of the test specimen in Figure 8) consists of a production casing (OD (outer diameter) 139.7 mm + wall thickness 10.54 mm+110 ksi), a cement ring (OD 215.9 mm + ID 139.7 mm, G—grade cement), and a protective casing (OD 244.5 mm + ID 215.9 mm + 110 ksi). Meanwhile, the cohesive elements are arranged at the interface between the production casing and the cement ring.
Figure 10 compares the experimental test results of cement cementation strength with the FE results. The constitutive relation of cementation presents four stages: (i) when casing displacement varies from 0 to 1.5 mm, the axial load applied to the casing rapidly increases from 0 to 105 kN (at this time, casing and cement sheath are still in the state of cementation) (ii) then, when the casing displacement is between 1.5 mm and 2.5 mm, the axial load increases slowly, the casing and cement sheath gradually peel off, (iii) when the casing displacement exceeds 2.5 mm, the axial load decreases slowly, (iv) and the axial load decreases abruptly when the casing displacement reaches 4.0 mm, the casing is completely separated from the cement. It is well known that the cementation strength of the cohesive element is characterized by the constitutive relationship between the cohesive force and the normal displacement of two opposites. Therefore, by adjusting the constitutive model of the cohesive element between the casing and the cement ring, the results of the FE model are basically consistent with the experimental results. And the quantified strength is used to compensate for the establishment of FE models of a wellbore.
4. Numerical Simulation Study
4.1. Analysis of Wellbore Temperature and Pressure Fluctuation during Fracturing
It is well known that casing fracturing is commonly used in shale oil and gas wells. Therefore, it has a higher injection rate. The casing string temperature could drop significantly in a short period during fracturing, and this change is the main reason for the accumulation of axial deform and internal force in the casing string. Figure 11 shows the physical model of fracturing fluid and heat transfer in the shale borehole. It can be found that fracturing fluid enters the casing string at the wellhead with a temperature (TFRin) and flows down into the reservoir with a temperature (TFRout). The rate of heat convection between the fracturing fluid and the inner wall of the casing could affect fluid temperature (TFR) significantly. The heat generated is continuously carried out inside the casing, and a temperature decrease surrounding the borehole is caused. Finally, the wellbore temperature slowly rises after the fracturing operation is complete because the heat generated in the far distance of the borehole diffuses to the wellbore by heat conduction due to the effect of temperature difference.
Fracturing fluid flowing in casing could be divided into several units (the Z-axis is the axial direction of wellbore), and the heat of a unit consists of four parts: (i) the change of internal energy of fracturing fluid, (ii) heat generated by convection heat transfer between fracturing fluid and casing, (iii) the heat carried by the down-flowing fracturing fluid, (iv) thermal friction between fracturing fluid and casing [16,17].
The internal energy EFRI of fracturing fluid per unit time dt can be presented as:
The heat generated by convection heat transfer, QHT, between fracturing fluid and casing per unit time dt can be obtained as follows:
The heat QHC carried by the down-flowing fracturing fluid per unit time dt can be expressed as:
The work from thermal friction WF between fracturing fluid and casing per unit time dt can be illustrated as:
The equilibrium equations of fracturing fluid can be expressed as:
The casing string can be divided into several units. The heat of a unit consists of four parts: (i) axial heat conduction of casing string, (ii) convection heat transfer between the casing inner wall and fracturing fluid, (iii) heat conduction between the casing outer wall and cement ring, (iv) the change of casing unit internal energy.
The axial heat conduction Qax of a casing unit per unit time, dt, can be presented as:
The equilibrium equations, including the heat conduction Qra of the casing outer wall–cement ring and the convection heat transfer of the casing inner wall–fracturing fluid per unit time dt can be expressed as:
The change in internal energy ECI of a casing unit per unit time dt can be illustrated as:
The equilibrium equations of casing string can be calculated as follows:
The heat transfer relation of casing wall–cement ring (inside radius of casing RC, temperature TC)–cement (RCE, TCE)–formation (RF, TF) all could be regarded as the heat conduction between the multilayer cylinder wall.
The casing temperature and internal pressure in the casing could change urgently under different stage fracturing conditions. The whole section casing temperature could decrease, and the internal pressure in the casing could increase under each stage. Meanwhile, casing temperatures could rise toward formation temperature (the reservoir temperature is 165 °C), and internal pressure drops toward formation pressure (the wellhead pressure is 0 MPa, and the reservoir pressure is 58 MPa) as the bridge plug is run.
The heat transfer theory and static thermal parameters of various materials in a wellbore are presented in Table 4. Figure 12a presents the temperature of production casing under different stage fracturing conditions, and it can be seen that casing temperature could drop from reservoir temperature significantly during No. 1 fracturing (maximum temperature difference between casing temperature and reservoir temperature reaches 95 °C), then the casing temperature could increase during No.1 bridge plug. Subsequent fracturing operations are consistent with the above rules of temperature change. Simultaneous, according to the dynamic friction resistance theory [16], Figure 12b presents the internal pressure of production casing under different stage fracturing conditions; it can be seen that internal pressure could increase from reservoir pressure (the wellhead pressure is 0 MPa, the reservoir pressure is 58 Mpa) significantly during No. 1 fracturing (the wellhead pressure is 64 Mpa, the reservoir pressure is 66 Mpa). Subsequent fracturing operations are consistent with the above rules of internal pressure change. The calculation of fracturing pressure takes into account wellhead construction pressure, fracturing fluid column pressure, and frictional pressure drop (ground test: friction pressure drop is 760 kPa in casing with 76 mm inner diameter at 4.5 m3/min displacement).
The casing temperature and internal pressure in the casing could change urgently under different stage fracturing conditions. The whole section casing temperature could decrease, and the internal pressure in the casing could increase under each stage. Meanwhile, casing temperatures could rise toward formation temperature (the reservoir temperature is 165 °C), and internal pressure drops toward formation pressure (the wellhead pressure is 0 MPa, and the reservoir pressure is 58 MPa) as the bridge plug is run. Figure 13 describes the service load change at the casing deformation position (measure depth 2464 m): (a) casing temperature, (b) internal pressure. It can be seen that the temperature of the casing at the failure point (2464 m) fluctuates significantly.
Based on the geothermal gradient, the initial casing temperature is 130 °C. During the No. 1 fracturing stage, the temperature drops to 35 °C, and ∆T (the difference between maximum temperature and minimum temperature) reaches 95 °C. During the No. 1 bridge plug, the casing temperature increases to 91 °C. During subsequent multistage fracturing operations, the ∆T of casing temperatures between the fracturing stage and bridge plug process varies from 40 °C to 45 °C.
According to the formation pressure gradient, the initial casing inner pressure is 24 MPa. During the No. 1 fracturing stage, the inner pressure rises to 76 MPa, and ∆P (the difference between maximum inner pressure and minimum inner pressure) reaches 52 MPa. During the No. 1 bridge plug, the casing temperature decreases to 24 MPa. During subsequent multistage fracturing operations, the ∆P of the casing inner pressure between the fracturing stage and bridge plug process varies from 45 MPa to 50 MPa.
4.2. Modeling of Whole Vertical Section Casing String with Tieback and Liner
To further analyze the quantitative deformation of casing quantitatively, the coupling FE model of tieback–liner–cement ring–rock formation in vertical section LS1 well is established, and Figure 14 illustrates the coupling FE model. The model consists of tieback (Φ139.7 × 10.54 − P110, depth: 0–2465 m), liner (Φ139.7 × 10.54 − P110, depth: 2464–2653 m), cement ring (the cementing quality: (i) well depth 0–1626 m continuous segment: high cementing quality along whole segment is continuous; (ii) well depth 1626–2464 m intermittent segment: high cementing quality along whole segment is intermittent, and the longest length of cement segment with high cementing quality is 12.5 m, and the shortest length is 1.5 m. Meanwhile, the solid filling rate in the empty space (cement segment with low cementing quality) is less than 25%.) and rock formation (Inner diameter 215.9 mm, outer diameter 2 m).
The material properties of the different components involved in the model are shown in Table 5. The cohesive element is used at the interface between the tieback and the cement ring. The cohesion force of the cohesive element is given according to the material constitutive relation in Figure 10. The hexahedral scanning element is used to divide the 3D model, and the elements in the tieback pad and rubber ring are secondarily encrypted.
Load application process: (i) the initial temperature of the whole model is assigned according to the geothermal gradient (the wellhead temperature is 25 °C, the reservoir temperature is 165 °C), the internal pressure is assigned according to the completion fluid column pressure (the wellhead pressure is 0 MPa, the reservoir pressure is 58 MPa) and the external pressure is assigned according to the formation brine column pressure (the wellhead pressure is 0 MPa, the reservoir pressure is 34 MPa), (ii) based on the transient heat transfer theory, the temperature (Figure 13a) and internal pressure (Figure 13b) of tieback are assigned according to the actual operation period, meanwhile, the external pressure is assigned according to the formation brine column pressure (the wellhead pressure is 0 MPa, the reservoir pressure is 34 MPa). Significantly, it is expected that the tieback axial force variation and cementation damage between tieback and cement could be obtained by numerical simulation.
4.3. Simulation Results
Through numerical simulation, the axial force variation of the casing string is quantified during fracturing. Figure 15a illustrates the change of axial force of tieback vs. measure depth. It can be seen that the axial force of the tieback changes dramatically due to the temperature and pressure changes during multistage fracturing. For example, the casing temperature drops and internal pressure increases during the No. 1 fracturing (flow rate of 18 m3/min and the duration is 2 h, the sand by volume ratio is 20%, and its density is 1.4 g/cm3) according to the results in Figure 12. Therefore, the axial force of the casing string changes from the conventional state (the wellhead is 400 kN, the bottom is −86 kN with compression state, the neutralization point is 2075 m) to the whole section tension state (the wellhead is 840 kN, the bottom is 950 kN, the neutralization point disappearance). When the No. 1 bridge plug is run into the wellbore, the wellbore temperature rises, the pressure drops, and the axial force gradually returns to its conventional state. The reason for this change in axial force is: (i) when the casing temperature drops, the casing could shrink if the casing string is unrestrained, but the cementation from the interface between the casing and cement ring constrains this axial displacement, resulting in an increase in the tensile axial force of the string, (ii) as the internal pressure increases, the casing could swell if the casing string is unrestrained, but the cementation from the interface between casing and cement ring constrains this axial displacement, also resulting in an increase in the tensile axial force of the string. In the subsequent 2–13 stage of the fracturing process, the change of axial force of the tieback follows the above rules.
Figure 15b illustrates the change of axial force of tieback vs. time at different well-depth positions. It can be seen that the axial force at any position presents the law of alternating change: (i) the amplitude of axial force (∆Fa) change increases with the increase of the well depth (the maximum ∆Fa at 1600 m is 799 kN, the maximum ∆Fa at 1800 m is 911 kN, the maximum ∆Fa at 2000 m is 1023 kN, the maximum ∆Fa at 2200 m is 1135 kN, the maximum ∆Fa at 2400 m is 1250 kN), (ii) the amplitude of axial force change decreases with the increase of time (the ∆Fa from 799 kN decreases to 601 kN at 1600 m, the ∆Fa from 911 kN decreases to 653 kN at 1800 m, the ∆Fa from 1023 kN decreases to 705 kN at 2000 m, the ∆Fa from 1135 kN decreases to 756 kN at 2200 m, and the ∆Fa from 1250 kN decreases to 805 kN at 2400 m).
It can be seen from Figure 15 that the temperature of the casing string decreases during the fracturing process, but the cementation of the cement restricts the casing axial shrinkage because of the temperature drop. Therefore, the axial shrinkage force and the casing–cement cementation force become a pair of resistance. When the axial shrinkage force is greater than the cementation force, the cementation could be destroyed. On the other hand, according to the casing–cement cementation test results, the longer the casing–cement cementing length, the stronger the cementing force. Unfortunately, in the well depth 1626–2464 m intermittent segment, high cementing quality along the whole segment is intermittent, and the longest length of cement segment with high cementing quality is 12.5 m, and the shortest length is 1.5 m. Therefore, the cementation between the casing and cement could be damaged under the alternating axial force. Figure 16 illustrates the casing axial force (well depth 2464 m) and cementation damage of casing–cement interface (well depth 2455.8–2464 m) vs. time. The simulation shows that the cement in the first 8.2 m high-quality cementing section (from bottom to top in 1626–2464 m intermittent segment) is broken during the first fracture. During the first stage (120 min), the axial force of the casing at 2464 m increases linearly with time, from −83 kN to 875 kN, and then stabilizes after 70 min. Meanwhile, in the process of changing the casing axial force, casing–cement cementation is destroyed synchronously, and the failure sequence of cementation is from bottom to up. And the length of cementation failure at 10 min, 30 min, 50 min, 70 min, and 90 min is 0.5 m (see No.1 in the Figure), 1.1 m (see No. 2), 3.4 m (see No. 3), 5.8 m (see No. 4), and 8.2 m (see No. 5), respectively (in the FE model, when the damage factor reaches 1, the cementation is completely destroyed).
According to the above studies, the axial force of the casing string could frequently change due to the alternating condition of temperature and pressure during the multistage fracturing process. Therefore, the cementation of the casing–cement interface is progressively broken. Figure 17 presents the free deformation section of the casing vs. fracturing stage under alternating conditions of temperature and pressure. It can be seen that the tieback is normally inserted into the liner before fracturing (initial), the positioning ring on the tieback is pressed down by 10 t (downward displacement 2.06 mm) after contacting the connector, and the length of the broken cementation of casing–cement interface is 0 m. During No. 2 fracturing, the positioning ring on the tieback is separated from the liner, the tieback plug migrates 101.01 mm upward, and the length of broken cementation of casing–cement interface reaches 78 m (above positioning ring on the tieback). During No. 4 fracturing, the tieback plug migrates 239.81 mm upward, and the length of the broken cementation of the casing–cement interface reaches 161 m. During No. 7 fracturing, the tieback plug migrates 368.89 mm upward, and the length of the broken cementation of the casing–cement interface reaches 275 m. During No. 10 fracturing, the tieback plug migrates 615.41 mm upward, and the length of the broken cementation of the casing–cement interface reaches 462 m. During No. 13 fracturing, the tieback plug migrates 982.74 mm upward, and the length of broken cementation of the casing–cement interface reaches 838 m.
It is analyzed that under alternating temperature and pressure conditions, if there is no constraint, the casing string could shorten and extend in the axial direction. However, the cement ring could prevent the mentioned axial casing string deformation under high cementing quality. Unfortunately, high cementing quality at well depth 1626–2464 is intermittent, and the longest length of cement segment with high cementing quality is 12.5 m, and the shortest length is 1.5 m. Meanwhile, the solid filling rate in the empty space cement segment with low cementing quality) is less than 25%. So, the axial deformation of the casing string progressively damages the cementation of the casing–cement interface from the tieback bottom (2464 m) upward.
5. Discussion
Figure 18 presents the comparative analysis of logging results of casing inner diameter (0–180° high position and 90–270° right position) and FE results. It can be seen that according to the wellbore orientation in the horizontal section, logging results of casing inner diameter along high position and right position is obtained (high position is distinguished from right position, 0–180° is the high position of the wellbore, which indicates the casing position relative to the high or low side of the bore, meanwhile, 90–270° is the right position of the wellbore, which indicates the casing position relative to the left or right side of the bore). Then, the logging data were compared with the FE results, and the results showed a high degree of consistency; the casing inner diameter suddenly increased from 121.4 mm to 166 mm, and the length of the expanding section reached 1.1 m. Then, a stepped neck appears, which is a change in the inner diameter of the upper liner.
According to the comparison results above, it is analyzed that the casing string could shorten and extend in the axial direction under alternating temperature and pressure conditions if there is no constraint. However, the cement ring could prevent the mentioned axial casing string deformation under high cementing quality. Unfortunately, high cementing quality at well depth 1626–2464 m is intermittent, and the longest length of cement segment with high cementing quality is 12.5 m, and the shortest length is 1.5 m; meanwhile, the solid filling rate in the empty space (cement segment with low cementing quality) is less than 25%. So, the axial deformation of the casing string progressively damages the cementation of the casing–cement interface from the tieback bottom (2464 m) upward. During No. 13 fracturing, the tieback plug migrates 982.74 mm upward and the length of broken cementation of the casing–cement interface reaches 838 m. Without the constraint of cementation from the cement ring, the 838 m casing contracted axially when the temperature dropped, resulting in the 1.1 m expansion section.
Based on the research results, it can be seen that in the process of shale oil and gas development, the operation method of using tiebacks downhole is extremely risky. Therefore, we will focus on two aspects to solve such problems in future research. One is to optimize the cementing scheme and continue to improve the cementing quality; the other is to focus on the application of anchor tiebacks in shale oil and gas wells, including mechanical design, structure optimization, material selection, and other aspects.
6. Conclusions
In order to clarify the mechanism of casing deformation during fracturing, experiments and numerical simulations were carried out on a well with casing damage during fracturing. The experimental results show that the material of the casing is not the main cause of the damage to the casing downhole. Furthermore, the cementing strength test of the interface between casing and cement was carried out, and on this basis, the finite element model of the full vertical casing string with tieback and liner was established. With the help of this model, the temperature, pressure, and internal force changes of the string under different fracturing conditions are discussed. Some key points and cognition could be drawn as:
- (1)
- During the multistage fracturing process, casing temperature and internal pressure change significantly repeatedly. These alternating loads result in significant changes in the axial force of the casing. As a result, the cementation between the casing and cement could be damaged under the alternating axial force.
- (2)
- High cementing quality at well depth 1626–2464 is intermittent in the LS1 well, and the longest length of cement segment with high cementing quality is 12.5 m, and the shortest length is 1.5 m. So, the axial deformation of the casing string progressively damages the cementation of the casing–cement interface from the tieback bottom (2464 m) upward.
- (3)
- During No. 13 fracturing, the tieback plug migrates 982.74 mm upward, length of broken cementation of the casing–cement interface reaches 838 m. Without the constraint of cementation from the cement ring, the 838 m casing contracted axially when the temperature dropped, resulting in the 1.1 m expansion section.
Author Contributions
Y.M.: Methodology, Investigation, Writing—original draft. H.Z.: Conceptualization, Resources, Writing—review and editing. J.C.: Formal analysis, Validation, Investigation, Funding acquisition. Z.W.: Writing—review and editing, Investigation. F.W.: Validation, Investigation. L.H.: Writing—review and editing. All authors have read and agreed to the published version of the manuscript.
Funding
This research was funded by the Innovative Talents Promotion Program—Young Science and Technology Nova Project (2021KJXX-63), the Research on key technology of casing damage evaluation and repair in oil and gas wells (2021DJ2705), and the Study on key technology of stimulation and modification for Gulong shale oil (2021ZZ10-04).
Data Availability Statement
Not applicable.
Conflicts of Interest
The authors declare no conflict of interest.
Abbreviations
| RC | inside radius of the casing | m |
| hC | convection coefficient of the inner wall of the casing | W/m2/°C |
| TC | casing temperature | °C |
| TFR | temperature of fracture fluid in the casing | °C |
| WF | work from thermal friction between fracturing fluid and casing per unit time | W/m |
| TCa | casing temperature | °C |
| TCE | cement temperature | °C |
| TF | formation temperature | °C |
| ρFR | density of fracture fluid | kg/m3 |
| cFR | specific heat capacity of fracture fluid | J/kg°C |
| Nq | injection rate | m3/s |
| QHT | heat generated by convection heat transfer | W/m |
| QHC | heat carried by the down-flowing fracturing fluid per unit | W/m |
| QaC | axial heat conduction of a casing unit per unit time | W/m |
| QrC | radial heat conduction of a casing unit per unit time | W/m |
| RCE | inside radius of the cement | m |
| RF | inside radius of the formation | m |
| ρC | density of casing material | kg/m3 |
| cC | specific heat capacity of casing material | J/kg°C |
| μC | thermal conductivity of casing material | W/m/°C |
| EFRI | internal energy of fracturing fluid per unit | W/m |
| ECI | internal energy of casing per unit | N |
References
- Yu, H.; Mou, Y.; Lian, Z.; Zhang, Q. Is Titanium Drillpipe Applicable to Offshore Drilling? A Question from a Corrosion Fatigue Perspective. SPE J. 2021, 27, 116–132. [Google Scholar] [CrossRef]
- Yu, H.; Taleghani, A.D.; Lian, Z. On how pumping hesitations may improve complexity of hydraulic fractures, a simulation study. Fuel 2019, 249, 294–308. [Google Scholar] [CrossRef]
- Lian, Z.; Yu, H.; Lin, T.; Guo, J. A study on casing deformation failure during multi–stage hydraulic fracturing for the stimulated reservoir volume of horizontal shale wells. J. Nat. Gas Sci. Eng. 2015, 23, 538–546. [Google Scholar] [CrossRef]
- Liu, K.; Gao, D.; Wang, Y. Effects of local load on shale gas well casing deformation. Nat. Gas Ind. 2016, 36, 76–82. [Google Scholar]
- Yan, W.; Zou, L.; Li, H.; Deng, J.; Ge, H.; Wang, H. Investigation of casing deformation during hydraulic fracturing in high geo-stress shale gas play. J. Pet. Sci. Eng. 2017, 150, 22–29. [Google Scholar] [CrossRef]
- Yu, H.; Lian, Z.; Lin, T. Study on failure mechanism of casing in stimulated reservoir volume fracturing of shale gas. J. Saf. Sci. Technol. 2016, 12, 37–43. [Google Scholar]
- Yu, H.; Taleghani, A.D.; Lian, Z.; Lin, T. On how asymmetric stimulated rock volume in shales may impact casing integrity. Energy Sci. Eng. 2020, 8, 1524–1540. [Google Scholar] [CrossRef]
- Yu, H.; Taleghani, A.D.; Lian, Z.; Mou, Y. Severe Casing Failure in Multistage Hydraulic Fracturing Using Dual-Scale Modeling Approach. SPE Drill. Complet. 2022, 37, 252–266. [Google Scholar] [CrossRef]
- Liu, K.; Gao, D.; Wang, Y.; Yang, Y. Effect of local loads on shale gas well integrity during hydraulic fracturing process. J. Nat. Gas Sci. Eng. 2017, 37, 291–302. [Google Scholar] [CrossRef]
- Li, Y.; Liu, W.; Yan, W. Mechanism of casing failure during hydraulic fracturing: Lessons learned from a tight–oil reservoir in China. Eng. Fail. Anal. 2019, 98, 58–71. [Google Scholar] [CrossRef]
- Restrepo, M.M.; Teodoriu, C.; Salehi, S.; Wu, X. A novel way to look at the cement sheath integrity by introducing the existence of empty spaces inside of the cement (voids). J. Nat. Gas Sci. Eng. 2020, 77, 103274. [Google Scholar] [CrossRef]
- Li, H.; Li, Z.; Li, G.; Yu, H.; Jiang, Z.; He, L.; Guo, B.; Dong, M. Casing deformation mechanisms of horizontal wells in Weirong shale gas field during multistage hydraulic fracturing. J. Nat. Gas Sci. Eng. 2020, 84, 103646. [Google Scholar] [CrossRef]
- Yang, S.; Han, L.; Wang, J. Laboratory study on casing deformation during multistage horizontal well fracturing in shale gas development and strain based casing design. J. Nat. Gas Sci. Eng. 2021, 89, 103893. [Google Scholar] [CrossRef]
- Radakovic-Guzina, Z.; Damjanac, B.; Savitski, A.A.; Suarez, N. Analysis of the Production Casing Deformation Due to Shearing of Offset Hydraulic Fractures. In Proceedings of the SPE/AAPG/SEG Unconventional Resources Technology Conference, Houston, TX, USA, 20–22 June 2022. [Google Scholar]
- Zhang, H.; Tong, H.; Zhang, P. How can casing deformation be prevented during hydraulic fracturing of shale gas?—A case study of the Weiyuan area in Sichuan, China. J. Pet. Sci. Eng. 2023, 221, 111251. [Google Scholar] [CrossRef]
- Mou, Y.; Yang, S.; Han, L.; Wang, J.; Lian, Z. Mechanical Behavior and Optimization of Tubing String with Expansion Joint during Fracturing in HTUHP Wells. Processes 2022, 10, 1063. [Google Scholar] [CrossRef]
- Mou, Y.; Cui, J.; Wu, J.; Wei, F.; Tian, M.; Han, L. The Mechanism of Casing Deformation before Hydraulic Fracturing and Mitigation Measures in Shale Gas Horizontal Wells. Processes 2022, 10, 2612. [Google Scholar] [CrossRef]
Figure 1.
Wellbore configuration of LS1 well and its introduction of cement bond logging results.
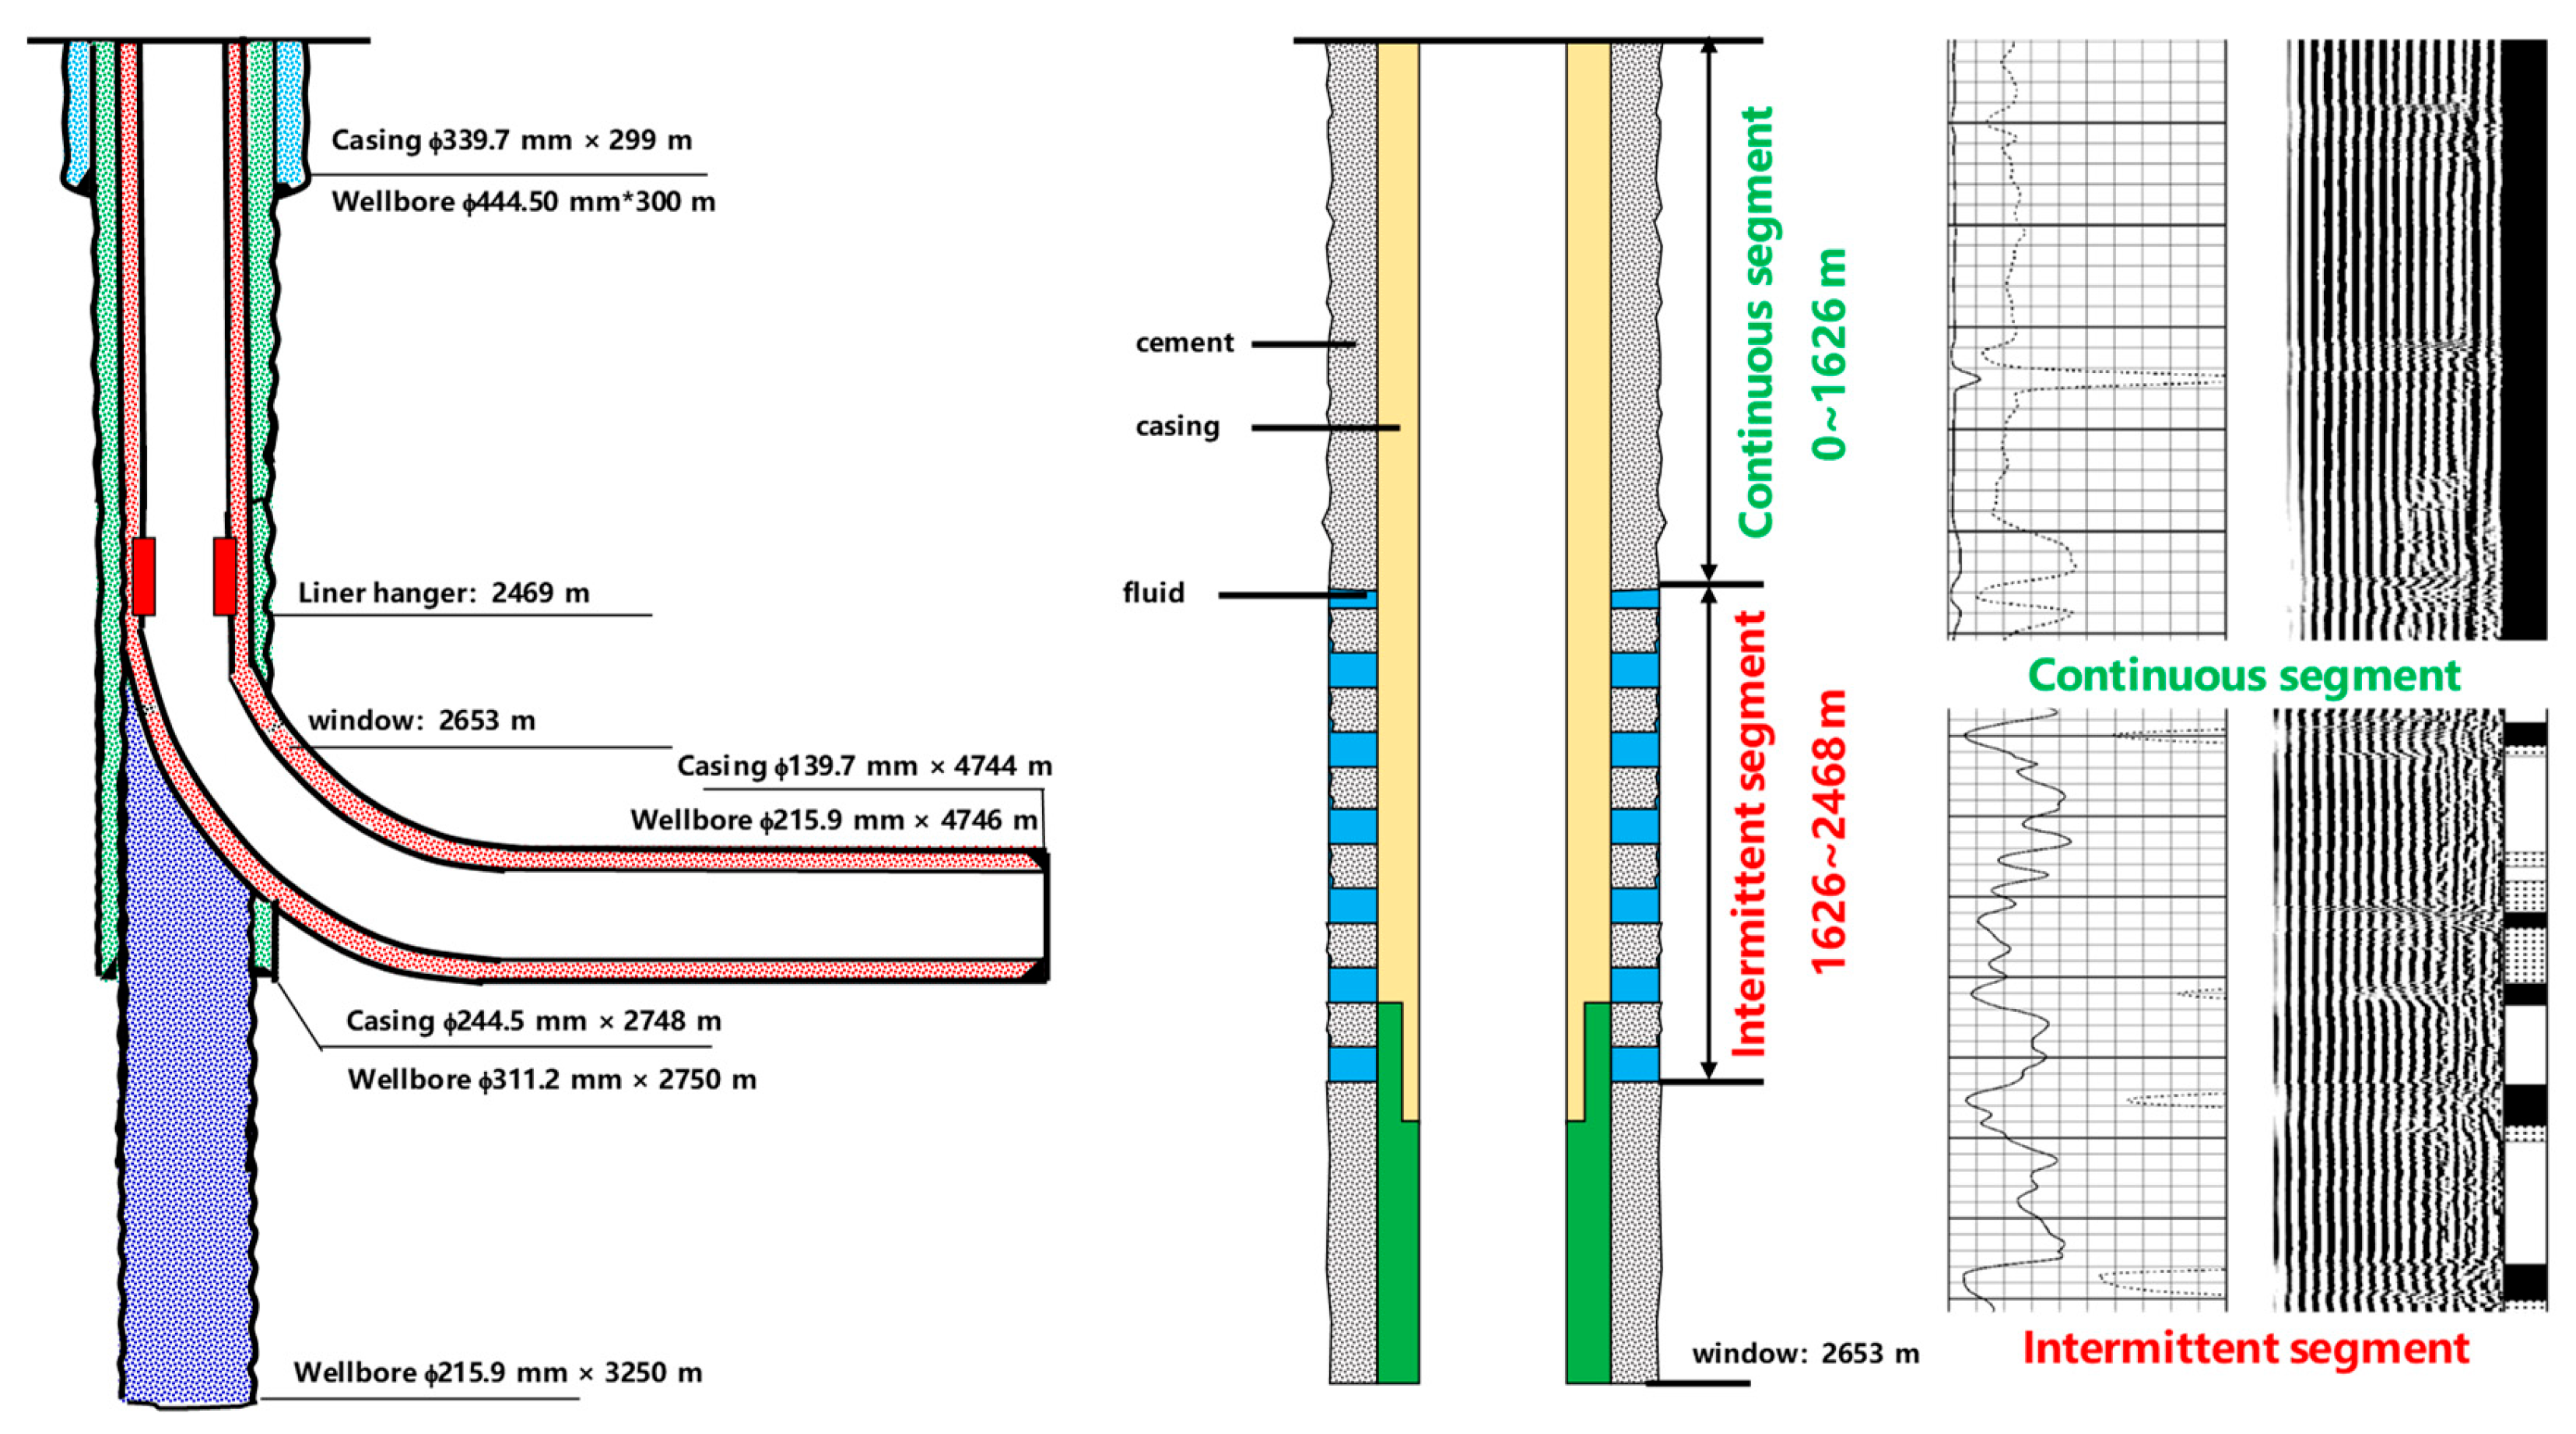
Figure 2.
The 24 arm logging results of producing casing inner diameter between measure depth 2463–2464.8 m.
Figure 2.
The 24 arm logging results of producing casing inner diameter between measure depth 2463–2464.8 m.
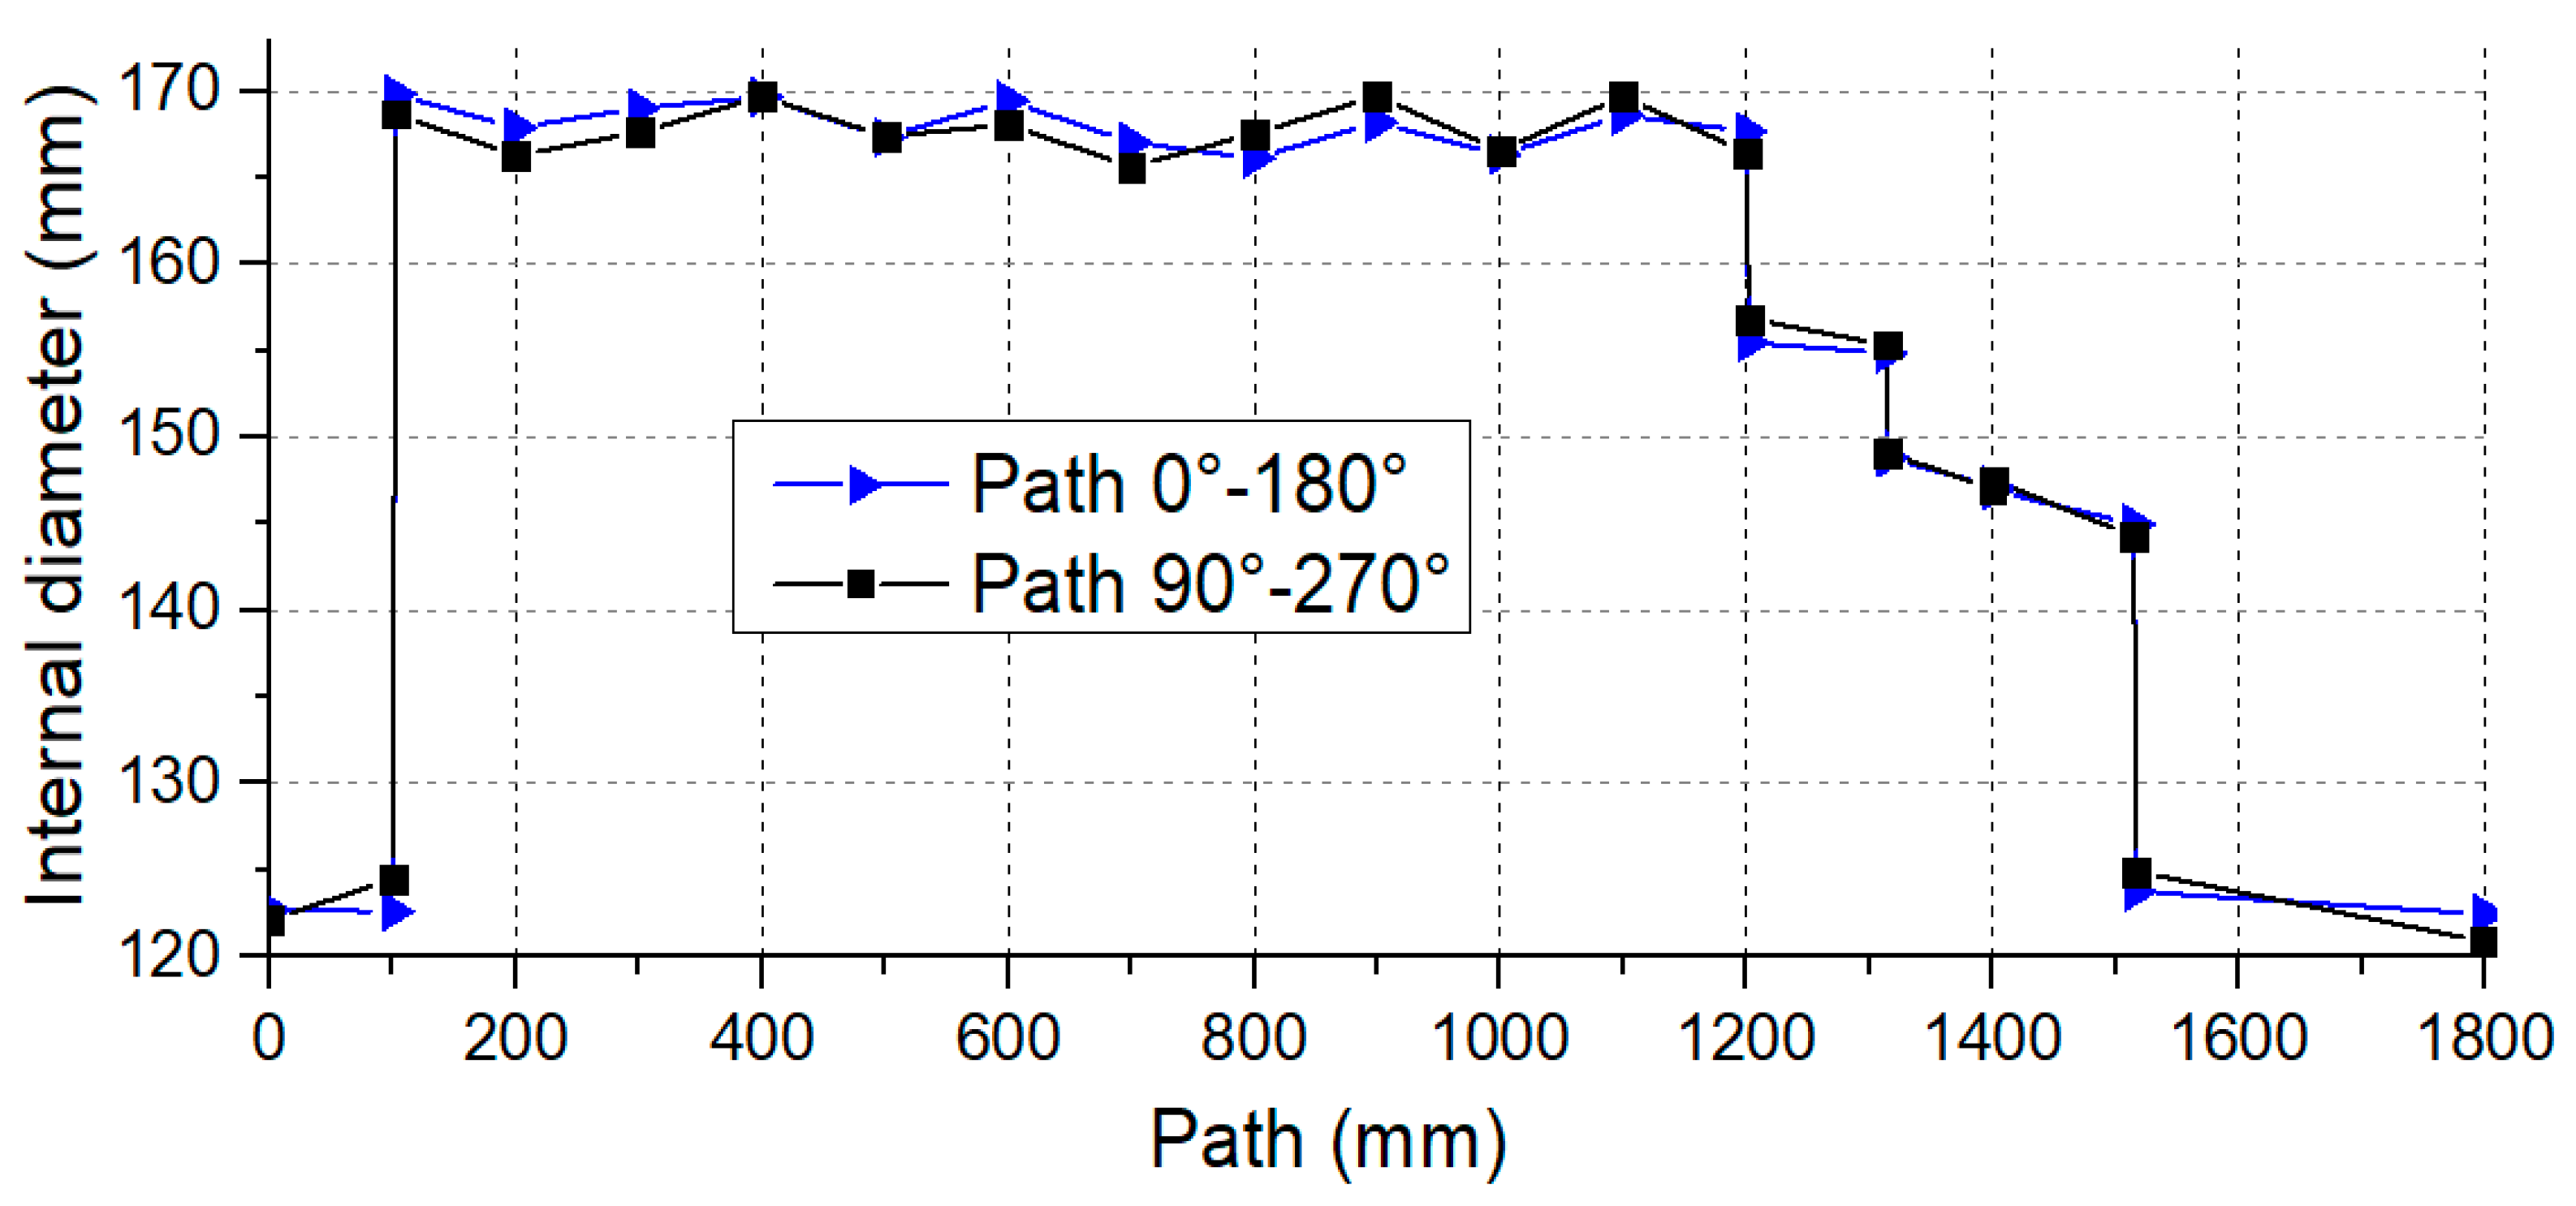
Figure 3.
Optical micrographs revealing the typical microstructures of the base material: (a) region 1, (b) region 2.
Figure 3.
Optical micrographs revealing the typical microstructures of the base material: (a) region 1, (b) region 2.

Figure 4.
Schematic of the specimens used for different tests in this study: (a) tensile test, (b) impact test.
Figure 4.
Schematic of the specimens used for different tests in this study: (a) tensile test, (b) impact test.

Figure 5.
Stress–strain curves of the P110 alloy steel under different temperatures: (a) 20 °C, (b) 80 °C.
Figure 5.
Stress–strain curves of the P110 alloy steel under different temperatures: (a) 20 °C, (b) 80 °C.
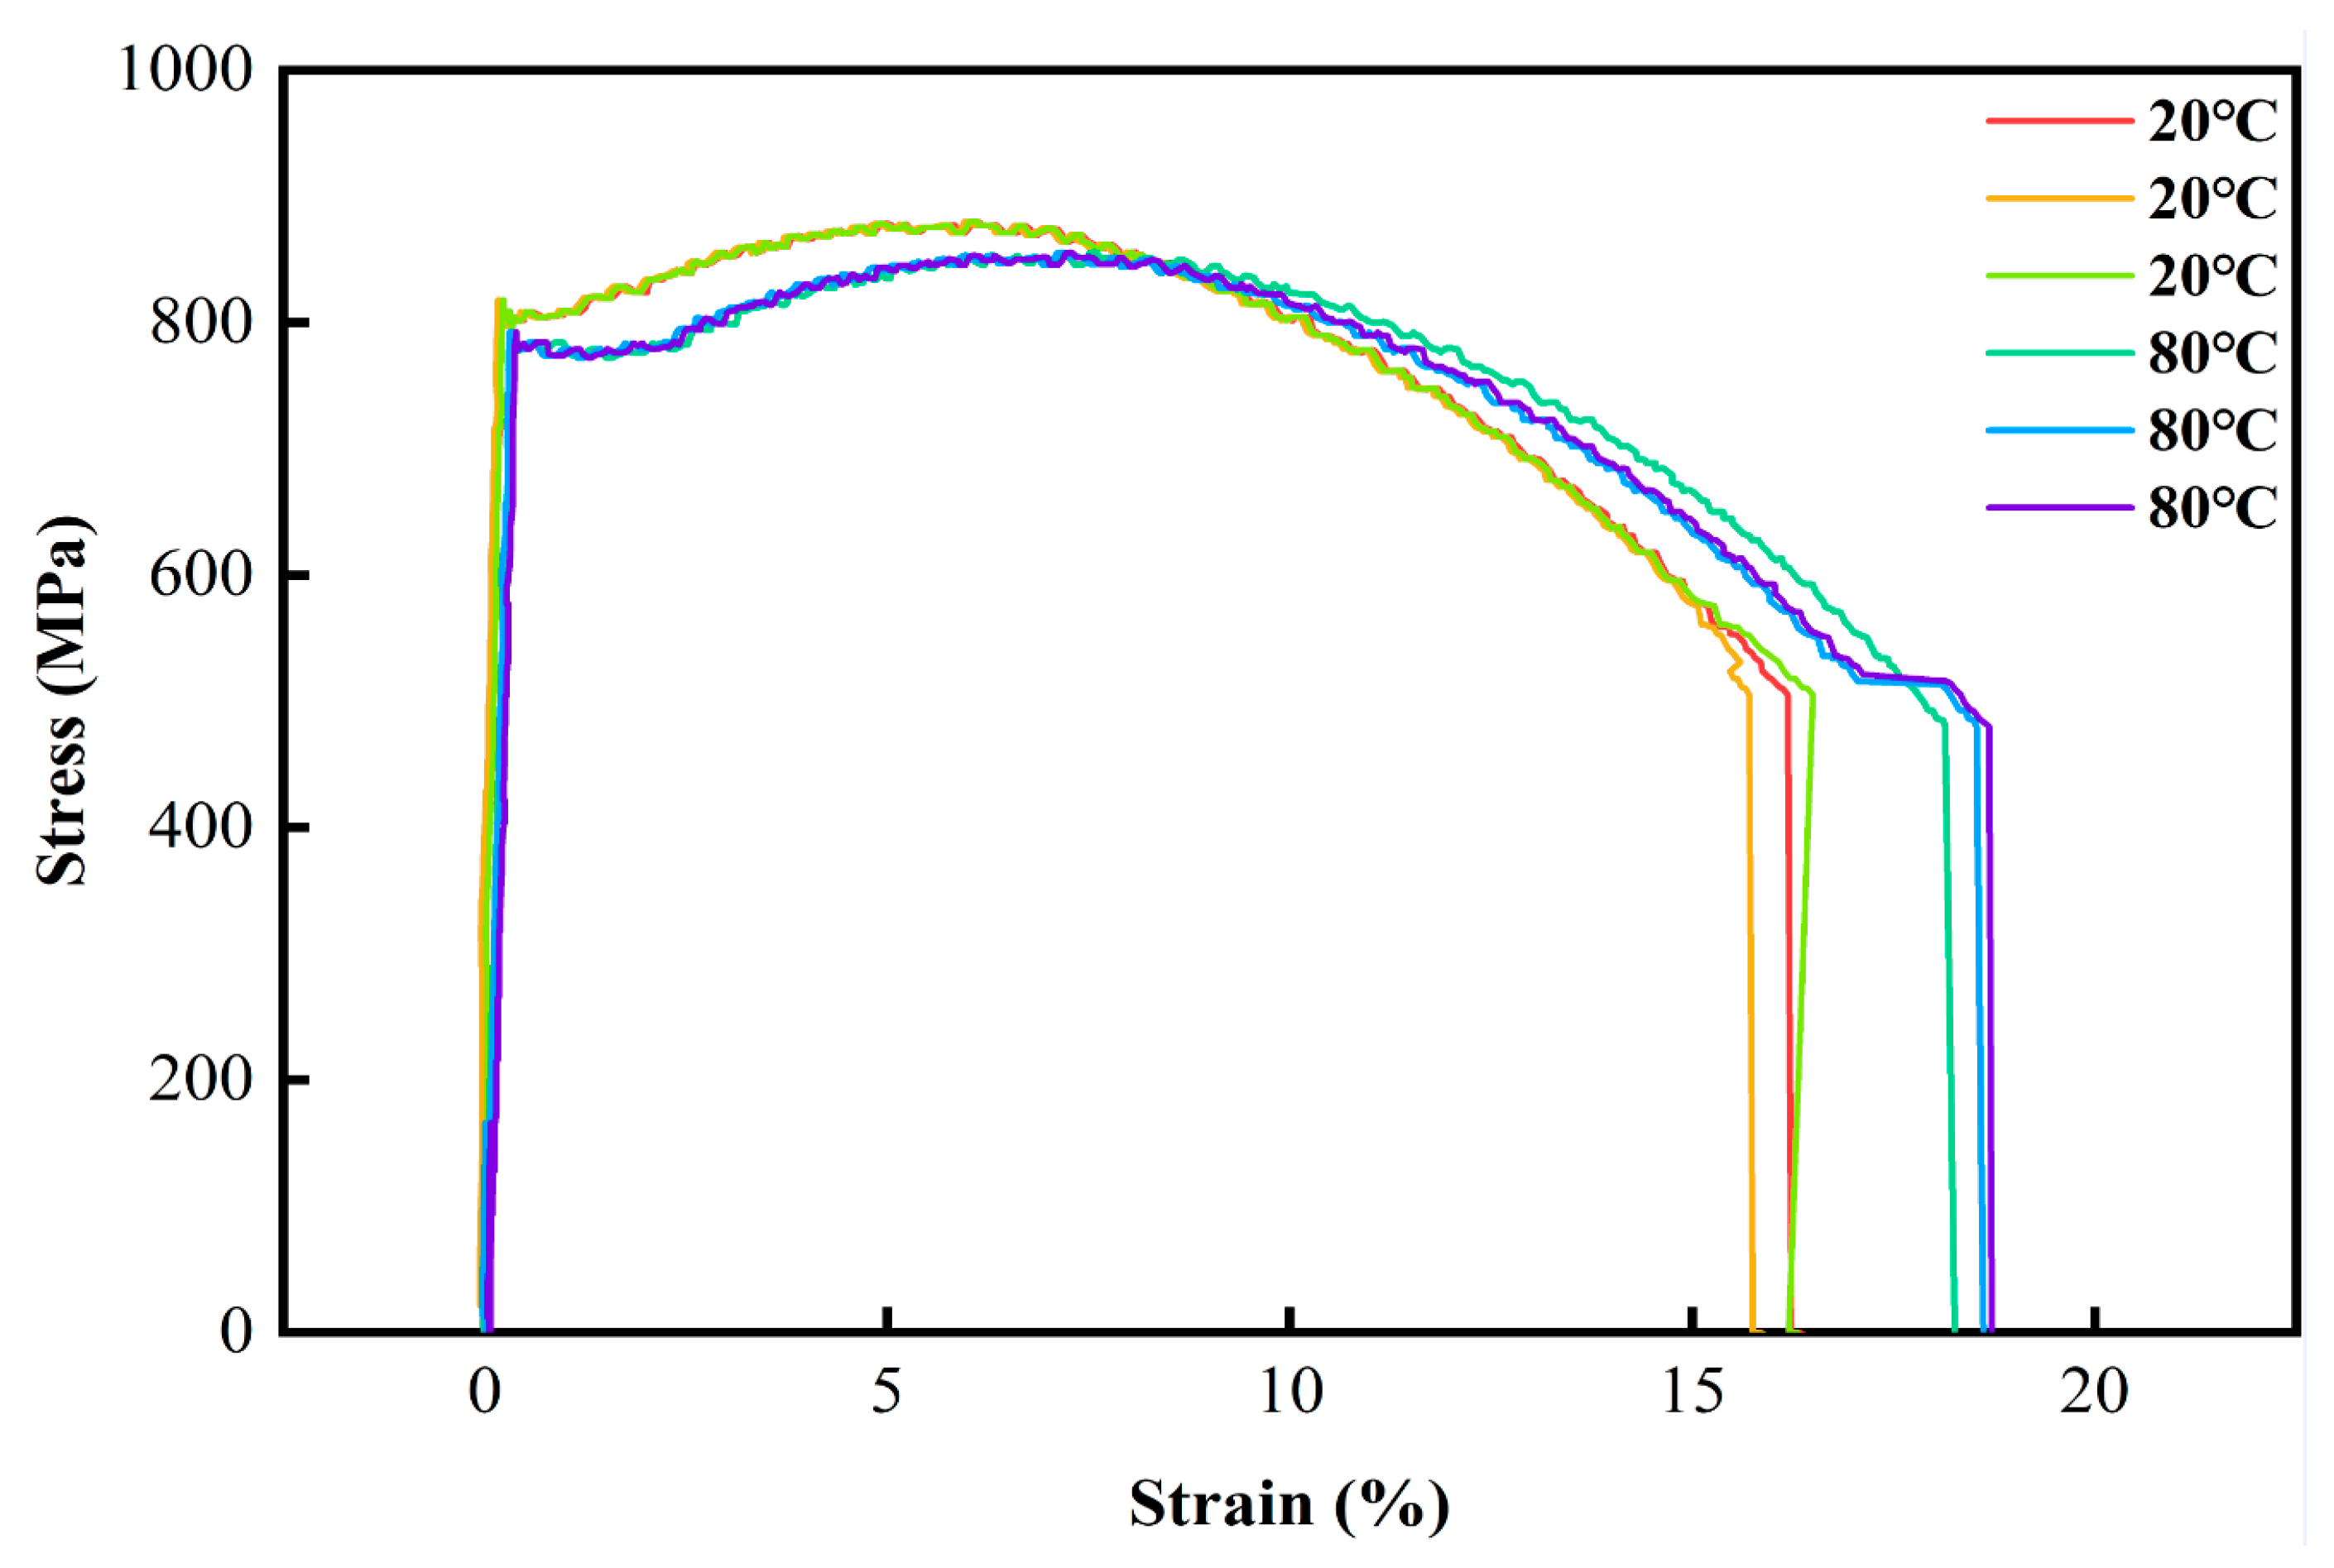
Figure 6.
Load/energy versus displacement curves of P110 alloy steel.

Figure 7.
Physical photograph: (a) wellbore integrity combined load system, (b) casing–cement specimen.
Figure 7.
Physical photograph: (a) wellbore integrity combined load system, (b) casing–cement specimen.

Figure 8.
The production process and loading process of the casing–cement ring specimen: (a) pipe preparation, (b) cement placement, (c) push force, (d) cementation failure.
Figure 8.
The production process and loading process of the casing–cement ring specimen: (a) pipe preparation, (b) cement placement, (c) push force, (d) cementation failure.

Figure 9.
Test results of casing–cement ring cementation: (a) load from push force vs. dam–board displacement (0.5 m cement length specimen), (b) cohesive force of casing–cement vs. cement length.
Figure 9.
Test results of casing–cement ring cementation: (a) load from push force vs. dam–board displacement (0.5 m cement length specimen), (b) cohesive force of casing–cement vs. cement length.
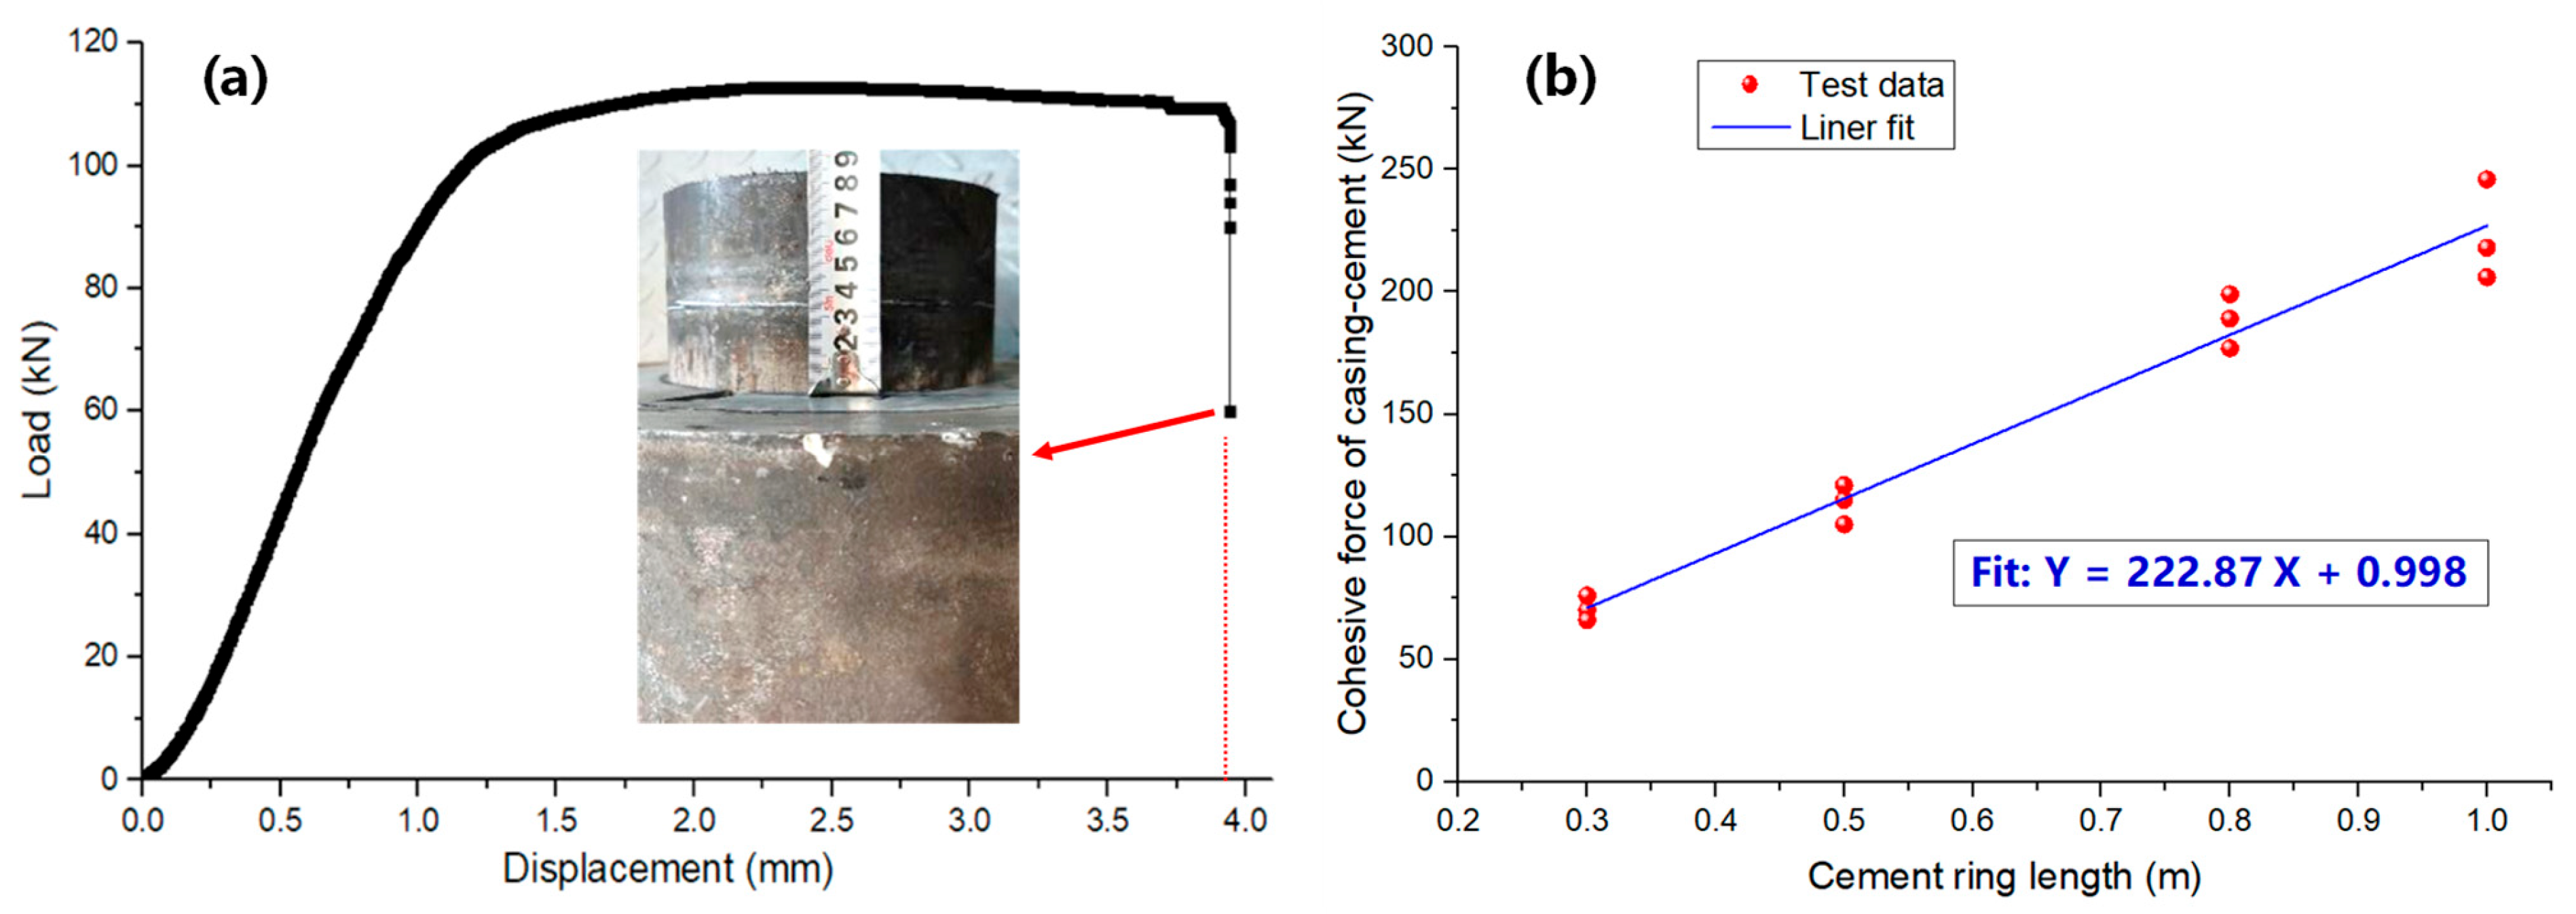
Figure 10.
The comparison between experimental data and FE results.
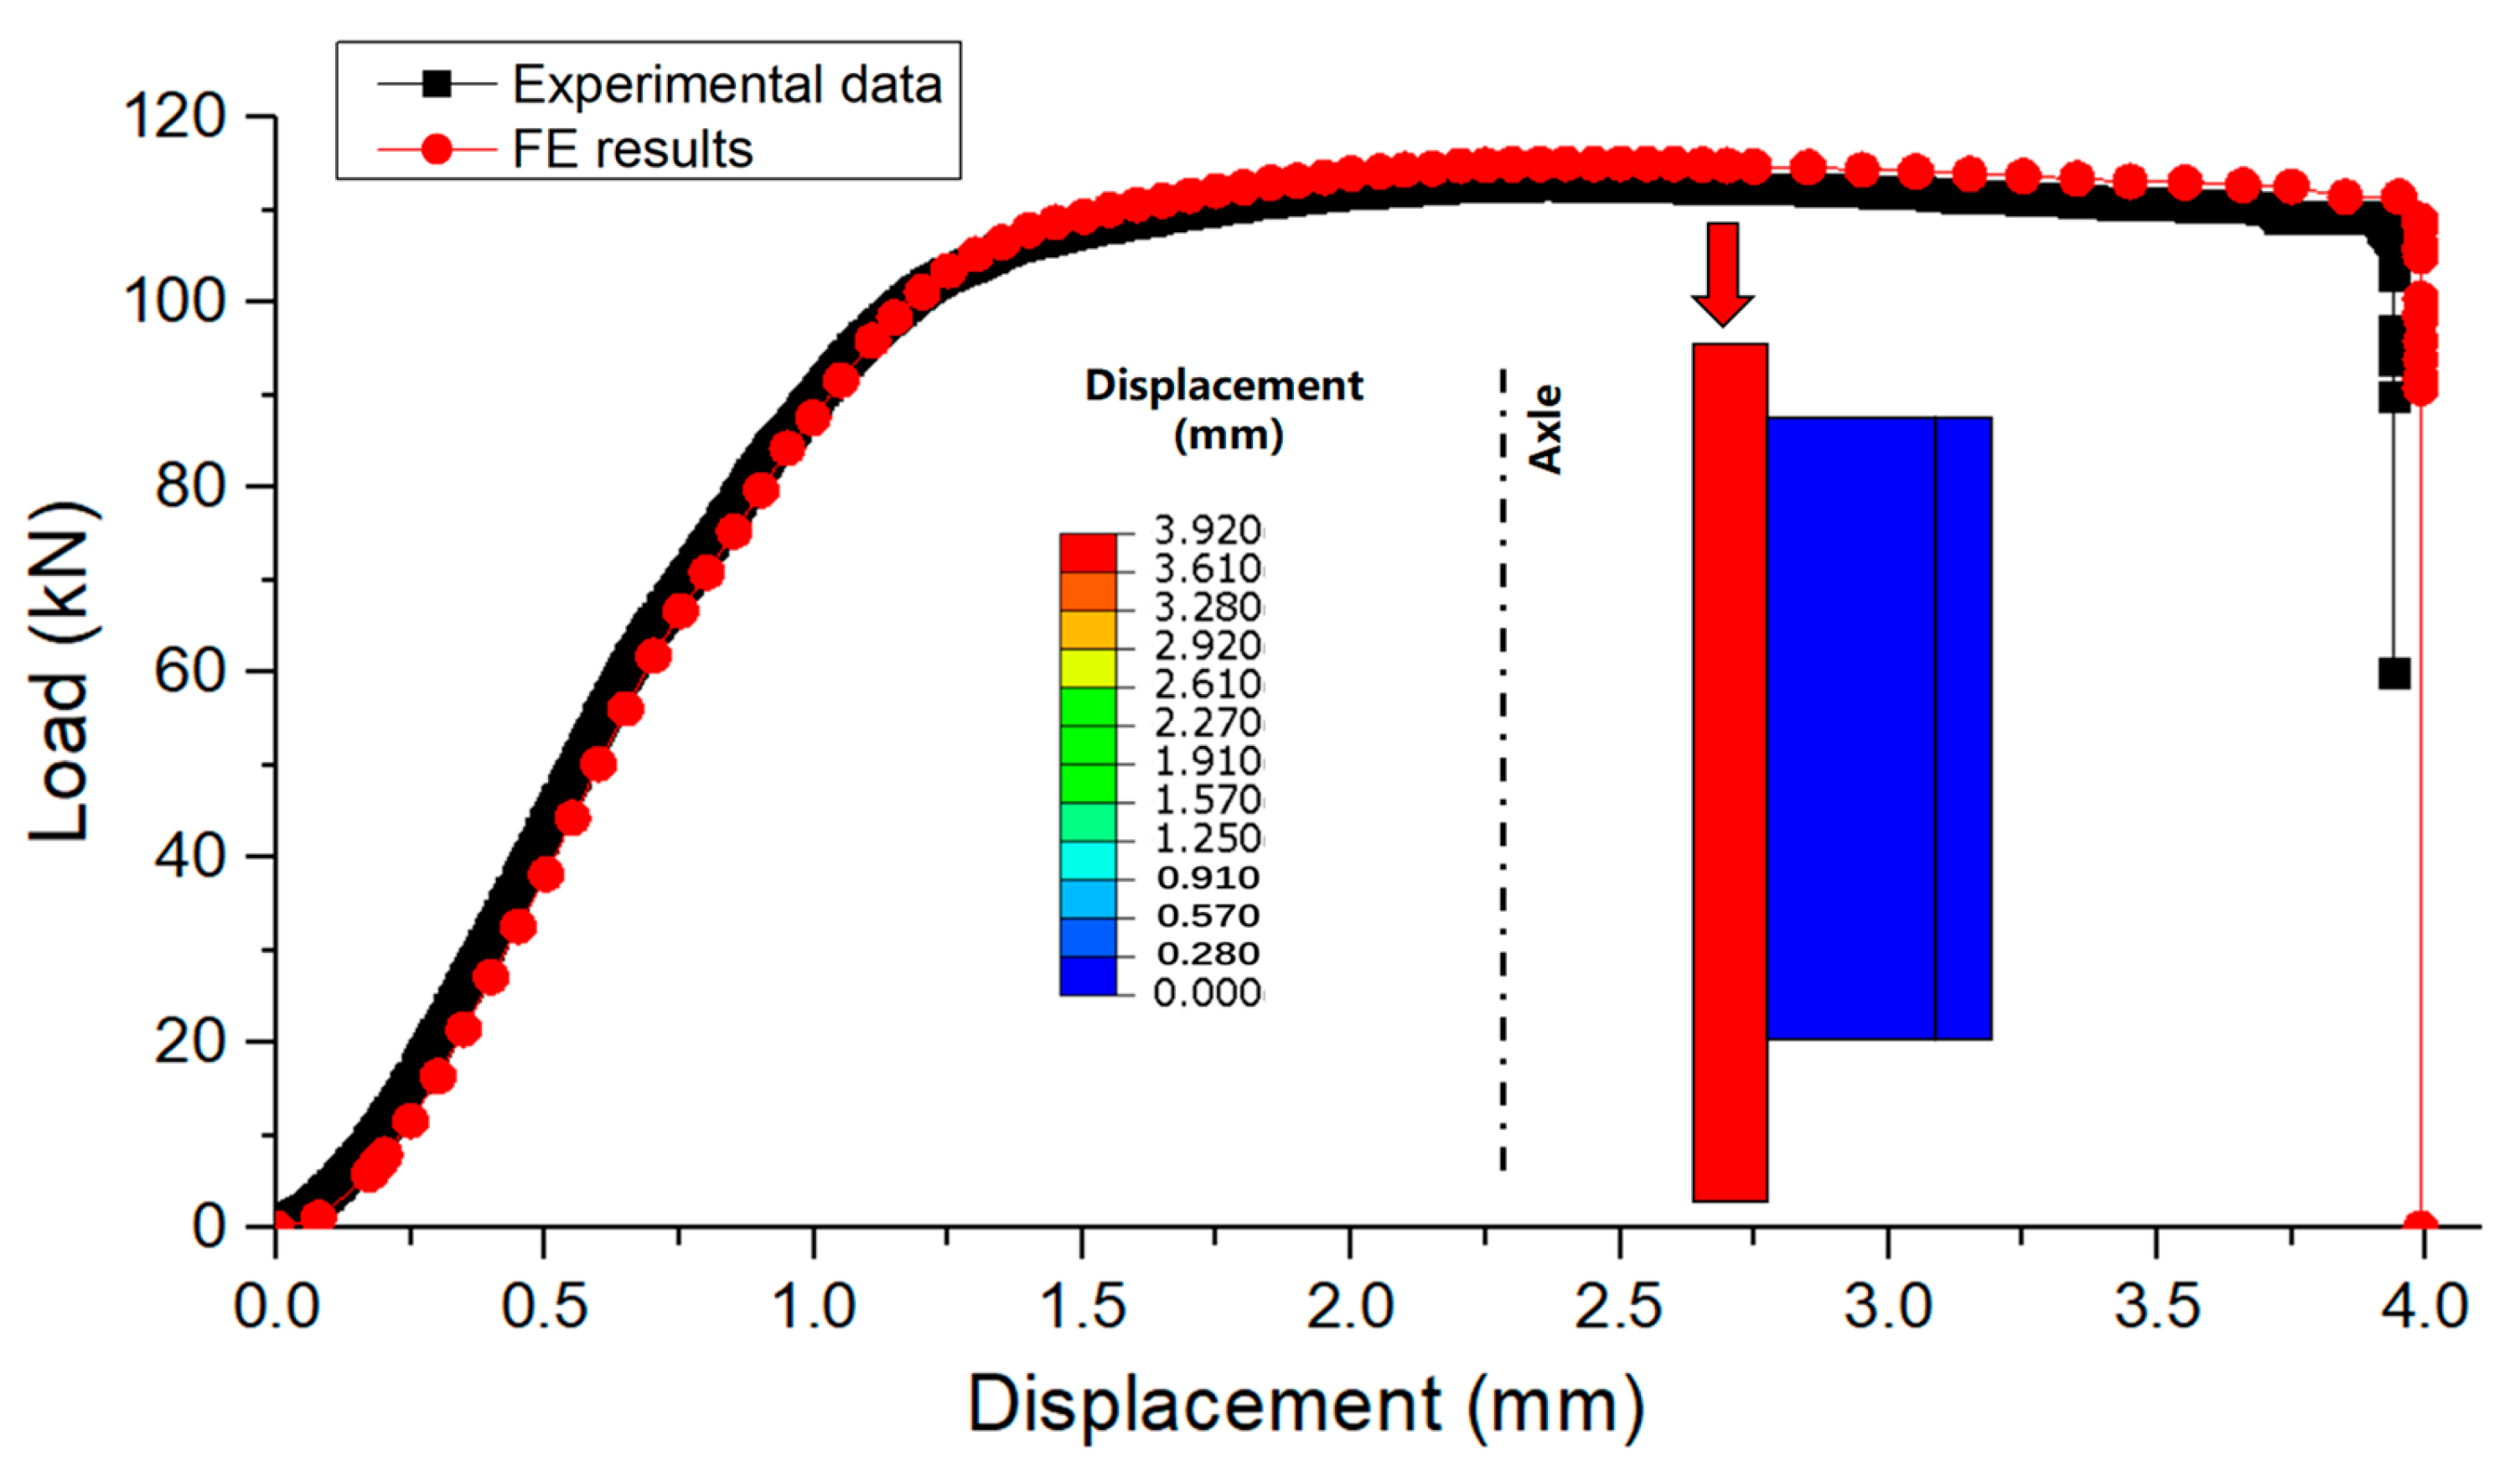
Figure 11.
The physical model of fracturing fluid and heat transfer in the shale borehole.
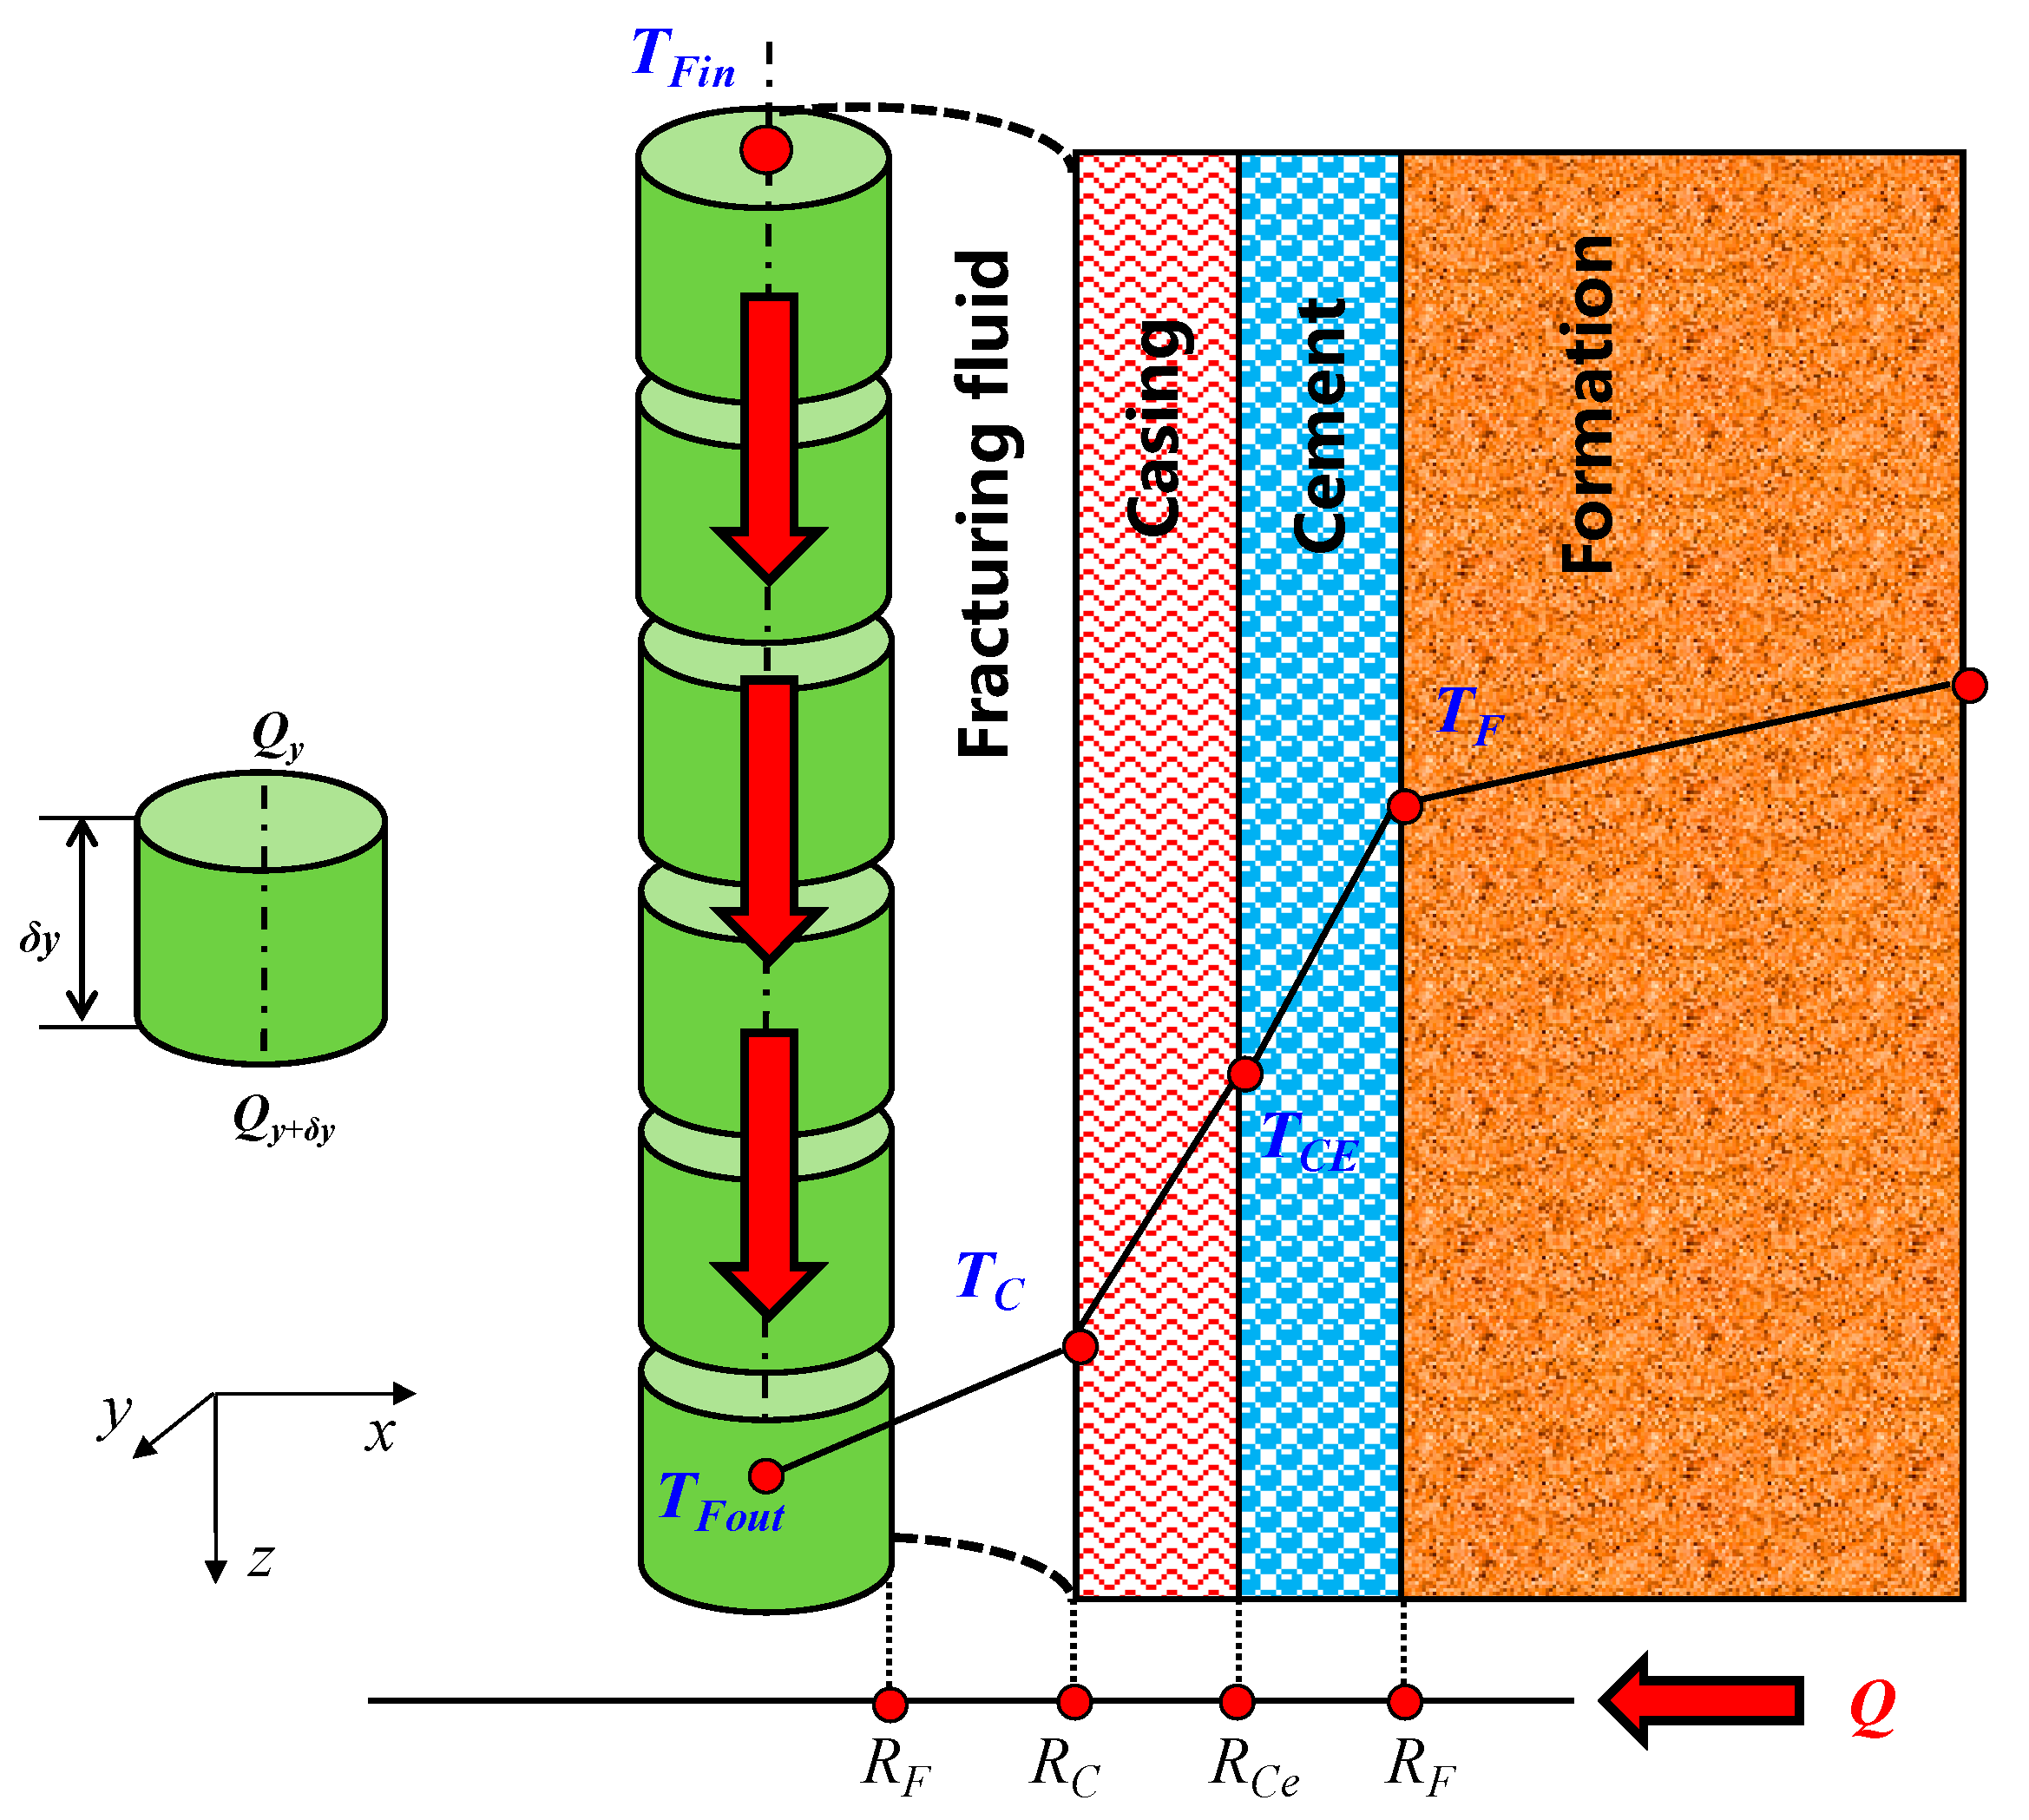
Figure 12.
The temperature and internal pressure of production casing under different stage fracturing conditions.
Figure 12.
The temperature and internal pressure of production casing under different stage fracturing conditions.
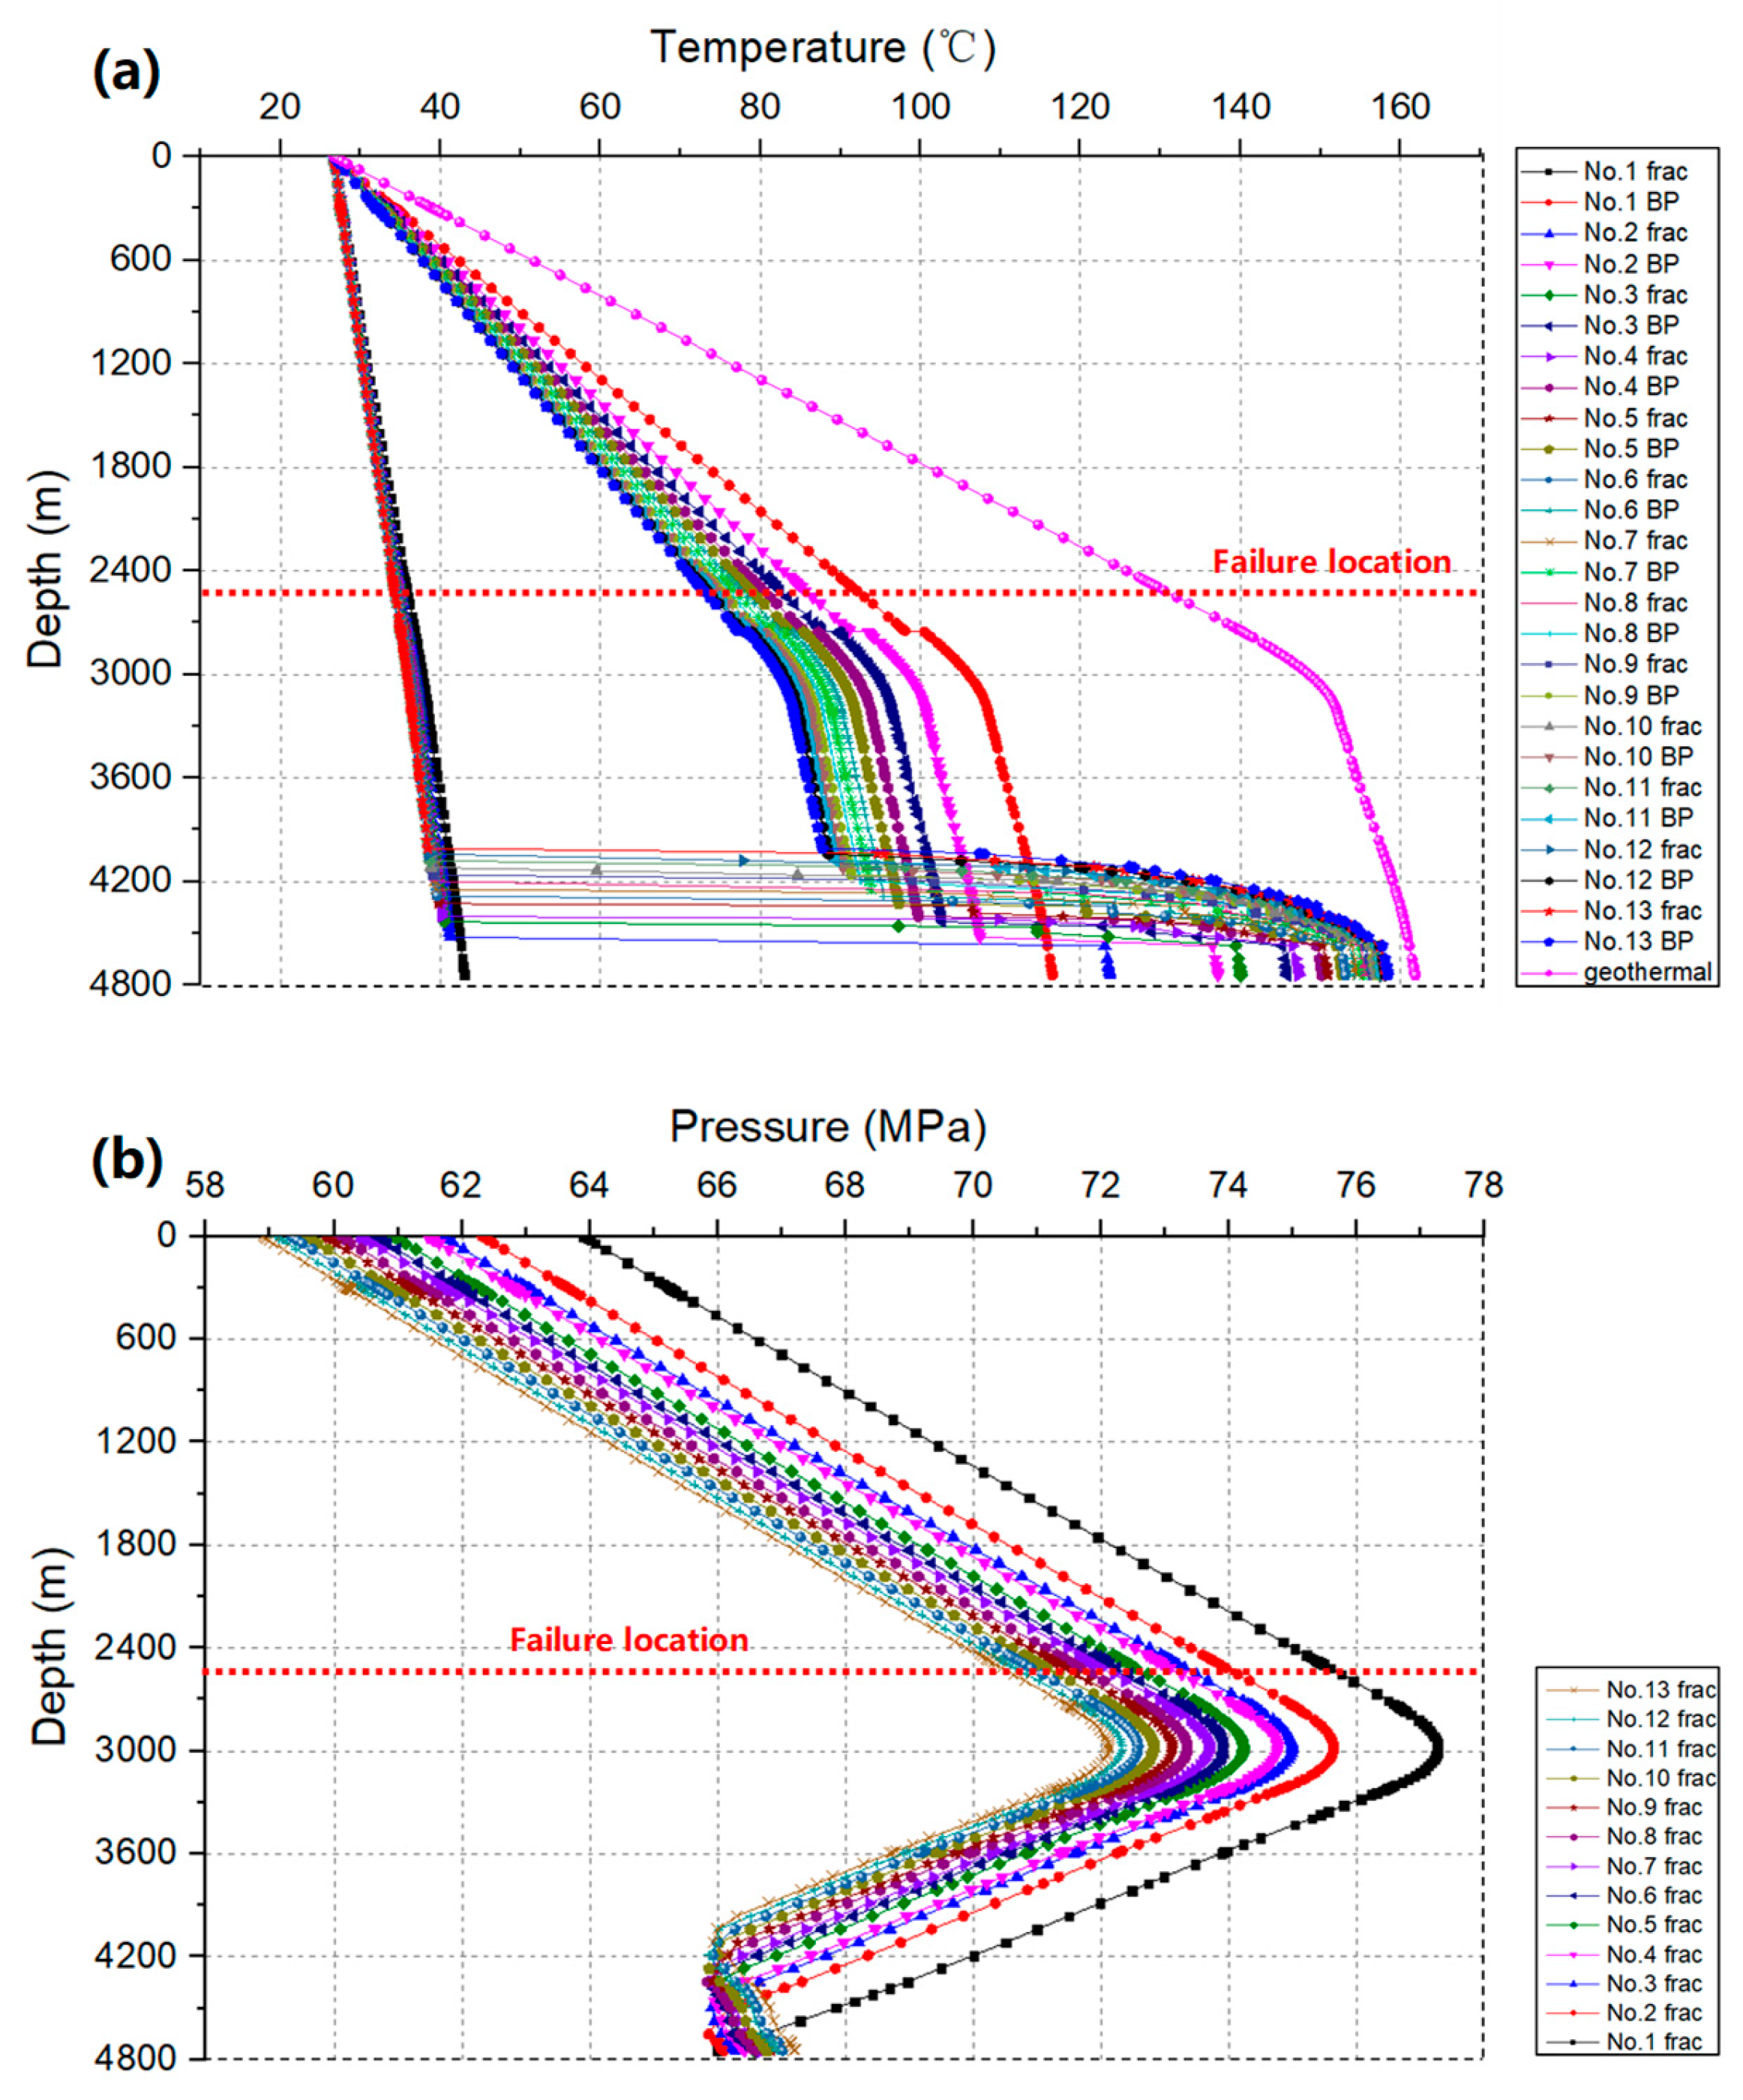
Figure 13.
The service load changes at the casing deformation position (measure depth 2464 m): (a) casing temperature, (b) internal pressure.
Figure 13.
The service load changes at the casing deformation position (measure depth 2464 m): (a) casing temperature, (b) internal pressure.
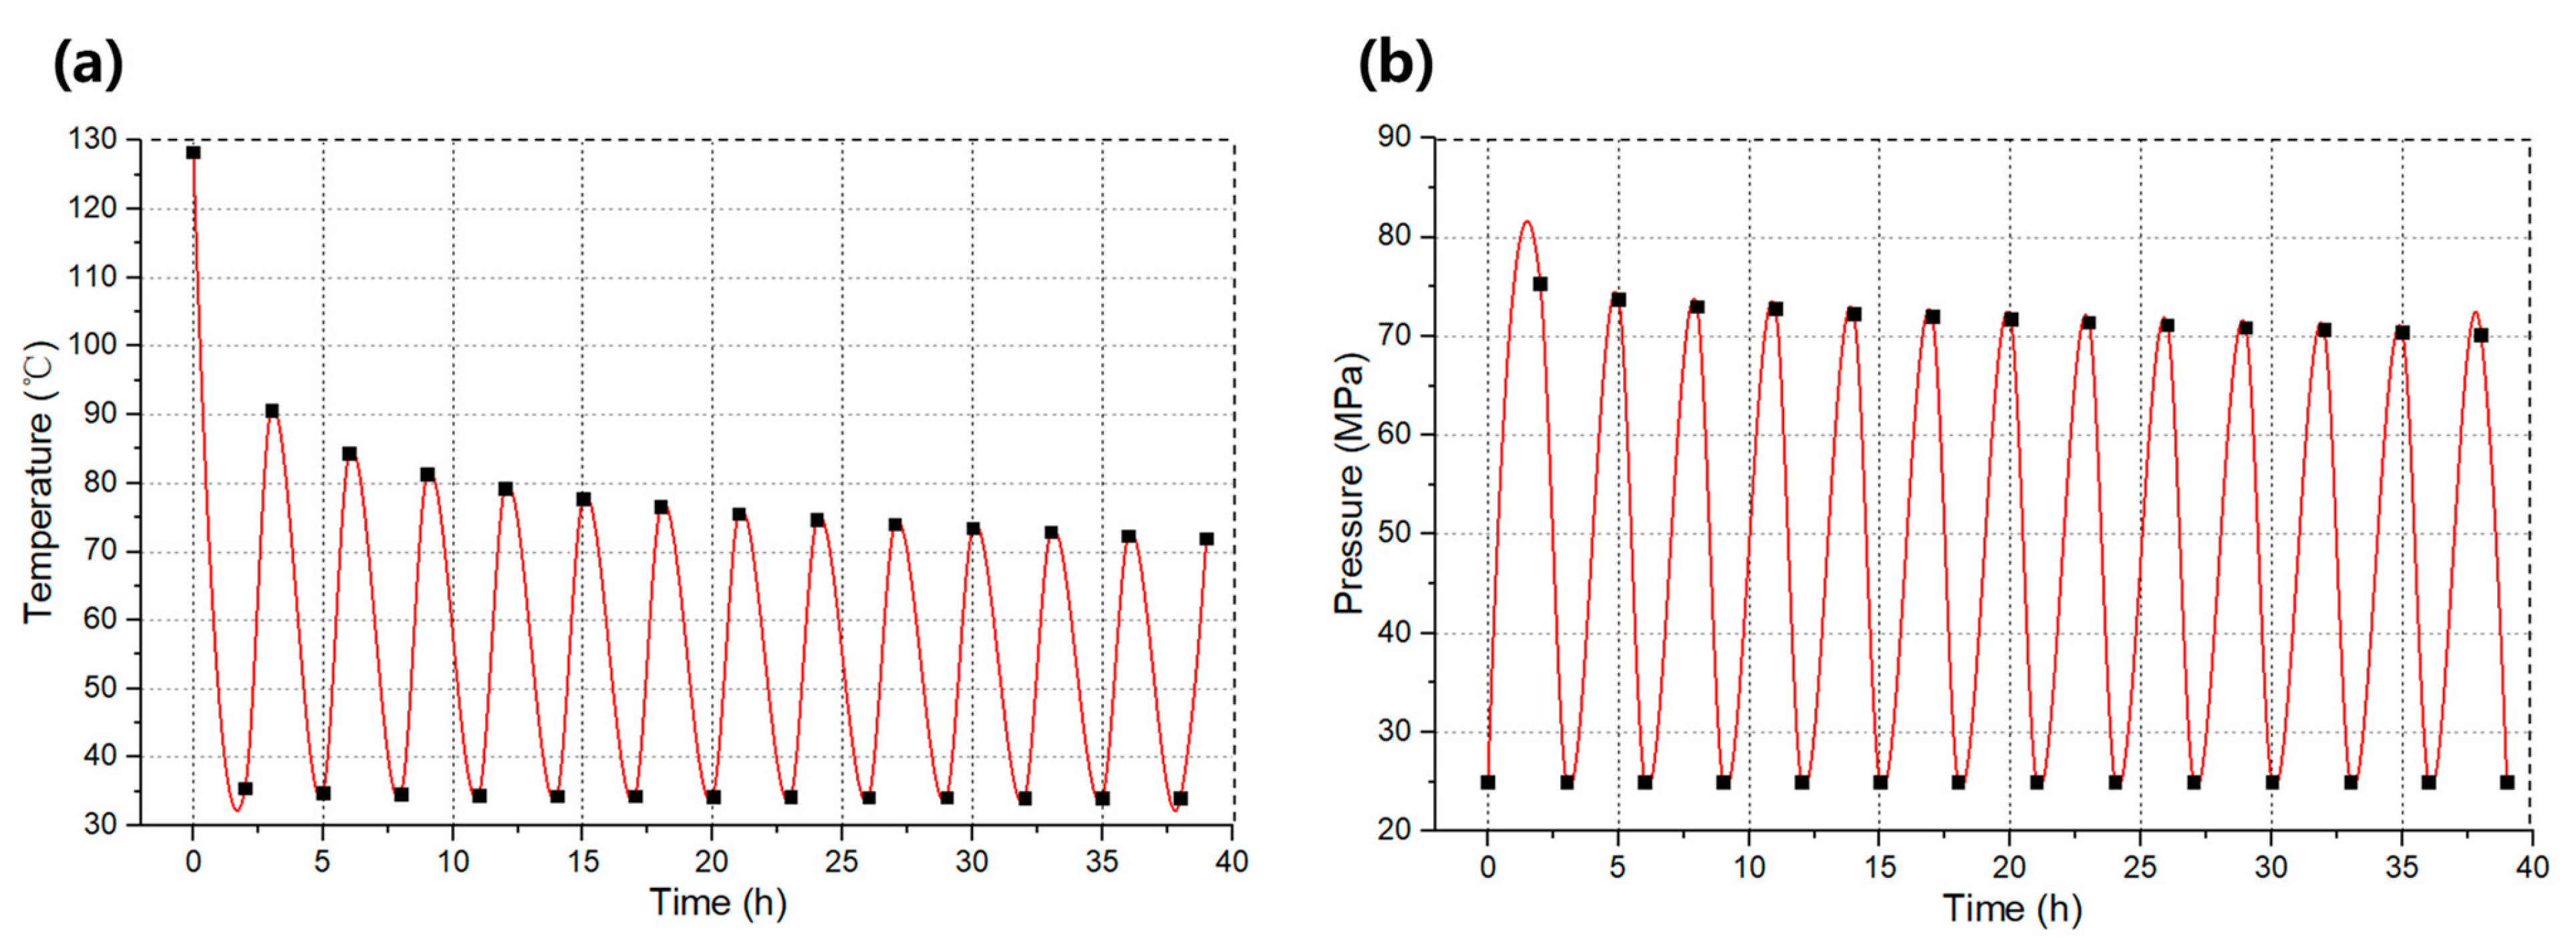
Figure 14.
The coupling FE model of tieback–liner–cement ring–rock formation in in vertical section LS1 well.
Figure 14.
The coupling FE model of tieback–liner–cement ring–rock formation in in vertical section LS1 well.

Figure 15.
The change of axial force of tieback during multistage fracturing: (a) vs. measure depth, (b) vs. time.
Figure 15.
The change of axial force of tieback during multistage fracturing: (a) vs. measure depth, (b) vs. time.

Figure 16.
Casing axial force (well depth 2464 m) and cementation damage of casing–cement interface (well depth 2455.8–2464 m) vs. time.
Figure 16.
Casing axial force (well depth 2464 m) and cementation damage of casing–cement interface (well depth 2455.8–2464 m) vs. time.
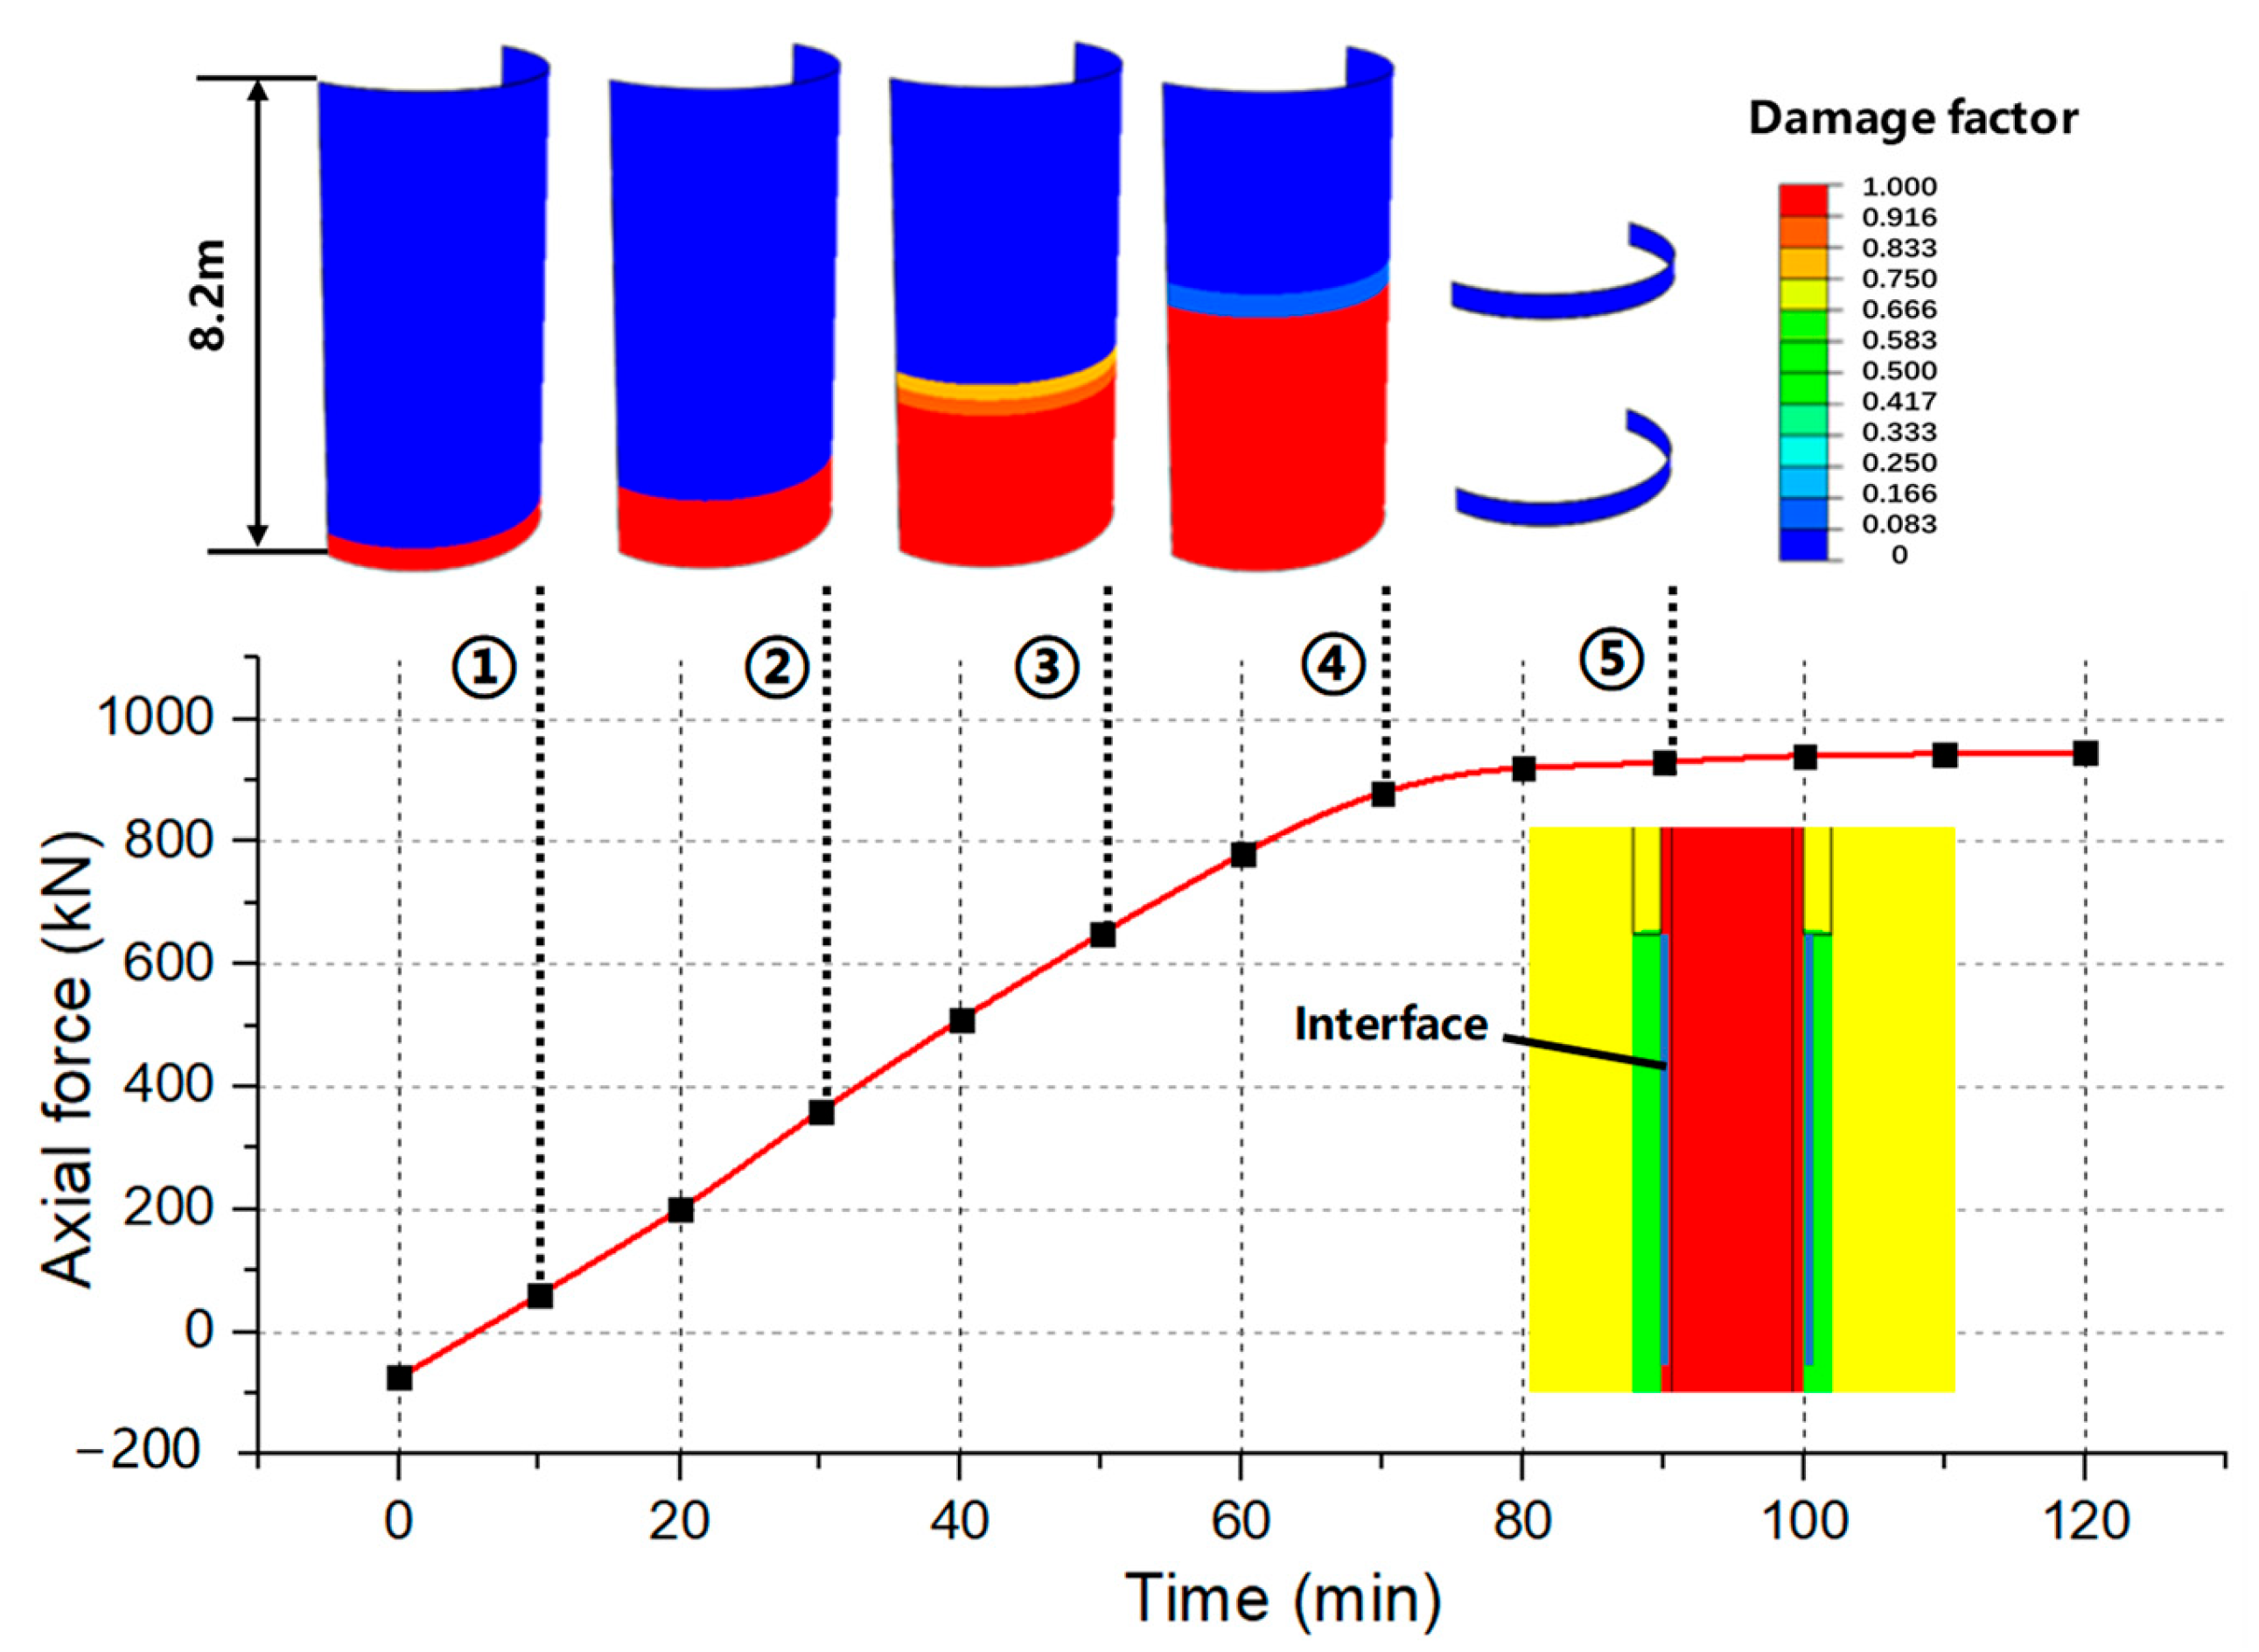
Figure 17.
Free deformation section of casing vs. fracturing stage under alternating conditions of temperature and pressure.
Figure 17.
Free deformation section of casing vs. fracturing stage under alternating conditions of temperature and pressure.

Figure 18.
Comparative analysis of logging results of casing inner diameter (0–180° high position and 90–270° right position) and FE results.
Figure 18.
Comparative analysis of logging results of casing inner diameter (0–180° high position and 90–270° right position) and FE results.


Table 1.
Parameters of casing string in LS1 well.
| Type | Depth (m) | OD (mm) | Thickness (mm) | Steel Grade (ksi) | Thread Type | |
|---|---|---|---|---|---|---|
| Surface casing | 0–299 | 339.7 | 9.65 | J55 | BC | |
| Intermediate casing | 0–2748 | 244.5 | 11.99 | P110 | BC | |
| Production casing | Tieback | 0–2469 | 139.7 | 10.54 | P110 | TS1 |
| Liner | 2469–4744 | 139.7 | 10.54 | P110 | TS1 | |
Table 2.
Static thermal parameters of various materials in wellbore.
| Property | At 20 °C Average ± Standard Deviation (n = 3) | At 80 °C Average ± Standard Deviation (n = 3) |
|---|---|---|
| Yield strength Rp0.2 (MPa) | 786.54 ± 2.05 | 746.49 ± 2.12 |
| Tensile strength (MPa) | 901.25 ± 2.15 | 867.46 ± 3.16 |
| Young’s modulus (GPa) | 208 ± 0.0001 | 206 ± 0.0001 |
| Elongation δ (%) | 15.67 ± 1.42 | 18.48 ± 1.09 |
Table 3.
Dynamic mechanical properties obtained from Charpy impact tests.
| Property | Average ± Standard Deviation (n = 3) |
|---|---|
| Impact energy (J) | 75.57 ± 3.51 |
| Crack initiation energy (J) | 21.32 ± 2.15 |
| Crack propagation energy (J) | 54.26 ± 3.85 |
| Total displacement (mm) | 25.95 ± 3.47 |
| Maximum load (kN) | 9.54 ± 2.84 |
Table 4.
Static thermal parameters of various materials in wellbore.
| Material | Density (kg/m3) | Specific Heat (J/kg/°C) | Thermal Conductivity (J/m/°C) | Coefficient of Expansion |
|---|---|---|---|---|
| Fracturing fluid | 1200 | 4178 | 0.84 | / |
| Casing/tieback/liner | 7849 | 460 | 51.9 | 1.25 × 10⁻⁵ |
| Cement | 3000 | 840 | 2.1 | 3.68 × 10⁻⁴ |
| Rock | 2650 | 765 | 2.5 | 6.85 × 10⁻⁴ |
Disclaimer/Publisher’s Note: The statements, opinions and data contained in all publications are solely those of the individual author(s) and contributor(s) and not of MDPI and/or the editor(s). MDPI and/or the editor(s) disclaim responsibility for any injury to people or property resulting from any ideas, methods, instructions or products referred to in the content. |
© 2023 by the authors. Licensee MDPI, Basel, Switzerland. This article is an open access article distributed under the terms and conditions of the Creative Commons Attribution (CC BY) license (https://creativecommons.org/licenses/by/4.0/).
Share and Cite
MDPI and ACS Style
Mou, Y.; Zhao, H.; Cui, J.; Wang, Z.; Wei, F.; Han, L. Failure Analysis of Casing in Shale Oil Wells under Multistage Fracturing Conditions. Processes 2023, 11, 2250. https://doi.org/10.3390/pr11082250
AMA Style
Mou Y, Zhao H, Cui J, Wang Z, Wei F, Han L. Failure Analysis of Casing in Shale Oil Wells under Multistage Fracturing Conditions. Processes. 2023; 11(8):2250. https://doi.org/10.3390/pr11082250
Chicago/Turabian StyleMou, Yisheng, Han Zhao, Jian Cui, Zhe Wang, Fengqi Wei, and Lihong Han. 2023. "Failure Analysis of Casing in Shale Oil Wells under Multistage Fracturing Conditions" Processes 11, no. 8: 2250. https://doi.org/10.3390/pr11082250
Note that from the first issue of 2016, this journal uses article numbers instead of page numbers. See further details here.