

Paleoenvironmental Conditions and Shale Oil Potential of the Carboniferous Ha’erjiawu Formation in the Santanghu Basin, NW China
 , ,
, ,
Abstract
:1. Introduction
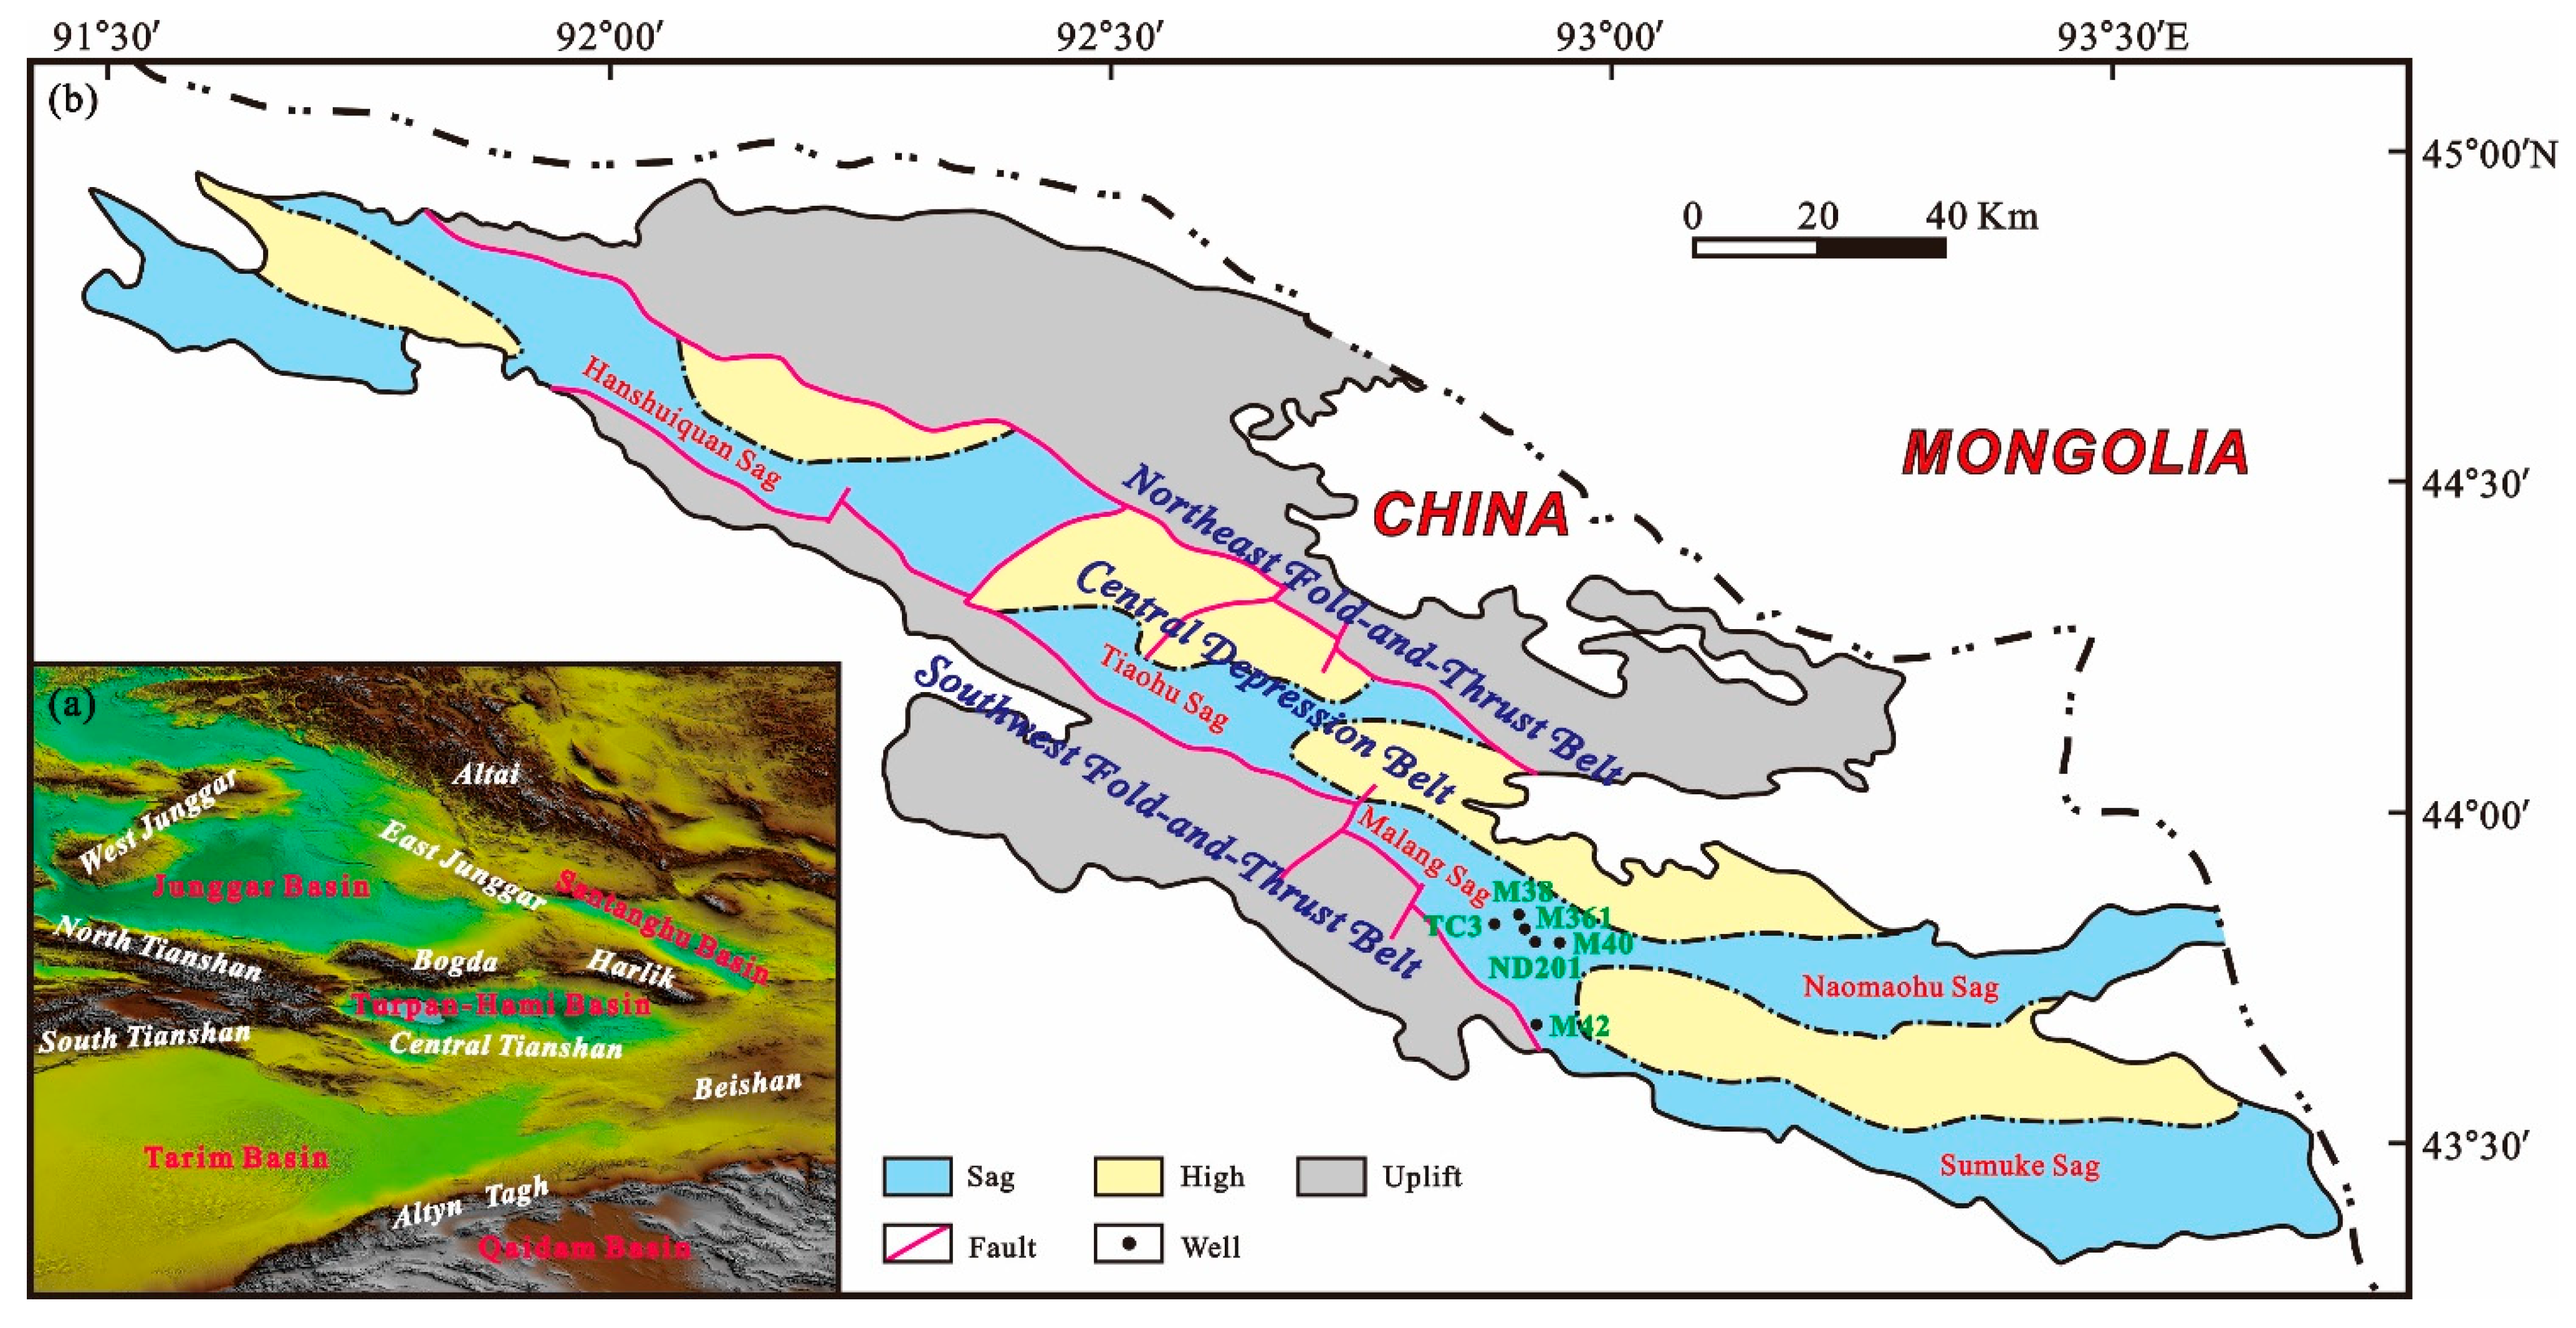
2. Geological Setting
3. Samples and Analytical Methods
3.1. Samples
3.2. Analytical Methods
4. Results
4.1. Elemental Geochemistry
4.2. Bulk Organic Geochemical Parameters
5. Discussion
5.1. Paleoenvironmental Conditions
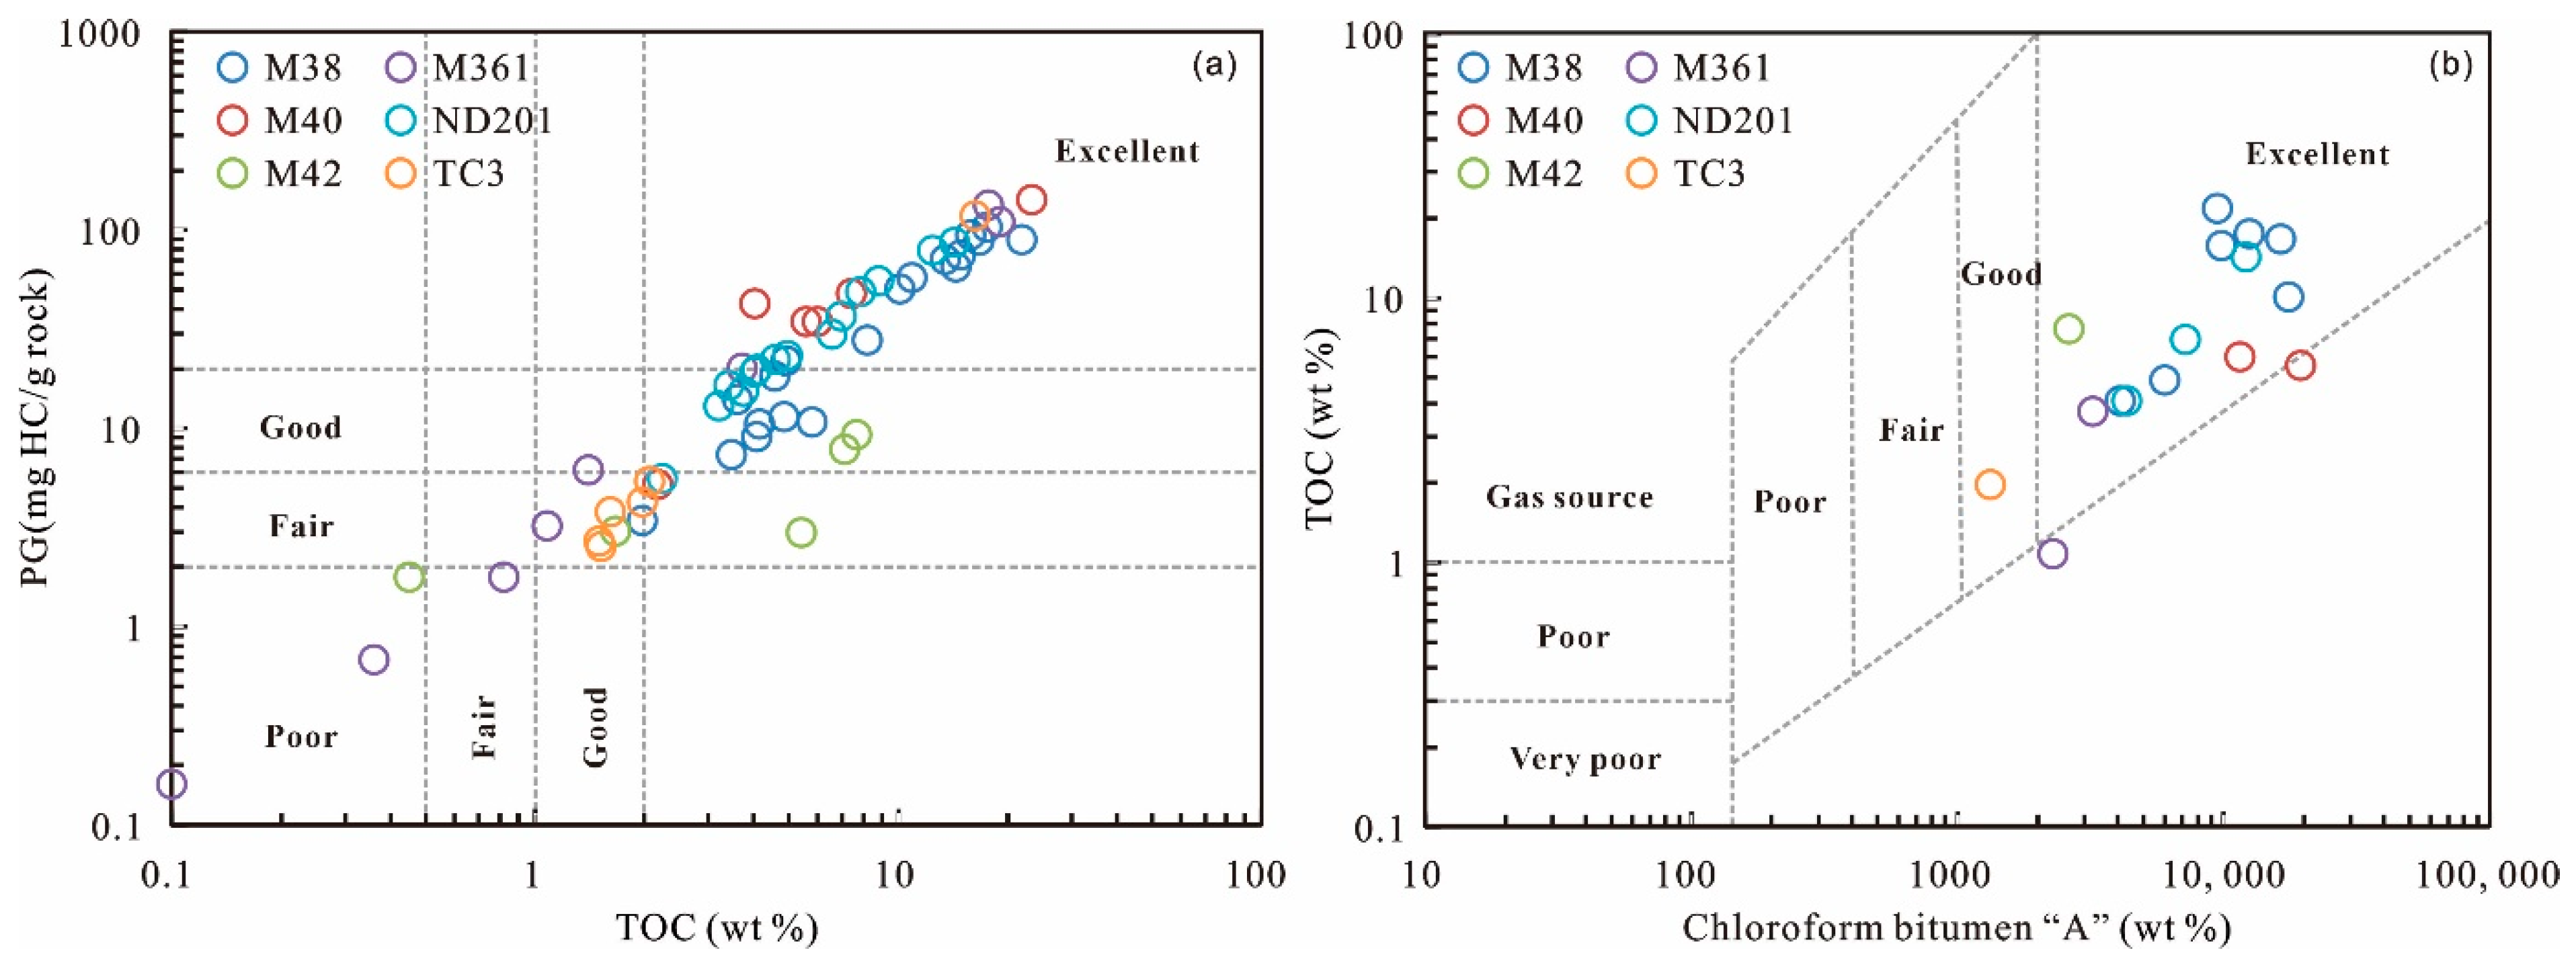
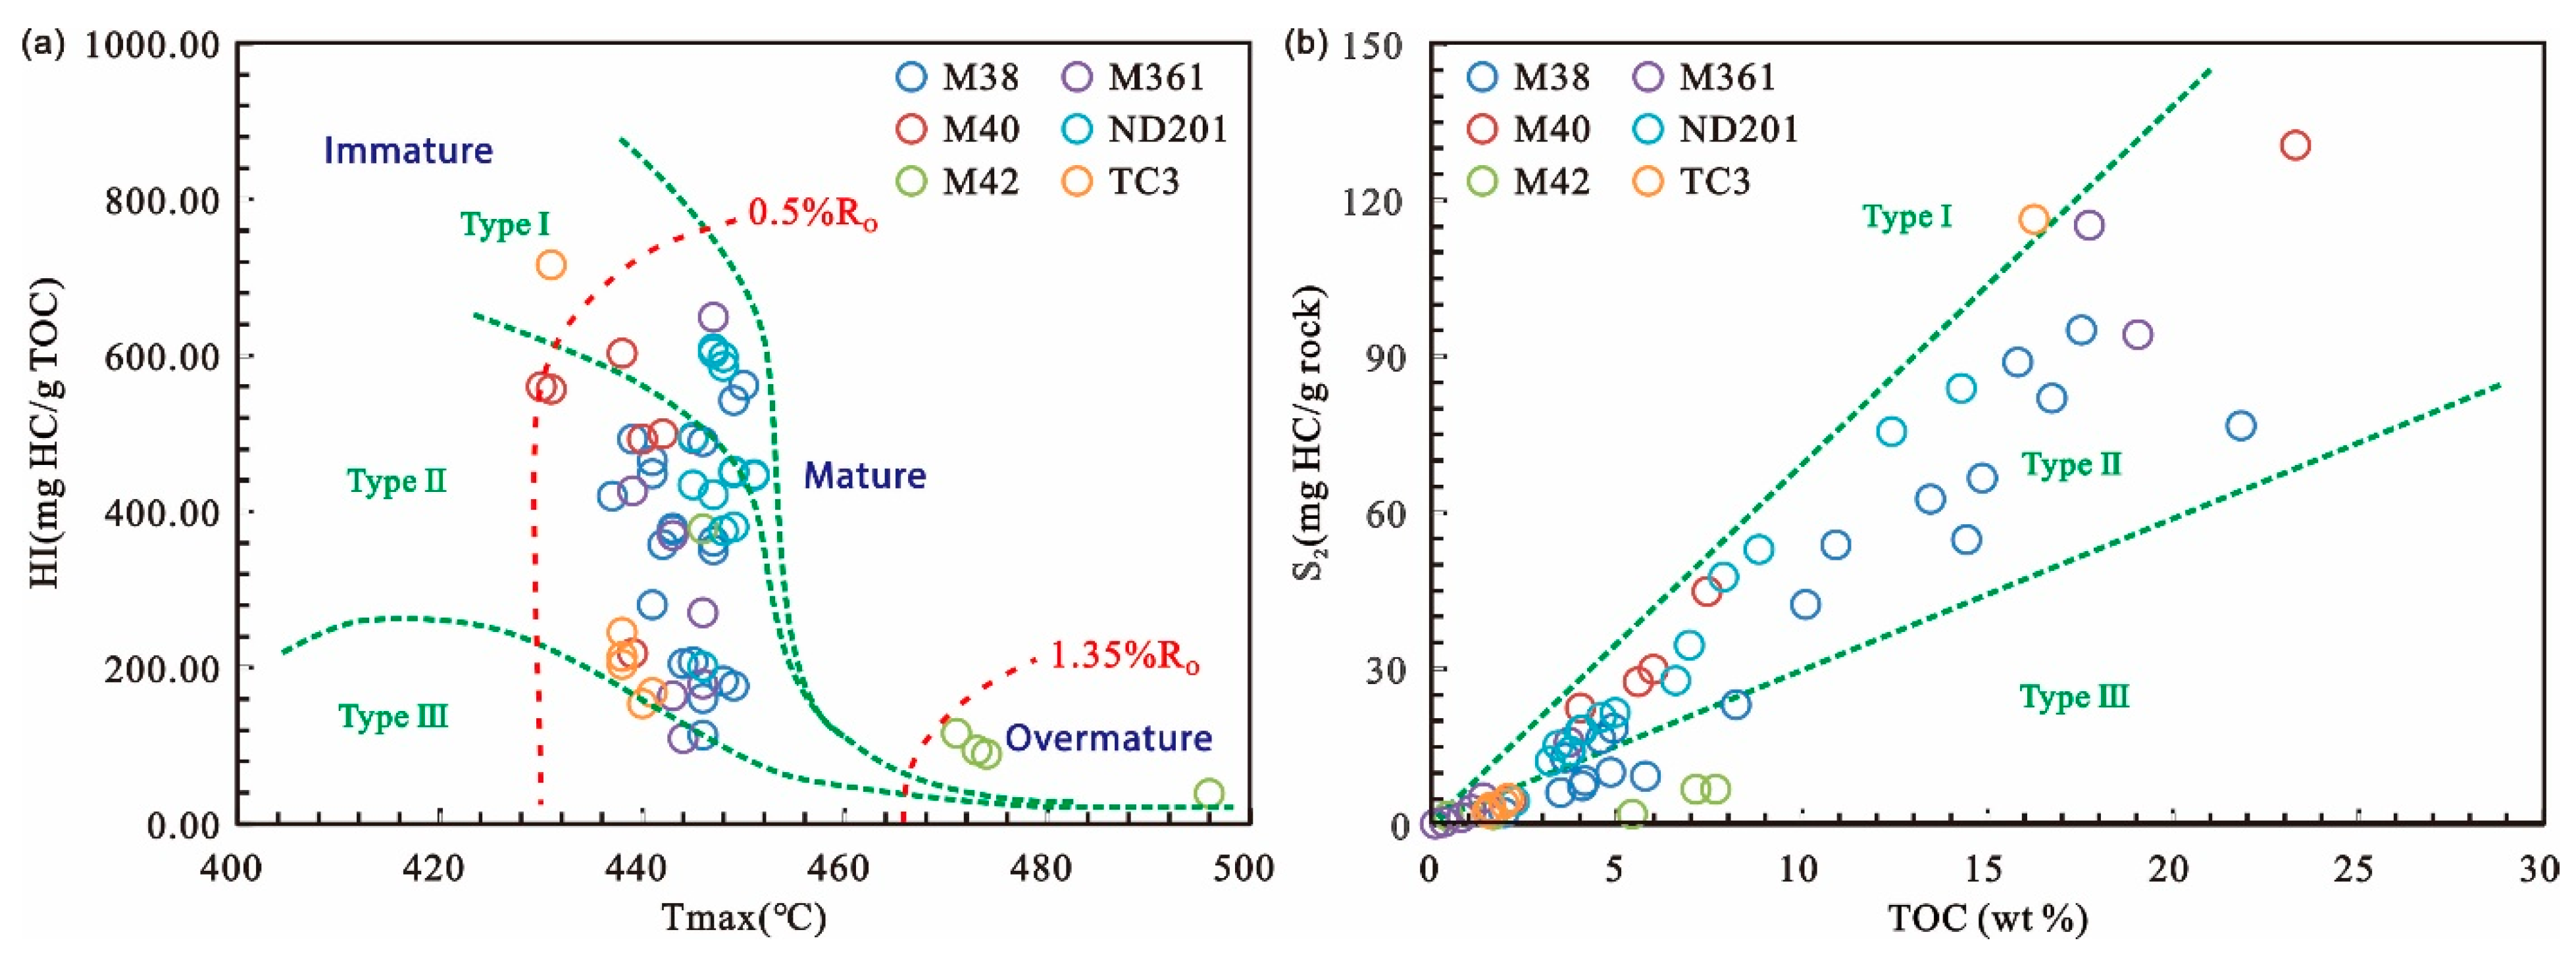
5.2. Shale Oil Potential
6. Conclusions
Author Contributions
Funding
Data Availability Statement
Acknowledgments
Conflicts of Interest
References
- Katz, B.; Lin, F. Lacustrine Basin Unconventional Resource Plays: Key Differences. Mar. Pet. Geol. 2014, 56, 255–265. [Google Scholar] [CrossRef]
- Jarvie, D.M. Shale Resource Systems for Oil and Gas: Part 2—Shale-Oil Resource Systems. In Shale Reservoir—Giant Resources for the 21st Century: AAPG Memoir 97; AAPG: Tulsa, OK, USA, 2012; pp. 89–119. [Google Scholar] [CrossRef]
- Zou, C.; Zhu, R.; Chen, Z.-Q.; Ogg, J.G.; Wu, S.; Dong, D.; Qiu, Z.; Wang, Y.; Wang, L.; Lin, S.; et al. Organic-Matter-Rich Shales of China. Earth-Sci. Rev. 2019, 189, 51–78. [Google Scholar] [CrossRef]
- Wang, M.; Li, M.; Li, J.-B.; Xu, L.; Zhang, J.-X. The Key Parameter of Shale Oil Resource Evaluation: Oil Content. Pet. Sci. 2022, 19, 1443–1459. [Google Scholar] [CrossRef]
- Al-Shami, T.M.; Jufar, S.R.; Kumar, S.; Abdulelah, H.; Abdullahi, M.B.; Al-Hajri, S.; Negash, B.M. A Comprehensive Review of Interwell Interference in Shale Reservoirs. Earth-Sci. Rev. 2023, 237, 104327. [Google Scholar] [CrossRef]
- Jin, Z.; Zhu, R.; Liang, X.; Shen, Y. Several Issues Worthy of Attention in Current Lacustrine Shale Oil Exploration and Development. Pet. Explor. Dev. 2021, 48, 1471–1484. [Google Scholar] [CrossRef]
- Hu, T.; Pang, X.; Jiang, F.; Wang, Q.; Liu, X.; Wang, Z.; Jiang, S.; Wu, G.; Li, C.; Xu, T.; et al. Movable Oil Content Evaluation of Lacustrine Organic-Rich Shales: Methods and a Novel Quantitative Evaluation Model. Earth-Sci. Rev. 2021, 214, 103545. [Google Scholar] [CrossRef]
- Wang, X.; Zhang, G.; Tang, W.; Wang, D.; Wang, K.; Liu, J.; Du, D. A Review of Commercial Development of Continental Shale Oil in China. Energy Geosci. 2022, 3, 282–289. [Google Scholar] [CrossRef]
- Liu, B.; Wang, H.; Fu, X.; Bai, Y.; Bai, L.; Jia, M.; He, B. Lithofacies and Depositional Setting of a Highly Prospective Lacustrine Shale Oil Succession from the Upper Cretaceous Qingshankou Formation in the Gulong Sag, Northern Songliao Basin, Northeast China. Am. Assoc. Pet. Geol. Bull. 2019, 103, 405–432. [Google Scholar] [CrossRef] [Green Version]
- Zhang, P.; Misch, D.; Hu, F.; Kostoglou, N.; Sachsenhofer, R.F.; Liu, Z.; Meng, Q.; Bechtel, A. Porosity Evolution in Organic Matter-Rich Shales (Qingshankou Fm.; Songliao Basin, NE China): Implications for Shale Oil Retention. Mar. Pet. Geol. 2021, 130, 105139. [Google Scholar] [CrossRef]
- Li, M.; Chen, Z.; Ma, X.; Cao, T.; Qian, M.; Jiang, Q.; Tao, G.; Li, Z.; Song, G. Shale Oil Resource Potential and Oil Mobility Characteristics of the Eocene-Oligocene Shahejie Formation, Jiyang Super-Depression, Bohai Bay Basin of China. Int. J. Coal Geol. 2019, 204, 130–143. [Google Scholar] [CrossRef]
- Song, Y.; Ye, X.; Shi, Q.; Huang, C.; Cao, Q.; Zhu, K.; Cai, M.; Ren, S.; Sun, L. A Comparative Study of Organic-Rich Shale from Turbidite and Lake Facies in the Paleogene Qikou Sag (Bohai Bay Basin, East China): Organic Matter Accumulation, Hydrocarbon Potential and Reservoir Characterization. Palaeogeogr. Palaeoclimatol. Palaeoecol. 2022, 594, 110939. [Google Scholar] [CrossRef]
- Hou, Y.; Wang, F.; He, S.; Dong, T.; Wu, S. Properties and Shale Oil Potential of Saline Lacustrine Shales in the Qianjiang Depression, Jianghan Basin, China. Mar. Pet. Geol. 2017, 86, 1173–1190. [Google Scholar] [CrossRef]
- Li, M.; Chen, Z.; Cao, T.; Ma, X.; Liu, X.; Li, Z.; Jiang, Q.; Wu, S. Expelled Oils and Their Impacts on Rock-Eval Data Interpretation, Eocene Qianjiang Formation in Jianghan Basin, China. Int. J. Coal Geol. 2018, 191, 37–48. [Google Scholar] [CrossRef]
- Zou, C.; Pan, S.; Horsfield, B.; Yang, Z.; Hao, S.; Liu, E.; Zhang, L. Oil Retention and Intrasource Migration in the Organic-Rich Lacustrine Chang 7 Shale of the Upper Triassic Yanchang Formation, Ordos Basin, Central China. Am. Assoc. Pet. Geol. Bull. 2019, 103, 2627–2663. [Google Scholar] [CrossRef]
- Chen, Y.; Zhu, Z.; Zhang, L. Control Actions of Sedimentary Environments and Sedimentation Rates on Lacustrine Oil Shale Distribution, an Example of the Oil Shale in the Upper Triassic Yanchang Formation, Southeastern Ordos Basin (NW China). Mar. Pet. Geol. 2019, 102, 508–520. [Google Scholar] [CrossRef]
- Wei, G.; Wang, W.; Feng, L.; Tan, X.; Yu, C.; Zhang, H.; Zhang, Z.; Wang, S. Geological Characteristics and Exploration Prospect of Black Shale in the Dongyuemiao Member of Lower Jurassic, the Eastern Sichuan Basin, China. Front. Earth Sci. 2021, 9, 765568. [Google Scholar] [CrossRef]
- Yuan, X.; Zhang, K.; Peng, J.; Li, B.; Han, F.; Chen, X.; Zheng, Z.; Ruan, J.; Ye, L.; Wang, Z.; et al. Study on Characteristics of Oil and Gas Occurrence and Reservoir Space of Medium-High Maturity Continental Shale—A Case Study of Middle Jurassic Lianggaoshan Formation in Fuling Block, Southeast of Sichuan Basin, South China. Front. Earth Sci. 2022, 10, 1032018. [Google Scholar] [CrossRef]
- Li, W.; Cao, J.; Zhi, D.; Tang, Y.; He, W.; Wang, T.; Xia, L. Controls on Shale Oil Accumulation in Alkaline Lacustrine Settings: Late Paleozoic Fengcheng Formation, Northwestern Junggar Basin. Mar. Pet. Geol. 2021, 129, 105107. [Google Scholar] [CrossRef]
- Qiu, Z.; Tao, H.; Zou, C.; Wang, H.; Ji, H.; Zhou, S. Lithofacies and Organic Geochemistry of the Middle Permian Lucaogou Formation in the Jimusar Sag of the Junggar Basin, NW China. J. Pet. Sci. Eng. 2016, 140, 97–107. [Google Scholar] [CrossRef]
- Zhang, S.; Liu, C.; Liang, H.; Jia, L.; Bai, J.; Zhang, L.; Wang, J. Mineralogical Composition and Organic Matter Characteristics of Lacustrine Fine-Grained Volcanic-Hydrothermal Sedimentary Rocks: A Data-Driven Analytics for the Second Member of Permian Lucaogou Formation, Santanghu Basin, NW China. Mar. Pet. Geol. 2021, 126, 104920. [Google Scholar] [CrossRef]
- Zhang, S.; Liu, C.; Liang, H.; Wang, J.; Bai, J.; Yang, M.; Liu, G.; Huang, H.; Guan, Y. Paleoenvironmental Conditions, Organic Matter Accumulation, and Unconventional Hydrocarbon Potential for the Permian Lucaogou Formation Organic-Rich Rocks in Santanghu Basin, NW China. Int. J. Coal Geol. 2018, 185, 44–60. [Google Scholar] [CrossRef]
- Liu, B.; Lv, Y.; Zhao, R.; Tu, X.; Guo, X.; Shen, Y. Formation Overpressure and Shale Oil Enrichment in the Shale System of Lucaogou Formation, Malang Sag, Santanghu Basin, NW China. Pet. Explor. Dev. 2012, 39, 744–750. [Google Scholar] [CrossRef]
- Song, D.; He, D.; Wang, S. Source Rock Potential and Organic Geochemistry of Carboniferous Source Rocks in Santanghu Basin, NW China. J. Earth Sci. 2013, 24, 355–370. [Google Scholar] [CrossRef]
- Liang, S.; Luo, Q.; Wang, R.; Chen, X.; Yang, B.; Ma, Q.; Liang, H. Geological Characteristics and Exploration Practice of Unconventional Permian Oil Resources in the Santanghu Basin. China Pet. Explor. 2019, 24, 624–635. [Google Scholar] [CrossRef]
- Li, T.-J.; Huang, Z.-L.; Chen, X.; Li, X.-N.; Liu, J.-T. Paleoenvironment and Organic Matter Enrichment of the Carboniferous Volcanic-Related Source Rocks in the Malang Sag, Santanghu Basin, NW China. Pet. Sci. 2021, 18, 29–53. [Google Scholar] [CrossRef]
- Liang, H.; Li, X.; Ma, Q.; Liang, H.; Luo, Q.; Chen, X.; Bai, G.; Zhang, Q.; Meng, Y. Geological Features and Exploration Potential of Permian Tiaohu Formation Tight Oil, Santanghu Basin, NW China. Pet. Explor. Dev. 2014, 41, 616–627. [Google Scholar] [CrossRef]
- McLennan, S.M. Relationships between the Trace Element Composition of Sedimentary Rocks and Upper Continental Crust. Geochem. Geophys. Geosyst. 2001, 2, 1021. [Google Scholar] [CrossRef]
- Bai, J.; Zhang, S.; Liu, C.; Jia, L.; Luo, K.; Jiang, T.; Peng, H. Mineralogy and Geochemistry of the Middle Permian Pingdiquan Formation Black Shales on the Eastern Margin of the Junggar Basin, North-west China: Implications for Palaeoenvironmental and Organic Matter Accumulation Analyses. Geol. J. 2022, 57, 1989–2006. [Google Scholar] [CrossRef]
- Bai, J.; Liu, C.; Zhang, S.; LU, J.; Sun, J. Zircon U-Pb Geochronology and Geochemistry of Basalts from the Qi’eshan Group in the Southern Turpan-Hami Basin, East Tianshan: Constraints on Closure Time of the North Tianshan Ocean. Acta Petrol. Sin. 2018, 34, 2995–3010. [Google Scholar]
- Schultz, R.B.; Rimmer, S.M. Geochemistry of Organic-Rich Shales: New Perspectives. Chem. Geol. 2004, 206, 163–165. [Google Scholar] [CrossRef]
- Hatch, J.R.; Leventhal, J.S. Relationship between Inferred Redox Potential of the Depositional Environment and Geochemistry of the Upper Pennsylvanian (Missourian) Stark Shale Member of the Dennis Limestone, Wabaunsee County, Kansas, U.S.A. Chem. Geol. 1992, 99, 65–82. [Google Scholar] [CrossRef]
- Zhang, K.; Liu, R.; Bai, E.; Zhao, Z.; Peyrotty, G.; Fathy, D.; Chang, Q.; Liu, Z.; Yang, K.; Xu, C.; et al. Biome Responses to a Hydroclimatic Crisis in an Early Cretaceous (Barremian–Aptian) Subtropical Inland Lake Ecosystem, Northwest China. Palaeogeogr. Palaeoclimatol. Palaeoecol. 2023, 622, 111596. [Google Scholar] [CrossRef]
- Jewuła, K.; Środoń, J.; Kuligiewicz, A.; Mikołajczak, M.; Liivamägi, S. Critical Evaluation of Geochemical Indices of Palaeosalinity Involving Boron. Geochim. Cosmochim. Acta 2022, 322, 1–23. [Google Scholar] [CrossRef]
- Walker, C.T. Evaluation of Boron as a Paleosalinity Indicator and Its Application to Offshore Prospects. Am. Assoc. Pet. Geol. Bull. 1968, 52, 751–766. [Google Scholar] [CrossRef]
- Wei, W.; Algeo, T.J. Elemental Proxies for Paleosalinity Analysis of Ancient Shales and Mudrocks. Geochim. Cosmochim. Acta 2020, 287, 341–366. [Google Scholar] [CrossRef]
- Wang, A.; Wang, Z.; Liu, J.; Xu, N.; Li, H. The Sr/Ba Ratio Response to Salinity in Clastic Sediments of the Yangtze River Delta. Chem. Geol. 2021, 559, 119923. [Google Scholar] [CrossRef]
- Lyons, P.C.; Palmer, C.A.; Bostick, N.H.; Fletcher, J.D.; Dulong, F.T.; Brown, F.W.; Brown, Z.A.; Krasnow, M.R.; Romankiw, L.A. Chemistry and Origin of Minor and Trace Elements in Vitrinite Concentrates from a Rank Series from the Eastern United States, England, and Australia. Int. J. Coal Geol. 1989, 13, 481–527. [Google Scholar] [CrossRef]
- Eskenazy, G.; Delibaltova, D.; Mincheva, E. Geochemistry of Boron in Bulgarian Coals. Int. J. Coal Geol. 1994, 25, 93–110. [Google Scholar] [CrossRef]
- Ye, C.; Yang, Y.; Fang, X.; Zhang, W.; Song, C.; Yang, R. Paleolake Salinity Evolution in the Qaidam Basin (NE Tibetan Plateau) between ~42 and 29 Ma: Links to Global Cooling and Paratethys Sea Incursions. Sediment. Geol. 2020, 409, 105778. [Google Scholar] [CrossRef]
- Campbell, F.A.; Williams, G.D. Chemical Composition of Shales of Mannville Group (Lower Cretaceous) of Central Alberta, Canada. Am. Assoc. Pet. Geol. Bull. 1965, 49, 81–87. [Google Scholar] [CrossRef]
- Chen, Z.; Chen, Z.; Zhang, W. Quaternary Stratigraphy and Trace-Element Indices of the Yangtze Delta, Eastern China, with Special Reference to Marine Transgressions. Quat. Res. 1997, 47, 181–191. [Google Scholar] [CrossRef]
- Degens, E.T.; Williams, E.G.; Keith, M.L. Environmental Studies of Carboniferous Sediments Part I: Geochemical Criteria for Differentiating Marine from Fresh-Water Shales. Am. Assoc. Pet. Geol. Bull. 1957, 41, 2427–2455. [Google Scholar] [CrossRef]
- Tao, S.; Xu, Y.; Tang, D.; Xu, H.; Li, S.; Chen, S.; Liu, W.; Cui, Y.; Gou, M. Geochemistry of the Shitoumei Oil Shale in the Santanghu Basin, Northwest China: Implications for Paleoclimate Conditions, Weathering, Provenance and Tectonic Setting. Int. J. Coal Geol. 2017, 184, 42–56. [Google Scholar] [CrossRef]
- Deng, T.; Li, Y.; Wang, Z.; Yu, Q.; Dong, S.; Yan, L.; Hu, W.; Chen, B. Geochemical Characteristics and Organic Matter Enrichment Mechanism of Black Shale in the Upper Triassic Xujiahe Formation in the Sichuan Basin: Implications for Paleoweathering, Provenance and Tectonic Setting. Mar. Pet. Geol. 2019, 109, 698–716. [Google Scholar] [CrossRef]
- Roy, D.K.; Roser, B.P. Climatic Control on the Composition of Carboniferous–Permian Gondwana Sediments, Khalaspir Basin, Bangladesh. Gondwana Res. 2013, 23, 1163–1171. [Google Scholar] [CrossRef]
- Ganai, J.A.; Rashid, S.A. Anoxia and Fluctuating Climate Recorded from the Devonian–Carboniferous Black Shales, Tethys Himalaya, India: A Multi-Proxy Approach. Int. J. Earth Sci. 2019, 108, 863–883. [Google Scholar] [CrossRef]
- Scheffler, K.; Buehmann, D.; Schwark, L. Analysis of Late Palaeozoic Glacial to Postglacial Sedimentary Successions in South Africa by Geochemical Proxies—Response to Climate Evolution and Sedimentary Environment. Palaeogeogr. Palaeoclimatol. Palaeoecol. 2006, 240, 184–203. [Google Scholar] [CrossRef]
- Algeo, T.J.; Schwark, L.; Hower, J.C. High-Resolution Geochemistry and Sequence Stratigraphy of the Hushpuckney Shale (Swope Formation, Eastern Kansas): Implications for Climato-Environmental Dynamics of the Late Pennsylvanian Midcontinent Seaway. Chem. Geol. 2004, 206, 259–288. [Google Scholar] [CrossRef]
- Doner, Z.; Kumral, M.; Demirel, I.H.; Hu, Q. Geochemical Characteristics of the Silurian Shales from the Central Taurides, Southern Turkey: Organic Matter Accumulation, Preservation and Depositional Environment Modeling. Mar. Pet. Geol. 2019, 102, 155–175. [Google Scholar] [CrossRef]
- He, Y.; Zhu, X.; Qiu, Y.; Pang, L.; Zhao, T. Extreme Climate Changes Influenced Early Life Evolution at ~1.4 Ga: Implications from Shales of the Xiamaling Formation, Northern North China Craton. Precambrian Res. 2022, 383, 106901. [Google Scholar] [CrossRef]
- Zeng, S.; Wang, J.; Zeng, Y.; Song, C.; Wang, D.; Zhan, W.; Sun, W. Episodic Volcanic Eruption and Arid Climate during the Triassic-Jurassic Transition in the Qiangtang Basin, Eastern Tethys: A Possible Linkage with the End-Triassic Biotic Crises. J. Asian Earth Sci. 2022, 237, 105345. [Google Scholar] [CrossRef]
- Cole-Dai, J. Volcanoes and Climate. WIREs Clim. Chang. 2010, 1, 824–839. [Google Scholar] [CrossRef]
- Timmreck, C. Modeling the Climatic Effects of Large Explosive Volcanic Eruptions. WIREs Clim. Chang. 2012, 3, 545–564. [Google Scholar] [CrossRef]
- Chen, X.; Jin, X.; Zhu, X.; Zhong, N.; Zhang, Z. Origins of Organic Matter, Paleoenvironment, and Hydrocarbon Potential of the Carboniferous Source Rocks from Shibei Sag, Junggar Basin, NW China. ACS Earth Sp. Chem. 2023, 7, 92–109. [Google Scholar] [CrossRef]
- Zhang, K.; Jin, W.; Lin, H.; Dong, C.; Wu, S. Major and Trace Elemental Compositions of the Upper Carboniferous Batamayineishan Mudrocks, Wulungu Area, Junggar Basin, China: Implications for Controls on the Formation of the Organic-Rich Source Rocks. Mar. Pet. Geol. 2018, 91, 550–561. [Google Scholar] [CrossRef]
- Bennett, W.W.; Canfield, D.E. Redox-Sensitive Trace Metals as Paleoredox Proxies: A Review and Analysis of Data from Modern Sediments. Earth-Sci. Rev. 2020, 204, 103175. [Google Scholar] [CrossRef]
- Algeo, T.J.; Li, C. Redox Classification and Calibration of Redox Thresholds in Sedimentary Systems. Geochim. Cosmochim. Acta 2020, 287, 8–26. [Google Scholar] [CrossRef]
- Rimmer, S.M. Geochemical Paleoredox Indicators in Devonian–Mississippian Black Shales, Central Appalachian Basin (USA). Chem. Geol. 2004, 206, 373–391. [Google Scholar] [CrossRef]
- Jones, B.; Manning, D.A.C. Comparison of Geochemical Indices Used for the Interpretation of Palaeoredox Conditions in Ancient Mudstones. Chem. Geol. 1994, 111, 111–129. [Google Scholar] [CrossRef]
- Ossa, F.O.; Bekker, A.; Hofmann, A.; Poulton, S.W.; Ballouard, C.; Schoenberg, R. Limited Expression of the Paleoproterozoic Oklo Natural Nuclear Reactor Phenomenon in the Aftermath of a Widespread Deoxygenation Event ~2.11–2.06 Billion Years Ago. Chem. Geol. 2021, 578, 120315. [Google Scholar] [CrossRef]
- Zhu, B.; Yang, T.; Wang, J.; Chen, X.; Pan, W.; Chen, Y. Multiple Controls on the Paleoenvironment of the Early Cambrian Black Shale-Chert in the Northwest Tarim Basin, NW China: Trace Element, Iron Speciation and Mo Isotopic Evidence. Mar. Pet. Geol. 2022, 136, 105434. [Google Scholar] [CrossRef]
- Tribovillard, N.; Algeo, T.J.; Lyons, T.; Riboulleau, A. Trace Metals as Paleoredox and Paleoproductivity Proxies: An Update. Chem. Geol. 2006, 232, 12–32. [Google Scholar] [CrossRef]
- Fathy, D.; Wagreich, M.; Fathi, E.; Ahmed, M.S.; Leila, M.; Sami, M. Maastrichtian Anoxia and Its Influence on Organic Matter and Trace Metal Patterns in the Southern Tethys Realm of Egypt during Greenhouse Variability. ACS Omega 2023, 8, 19603–19612. [Google Scholar] [CrossRef] [PubMed]
- Pan, Y.; Huang, Z.; Guo, X.; Wang, R.; Lash, G.G.; Fan, T.; Liu, W. A Re-Assessment and Calibration of Redox Thresholds in the Permian Lucaogou Formation of the Malang Sag, Santanghu Basin, Northwest China. Mar. Pet. Geol. 2022, 135, 105406. [Google Scholar] [CrossRef]
- Zhang, Y.; Hu, S.; Shen, C.; Liao, Z.; Xu, J.; Zhang, X. Factors Influencing the Evolution of Shale Pores in Enclosed and Semi-Enclosed Thermal Simulation Experiments, Permian Lucaogou Formation, Santanghu Basin, China. Mar. Pet. Geol. 2022, 135, 105421. [Google Scholar] [CrossRef]
- Liu, B.; Song, Y.; Zhu, K.; Su, P.; Ye, X.; Zhao, W. Mineralogy and Element Geochemistry of Salinized Lacustrine Organic-Rich Shale in the Middle Permian Santanghu Basin: Implications for Paleoenvironment, Provenance, Tectonic Setting and Shale Oil Potential. Mar. Pet. Geol. 2020, 120, 104569. [Google Scholar] [CrossRef]
- Jiao, X.; Liu, Y.; Yang, W.; Zhou, D.; Wang, S.; Jin, M.; Sun, B.; Fan, T. Mixed Biogenic and Hydrothermal Quartz in Permian Lacustrine Shale of Santanghu Basin, NW China: Implications for Penecontemporaneous Transformation of Silica Minerals. Int. J. Earth Sci. 2018, 107, 1989–2009. [Google Scholar] [CrossRef]
- Hong, S.K.; Shinn, Y.J.; Choi, J.; Lee, H.S. Estimation of Original Kerogen Type and Hydrogen Index Using Inorganic Geochemical Proxies: Implications for Assessing Shale Gas Potential in the Devonian Horn River Formation of Western Canada. Am. Assoc. Pet. Geol. Bull. 2018, 102, 2075–2099. [Google Scholar] [CrossRef]
- Cardott, B.J. Thermal Maturity of Woodford Shale Gas and Oil Plays, Oklahoma, USA. Int. J. Coal Geol. 2012, 103, 109–119. [Google Scholar] [CrossRef]
- Hazra, B.; Singh, D.P.; Chakraborty, P.; Singh, P.K.; Sahu, S.G.; Adak, A.K. Using Rock-Eval S4Tpeak as Thermal Maturity Proxy for Shales. Mar. Pet. Geol. 2021, 127, 104977. [Google Scholar] [CrossRef]
- Katz, B.J.; Lin, F. Consideration of the Limitations of Thermal Maturity with Respect to Vitrinite Reflectance, Tmax, and Other Proxies. Am. Assoc. Pet. Geol. Bull. 2021, 105, 695–720. [Google Scholar] [CrossRef]
- Yang, S.; Horsfield, B. Critical Review of the Uncertainty of Tmax in Revealing the Thermal Maturity of Organic Matter in Sedimentary Rocks. Int. J. Coal Geol. 2020, 225, 103500. [Google Scholar] [CrossRef]
- Dang, W.; Nie, H.; Zhang, J.; Tang, X.; Jiang, S.; Wei, X.; Liu, Y.; Wang, F.; Li, P.; Chen, Z. Pore-Scale Mechanisms and Characterization of Light Oil Storage in Shale Nanopores: New Method and Insights. Geosci. Front. 2022, 13, 101424. [Google Scholar] [CrossRef]
- Huang, H.; Li, R.; Chen, W.; Chen, L.; Jiang, Z.; Xiong, F.; Guan, W.; Zhang, S.; Tian, B. Revisiting Movable Fluid Space in Tight Fine-Grained Reservoirs: A Case Study from Shahejie Shale in the Bohai Bay Basin, NE China. J. Pet. Sci. Eng. 2021, 207, 109170. [Google Scholar] [CrossRef]
- Lu, S.; Huang, W.; Chen, F.; Li, J.; Wang, M.; Xue, H.; Wang, W.; Cai, X. Classification and Evaluation Criteria of Shale Oil and Gas Resources: Discussion and Application. Pet. Explor. Dev. 2012, 39, 268–276. [Google Scholar] [CrossRef]
- Neuzil, C.E. Permeability of Clays and Shales. Annu. Rev. Earth Planet. Sci. 2019, 47, 247–273. [Google Scholar] [CrossRef]
- Mustafa, A.; Tariq, Z.; Mahmoud, M.; Radwan, A.E.; Abdulraheem, A.; Abouelresh, M.O. Data-Driven Machine Learning Approach to Predict Mineralogy of Organic-Rich Shales: An Example from Qusaiba Shale, Rub’ Al Khali Basin, Saudi Arabia. Mar. Pet. Geol. 2022, 137, 105495. [Google Scholar] [CrossRef]
- Jarvie, D.M.; Hill, R.J.; Ruble, T.E.; Pollastro, R.M. Unconventional Shale-Gas Systems: The Mississippian Barnett Shale of North-Central Texas as One Model for Thermogenic Shale-Gas Assessment. Am. Assoc. Pet. Geol. Bull. 2007, 91, 475–499. [Google Scholar] [CrossRef]
- Li, H. Research Progress on Evaluation Methods and Factors Influencing Shale Brittleness: A Review. Energy Rep. 2022, 8, 4344–4358. [Google Scholar] [CrossRef]
- Ye, Y.; Tang, S.; Xi, Z. Brittleness Evaluation in Shale Gas Reservoirs and Its Influence on Fracability. Energies 2020, 13, 388. [Google Scholar] [CrossRef] [Green Version]


| Sample ID | M38-1 | M38-2 | M38-3 | M38-4 | M38-5 | M38-6 | M38-7 | M38-8 | M38-9 | M38-10 |
|---|---|---|---|---|---|---|---|---|---|---|
| Depth (m) | 3038.13 | 3038.23 | 3038.43 | 3038.31 | 3039.46 | 3039.99 | 3040.05 | 3041.44 | 3041.59 | 3041.69 |
| Na (%) | 3.49 | 3.75 | 3.11 | 3.30 | 1.01 | 1.67 | 2.32 | 2.54 | 3.27 | 1.87 |
| K (%) | 0.06 | 0.16 | 0.67 | 0.46 | 1.30 | 2.31 | 2.43 | 0.11 | 0.13 | 1.69 |
| Ti (%) | 0.20 | 0.44 | 0.66 | 0.47 | 0.27 | 0.43 | 0.46 | 0.36 | 0.27 | 0.63 |
| Fe (%) | 3.30 | 7.31 | 10.58 | 6.81 | 3.10 | 5.01 | 4.51 | 13.21 | 5.09 | 8.53 |
| Ca (%) | 3.92 | 1.47 | 1.98 | 1.88 | 1.00 | 4.74 | 1.99 | 2.55 | 0.81 | 1.54 |
| Mg (%) | 0.36 | 1.16 | 1.99 | 1.18 | 0.12 | 0.51 | 0.41 | 0.37 | 0.22 | 0.25 |
| Al (%) | 9.35 | 12.28 | 10.56 | 12.22 | 4.80 | 13.41 | 10.60 | 7.10 | 6.97 | 7.04 |
| Mn (ppm) | 235.00 | 963.00 | 1856.00 | 1150.00 | 377.00 | 652.00 | 463.00 | 1676.00 | 456.00 | 1511.00 |
| Li (ppm) | 11.39 | 14.40 | 36.71 | 24.99 | 13.76 | 19.67 | 15.29 | 32.74 | 6.28 | 22.52 |
| B (ppm) | 1.70 | 1.54 | 3.14 | 1.99 | 2.44 | 2.02 | 1.83 | 3.77 | 3.39 | 2.40 |
| Sc (ppm) | 13.79 | 26.98 | 33.08 | 22.57 | 5.41 | 39.82 | 15.46 | 16.95 | 10.93 | 11.47 |
| V (ppm) | 162.00 | 186.00 | 312.00 | 166.00 | 97.49 | 124.00 | 155.00 | 466.00 | 216.00 | 201.00 |
| Cr (ppm) | 32.30 | 45.09 | 109.00 | 111.00 | 67.63 | 106.00 | 121.00 | 39.25 | 31.10 | 71.79 |
| Ni (ppm) | 29.33 | 52.71 | 45.41 | 56.10 | 19.61 | 30.74 | 53.13 | 30.04 | 42.00 | 17.63 |
| Cu (ppm) | 54.15 | 79.63 | 60.14 | 46.55 | 34.33 | 37.56 | 52.72 | 97.77 | 138.00 | 76.07 |
| Zn (ppm) | 60.84 | 71.24 | 102.00 | 86.80 | 46.62 | 84.35 | 76.28 | 85.38 | 75.98 | 73.43 |
| Ga (ppm) | 3.37 | 7.72 | 11.88 | 9.76 | 5.68 | 7.32 | 7.05 | 8.44 | 6.54 | 12.31 |
| Sr (ppm) | 197.00 | 175.00 | 209.00 | 264.00 | 850.00 | 1875.00 | 1681.00 | 128.00 | 101.00 | 156.00 |
| Y (ppm) | 29.33 | 16.08 | 23.54 | 9.93 | 1.51 | 21.67 | 4.26 | 24.08 | 14.03 | 0.88 |
| Zr (ppm) | 89.20 | 134.00 | 238.00 | 181.00 | 134.00 | 190.00 | 205.00 | 187.00 | 135.00 | 213.00 |
| Ba (ppm) | 65.70 | 254.00 | 380.00 | 218.00 | 559.00 | 1085.00 | 1006.00 | 73.25 | 54.78 | 101.00 |
| Cd (ppm) | 0.01 | 0.02 | 0.05 | 0.03 | 0.01 | 0.02 | 0.02 | 0.06 | 0.02 | 0.03 |
| Mo (ppm) | 6.97 | 8.46 | 6.08 | 7.53 | 3.80 | 9.54 | 6.38 | 5.09 | 4.89 | 3.96 |
| Nb (ppm) | 9.42 | 20.77 | 30.29 | 21.38 | 12.81 | 18.67 | 20.80 | 16.44 | 12.24 | 27.29 |
| Rb (ppm) | 6.62 | 5.88 | 7.03 | 8.87 | 28.57 | 63.05 | 56.55 | 4.32 | 3.41 | 5.26 |
| Well ID | Sample ID | Depth (m) | TOC | S1 | S2 | Tmax | PG | PI | HI | OSI | Chloroform Bitumen “A” (wt%) |
|---|---|---|---|---|---|---|---|---|---|---|---|
| M38 | M38-1 | 3040.00 | 3.48 | 1.22 | 6.14 | 449.00 | 7.36 | 0.17 | 176.44 | 35.06 | |
| M38 | M38-2 | 3041.00 | 10.90 | 3.85 | 53.79 | 439.00 | 57.64 | 0.07 | 493.49 | 35.32 | |
| M38 | M38-3 | 3042.00 | 1.97 | 1.17 | 2.25 | 446.00 | 3.42 | 0.34 | 114.21 | 59.39 | |
| M38 | M38-4 | 3042.40 | 3.61 | 1.03 | 12.93 | 442.00 | 13.96 | 0.07 | 358.17 | 28.53 | |
| M38 | M38-5 | 3039.48 | 14.43 | 10.22 | 54.72 | 443.00 | 64.94 | 0.16 | 379.21 | 70.82 | |
| M38 | M38-6 | 3039.58 | 4.84 | 1.39 | 10.06 | 445.00 | 11.45 | 0.12 | 207.85 | 28.72 | |
| M38 | M38-7 | 3039.97 | 4.08 | 1.55 | 7.48 | 448.00 | 9.03 | 0.17 | 183.33 | 37.99 | 0.41 |
| M38 | M38-8 | 3040.14 | 4.15 | 2.00 | 8.52 | 444.00 | 10.52 | 0.19 | 205.30 | 48.19 | |
| M38 | M38-9 | 3040.62 | 8.22 | 4.75 | 23.06 | 441.00 | 27.81 | 0.17 | 280.54 | 57.79 | |
| M38 | M38-10 | 3041.44 | 10.09 | 7.99 | 42.36 | 437.00 | 50.35 | 0.16 | 419.82 | 79.19 | 1.75 |
| M38 | M38-11 | 3041.63 | 13.45 | 7.99 | 62.55 | 441.00 | 70.54 | 0.11 | 465.06 | 59.41 | |
| M38 | M38-12 | 3041.93 | 14.86 | 8.14 | 66.62 | 441.00 | 74.76 | 0.11 | 448.32 | 54.78 | |
| M38 | M38-13 | 3042.19 | 5.78 | 1.46 | 9.29 | 446.00 | 10.75 | 0.14 | 160.73 | 25.26 | |
| M38 | M38-14 | 3042.50 | 4.91 | 3.40 | 18.49 | 443.00 | 21.89 | 0.16 | 376.58 | 69.25 | 0.60 |
| M38 | M38-15 | 3052.50 | 16.73 | 6.25 | 82.00 | 446.00 | 88.25 | 0.07 | 490.14 | 37.36 | 1.64 |
| M38 | M38-16 | 3085.00 | 21.84 | 12.54 | 76.68 | 447.00 | 89.22 | 0.14 | 351.10 | 57.42 | 0.95 |
| M38 | M38-17 | 3095.00 | 15.81 | 5.12 | 88.89 | 450.00 | 94.01 | 0.05 | 562.24 | 32.38 | 0.98 |
| M38 | M38-18 | 3132.00 | 17.53 | 8.26 | 95.06 | 449.00 | 103.32 | 0.08 | 542.27 | 47.12 | 1.25 |
| M38 | M38-19 | 3178.50 | 4.57 | 1.72 | 16.54 | 447.00 | 18.26 | 0.09 | 361.93 | 37.64 | |
| M40 | M40-1 | 2668.04 | 2.17 | 0.44 | 4.75 | 439.00 | 5.19 | 0.08 | 218.89 | 20.28 | |
| M40 | M40-2 | 2668.23 | 23.30 | 11.60 | 130.59 | 430.00 | 142.19 | 0.08 | 560.47 | 49.79 | |
| M40 | M40-3 | 2731.80 | 7.44 | 2.99 | 44.88 | 438.00 | 47.87 | 0.06 | 603.23 | 40.19 | |
| M40 | M40-4 | 2732.22 | 5.99 | 4.53 | 29.92 | 442.00 | 34.45 | 0.13 | 499.50 | 75.63 | 1.15 |
| M40 | M40-5 | 2732.86 | 5.57 | 7.01 | 27.45 | 440.00 | 34.46 | 0.20 | 492.82 | 125.85 | 1.95 |
| M40 | M40-6 | 2734.10 | 4.02 | 20.12 | 22.39 | 431.00 | 42.51 | 0.47 | 556.97 | 500.50 | |
| M42 | M42-1 | 3986.46 | 5.41 | 0.86 | 2.11 | 496.00 | 2.97 | 0.29 | 39.00 | 15.90 | |
| M42 | M42-2 | 3987.50 | 7.67 | 2.41 | 6.85 | 474.00 | 9.26 | 0.26 | 89.31 | 31.42 | 0.26 |
| M42 | M42-3 | 3988.50 | 7.13 | 1.04 | 6.77 | 473.00 | 7.81 | 0.13 | 94.95 | 14.59 | |
| M42 | M42-4 | 3988.90 | 1.67 | 1.08 | 1.95 | 471.00 | 3.03 | 0.36 | 116.77 | 64.67 | |
| M42 | M42-5 | 3989.50 | 0.45 | 0.08 | 1.70 | 446.00 | 1.78 | 0.04 | 377.78 | 17.78 | |
| M361 | M361-1 | 3155.40 | 0.36 | 0.09 | 0.59 | 443.00 | 0.68 | 0.13 | 163.89 | 25.00 | |
| M361 | M361-2 | 3156.20 | 1.08 | 0.29 | 2.92 | 446.00 | 3.21 | 0.09 | 270.37 | 26.85 | 0.23 |
| M361 | M361-3 | 3157.10 | 0.82 | 0.30 | 1.47 | 446.00 | 1.77 | 0.17 | 179.27 | 36.59 | |
| M361 | M361-4 | 3157.40 | 19.06 | 15.79 | 94.19 | 445.00 | 109.98 | 0.14 | 494.18 | 82.84 | |
| M361 | M361-5 | 3158.00 | 17.75 | 18.37 | 115.20 | 447.00 | 133.57 | 0.14 | 649.01 | 103.49 | |
| M361 | M361-6 | 3159.10 | 1.40 | 0.99 | 5.18 | 443.00 | 6.17 | 0.16 | 370.00 | 70.71 | |
| M361 | M361-7 | 3159.72 | 3.72 | 4.13 | 15.89 | 439.00 | 20.02 | 0.21 | 427.15 | 111.02 | 0.32 |
| M361 | M361-8 | 3162.50 | 0.10 | 0.05 | 0.11 | 444.00 | 0.16 | 0.31 | 110.00 | 50.00 | |
| ND201 | ND201-1 | 3271.00 | 2.24 | 1.02 | 4.53 | 446.00 | 5.55 | 0.18 | 202.23 | 45.54 | |
| ND201 | ND201-2 | 3275.00 | 14.30 | 2.45 | 83.84 | 448.00 | 86.29 | 0.03 | 586.29 | 17.13 | 1.22 |
| ND201 | ND201-3 | 3278.00 | 12.41 | 3.12 | 75.57 | 447.00 | 78.69 | 0.04 | 608.94 | 25.14 | |
| ND201 | ND201-4 | 3283.00 | 6.58 | 2.06 | 27.77 | 447.00 | 29.83 | 0.07 | 422.04 | 31.31 | |
| ND201 | ND201-5 | 3290.00 | 4.95 | 1.73 | 21.51 | 445.00 | 23.24 | 0.07 | 434.55 | 34.95 | |
| ND201 | ND201-6 | 3300.00 | 8.84 | 2.22 | 52.87 | 448.00 | 55.09 | 0.04 | 598.08 | 25.11 | |
| ND201 | ND201-7 | 3304.00 | 7.88 | 1.43 | 47.57 | 447.00 | 49.00 | 0.03 | 603.68 | 18.15 | |
| ND201 | ND201-8 | 3307.00 | 6.96 | 2.16 | 34.48 | 445.00 | 36.64 | 0.06 | 495.40 | 31.03 | 0.72 |
| ND201 | ND201-9 | 3317.00 | 3.75 | 1.26 | 14.08 | 448.00 | 15.34 | 0.08 | 375.47 | 33.60 | |
| ND201 | ND201-10 | 3321.00 | 3.20 | 0.74 | 12.19 | 449.00 | 12.93 | 0.06 | 380.94 | 23.13 | |
| ND201 | ND201-11 | 3324.00 | 4.58 | 1.43 | 20.69 | 449.00 | 22.12 | 0.06 | 451.75 | 31.22 | |
| ND201 | ND201-12 | 3328.00 | 3.42 | 1.11 | 15.32 | 451.00 | 16.43 | 0.07 | 447.95 | 32.46 | |
| ND201 | ND201-13 | 3336.00 | 4.02 | 1.10 | 18.10 | 449.00 | 19.20 | 0.06 | 450.25 | 27.36 | |
| ND201 | ND201-14 | 3339.00 | 4.08 | 1.53 | 18.20 | 451.00 | 19.73 | 0.08 | 446.08 | 37.50 | 0.43 |
| TC3 | TC3-1 | 3084.00 | 1.50 | 0.18 | 2.52 | 441.00 | 2.70 | 0.07 | 168.00 | 12.00 | |
| TC3 | TC3-2 | 3084.50 | 1.97 | 0.22 | 4.02 | 438.00 | 4.24 | 0.05 | 204.06 | 11.17 | 0.13 |
| TC3 | TC3-3 | 3085.00 | 2.07 | 0.33 | 5.08 | 438.00 | 5.41 | 0.06 | 245.41 | 15.94 | |
| TC3 | TC3-4 | 3085.50 | 16.25 | 1.79 | 116.38 | 431.00 | 118.17 | 0.02 | 716.18 | 11.02 | |
| TC3 | TC3-5 | 3086.00 | 1.52 | 0.20 | 2.34 | 440.00 | 2.54 | 0.08 | 153.95 | 13.16 | |
| TC3 | TC3-6 | 3088.00 | 1.61 | 0.33 | 3.45 | 438.00 | 3.78 | 0.09 | 214.29 | 20.50 |
Disclaimer/Publisher’s Note: The statements, opinions and data contained in all publications are solely those of the individual author(s) and contributor(s) and not of MDPI and/or the editor(s). MDPI and/or the editor(s) disclaim responsibility for any injury to people or property resulting from any ideas, methods, instructions or products referred to in the content. |
© 2023 by the authors. Licensee MDPI, Basel, Switzerland. This article is an open access article distributed under the terms and conditions of the Creative Commons Attribution (CC BY) license (https://creativecommons.org/licenses/by/4.0/).
Share and Cite
Zhang, S.; Liu, C.; Fan, Z.; Liang, H.; Gao, J.; Song, H.; Dang, W.; Zhang, L.; Gao, Y. Paleoenvironmental Conditions and Shale Oil Potential of the Carboniferous Ha’erjiawu Formation in the Santanghu Basin, NW China. Processes 2023, 11, 2209. https://doi.org/10.3390/pr11072209
Zhang S, Liu C, Fan Z, Liang H, Gao J, Song H, Dang W, Zhang L, Gao Y. Paleoenvironmental Conditions and Shale Oil Potential of the Carboniferous Ha’erjiawu Formation in the Santanghu Basin, NW China. Processes. 2023; 11(7):2209. https://doi.org/10.3390/pr11072209
Chicago/Turabian StyleZhang, Shaohua, Chiyang Liu, Zhiqiang Fan, Hao Liang, Jianrong Gao, Hui Song, Wei Dang, Long Zhang, and Yaning Gao. 2023. "Paleoenvironmental Conditions and Shale Oil Potential of the Carboniferous Ha’erjiawu Formation in the Santanghu Basin, NW China" Processes 11, no. 7: 2209. https://doi.org/10.3390/pr11072209