
Intelligent Diagnosis Model of Working Conditions in Variable Torque Pumping Unit Wells Based on an Electric Power Diagram


1
Shandong Institute of Petroleum and Chemical Technology, Dongying 257061, China
2
School of Petroleum Engineering, China University of Petroleum (East China), Qingdao 266580, China
3
Research Institute of Petroleum Exploration and Development, PetroChina, Beijing 100083, China
4
CNPC Research Institute of Safety and Environment Technology, Beijing 102206, China
5
Liaoning Branch, China Petroleum Transportation Co., Ltd., Shenyang 110000, China
*
Author to whom correspondence should be addressed.
Processes 2023, 11(4), 1166; https://doi.org/10.3390/pr11041166
Submission received: 16 March 2023
/
Revised: 6 April 2023
/
Accepted: 9 April 2023
/
Published: 11 April 2023
(This article belongs to the Special Issue New Insight in Enhanced Oil Recovery Process Analysis and Application)
Abstract
:Because of the problems, such as the lack of an electric power diagram atlas under different working conditions and the difficulty in intelligent diagnosis of variable torqued pumping unit wells, this paper proposes a diagnosis model of working conditions based on feature recognition. The mathematical relationship model between the polished rod load and motor output power is derived based on the analysis of geometric structure, motion law, and process of energy transformation and transfer of the variable torque pumping unit. It can calculate the electric power diagram based on a dynamometer card. On this basis, the electric power diagram atlas is created, and the feature analysis and eigenvalue extraction of the electric power diagrams under different working conditions are carried out to realize the direct diagnosis of the working conditions in the variable torque pumping unit wells. The application and analysis of examples show that the electric power diagram atlas created in this paper has good practicability, and the working condition diagnosis model accuracy is high. It can provide a theoretical basis and technical support for the intelligent diagnosis of oil production working conditions and improve the intellectual management level of the oilfield, which is conducive to reducing production management costs and improving the oilfield’s production efficiency and benefits.
1. Introduction
Nowadays, most oil fields have entered the middle and later stages of development [1,2,3], and their productivity and benefit are low [4,5]. Especially facing the international situation of low oil prices, how to achieve cost reduction and efficiency increase through scientific management is particularly important [6,7,8,9]. Pumping units are the main method of mechanical oil production in oil fields [10,11]. The variable torque pumping units have become the main type of pumping unit due to their excellent performance, which has great potential for energy saving and consumption reduction. Diagnosing and analyzing its working condition is an important guarantee for the safe operation of oil wells and maximizing oilfield development benefits [12,13]. Generally, dynamometer card diagnosis is the main method to diagnose the working condition of rod pumping wells [14,15,16,17], but there are some limitations: according to the dynamometer card, the working conditions of the wellbore can be analyzed [18,19], but the working conditions of surface cannot be distinguished, such as the balance of pumping unit; for a few oil wells which are difficult to install dynamometer card measuring instrument under special environment, dynamometer card cannot be measured [20]; in addition, the cost to purchase and maintain measuring equipment of dynamometer card is high.
Due to the advantages of convenient and long-term continuous measurement, low installation and maintenance cost, high resolution, and comprehensive information response, the electric parameters can make up for the deficiency of the dynamometer card method very well. Therefore, it is often used in the calculation of the dynamometer cards [21], the balance detection and adjustment of pumping units [22,23], and the diagnosis of oil well working conditions [24,25,26]. However, due to the lack of the electric power diagram atlas, its advantages in working condition diagnosis have yet to be fully popularized and utilized. According to the electric power diagram, it is challenging to realize the direct diagnosis of the working conditions in rod pumping wells. Therefore, it is significant for oilfield production to strengthen the research of the electric power diagram atlas.
Because of the above problems, based on the analysis of geometric structure, motion law, energy transformation process, and transfer of the variable torque pumping unit, this paper deduces the calculation model of an electric power diagram based on a dynamometer card. It creates the electric power diagram atlas of the variable torque pumping unit wells under different working conditions. In addition, through the feature analysis and eigenvalue extraction of the electric power diagram under different working conditions, a diagnosis model based on the electric power diagram is formed, which is conducive to strengthening the intelligent management of the oil field.
2. Materials and Methods
2.1. Technical Ideas
The electric power diagram is a curve with time as the abscissa and motor power as the ordinate, as shown in Figure 1. In different working conditions of oil wells, the electric power diagram shows different shape characteristics due to the different work performed by the motor. Similar to the dynamometer card diagnosis method, if the electric power diagram atlas under different working conditions is obtained, the direct diagnosis of working conditions in the variable torque pumping unit wells can be realized based on the shape characteristics of the electric power diagram. Therefore, through theoretical research and field verification, this paper creates the electric power diagram atlas of the variable torque pumping unit wells under different working conditions and extracts the eigenvalues, providing a theoretical basis for diagnosing the working conditions by electric power diagram. The technical steps are as follows:
(1) A calculation model for electric power diagrams based on dynamometer cards is established first through theoretical research. On this basis, the corresponding electric power diagrams are calculated from typical dynamometer cards under different working conditions and compared with on-site measured electric power diagrams to verify the accuracy of the calculation model. Finally, a typical electric power diagram diagnostic atlas is created.
(2) Perform feature analysis and eigenvalue extraction on the electric power diagram in the diagnostic atlas in order to establish a diagnostic method for electric power diagrams based on feature recognition.
(3) Use the established diagnostic model to analyze and diagnose the on-site measured electric power diagram to obtain the working condition of the oil well. Moreover, compare the diagnostic results with the well’s measured dynamometer card to verify the diagnostic model’s accuracy.
(4) Through the above ideas and steps, direct diagnosis of oil well working conditions based on electric power diagrams can be achieved, thereby solving the problem of some oil wells being unable to diagnose oil well working conditions due to the inability to collect dynamometer cards.
The main technical ideas are shown in Figure 2.
In order to facilitate the analysis and description of graphic features, it is necessary to normalize the electric power diagram, and the specific method is as follows:
where Pgy(i) and Tgy(i) are the normalized power and time of point i respectively; Pmax and Pmin are the maximum and minimum power, (kW); P(i) is the actual power of point i, (kW); Tmax and Tmin are the maximum and minimum time, (m); and T(i) is the actual time of point i, (m).
2.2. Model for Calculating Electric Power Diagram Based on Dynamometer Card
In order to simplify the structure and facilitate the establishment of the model, it made the following assumptions:
(1) It considered the motion between the beam, connecting rod, crank, and base of the pumping unit as a four-bar linkage motion model;
(2) The bottom dead center is the starting point of motion, and the upward direction is the positive direction of displacement;
(3) The clearance between the transmission shafts of the electric motor, gearbox, and crankshaft can be ignored, and the elastic deformation of these three transmission components can be ignored;
(4) The gaps between other transmission pairs and the elastic deformation of the transmission components are not considered during modeling;
(5) The friction between the four-link mechanisms is ignored during modeling;
(6) The motion of the crank and suspension point is a variable speed motion.
Based on the geometric structure of the variable torque pumping unit (as shown in Figure 3), a force analysis was conducted on it.
By balancing the torque of the crank output shaft, it can be concluded that:
Then
where T is the tangential force at the crank pin, (kN); r is the crank radius, (m); Wt is the balance weight converted from crank and crank balance block to crank radius r, (kN); θ is the crank angle, (rad); α is the angle between the crank and connecting rod, (rad); Fp is the force acting on the crank by the connecting rod, (kN).
Based on the balance of the torque at the support point of the beam, we can obtain the following:
where PA is the polished rod load, (kN); B is the structural unbalance value of the pumping unit, (kN); a is the length of the forearm of the walking beam, (m); b is the length of the rear arm of the walking beam, (m); β is the angle between the rear arm and the connecting rod, (rad); mWb is the quality of boom counterweight, (kg); aWb is the acceleration of the center of gravity of the boom counterweight, (m/s2); la is the distance from the counterweight of the lifting arm to the fulcrum of the beam, (m); Wb is the balance weight of the walking beam, (kN); lWb is the distance from the point where the center of gravity of the boom counterweight is projected to the horizontal line to the support center of the walking beam, (m).
By transforming Equation (4), we can obtain the following:
It should be noted that through force analysis, it can be seen that Fp’ is equal to Fp, but in the opposite direction.
Therefore, the torque of the gearbox output shaft is:
Finally, by analyzing the relationship between the input power of the motor and the torque on the gearbox’s output shaft, a calculation model can be established between the polishing rod’s load and the motor’s output power, as shown in Equation (8).
where Nd is the motor power, (kW); n is the stroke, (r/min); ηt is the total transmission efficiency from the motor output shaft to the reducer output shaft, decimal.
2.3. Diagnosis Model on Working Condition
2.3.1. Electric Power Diagram Atlas under Different Working Conditions
Based on the model for calculating the electric power diagram and the production practice, the electric power diagram atlas of the variable torque pumping unit well under different working conditions is created. The typical working conditions of oil wells mainly include the wellbore and surface conditions. The specific classification is shown in Table 1.
The electric power diagram atlas of the variable torque pumping unit well is shown in Figure 4.
2.3.2. Feature Analysis and Eigenvalue Extraction
(1) Normal
The electric power diagram in Figure 4a shows that when the pumping unit is well balanced, the power peak in the upstroke and downstroke is the same, and the changing trend of the power curve is the same. The power curve has an obvious inflection point at the end of loading and unloading in the downstroke. The slope of the curve is larger in the section on loading and unloading and smaller in the section on stable load, which is consistent with the theory. The extracted eigenvalues are as follows:
where Rn is the ratio of the power peak in the upstroke and downstroke.
(2) Fluid pound
The electric power diagram in Figure 4b shows that the changing trend of the power curve in the upstroke is consistent with normal working conditions. The power of the starting section is low, and the change is small because the polished rod load cannot be unloaded in time in the downstroke, and the power curve rises rapidly until the unloading starts. There are inflection points in the power curve at the starting and end points of the unloading, and the time corresponding to the inflection point moves to the left relative to the normal working condition. The time corresponding to the inflection point moves to the left relative to the normal working condition. If the fluid pound is serious, the power of the downstroke cannot reach the maximum value under normal working conditions, so the power peak in the downstroke is slightly less than in the upstroke. The extracted eigenvalues are as follows:
where num() is the number of data points meeting the conditions in brackets; kk(i) is the slope change rate of point i; L(Pgy<0.2) is the length of displacement corresponding to the power curve with normalized power less than 0.2.
(3) Gas interference
The electric power diagram in Figure 4c shows that in the upstroke, due to the delayed opening of the standing valve, the load line of the dynamometer card changes gently, and the corresponding power curve has no obvious inflection point at the end of loading. In the downstroke, due to the delayed opening of the traveling valve, the unloading becomes slower, and the inflection point of the power curve moves to the left relative to the normal working condition. The peak power in the upstroke and downstroke is the same. The extracted eigenvalues are as follows:
(4) Parted rod
The electric power diagram in Figure 4d shows that the power curve is approximately symmetrical about the straight line with a normalized power value of 0.5, the normalized power value in the upstroke is always less than 0.5, and the normalized power value in the downstroke is always greater than 0.5. The extracted eigenvalues are as follows:
(5) Pump hitting up
The electric power diagram in Figure 4e shows that the piston collides with the traveling valve near the top dead center in the upstroke, resulting in a sudden load increase. The corresponding power curve has an obvious bulge near the top dead center. The extracted eigenvalues are as follows:
(6) Pump hitting down
The electric power diagram in Figure 4f shows that the piston collides with the standing valve near the bottom dead center in the downstroke, resulting in a sudden decrease in load. The corresponding power curve has an obvious bulge near the bottom dead center. The extracted eigenvalues are as follows:
(7) Traveling valve leak
The electric power diagram in Figure 4g shows that at the beginning of the upstroke, the load line changes gently because the polished rod load cannot be loaded in time, and the corresponding power curve has no inflection point in the upstroke. At the beginning of the downstroke, the unloading line becomes shorter due to the early unloading of the polished rod load in the second half of the upstroke. Therefore, the corresponding time of the inflection point of the power curve in the downstroke moves to the right relative to the normal working condition. The peak power in the upstroke and downstroke is the same. The extracted eigenvalues are as follows:
where TPmin(0.8–1) is the normalized time corresponding to the minimum normalized power in the range of (0.8, 1).
(8) Standing valve leak
The electric power diagram in Figure 4h shows that at the beginning of the upstroke, the load line of the upstroke becomes shorter due to the advanced loading of the polished rod load at the end of the downstroke of the previous stroke, which makes the time corresponding to the inflection point in the upstroke of the power curve move to the left relative to the normal working condition. At the beginning of the downstroke, the time corresponding to the inflection point in the downstroke of the power curve moves to the left, or there is no obvious inflection point due to the slow unloading. The power peak of the upstroke is slightly higher than that of the downstrokes. The extracted eigenvalues are as follows:
where TPmin(0–0.2) is the normalized time corresponding to the minimum normalized power in the range of (0, 0.2).
(9) Plunger pulling out of the barrel
The electric power diagram in Figure 4i shows that in the upstroke, due to the plunger coming out of the working cylinder, the suspension point suddenly unloaded, and the power in the corresponding power curve decreased rapidly and then increased slowly until the end of the upstroke. There were two obvious inflection points in the power curve. In the downstroke, there is no inflection point in the power curve because there is no unloading section. The power peak of the upstroke is lower than that of the downstroke. The extracted eigenvalues are as follows:
(10) Sand production
The electric power diagram in Figure 4j shows many spikes in the power curve, and the peak ratio of the power in the upstroke and downstroke is difficult to determine due to the uncertainty of sand production. The extracted eigenvalues are as follows:
(11) Overbalanced pumping unit
The electric power diagram in Figure 4k shows that the changing trend of the power curve is the same as that under normal conditions, but the power peak of the upstroke is greater than that of the downstroke. The extracted eigenvalues are as follows:
(12) Underbalanced pumping unit
The electric power diagram in Figure 4l shows that the changing trend of the power curve is the same as that under normal conditions, but the power peak of the upstroke is less than that of the downstroke. The extracted eigenvalues are as follows:
3. Results and Analysis
3.1. Accuracy Test of Model
Taking well X1 in an oilfield as an example, the accuracy of the model is tested. The production parameters of the well are shown in Table 2, and the measured dynamometer card and electric power diagram are shown in Figure 5 and Figure 6.
According to the measured dynamometer card of well X1 (Figure 5), the calculated electric power diagram is compared with the measured electric power diagram (Figure 6) by using the calculation model, as shown in Figure 7.
The error between the calculated and measured electric power diagram is analyzed, and the results are shown in Table 3. According to the error calculation results, the accuracy of the electric power diagram calculated based on the dynamometer card in well X1 is high, and it has a good fitting with the measured electric power diagram, which indicates that the accuracy of the model for calculating electric power diagram in the variable torque pumping unit well has high accuracy.
According to the diagnosis of the dynamometer card, the wellbore condition of well X1 is a fluid pound. Based on the electric power diagram atlas, the wellbore condition of well X1 is a fluid pound, and the surface condition is an underbalanced pumping unit. It can be seen that the diagnosis result of the wellbore condition of well X1 is consistent with that of the dynamometer card, and the balance status of the pumping unit in well X1 can also be diagnosed according to the electric power diagram.
In order to further verify the correctness and practicability of the model for calculating the electric power diagram and the diagnosis model, the working conditions of five variable torque pumping unit wells are diagnosed and analyzed. The results are shown in Table 4.
According to the diagnosis results, the average relative errors of the power peak in the upstroke, the power peak in the downstroke, and the average power between the calculated electric power diagram and the measured electric power diagram are small, which are 4.18%, 1.91%, and 3.67% respectively. It shows that the model for calculating the electric power diagram established in this paper has high accuracy. The electric power diagram atlas calculated by the model has good representativeness and practicability. Moreover, the coincidence rate between the diagnosis results of the electric power diagram and that of the dynamometer card in five oil wells is 100%. The electric power diagram can also accurately diagnose the balance condition of the pumping unit, which shows that the diagnostic model has high accuracy and can provide the basis for the intelligent diagnosis of working conditions in rod pumping well.
3.2. Application and Analysis in the Field
The electric power diagrams of 300 oil wells in an oilfield in China are diagnosed using the diagnostic model. The results are shown in Table 5 and Table 6. It can be seen that the diagnostic accuracy of the wellbore conditions is 92.6%, and the diagnostic accuracy of the surface conditions is 97.3%. It shows that the diagnostic model has high accuracy and can provide a theoretical basis for real-time performance analysis and production optimization.
4. Limitations and Future Scope of the Research
This research mainly extracts the eigenvalues of the electrical power diagram manually and uses computers to recognize these eigenvalues, thus achieving an intelligent diagnosis of working conditions in oil wells. This technology can greatly improve the efficiency of working condition analysis, freeing people from much labor, and is an important trend in the future development of oil fields. Although this research has important application value, there are still the following limitations, which are also our future scope of the research.
(1) Quality assurance of collected data. However, the oilfield has installed many data acquisition equipment and can achieve real-time collection of electric power diagram data. However, production practice has shown many incorrect or distorted data in the database, which undoubtedly will greatly impact the results of oil well condition diagnosis. How to solve the quality assurance problem of collected data is an important research direction in our future. We can carry out this work by improving the stability of data collection equipment and identifying and cleaning abnormal data.
(2) The types of working conditions need to be further expanded. This research mainly established 12 diagnostic electric power diagram models under typical working conditions. However, due to the complexity of oil well production conditions, the actual operating conditions of oil wells also include many other types. Future research focuses on establishing diagnostic models for electric power diagrams under more working conditions (such as belt slipping and gearbox faults).
(3) Further discussion on the interaction between wellbore and surface conditions is needed. Electric power diagrams can be used to diagnose the working conditions of the wellbore equipment and surface equipment. However, both can impact the graphical features of the electric power diagram, which will inevitably cause some interference in the extraction of eigenvalues.
(4) The diagnostic method for working conditions needs further improvement. With the continuous extension of production time, a massive amount of data will be generated, and traditional diagnostic methods that manually extract eigenvalues will not be able to adapt to this situation. With big data analytics in oilfield production [27], modern tools and methods, such as artificial intelligence, artificial neural networks, and machine learning, have provided excellent ideas for diagnosing oil well conditions, which is an important direction for future research. More importantly, data-driven models have strong self-learning abilities. The diagnostic accuracy and range will continue to improve with the data volume increase, giving them unparalleled advantages over mechanism models.
5. Conclusions
Based on the analysis of geometric structure, motion law, the process of energy transformation, and transfer of the variable torque pumping unit, the mathematical relationship model between the polished rod load and motor output power is derived, which is used to calculate the electric power diagram based on dynamometer card. On this basis, the electric power diagram atlas is created. The feature analysis of the electric power diagram under different working conditions is carried out, achieving a direct diagnosis of the working conditions. In addition, it can be combined with dynamometer card diagnosis to improve the accuracy of working condition diagnosis and expand the scope of working condition diagnosis. It is of great significance for improving the real-time monitoring of working conditions in oil well and strengthening the intelligent management of oilfields. The electric power diagrams of 300 oil wells in the oil field were diagnosed and tested. The diagnostic accuracy of the wellbore conditions is 92.6%, and the diagnostic accuracy of the surface conditions is 97.3%. It shows that the diagnostic model has high accuracy, can provide a theoretical basis and technical support for the working condition diagnosis of the oil well production system, and help to reduce the production management costs and improve the production efficiency and benefit of the oilfield.
Author Contributions
Conceptualization, R.Z. and D.C.; methodology, R.Z.; software, R.Z.; validation, R.Z., D.C. and N.L.; formal analysis, D.C.; investigation, N.L.; resources, D.C.; data curation, B.Z.; writing—original draft preparation, R.Z.; writing—review and editing, R.Z.; visualization, B.Z.; supervision, Y.Y.; project administration, D.C.; funding acquisition, R.Z. All authors have read and agreed to the published version of the manuscript.
Funding
This research was funded by the Dongying Science Development Fund (DJ2021003).
Data Availability Statement
The data presented in this study are available on request from the corresponding author. The data are not publicly available as the data is under protection restrictions and university copyright policy.
Conflicts of Interest
The authors declare no conflict of interest.
References
- Sun, Z.; Lin, C.; Du, D.; Bi, H.; Ren, H. Application of seismic architecture interpretation in enhancing oil recovery in late development stage—Taking meandering river reservoir in dongying depression as an example. J. Pet. Sci. Eng. 2019, 187, 106769. [Google Scholar]
- Qin, G.; Dai, X.; Wu, M.; Zheng, Y.; Li, W. Study of massive water huff-n-puff technology in tight oil field and its field application. J. Pet. Sci. Eng. 2020, 196, 107514. [Google Scholar] [CrossRef]
- Han, D. Discussions on concepts, countermeasures and technical routes for the secondary development of high water-cut oilfields. Pet. Explor. Dev. 2010, 37, 583–591. [Google Scholar]
- Zhang, R.; Wang, Z.; Wang, X.; Chen, D.; Bao, B.; Li, Y. Preparation and application of macroscopic behavior chart of pumping unit in high-water-cut oil wells under the constraint of multiple factors. Oil Drill. Prod. Technol. 2018, 40, 94–101. [Google Scholar]
- Chen, D.; Yao, Y.; Fu, G.; Meng, H.; Xie, S. A new model for predicting liquid loading in deviated gas wells. J. Nat. Gas Sci. Eng. 2016, 34, 178–184. [Google Scholar] [CrossRef]
- Deng, J. Uniformed model for energy conservation and optimization of rod-pumped wells. Oil Drill. Prod. Technol. 2016, 38, 842–847. [Google Scholar]
- Zhang, R.; Yin, Y.; Xu, L.; Chen, D.; Xiao, L.; Yang, K. A new intelligent diagnosis method for working conditions in electric submersible pump well based on feature recognition. J. Shengli Coll. China Univ. Pet. 2018, 32, 41–45. [Google Scholar]
- Wu, F.; Li, F.; Zhao, X.; Bolan, N.S.; Fu, P.; Lam, S.S.; Mašek, O.; Ong, H.C.; Pan, B.; Qiu, X.; et al. Meet the challenges in the “Carbon Age”. Carbon Res. 2022, 1, 1. [Google Scholar] [CrossRef]
- Cao, L.; Sun, J.; Zhang, B.; Lu, N.; Xu, Y. Sensitivity analysis of the temperature profile changing law in the production string of a high-pressure high-temperature gas well considering the coupling relation among the gas flow friction, gas properties, temperature, and pressure. Front. Phys. 2022, 10, 1050229. [Google Scholar] [CrossRef]
- Li, K.; Han, Y.; Wang, T. A novel prediction method for down-hole working conditions of the beam pumping unit based on 8-directions chain codes and online sequential extreme learning machine. J. Pet. Sci. Eng. 2018, 160, 285–301. [Google Scholar] [CrossRef]
- Bello, O.; Dolberg, E.P.; Teodoriu, C.; Karami, H.; Devegowdva, D. Transformation of academic teaching and research: Development of a highly automated experimental sucker rod pumping unit. J. Pet. Sci. Eng. 2020, 190, 107087. [Google Scholar] [CrossRef]
- Zhang, R.; Xiao, L.; Chen, D.; Peng, Y.; Qin, Y.; Zhao, T. Balance diagnosis and adjustment of pumping unit based on indicator diagram. China Pet. Mach. 2018, 46, 88–93. [Google Scholar]
- Chen, D.; Xiao, L.; Zhang, R.; Yao, Y.; Peng, Y.; Yang, K. A diagnosis model on working condition of pumping unit in oil wells based on electrical diagrams. J. China Univ. Pet. (Ed. Nat. Sci.) 2017, 41, 108–115. [Google Scholar]
- Feng, K.; Jiang, Z.; He, W.; Bo, M. A recognition and novelty detection approach based on Curvelet transform, nonlinear PCA and SVM with application to indicator diagram diagnosis. Expert Syst. Appl. 2011, 38, 12721–12729. [Google Scholar] [CrossRef]
- Lv, X.; Wang, H.; Liu, Y.; Yan, X.; Sheng, S.; Wen, J.; Bing, Y. A novel method of output metering with dynamometer card for SRPS under fault conditions. J. Pet. Sci. Eng. 2020, 192, 107098. [Google Scholar] [CrossRef]
- Xu, P.; Xu, S.; Yin, H. Application of self-organizing competitive neural network in fault diagnosis of suck rod pumping system. J. Pet. Sci. Eng. 2007, 58, 43–48. [Google Scholar] [CrossRef]
- Hua, L.; Li, X. Accurate extraction of valve opening and closing points based on the physical meaning of surface dynamometer card. Pet. Explor. Dev. 2011, 38, 109–115. [Google Scholar] [CrossRef]
- Zheng, B.; Gao, X. Sucker rod pumping diagnosis using valve working position and parameter optimal continuous hidden Markov model. J. Process Control 2017, 59, 1–12. [Google Scholar] [CrossRef]
- Zheng, B.; Gao, X.; Li, X. Diagnosis of Sucker Rod Pump based on generating dynamometer cards. J. Process Control 2019, 77, 76–88. [Google Scholar] [CrossRef]
- Sun, D. Research on the technology of remote intelligent fault diagnosis based on electrical parameters of pumping unit. Process Autom. Instrum. 2012, 33, 22–24. [Google Scholar]
- Li, J.; Zhi, L. Predicting dynamometer cards by actual motor power curves. Pet. Geol. Oilfield Dev. Daqing 1991, 10, 63–67. [Google Scholar]
- Tan, C.; Feng, Z.; Liu, X.; Fan, J.; Cui, W.; Sun, R.; Ma, Q. Review of variable speed drive technology in beam pumping units for energy-saving. Energy Rep. 2020, 6, 2676–2688. [Google Scholar] [CrossRef]
- Zhang, D. Study of Power Balance Technology on Beam Pumping Unit. In Proceedings of the 2nd International Conference on Measurement, Information and Control (ICMIC), Harbin, China, 16–18 August 2013. [Google Scholar]
- Lea, J.; Bowen, J. Dynamic measurements of beam-pump parameters. SPE Prod. Eng. 1992, 7, 113–120. [Google Scholar] [CrossRef]
- Zhang, K.; Wang, Q.; Wang, L.; Zhang, H.; Zhang, L.; Yao, J.; Yang, Y. Fault diagnosis method for sucker rod well with few shots based on meta-transfer learning. J. Pet. Sci. Eng. 2022, 212, 110295. [Google Scholar] [CrossRef]
- Zhang, R.; Wang, Z.; Wang, X.; Wang, J.; Zhang, G.; Chen, D. Integrated Diagnostics Method and Application of Ground and Downhole Working Condition in Rod Pumping Well. J. Appl. Sci. Eng. 2018, 24, 615–624. [Google Scholar]
- Desai, J.N.; Pandian, S.; Vij, R.K. Big data analytics in upstream oil and gas industries for sustainable exploration and development: A review. Environ. Technol. Innov. 2020, 21, 101186. [Google Scholar] [CrossRef]
Figure 1.
Electric power diagram.
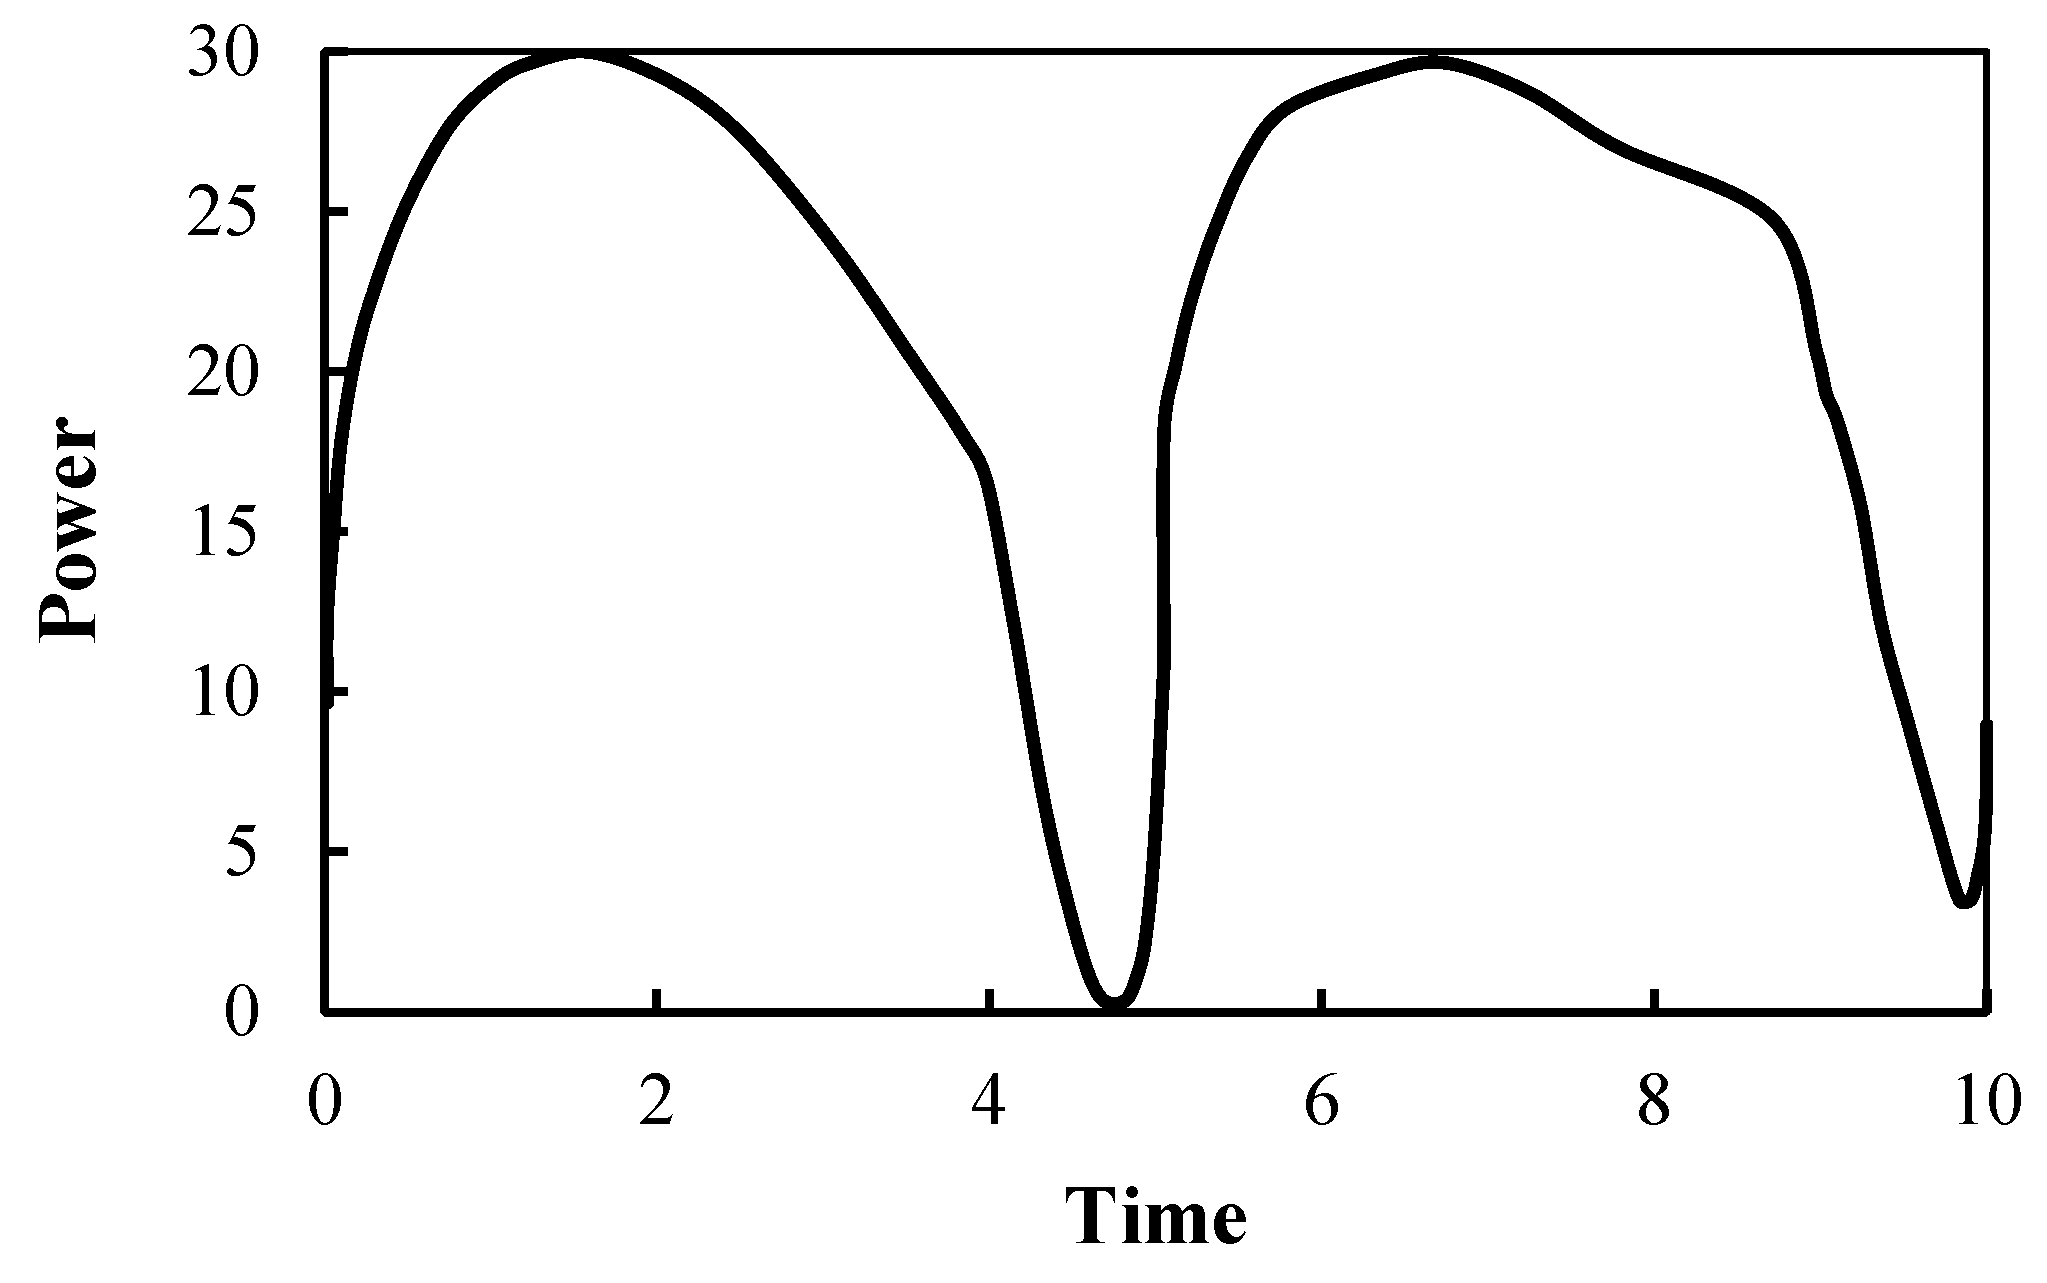
Figure 2.
Flow chart of technical ideas.
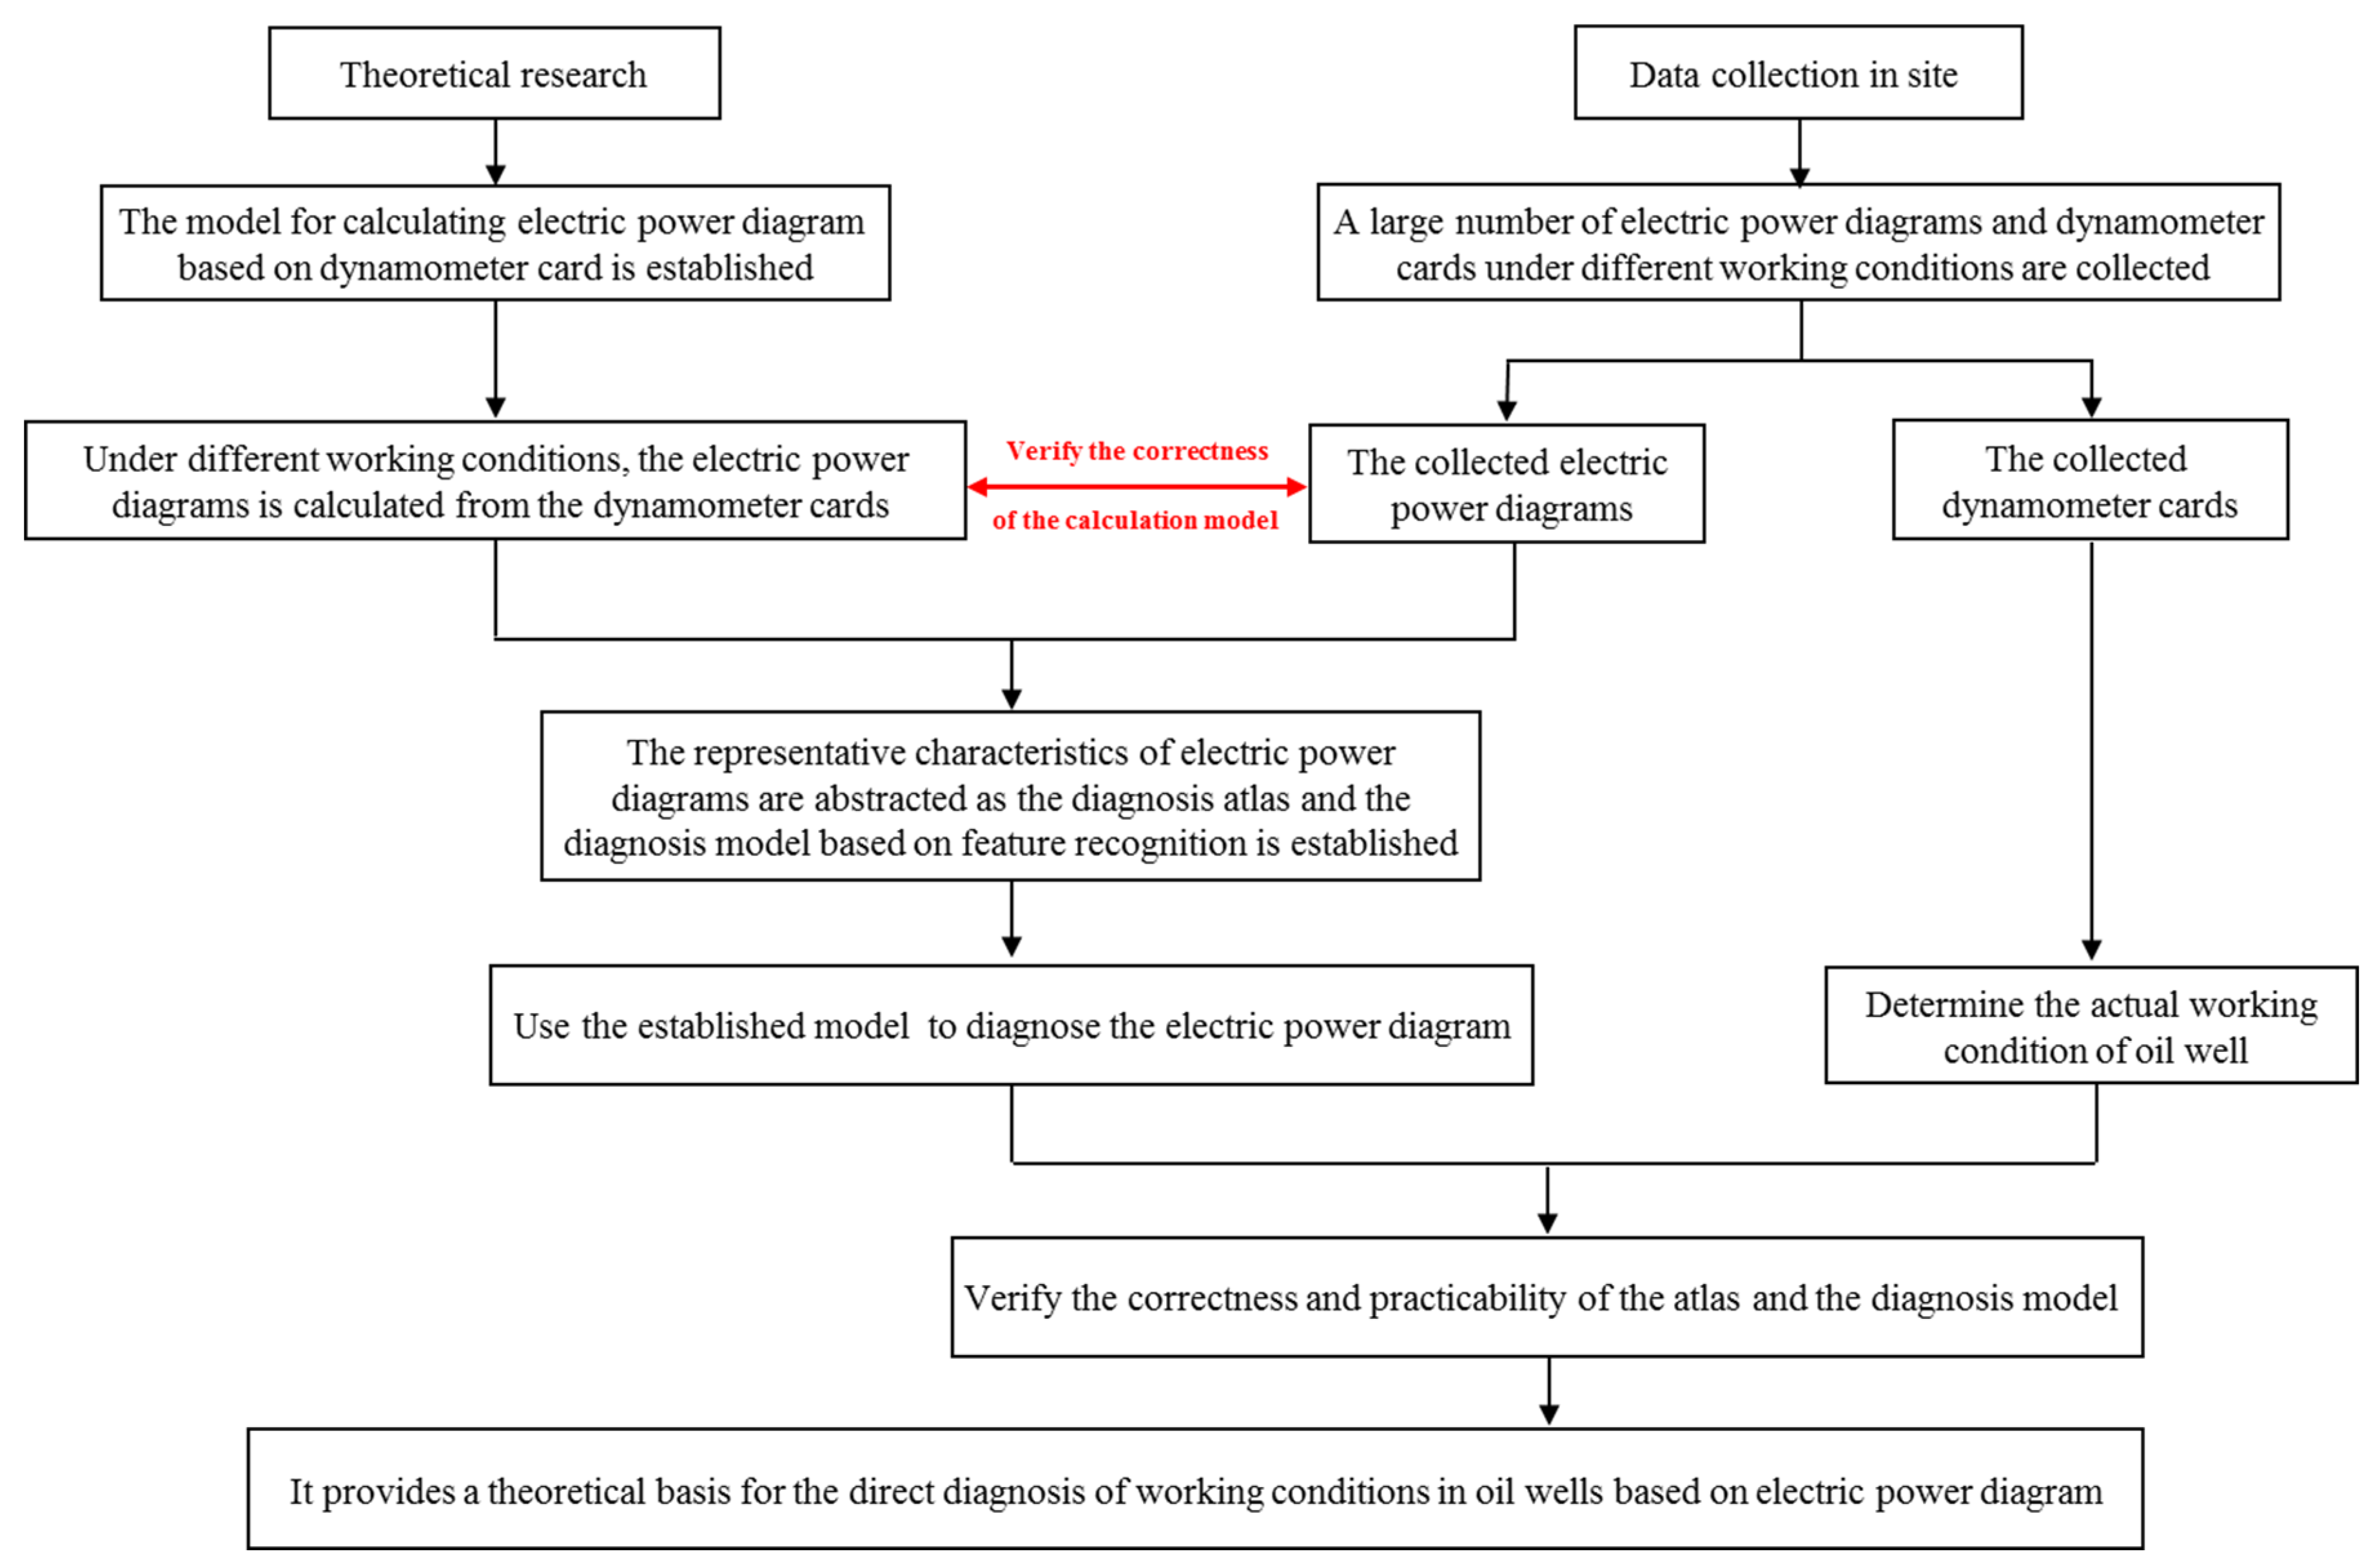
Figure 3.
Geometric structure of the variable torque pumping unit.

Figure 4.
Electric power diagram atlas of variable torque pumping unit well.
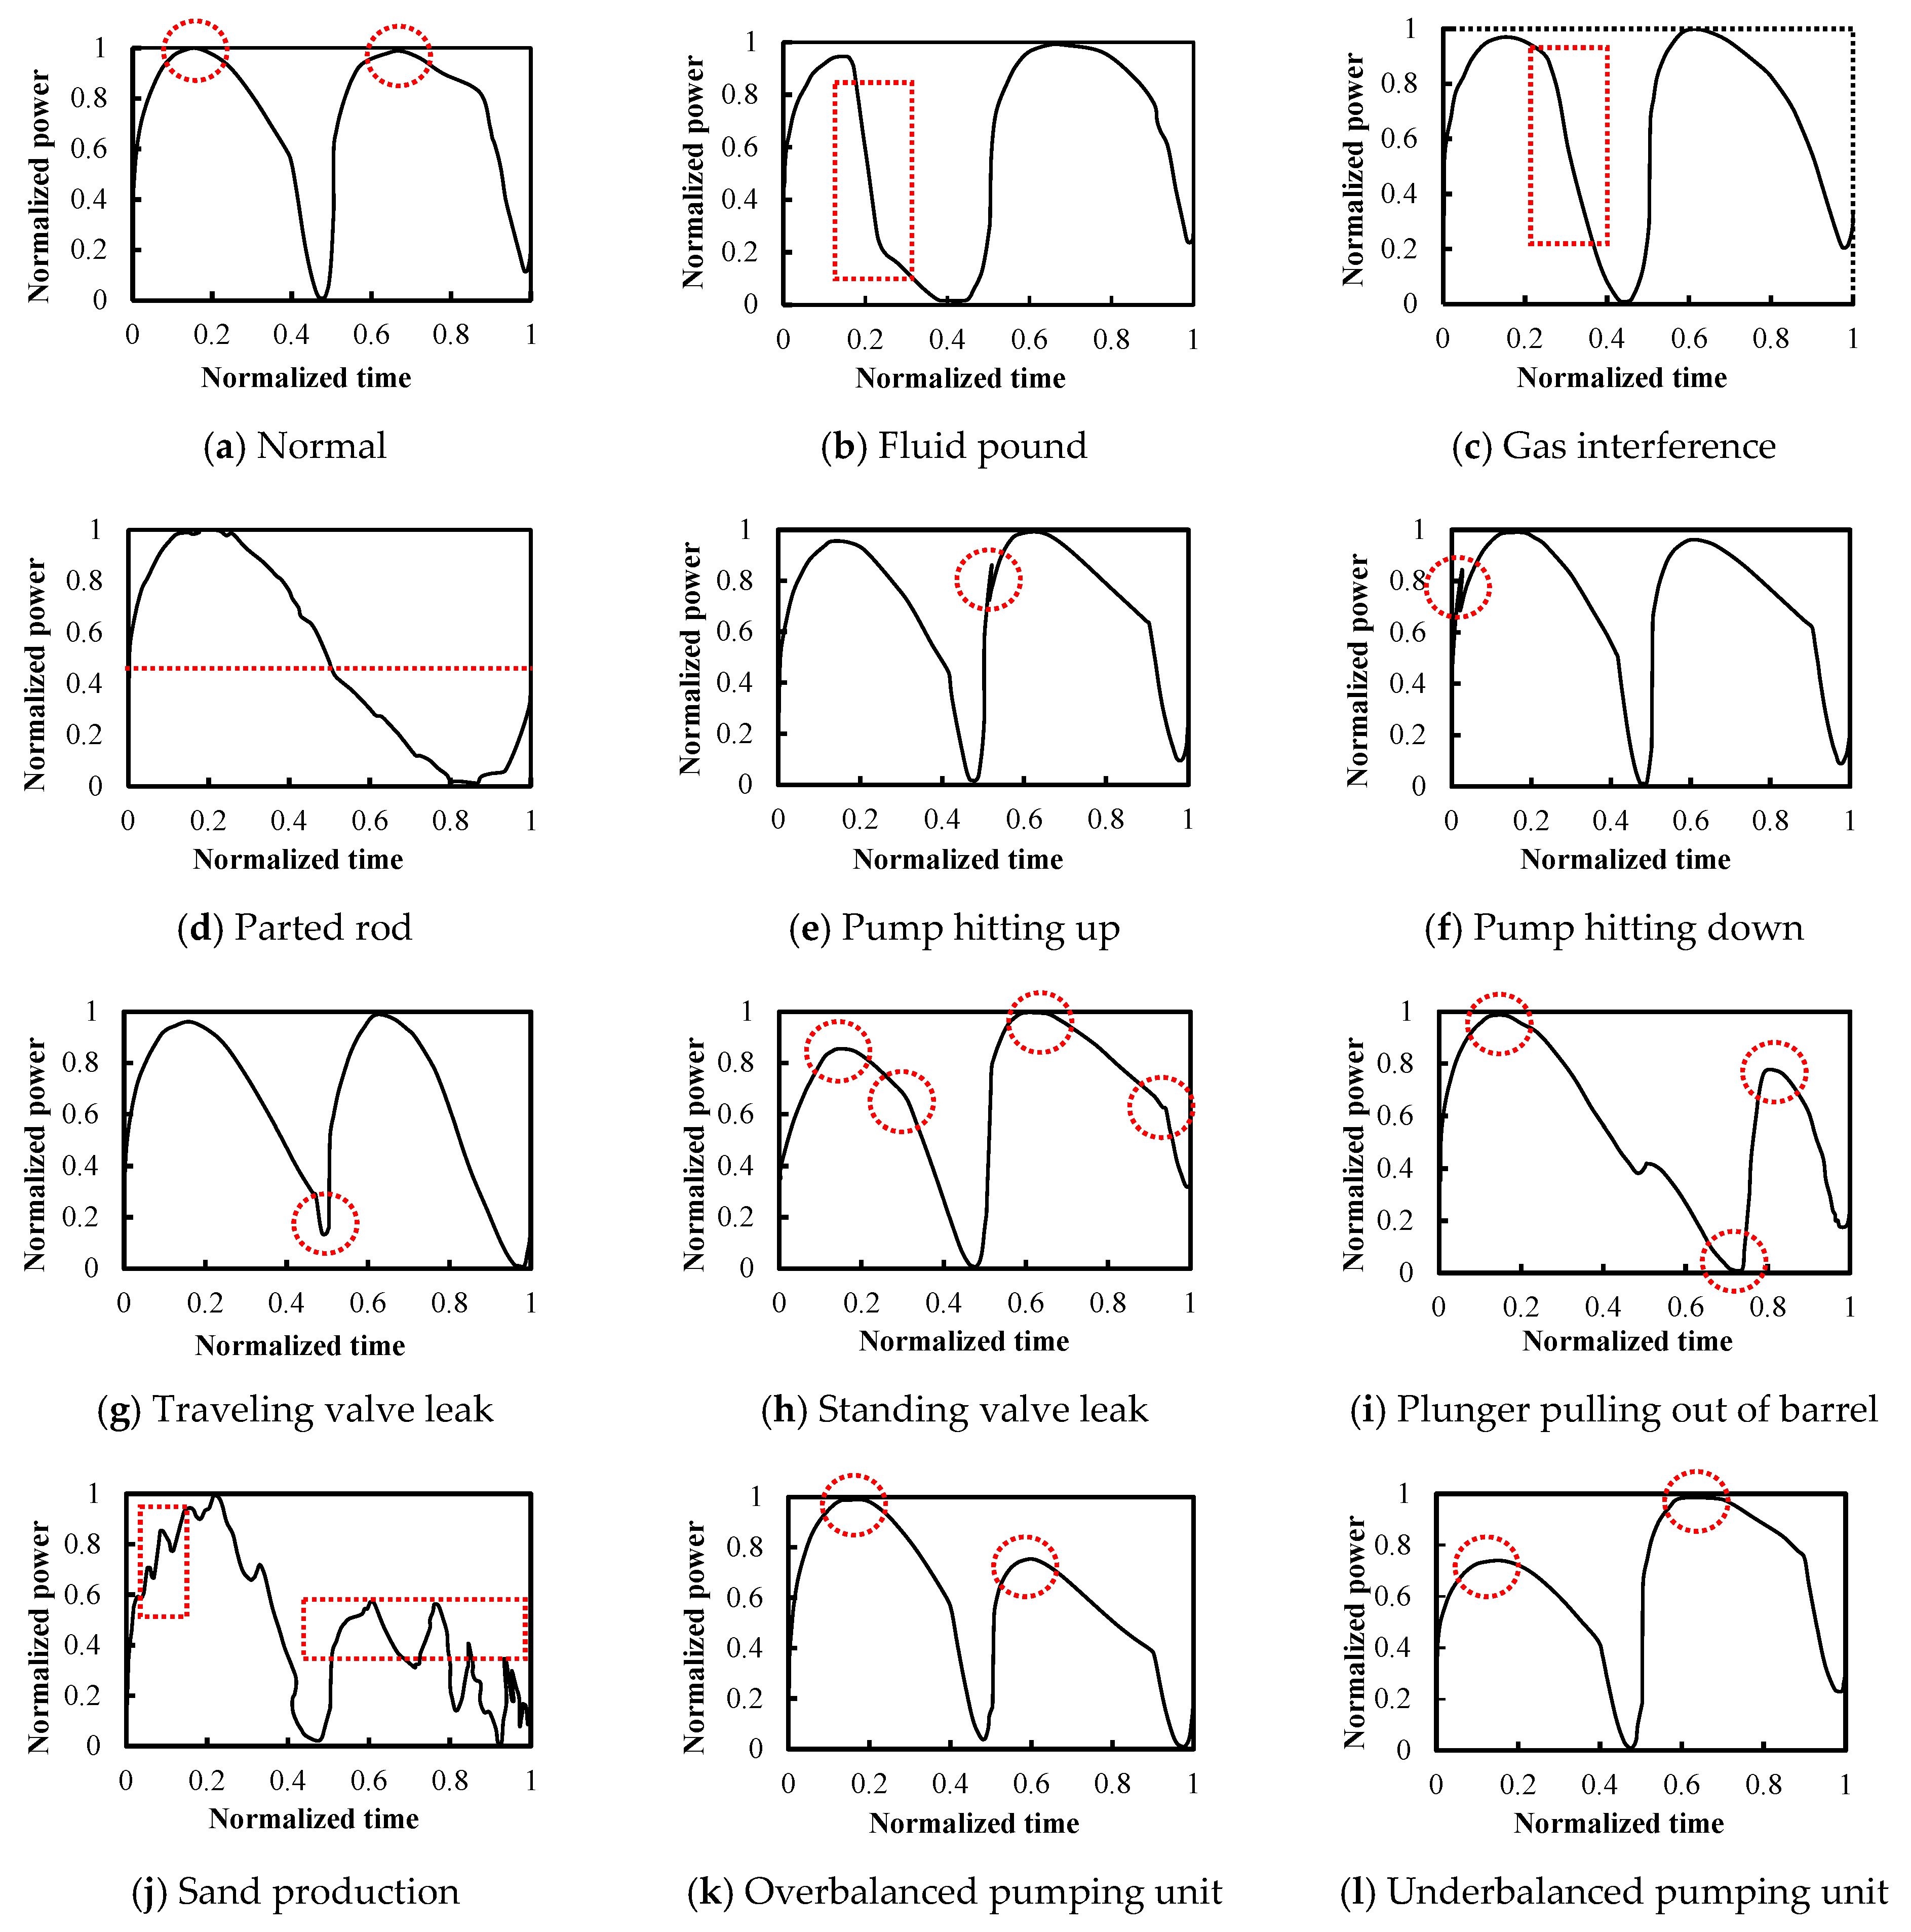
Figure 5.
Measured dynamometer card.
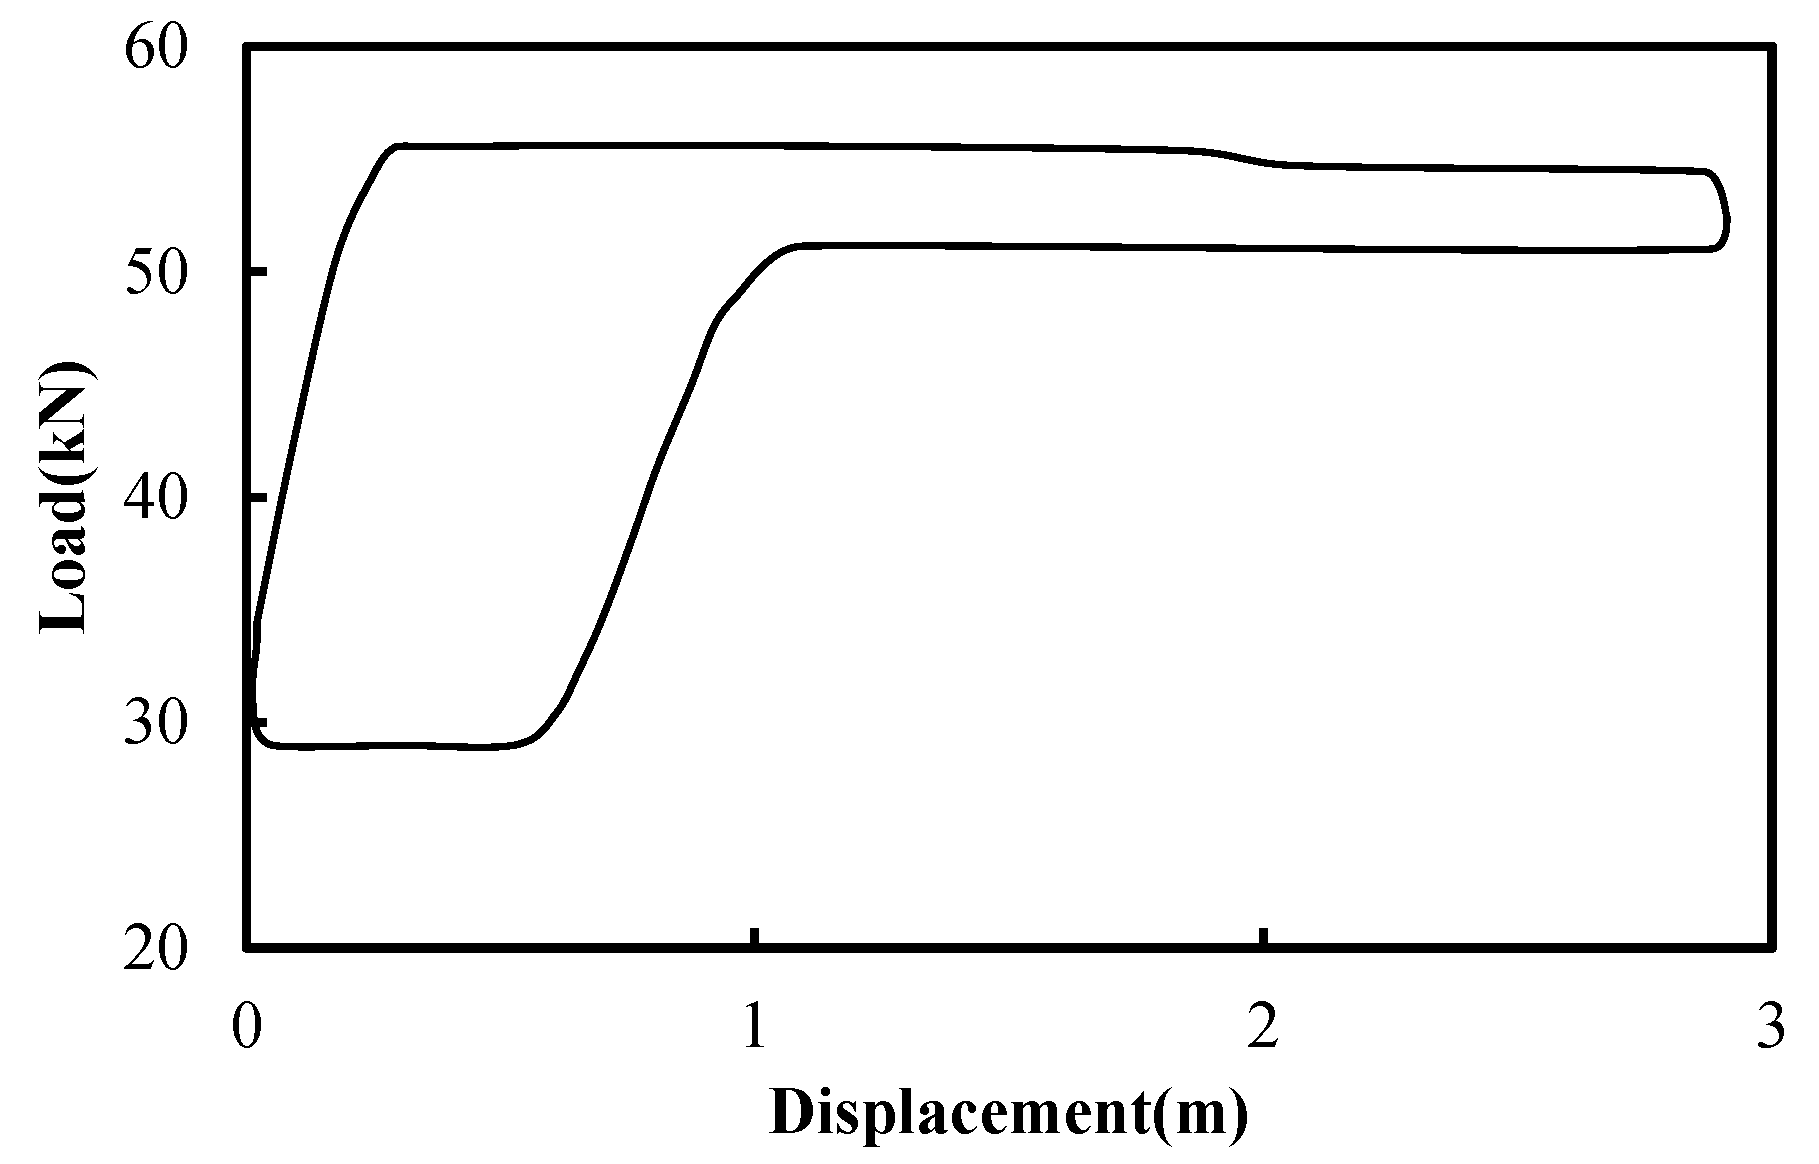
Figure 6.
Measured electric power diagram.
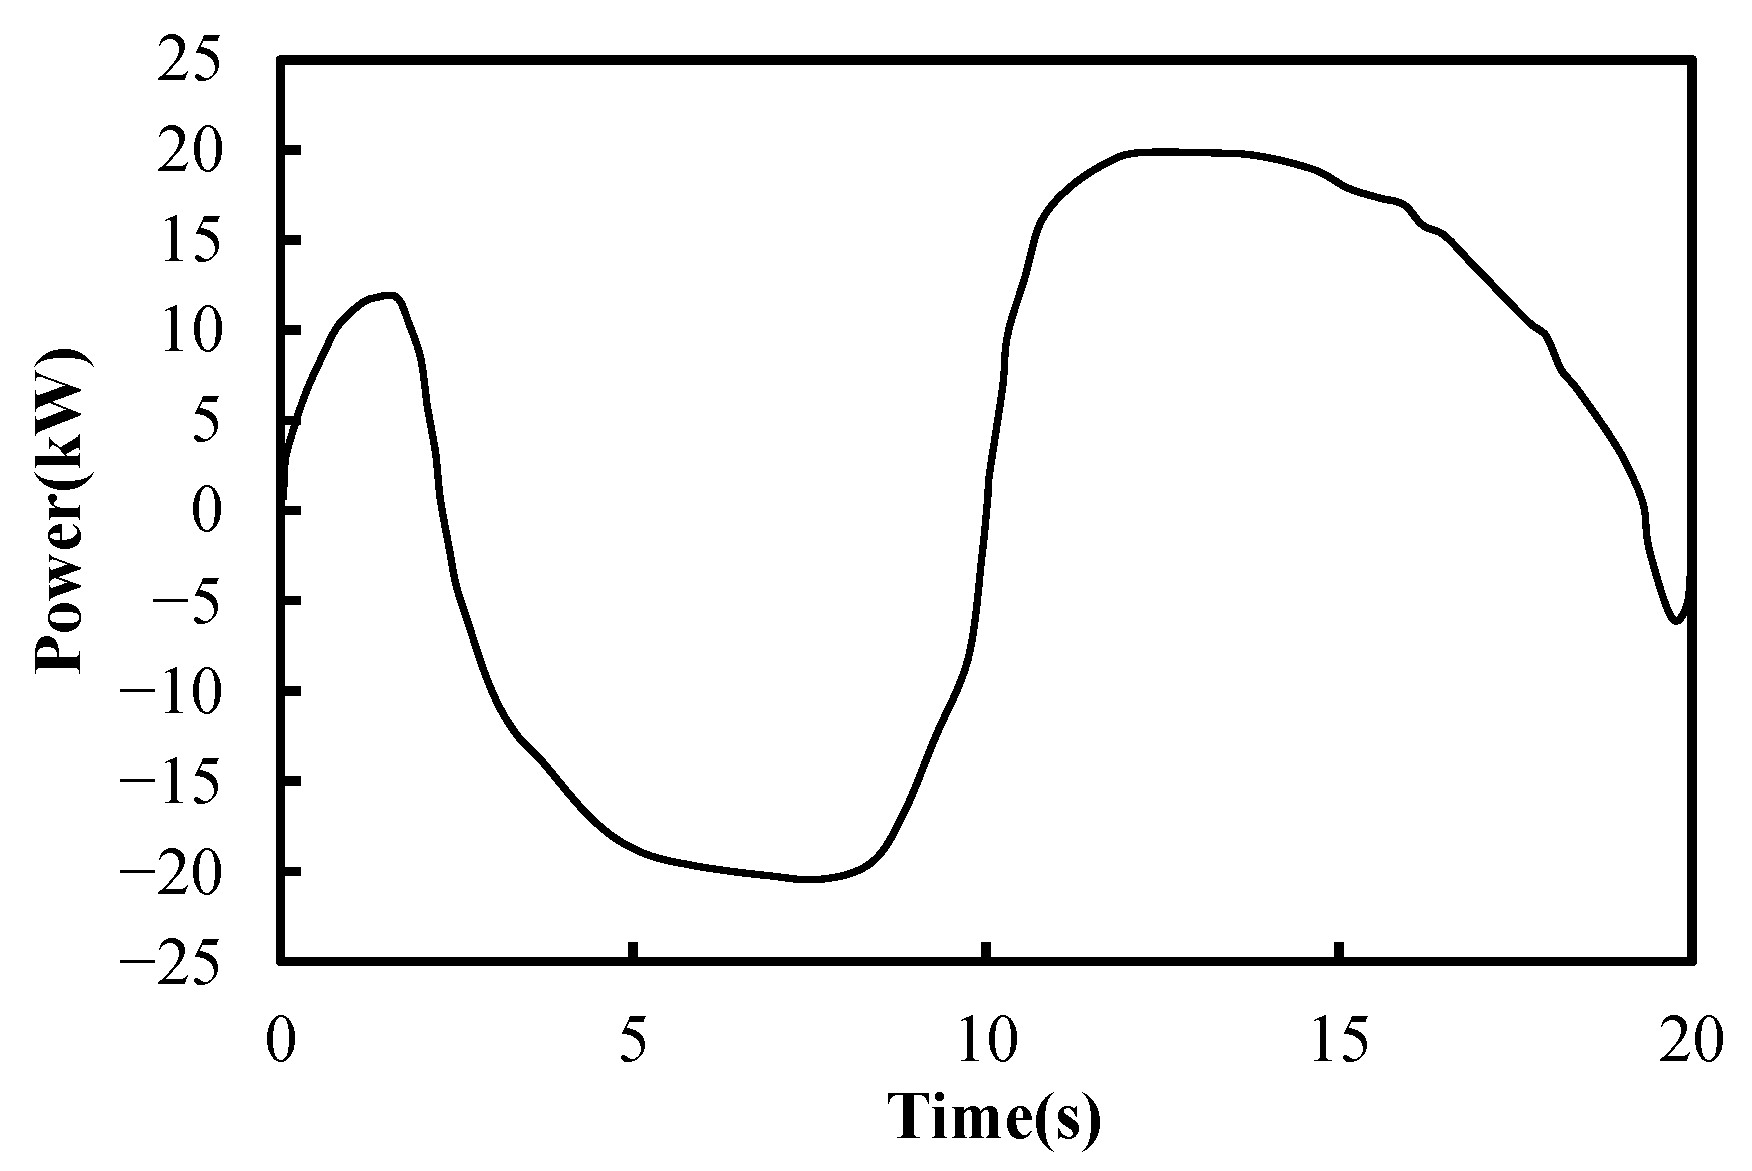
Figure 7.
Measured and calculated the electric power diagram of well X1.


Table 1.
Classification of working conditions.
| Type of Equipment | Number | Type of Working Conditions | Number | Type of Working Conditions |
|---|---|---|---|---|
| Wellbore conditions | 1 | Normal | 2 | Fluid pound |
| 3 | Gas interference | 4 | Parted rod | |
| 5 | Pump hitting up | 6 | Pump hitting down | |
| 7 | Traveling valve leak | 8 | Standing valve leak | |
| 9 | Plunger pulling out of barrel | 10 | Sand production | |
| Surface conditions | 11 | Overbalanced pumping unit | 12 | Underbalanced pumping unit |
Table 2.
Production parameters of well X1.
| Type of Pumping Unit | Type of Motor | Angle between Beam and Boom (°) | Counterweight of Boom (kN) | Structural Unbalance Weight (kN) | Stroke (m) | Stroke Frequency (min−1) |
|---|---|---|---|---|---|---|
| CYJT8-3-37HY | Y200L-8 | 42.8 | 4.79 | −0.97 | 3 | 3 |
Table 3.
Error analysis table.
| Relative Error Name | Calculated Value/kW | Measured Value/kW | Relative Error Value/% |
|---|---|---|---|
| The relative error of the power peak in the upstroke Er(u max) | 19.803 | 19.847 | 0.22 |
| The relative error of the power peak in the downstroke Er(d max) | 12.817 | 12.427 | 3.14 |
| The relative error of the difference between the maximum power and the minimum power Er(ΔPmax) | 40.123 | 40.267 | 0.36 |
| The relative error of average power | 11.287 | 10.607 | 6.41 |
Table 4.
Diagnosis results.
| Well Name | Dynamometer Card | Electric Power Diagram | Er(u max) | Er(d max) | Diagnosis of Dynamometer Card | Diagnosis of Electric Power Diagram | |
|---|---|---|---|---|---|---|---|
| X2 | 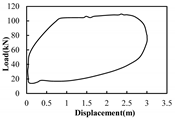 |  | 0.45% | 0.32% | 2.38% | Traveling valve leak | Traveling valve leak; Underbalanced pumping unit |
| X3 | 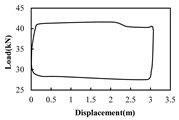 | 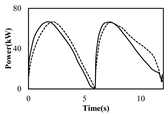 | 6.72% | 1.72% | 5.22% | Normal condition | Normal condition; Pumping unit well balanced |
| X4 | 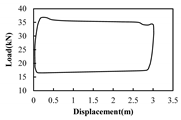 | 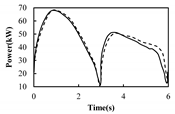 | 4.86% | 2.45% | 1.81% | Normal condition | Normal condition; Overbalanced pumping unit |
| X5 | 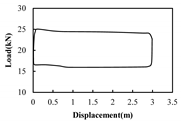 |  | 3.58% | 2.12% | 6.91% | Normal condition | Normal condition; Underbalanced pumping unit |
| X6 |  | 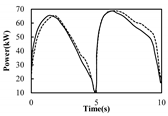 | 5.28% | 2.94% | 2.03% | Normal condition | Normal condition; Pumping unit well balanced |
| Average of relative error | 4.18% | 1.91% | 3.67% | ----- | |||
Table 5.
Diagnosis results of wellbore condition.
| Wellbore Conditions | Well Count | Proportion | Electric Power Diagram Diagnosis Results | |
|---|---|---|---|---|
| Accurate Diagnosis Well Count | Accuracy | |||
| Normal | 163 | 54.3% | 151 | 91.6% |
| Fluid pound | 32 | 10.7% | 30 | 93.8% |
| Gas interference | 24 | 8.0% | 23 | 95.8% |
| Parted rod | 10 | 3.3% | 9 | 90.0% |
| Pump hitting up | 13 | 4.3% | 11 | 84.6% |
| Pump hitting down | 8 | 2.7% | 8 | 100% |
| Traveling valve leak | 15 | 5.0% | 14 | 93.3% |
| Standing valve leak | 18 | 6.0% | 16 | 88.9% |
| Plunger pulling out of barrel | 4 | 1.4% | 4 | 100% |
| Sand production | 13 | 4.3% | 12 | 92.3% |
| Total | 300 | 100% | 278 | 92.6% |
Table 6.
Diagnosis results of surface condition.
| Surface Conditions | Number of Wells | Proportion | Electric Power Diagram Diagnosis Results | |
|---|---|---|---|---|
| Number of Wells Accurately Diagnosed | Accuracy | |||
| Well balanced pumping unit | 178 | 59.3% | 175 | 98.3% |
| Overbalanced pumping unit | 59 | 19.7% | 57 | 96.6% |
| Underbalanced pumping unit | 63 | 21.0% | 60 | 95.2% |
| Total | 300 | 100% | 292 | 97.3% |
Disclaimer/Publisher’s Note: The statements, opinions and data contained in all publications are solely those of the individual author(s) and contributor(s) and not of MDPI and/or the editor(s). MDPI and/or the editor(s) disclaim responsibility for any injury to people or property resulting from any ideas, methods, instructions or products referred to in the content. |
© 2023 by the authors. Licensee MDPI, Basel, Switzerland. This article is an open access article distributed under the terms and conditions of the Creative Commons Attribution (CC BY) license (https://creativecommons.org/licenses/by/4.0/).
Share and Cite
MDPI and ACS Style
Zhang, R.; Chen, D.; Lu, N.; Zhang, B.; Yang, Y. Intelligent Diagnosis Model of Working Conditions in Variable Torque Pumping Unit Wells Based on an Electric Power Diagram. Processes 2023, 11, 1166. https://doi.org/10.3390/pr11041166
AMA Style
Zhang R, Chen D, Lu N, Zhang B, Yang Y. Intelligent Diagnosis Model of Working Conditions in Variable Torque Pumping Unit Wells Based on an Electric Power Diagram. Processes. 2023; 11(4):1166. https://doi.org/10.3390/pr11041166
Chicago/Turabian StyleZhang, Ruichao, Dechun Chen, Nu Lu, Bo Zhang, and Yanjie Yang. 2023. "Intelligent Diagnosis Model of Working Conditions in Variable Torque Pumping Unit Wells Based on an Electric Power Diagram" Processes 11, no. 4: 1166. https://doi.org/10.3390/pr11041166
Note that from the first issue of 2016, this journal uses article numbers instead of page numbers. See further details here.