Article

Integrated a Fused Silica Capillary Cell and In Situ Raman Spectroscopy for Determining the Solubility of CO2 in n-Decane and n-Decane + n-Hexane System

1
College of Environment, Zhejiang University of Technology, Hangzhou 310032, China
2
Hangzhou Institute of Eco-Environmental Sciences, Hangzhou 310032, China
*
Author to whom correspondence should be addressed.
Processes 2023, 11(4), 1137; https://doi.org/10.3390/pr11041137
Submission received: 3 February 2023 / Revised: 20 March 2023 / Accepted: 30 March 2023 / Published: 7 April 2023

Abstract

:
Understanding the solubility of CO2 is critical for implementing CO2-enhanced oil recovery (CO2-EOR). In this work, the solubility of CO2 in n-decane in a temperature range between 303.15 K and 353.15 K and pressures up to 15 MPa was measured using a fused silica capillary cell with in situ Raman spectroscopy. A semi-empirical CO2 solubility prediction model was obtained according to the experimental results. In order to improve the solubility of CO2 in n-decane, the solubility of CO2 in n-decane and co-solvent n-hexane (3% wt) mixture was also comparatively investigated. The results indicated that the solubility of CO2 in n-decane was 1.6355~64.0084 mol/kg. The data from the prediction model were in good agreement with the experimental data, and the mean relative deviation was 3.65%, indicating that the prediction model could be used to predict the solubility of CO2 in n-decane under different conditions. The solubility of CO2 in n-decane + n-hexane system ranged from 1.0127 mol/kg to 65.7286 mol/kg. It was found that, under low-pressure conditions, the addition of co-solvent n-hexane did not enhance the solubility of CO2, while it had a certain enhancement effect on the dissolution of CO2 under high-pressure conditions. As the temperature increased from 303.15 K to 353.15 K, the enhancement efficiency of the solubility of CO2 also increased from 1.34~2.05% to 8.17~9.82%, and the average enhancement efficiency increased from 1.74% to 9.00%. This study provides more CO2 solubility data for CO2-EOR.

1. Introduction

Global warming has become a crucial and pressing environmental issue, and CO2 has been considered as one of the foremost contributors [1,2,3,4]. Therefore, reducing the content of CO2 in the atmosphere is of vital importance. Carbon Capture Utilization and Storage (CCUS) is a potential technology for carbon emissions’ reduction, for which CO2-enhanced oil recovery (CO2-EOR) is one of the main application methods [5,6,7,8]. CO2-EOR, injecting CO2 into oil reservoir, not only can sequestrate a large amount of CO2, but also can improve crude oil recovery [9,10]. Since Wharton obtained the first patent for CO2-EOR in 1952, many countries in the world have carried out a large number of laboratory and oilfield experiments on CO2 flooding [11,12]. Since 2000, reservoir engineering research has been carried out by combining CO2-EOR with CO2 geological storage [13]. The physical characteristics and phase behavior of gas/oil system are required for conducting CO2-EOR and CO2 geological storage, and this information plays an important role in engineering [14]. However, the solubility of CO2 in crude oil reveals the difficulty of miscibility in CO2 flooding. Therefore, dissolution parameters of CO2 in crude oil are urgently needed in reservoir engineering and evaluation of oil and gas reserves [15].
In recent years, a large number of scholars have explored the phase equilibrium and critical properties of CO2 in various simulated oils/crude oils. Rafael et al. [16] employed a semi-flow device to investigate the phase equilibrium of CO2 + n-octadecane system in a temperature range between 310 K and 353 K and pressure from 10 MPa to 20 MPa. Liu et al. [17] proposed the critical properties of the binary mixing system (hexane + methanol, hexane + CO2 and methanol + CO2) and the ternary mixing system (CO2 + hexane + methanol) by using a high-pressure balance kettle with visual observation. Fabrice et al. [18] used a high-pressure, variable-volume visual balance kettle to statically measure the phase equilibrium of CO2 and n-heptane/2,5-dimethylhexane/octane/3-methylpentane under the conditions of 1.2~13.4 MPa and 278.15~413.15 K. Camacho-Camacho et al. [19] presented a static analysis to determine the phase equilibrium of CO2 with n-nonane and n-undecane under four temperature conditions (315 K, 344 K, 373 K, and 418 K). Yang et al. [20] reported the solubility and expansion coefficient of CO2 in kerosene, tetradecane, white oil, and mixed oil at 313.15 K using a fixed-volume high-pressure balanced kettle. Kavousi et al. [14] conducted experimental research of the solubility of CO2 in oils with different viscosity, and discussed the influences of temperature and pressure (1.73~4.48 MPa and 295~305 K) on the dissolution. Braeuer [21] et al. investigated the mass transfer quantitatively in the compressible ternary multi-phase system composed of the oil component ethyl acetate, water, and carbon dioxide at the elevated pressure of 8.5 MPa and at temperatures of 298 K and 310.5 K. Pollak [22] et al. investigated the Solubility of pressurized carbon dioxide in three different polydimethylsiloxanes at 25 °C, 40 °C, and 60 °C and at pressures of up to 30 MPa.
Previous studies on the solubility of CO2 in a simulated oil system mainly used PVT sampling analysis, chromatographic analysis, etc. [23,24]. However, previous studies usually judged whether the system reaches equilibrium according to the pressure or bubble point (the pressure point when the gas phase disappears), which has a certain subjective error in the experiment. The sampling analysis method may change the original temperature and pressure and destroy the equilibrium of the system. In addition, the temperature and pressure ranges in the previous studies were relatively narrow. Raman spectroscopy is an effective optical, non-destructive, sensitive, and fast analytical method which can be used to determine the composition of substances and qualitative analysis [25,26]. The Raman peak intensity ratio can reflect the variation of the concentration of solute and solvent, which reveals the change of materials in the system [27,28]. Due to the composition of crude oil being very complex, understanding the process of CO2-EOR should be necessary for selecting a representative model compound such as alkane for consideration. Thus, in this study, the solubility of CO2 in n-decane at different temperatures (303.15~353.15 K) and pressures (~15 MPa) was determined by using a fused silica capillary cell (FSCC), combined with a heating cooling stage and an in situ Raman spectroscopy. Meanwhile, a semi-empirical model was established according to the experimental results. In addition, due to the mutation of the solubility of CO2 in n-decane within the range of minimum miscible pressure, the co-solvent method was used to reduce the minimum miscible pressure in the process of CO2 flooding so as to investigate the influence of co-solvent n-hexane (3 wt%) on the solubility of CO2.

2. Materials and Methods

2.1. Materials

All chemicals were purchased commercially and used as received. Carbon dioxide (CO2, CAS No.124-38-9, with purity of 99.995%) was purchased from Pujiang special gas Co., Ltd. (Shanghai, China). N-decane (C10H22, CAS No.124-18-5, with purity of 99%) and n-hexane (C6H14, CAS No.110-54-3, with purity of 98%) were supplied by Aladdin Chemistry Co., Ltd. (Shanghai, China). The silica capillary tubing type TSP300665 (665 μm O.D. and 300 μm I.D. with polyimide coating) was purchased from Polymicro Technologies LLC (Phoenix, AZ, USA). All valves and high-pressure stainless-steel tube were purchased from Nantong Huaxing Petroleum Instrument Co., Ltd. (Nantong, China).

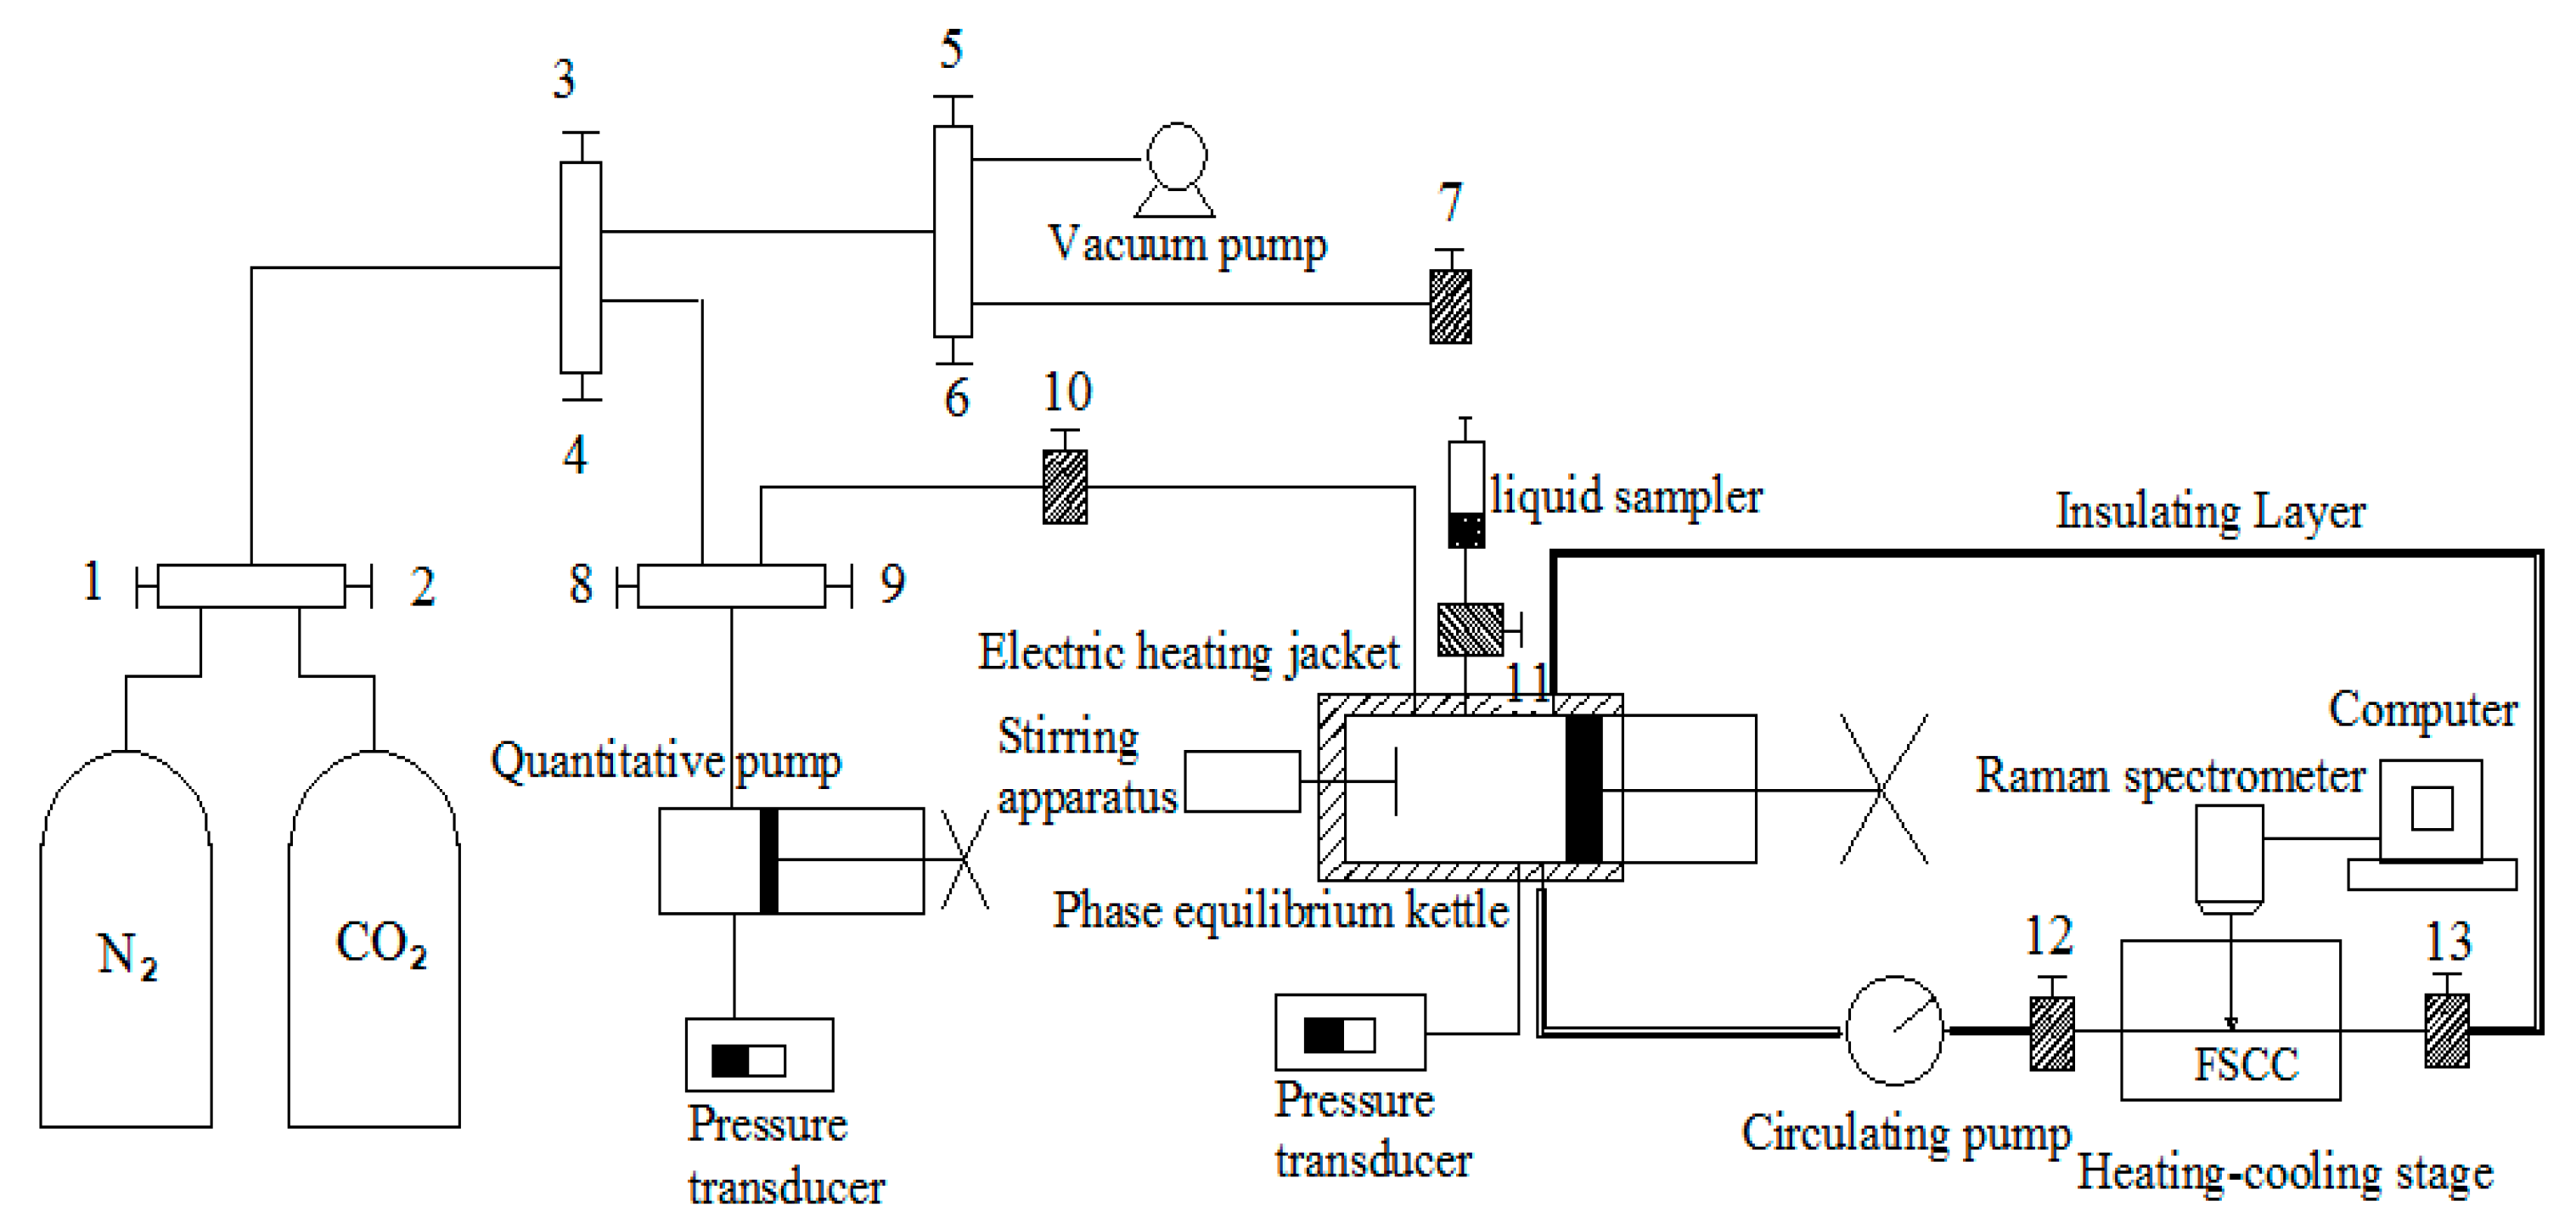
2.2. Experimental Apparatus

The solubility of CO2 in n-decane and n-decane + n-hexane system at 303.15 to 353.15 K and 0 to 15.0 Mpa was carried out on a fused silica capillary cell (FSCC) with an in situ Raman spectroscopy, which is described in Figure 1. It consisted of a FSCC combined with a heating–cooling stage (Linkam, CAP500, Redhill, UK), an in situ Raman spectroscopy (Horiba JobinYvon, HR800, Palaiseau, France), a phase equilibrium kettle with a magnetic stirrer and an electric heating jacket, a manual pressure pump, a 70 MPa pressure generator, a circulating pump, and a quantitative pump. The temperature in the phase equilibrium kettle was controlled by the electric heating jacket (accurate to ±0.1 °C), and the temperature in the FSCC was controlled via the heating–cooling stage in conjunction with a digital temperature controller (Linkam, T95, Redhill, UK, accurate to ±0.1 °C). The connecting tube between the FSCC and phase equilibrium kettle was wrapped with an insulation layer to maintain the fluid temperature in the whole setup. The pressure in the FSCC and phase equilibrium kettle was adjusted with the 70 MPa pressure generator and measured with a Setra 206 pressure transducer (70 MPa full scale, accurate to ±0.25%FS). Pressure in the quantitative pump was measured using a pressure transducer (30 MPa full scale, accurate to ±0.25% FS).

2.3. Experimental Procedure

Determining the solubility of CO2 in n-decane and n-decane + n-hexane system at different temperatures and pressures consisted of two parts. The first part was to draw the standard curve between CO2 concentration and the Raman peak intensity ratio of CO2 + n-decane system and verify whether the standard curve is suitable for CO2 + n-decane + n-hexane system. Before each experiment, a certain amount of N2 was injected into the kettle and the pressure was recorded over 2 h to test the gas tightness of the apparatus. Then, the kettle was emptied with a vacuum pump to 0.01 MPa. (1) At room temperature (about 293.15 K), a certain amount of n-decane or n-decane + n-hexane was injected into the phase equilibrium kettle with a modified liquid injector; (2) A certain amount of CO2 was then injected into the phase equilibrium kettle, and the temperature and pressure were recorded before and after the injection of CO2. The amount of CO2 injected was calculated by the PR equation; (3) The system pressure was increased to about 30.0 MPa using the manual pressure pump, and the magnetic stirrer was turned on to accelerate the dissolution of CO2 in n-decane or n-decane + n-hexane system; (4) The circulating pump was turned on for about 15 min to ensure the homogeneity of the mixture in the whole circulation line, and then the Raman spectra of the mixture were collected; (5) Repeat the step (4) until the standard deviation of the Raman peak intensity ratios between the CO2 Fermi diad and the C-H stretching band of n-decane or n-decane + n-hexane was less than 0.0003, which could be considered the point at which the system had reached the dissolution equilibrium [29]; (6) When the mixture was certified to have reached phase equilibrium, the Raman peak intensity ratio of CO2 + n-decane or CO2 + n-decane + n-hexane under different temperatures and pressures (303.15~353.15 K and 0~15.0 MPa) was measured and recorded; (7) The CO2 concentration was changed, and steps (2)–(6) were repeated; (8) The standard curve of CO2 concentration and the Raman peak intensity ratio of CO2 + n-decane were established, and then it was verified whether the standard curve was suitable for CO2 + n-decane + n-hexane system.
The second part was to measure the Raman peak intensity ratio of CO2 + n-decane or CO2 + n-decane + n-hexane in a CO2-saturated system under different temperatures and pressures. (1) Excessive CO2 was injected into the phase equilibrium kettle by the quantitative pump; (2) The same steps used in the first part were used to determine the phase equilibrium in the CO2-saturated system; (3) After reaching the phase equilibrium, some bubbles appeared as the temperature of the system was increased or the pressure was decreased; (4) The desired temperature and pressure were maintained while there were some CO2 bubbles, and the condition was considered to reach the supersaturated status and phase equilibrium; (5) The Raman peak intensity ratio of CO2 + n-decane or CO2 + n-decane + n-hexane under different temperatures and pressures (303.15~353.15 K and 0~15.0 MPa) were measured and recorded, while there were some CO2 bubbles.

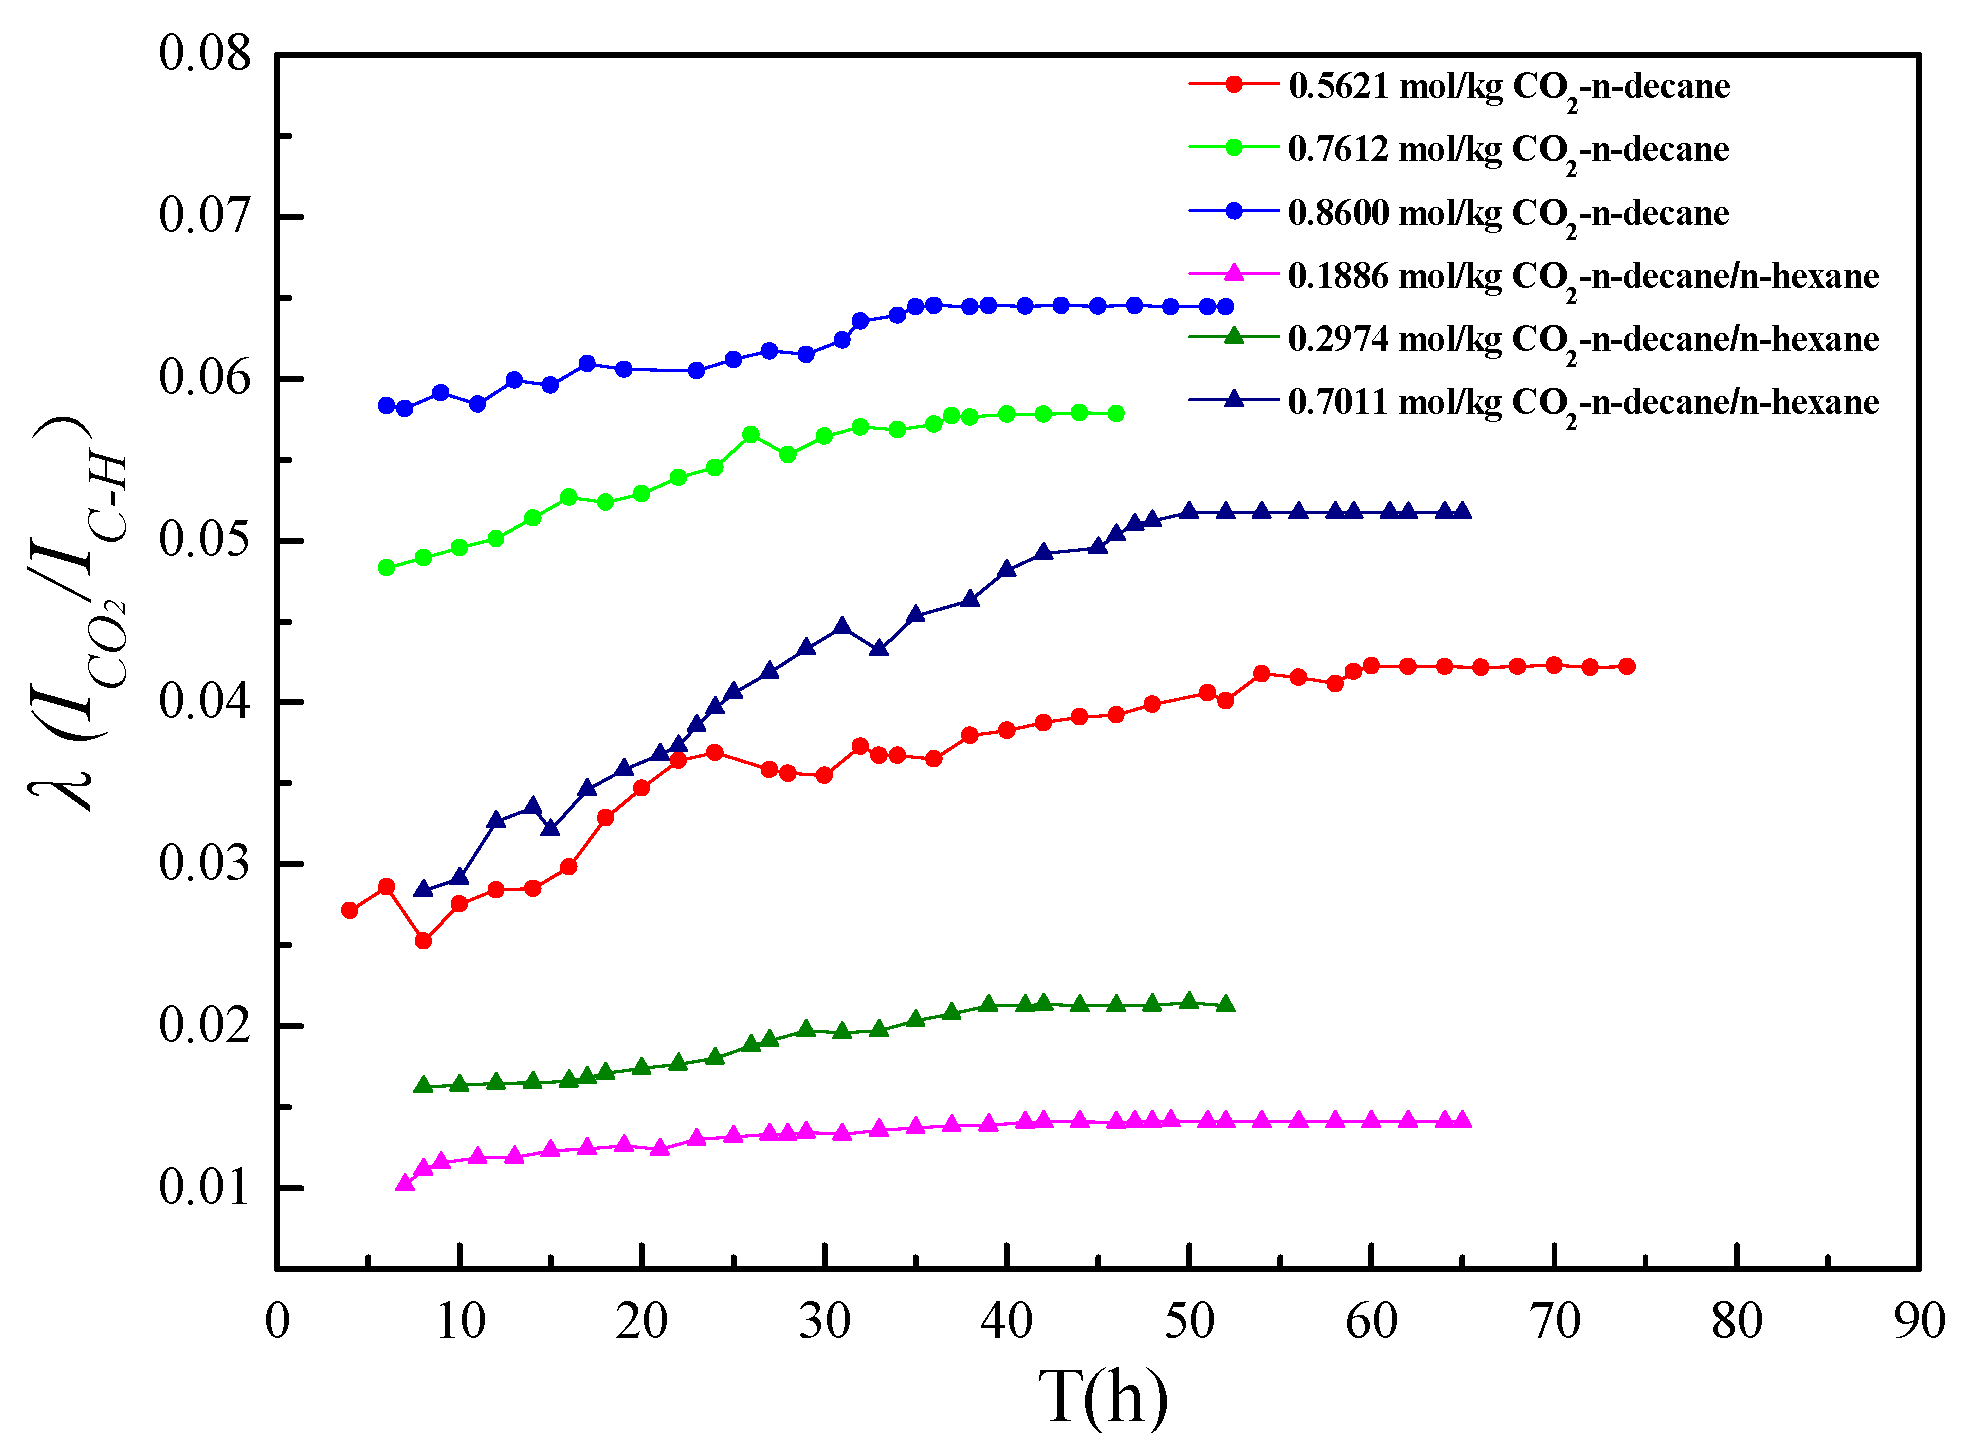
2.4. Method of Analysis

In this experiment, a JY/Horiba LabRam HR800 system equipped with a frequency-doubled Nd:YAG 531.95 nm laser with 20 mW output laser power was used to collect the Raman spectra. In addition, a Charge Coupled Device (CCD) detector (multichannel, air cooled) was used to analyze in situ the CO2 + n-decane or CO2 + n-decane + n-hexane system. Under the various temperature–pressure conditions, the Raman spectra of the system were collected in the range of 1100–4000 cm−1 to obtain the Raman peak intensity ratio between the CO2 Fermi dyad and the C − H stretching band of n-decane or n-decane + n-hexane. The acquisition time was 20 s with two accumulations. The Raman peak intensity ratio for each group of TPx conditions was measured five times, and the average value was used as the experimental data. Other details for the experimental methods were reported in our previous study [30].
The Raman peak intensity ratio (λ) was calculated using the following equation:
λ = I CO 2 / I C H
where I CO 2 is the Raman peak intensity of the CO2 Fermi dyad, IC−H is the Raman peak intensity of the C − H stretching band of n-decane or n-decane + n-hexane, and the baseline is subtracted during the calculation.
The iterative method of PR equation was used to calculate the amount of CO2 injected in the experiment using the following equation:
P = n R T V b a ( T ) V V + b + b ( V b )
a T = 0.45724 R 2 T c 2 P c α T
b = 0.07780 R T c P c
α T = 1 + k 1 T r 1 / 2 2
k = 0.37464 + 1.54226 w 0.26992 w 2
T r = T T c
C C O 2 = n 1 n 2 M C 10
where P is pressure, MPa; T is temperature, K; α T represents the intermolecular attraction coefficient, which is related to the temperature; b is the intermolecular repulsion constant; R is the general gas constant, R = 8.314 J/(mol·K); Pc represents the critical pressure; Tc represents the critical temperature; Tr represents the relative temperature; V represents the corresponding volume when refilling, mL; k represents the specific properties of w for each substance; w represents the eccentricity factor; n1, n2 represent the amount of CO2 substance corresponding to the gas filling, mol; MC10 represents the mass of the n-decane solvent in the high-pressure phase equilibrium circulation system, g; and C CO 2 represents each addition of high pressure CO2 concentration of the phase equilibrium kettle, mol/kg.

3. Results and Discussion

3.1. Phase Equilibrium of CO2 + n-Decane or CO2 + n-Decane + n-Hexane

In order to determine the solubility of CO2 in n-decane or n-decane + n-hexane, the Raman spectra of CO2 + n-decane or CO2 + n-decane + n-hexane mixture at different time were collected, and then the Raman peak intensity ratios between the CO2 Fermi diad (at 1280 cm−1 and 1385 cm−1) and the C-H stretching band of n-decane or n-decane + n-hexane (at 2800–3000 cm−1) were calculated. Figure 2 shows the Raman peak intensity ratio in the mixture as it varies with time and the concentration of CO2. The Raman peak intensity ratio increases slowly with time, and then becomes stable. When the concentration of CO2 is 0.5621 mol/kg, it takes the longest time for CO2 + n-decane system to reach the phase equilibrium. It can be speculated that the first injection volume of CO2 was large, and most of the CO2 needed to be dissolved by stirring, circulation, and other operations. After 60 h of dissolution, the Raman peak intensity ratio tended to be stable. In addition, when the injection volume of CO2 increased greatly, the dissolution time of CO2 + n-decane + n-hexane to reach the phase equilibrium was longer. When the CO2 concentration was 0.7612 mol/kg, the dissolution time of CO2 + n-decane was close to that of 0.8600 mol/kg, and when the CO2 concentration was 0.1882 mol/kg, the dissolution time of CO2 + n-decane + n-hexane was close to that of 0.2974 mol/kg. These results indicated that the dissolution time to reach the phase equilibrium was different due to the injection volume of CO2.
Table 1 shows that the standard deviation (SD) of the Raman peak intensity ratios was less than 0.0003 after 4 h of dissolution. It could be considered, that after the temperature changed, the system needed to dissolve for 4 h to reach the thermodynamic equilibrium.
In addition, phase equilibrium verification of CO2-saturated solution was similar to homogeneous solution. According to the bubble point theory, the temperature and pressure were adjusted so that there were some CO2 bubbles in the solution under this condition, and the system was in a saturated state. Then, the Raman spectra of the system at a different time and at different positions when CO2 bubbles existed were measured, as were the dissolution of CO2 in n-decane and n-decane + n-hexane to ensure the accuracy of the experimental results. The different positions were determined by the distance from the edge of the bubble. Table 2 shows that, at the same pressure and temperature, the standard deviation (SD) of the Raman peak intensity ratios at different positions was less than 0.0007, which indicated that the system had reached the thermodynamic equilibrium.
In order to further confirm that the system had reached the thermodynamic equilibrium, after the Raman peak intensity ratios of the three positions were similar, the Raman spectra of one position were collected every 30 min for 2 h (Figure 3.). When there was no significant difference between the Raman peak intensity ratios, the system was considered to be in equilibrium.

3.2. Relationship between CO2 Concentration and the Raman Peak Intensity Ratio

In order to establish an accurate relationship between the CO2 concentration and the Raman peak intensity ratio of the CO2 + n-decane system, the effects of temperature and pressure on the Raman peak intensity ratio were investigated. The results are shown in Table 3 and Table 4. When the system pressure was changed, there was no obvious difference between the Raman peak intensity ratios, and the standard deviation (SD) was less than 0.0003. When the system temperature was changed, the Raman peak intensity ratio decreased with increasing temperature, but the variation range was not significant, and the standard deviations (SD) were less than 0.002. These results indicate that the influences of temperature and pressure on the Raman peak intensity ratio were small, but the temperature had a greater impact on the Raman peak intensity ratio than pressure. Thus, six standard curves between CO2 concentration and the Raman peak intensity ratio of CO2 + n-decane system at different temperatures (303.15~353.15 K) were established to improve the accuracy of the standard curve.
In order to verify the effect of co-solvent n-hexane, the solubility of CO2 in CO2 + n-decane + n-hexane system was investigated, where the concentration of n-hexane is 3 wt%. Depending on the standard curve of CO2 concentration and the Raman peak intensity ratio of CO2 + n-decane, the injection amount of CO2 was determined. To ensure the accuracy of the experiment, the Raman peak intensity ratio of the CO2 + n-decane + n-hexane mixture at different temperatures and CO2 concentrations was measured and verified, as shown in Table 5 and Figure 4.
As shown in Figure 4, the Raman peak intensity ratio increased with the increase in CO2 concentration, indicating a positive linear correlation. The Raman peak intensity ratio of CO2 + n-decane + n-hexane at different temperatures and CO2 concentrations was consistent with the standard curve between CO2 concentration and the Raman peak intensity ratio of CO2 + n-decane. These results illustrate that the standard curve between CO2 concentration and the Raman peak intensity ratio of CO2 + n-decane system was suitable for CO2 + n-decane + n-hexane system.

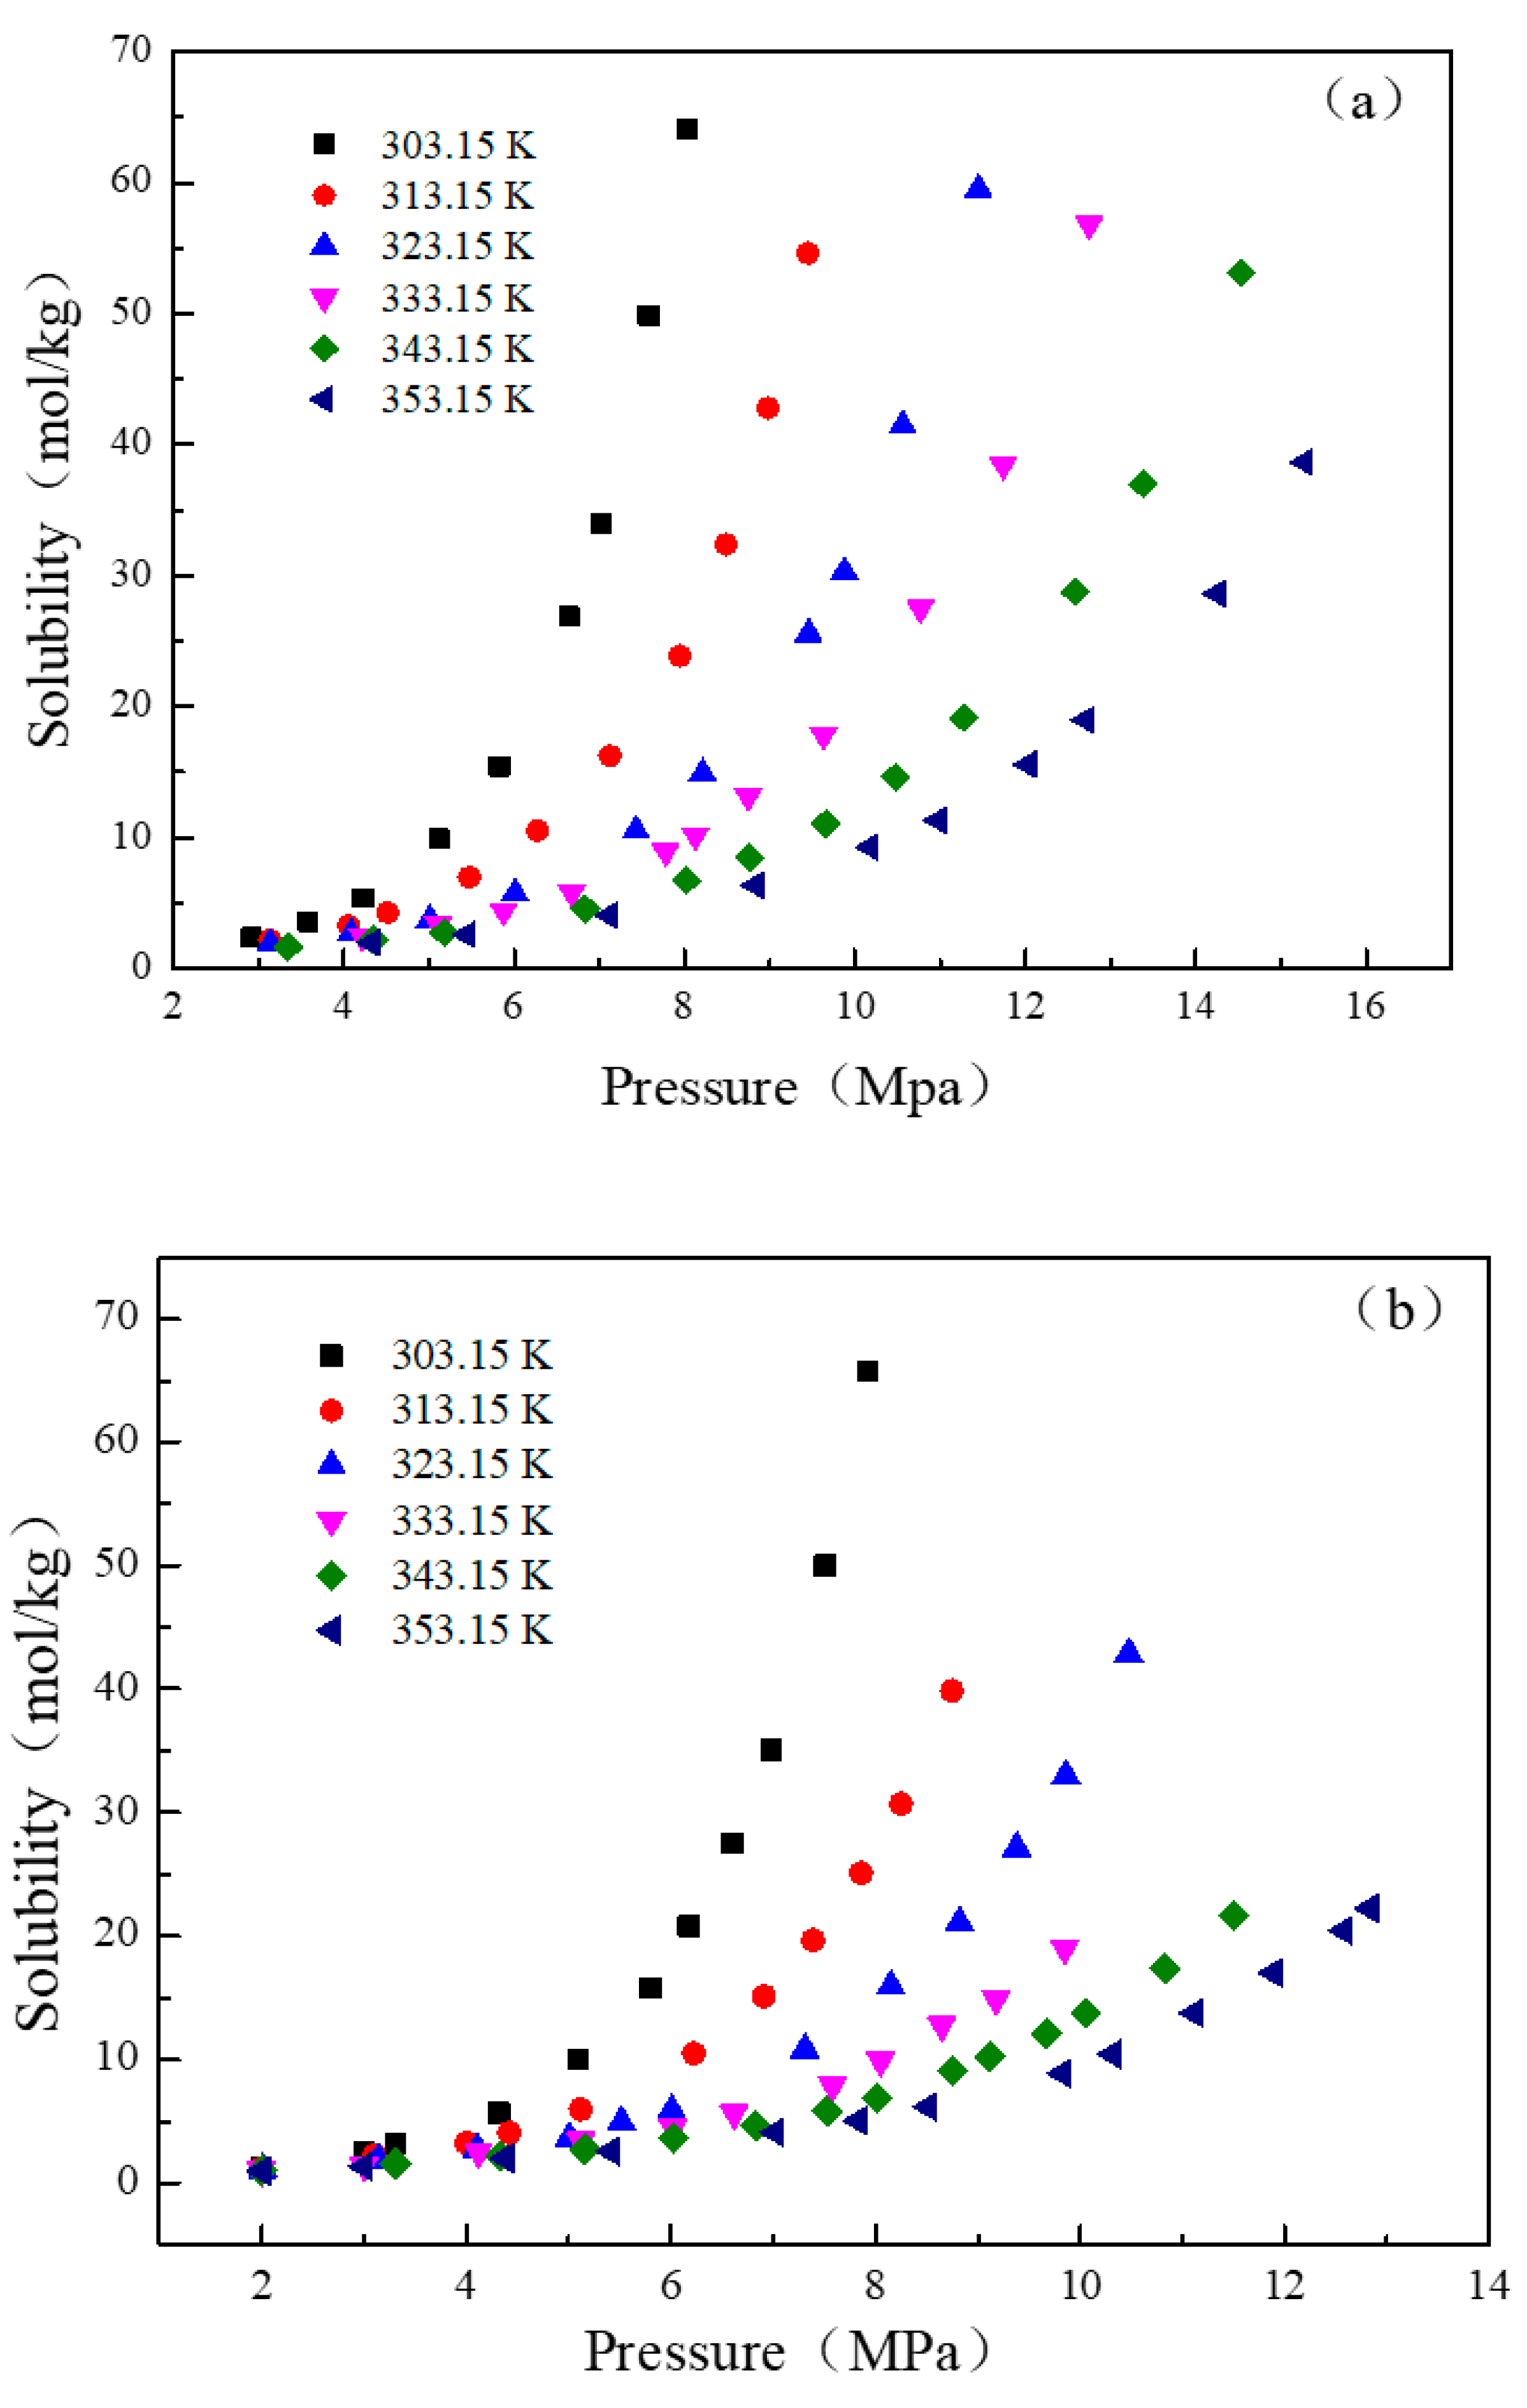
3.3. The Solubility of CO2 in n-Decane and n-Decane + n-Hexane Systems

After the system reached the phase equilibrium, the Raman peak intensity ratios of CO2 + n-decane and CO2 + n-decane + n-hexane systems were measured under temperatures from 303.15 K to 353.15 K and pressures up to 15 MPa. The solubility of CO2 was calculated from the corresponding temperature equation in Table 6, as shown in Table 7 and Table 8. These results indicate that the solubility of CO2 increased with the increase in pressure and decreased with the increase in temperature, and the addition of co-solvent n-hexane (3 wt%) improved the solubility of CO2 at high pressure (Figure 5).
Figure 5 also shows that the solubility of CO2 in n-decane increased with the increase in pressure when the temperature was constant. Taking the solubility of CO2 at 333.15 K as an example (Figure 5a), the dissolution process could be divided into two steps. The first step was the low-pressure condition. When the system pressure was low, the solubility of CO2 increased with the increase in pressure, but the increased range was small, and the growth trend was similar to linear growth. This was probably due to the low-pressure condition under which the dissolution process of CO2 in n-decane followed Henry’s law, and the solubility of CO2 in n-decane was directly proportional to the partial pressure of CO2 in gas phase [31]. The second step was the high-pressure condition. The solubility of CO2 in n-decane increased greatly when the system pressure increased to a certain value. When the pressure increased from 9.63 MPa to 10.77 MPa, the increase in the solubility of CO2 was significantly higher than that under low-pressure condition. It can be assumed that the increase in pressure shortened the distance between CO2 molecules and enhanced the interaction force. When the intermolecular force of CO2 was nearly equivalent the intermolecular force of solvent, CO2 and n-decane were miscible and formed a homogeneous fluid, which greatly increased the solubility of CO2 [32,33].
When the pressure was constant, the solubility of CO2 in n-decane decreased with the increase in temperature. It was found that the increased of temperature caused a smaller decrease in solubility under the low-pressure condition, while the increase in temperature caused a larger decrease in solubility under the high-pressure condition. It can be speculated that the increase in temperature caused the increase in the distance between molecules and the volume expansion of alkanes, the decrease in the force between CO2 and alkanes, and the increase in kinetic energy for dissolving CO2, which made it easier for CO2 to escape from the solution, resulting in the decrease in solubility.

3.4. The Solubility Prediction Model of CO2 + n-Decane System

Because crude oil, alkanes, and other solvents may show obvious changes in their physical properties with the varying of temperature, it is impossible to obtain a wide range of the solubility of CO2 in hydrocarbons by a simple and convenient way. However, the establishment of semi-empirical model has alleviated this dilemma. The Chrastil model [34] is the most concise and convenient model, and is widely applied. Based on Henry’s law, Jou et al. [35] developed a solubility model, which was similar to the Chrastil model. Paninho et al. [36] and Fornari et al. [37] have successfully employed the model to calculate the solubility of CO2 in organic liquids such as alkanes, alkenes, alcohols, acids, and ethyl lactates, which has expanded the application range of the model and verified the accuracy of the model. The solubility model was as follows:
lnP = A + B (lnS)
where P represents the pressure, kPa; S represents the solubility, mol/kg; and A, B represent the empirical constant of temperature.
According to the solubility model, the data of pressure and solubility were fitted, and the formula is shown in Table 9.
Where P represents the pressure, MPa, and S represents the solubility, mol/kg.
According to the comparison between the fitting equation and the CO2 solubility model, the A and B values in Equation (9) could be calculated. By fitting the values of A and B with the temperature, the following relationship was obtained:
A = 8 × 10⁻⁶ T2 + 0.0014 T + 0.4475
B = 0.0421 T − 11.247
where T represents the temperature, K.
Substituting Equations (10) and (11) into Equation (9), the solubility model with parameters of pressure and temperature was obtained as follows:
lnP = 8 × 10⁻⁶ T2 + 0.0014 T + 0.4475 + (0.0421 T − 11.247)lnS
The data calculated by the solubility model was compared with the experimental data (Table 9). Table 9 shows that the calculated results of the solubility model were in good agreement with the experimental results. The relative deviation of the solubility model was within ±9%, the maximum relative deviation was 8.32%, the minimum relative deviation was 0.11%, and the average relative deviation was 3.65%.
To further demonstrate that the addition of co-solvent n-hexane had a positive effect on the dissolution of CO2, the experimental data of CO2 + n-decane + n-hexane system were compared with the data calculated by the solubility model (Figure 6). There were no significant differences between the experimental data and the data calculated by the solubility model under the low-pressure condition, which indicated that the addition of co-solvent n-hexane did not enhance the solubility of CO2 under the low-pressure condition. However, under the high-pressure, the solubility of CO2 in n-decane + n-hexane system was higher than that predicted by the solubility model, and the higher the temperature, the more obvious the improvement of solubility was. According to the calculation, with the increase of temperature from 303.15 K to 353.15 K, the enhancement efficiency of the solubility of CO2 also increased from 1.34~2.05% to 8.17~9.82%, and the average enhancement efficiency increased from 1.74% to 9.00%. These results indicated that co-solvent n-hexane enhanced the dissolution of CO2 under the high-pressure condition. The reason may be due to the addition of n-hexane reducing the interfacial tension between the gas and oil phases in the CO2 + n-decane system under the high-pressure condition. The relative molecular weight of n-hexane and the contact area between solvent molecules caused the decrease in the minimum miscibility pressure of the CO2 + n-decane system at various temperatures [38]. In addition, Liu et al. [32] and Bon et al. [39] also found that the addition of a small amount of low-carbon hydrocarbon effectively reduced the minimum miscibility pressure between CO2 and high-carbon alkanes or oil.

4. Conclusions

This study integrated a fused silica capillary cell and in situ Raman spectroscopy in order to determine the solubility of CO2 in n-decane and n-decane + n-hexane system at different temperatures and pressures. The experimental results showed that, when the system temperature was 303.15~353.15 K and the system pressure was 0~15 MPa, the solubility of CO2 in n-decane was 1.6355~64.0084 mol/kg and the solubility of CO2 in n-decane + n-hexane was 1.0127~65.7286 mol/kg. When the system temperature was constant, the solubility of CO2 increased with the increase in pressure. Under the condition of constant pressure, the solubility of CO2 decreased with the increase in temperature. While the system temperature and pressure reached a certain value, CO2 was completely miscible with the solvent, and the solubility of CO2 changed greatly. In addition, a semi-empirical model was set up according to the experimental results. There were no significant differences between the experimental data and the data calculated by the solubility model under low-pressure conditions. However, under the high-pressure, the solubility of CO2 in n-decane + n-hexane system was higher than that predicted by the solubility model, and the higher the temperature, the more obvious the improvement of solubility was. It was attributed to the cosolvent playing a role in increasing the solubility of carbon dioxide under high pressure conditions. The solubility of CO2 could be extended through model equations to provide a theoretical basis and experimental data for CO2-EOR technology. In summary, this study combined a fused silica capillary cell with Raman spectroscopy and established the cyclic balance system. It has the advantages of not destroying the equilibrium state of the system, no sampling, safety, intuition, and strong operability, which greatly improve the accuracy of obtaining experimental data.

Author Contributions

Conceptualization, J.W. and Z.Z.; methodology, Z.Z. and Q.W.; software, Q.W. and T.L.; validation, J.W., Z.Z. and T.L.; formal analysis, Z.Z.; investigation, Z.Z. and Q.W.; resources, J.W.; data curation, T.L.; writing—original draft preparation, Z.Z.; writing—review and editing, J.W.; visualization, Z.Z.; supervision, J.W.; project administration, Z.P.; funding acquisition, M.H. All authors have read and agreed to the published version of the manuscript.

Funding

This research was funded by National Natural Science Foundation of China (41977304).

Data Availability Statement

Not applicable.

Conflicts of Interest

The authors declare no conflict of interest.

References

  1. Obama, B. The irreversible momentum of clean energy. Science 2017, 355, 126–129. [Google Scholar] [CrossRef] [PubMed] [Green Version]
  2. Haszeldine, R.S.; Flude, S.; Johnson, G.; Scott, V. Negative emissions technologies and carbon capture and storage to achieve the Paris Agreement commitments. Phil. Trans. R. Soc. A 2018, 376, 20160447. [Google Scholar] [CrossRef] [PubMed] [Green Version]
  3. Nath, D.; Henni, A. Solubility of carbon dioxide (CO2) in four bis (Trifluoromethyl-Sulfonyl) imide based ionic liquids. Fluid Phase Equilib. 2020, 524, 112757. [Google Scholar] [CrossRef]
  4. Boot-Handford, M.; Abanades, J.; Anthony, E.; Blunt, M. Carbon capture and storage update. Energy Environ. Sci. 2014, 7, 130–189. [Google Scholar] [CrossRef]
  5. Mosavat, N.; Abedini, A.; Torabi, F. Phase Behaviour of CO2-Brine and CO2-Oil Systems for CO2 Storage and Enhanced Oil Recovery: Experimental Studies. Energy Procedia 2014, 63, 5631–5645. [Google Scholar] [CrossRef] [Green Version]
  6. Vikara, D.; Shih, C.Y.; Lin, S.; Guinan, A.; Grant, T.; Morgan, D.; Remson, D. U.S. DOE’s Economic Approaches and Resources for Evaluating the Cost of Implementing Carbon Capture, Utilization, and Storage (CCUS). J. Sustain. Energy Eng. 2017, 5, 307–340. [Google Scholar] [CrossRef]
  7. Moody Mark, A.; Fukai Isis, M. Economic analysis of CO2-enhanced oil recovery in Ohio: Implications for carbon capture, utilization, and storage in the Appalachian Basin region. Int. J. Greenh. Gas Control 2016, 52, 357–377. [Google Scholar]
  8. Stuardi, F.M.; MacPherson, F.; Leclaire, J. Integrated CO2 capture and utilization: A priority research direction. Green Sus. Chem. 2019, 16, 71–76. [Google Scholar]
  9. Dowell, N.M.; Fennell, P.S.; Shah, N.; Maitland, G.C. The role of CO2 capture and utilization in mitigating climate change. Nat Clim. Chang. 2017, 7, 243–249. [Google Scholar] [CrossRef] [Green Version]
  10. Jia, B.; Tsau, J.-S.; Barati, R. A review of the current progress of CO2 injection EOR and carbon storage in shale oil reservoirs. Fuel 2019, 236, 404–427. [Google Scholar] [CrossRef]
  11. Gui, X.; Wang, W.; Gao, Q.; Yun, Z.; Fan, M.H.; Chen, Z.H. Measurement and correlation of high pressure phase equilibria for CO2 + alkanes and CO2 + crude oil systems. J. Chem. Eng. Data 2017, 62, 3807–3822. [Google Scholar] [CrossRef]
  12. Panayiotou, C. Interfacial tension and interfacial profiles: An equation-of-state approach. J. Colloid Interface Sci. 2003, 267, 418–428. [Google Scholar] [CrossRef] [PubMed]
  13. Rostami, A.; Arabloo, M.; Kamari, A.; Mohammadi, A.H. Modeling of CO2 solubility in crude oil during carbon dioxide enhanced oil recovery using gene expression programming. Fuel 2017, 210, 768–782. [Google Scholar] [CrossRef]
  14. Wang, X.; Strycker, A. Evaluation of CO2 Injection with Three Hydrocarbon Phases. In Proceedings of the 2000 SPE International Oil and Gas Conference and Exhibition, Beijing, China, 7–10 November 2000; pp. 2–11. [Google Scholar]
  15. Kavousi, A.; Torabi, F.; Chan, C.W.; Shirif, E. Experimental measurement and parametric study of CO2 solubility and molecular diffusivity in heavy crude oil systems. Fluid Phase Equilib. 2014, 371, 57–66. [Google Scholar] [CrossRef]
  16. Varet, G.; Montel, F.; Nasri, D.; Daridon, J.-L. Gas solubility measurement in heavy oil and extra heavy oil at vapor extraction (VAPEX) conditions. Energy Fuels 2013, 27, 2528–2535. [Google Scholar] [CrossRef]
  17. Eustaquio-Rincón, R.; Trejo, A. Solubility of n-octadecane in supercritical carbon dioxide at 310, 313, 333, and 353 K, in the range 10–20 MPa. Fluid Phase Equilib. 2001, 185, 231–239. [Google Scholar] [CrossRef]
  18. Liu, J.; Qin, Z.; Wang, G.; Hou, X.; Wang, J. Critical Properties of Binary and Ternary Mixtures of Hexane + Methanol, Hexane + Carbon Dioxide, Methanol + Carbon Dioxide, and Hexane + Carbon Dioxide + Methanol. J. Chem. Eng. Data 2003, 48, 1610–1613. [Google Scholar] [CrossRef]
  19. Mutelet, F.; Vitu, S.; Privat, R.; Jaubert, J.-N. Solubility of CO2 in branched alkanes in order to extend the PPR78 model (predictive 1978, Peng-Robinson EOS with temperature-dependent kij calculated through a group contribution method) to such systems. Fluid Phase Equilib. 2005, 238, 157–168. [Google Scholar] [CrossRef]
  20. Camacho-Camacho, L.E.; Galicia-Luna, L.A.; Elizalde-Solis, O.; Martínez-Ramírez, Z. New isothermal vapor–liquid equilibria for the CO2 + n-nonane, and CO2 + n-undecane systems. Fluid Phase Equilib. 2007, 259, 45–50. [Google Scholar] [CrossRef]
  21. Luther, S.K.; Schuster, J.J.; Leipertz, A.; Braeuer, A. Microfluidic Investigation into Mass Transfer in Compressible Multi-Phase Systems Composed of Oil, Water and Carbon Dioxide at Elevated Pressure. J. Supercrit. Fluids 2013, 84, 121–131. [Google Scholar] [CrossRef]
  22. Lang, S.; Frerich, S.; Pollak, S. Solubility of Pressurised Carbon Dioxide in Three Different Polydimethylsiloxanes. Fluid Phase Equilib. 2019, 491, 12–22. [Google Scholar] [CrossRef]
  23. Yang, Z.; Li, M.; Peng, B.; Lin, M.; Dong, Z. Volume expansion of CO2 + oil at near critical and supercritical conditions of CO2. Fuel 2013, 112, 283–288. [Google Scholar] [CrossRef]
  24. Han, H.; Yuan, S.; Li, S.; Liu, X.; Chen, X. Dissolving capacity and volume expansion of carbon dioxide in chain n-alkanes. Adv. Pet. Explor. Dev. 2015, 42, 97–103. [Google Scholar] [CrossRef]
  25. Liu, N.; Aymonier, C.; Lecoutre, C.; Garrabos, Y.; Marre, S. Microfluidic approach for studying CO2 solubility in water and brine using in situ Raman spectroscopy. Chem. Phys. Lett. 2012, 551, 139–143. [Google Scholar] [CrossRef]
  26. Belgodere, C.; Dubessy, J.; Vautrin, D.; Caumon, M.-C.; Sterpenich, J.; Pironon, J.; Robert, P.; Randi, A.; Birat, J.-P. Experimental determination of CO2 diffusion coefficient in aqueous solutions under pressure at room temperature via Raman spectroscopy: Impact of salinity (NaCl). J. Raman Spectrosc. 2015, 46, 1025–1032. [Google Scholar] [CrossRef]
  27. Aarnoutse, P.J.; Westerhuis, J.A. Quantitative Raman Reaction Monitoring Using the Solvent as Internal Standard. Anal. Chem. 2005, 77, 1228–1236. [Google Scholar] [CrossRef]
  28. Guo, H.; Chen, Y.; Hu, Q.; Lu, W.; Ou, W.; Geng, L. Quantitative Raman spectroscopic investigation of geo-fluids high-pressure phase equilibria: Part, I. Accurate calibration and determination of CO2 solubility in water from 273.15 to 573.15 K and from 10 to 120 MPa. Fluid Phase Equilib. 2014, 382, 70–79. [Google Scholar] [CrossRef]
  29. Bei, K.; Junliang, W.; Shuyan, Z.; Guangna, X.; Yanmei, X.; Liang, W.; Zhuoran, J.; I-Ming, C.; Zhiyan, P. Determining the volume expansion of the CO2 + octane mixture using a fused silica capillary cell with in-situ Raman spectroscopy. J. CO2 Util. 2018, 24, 149–156. [Google Scholar] [CrossRef]
  30. Wang, J.; He, B.; Xie, L.; Bei, K.; Li, G.; Chen, Z.; Chou, I.-M.; Lin, C.; Pan, Z. Determination of CO2 solubility in water and NaCl solutions under geological sequestration conditions using a fused silica capillary cell with in Situ Raman spectroscopy. J. Chem. Eng. Data 2019, 64, 2484–2496. [Google Scholar] [CrossRef]
  31. Campbell, I.T.; Brand, U. Henry’s law. Enc. Earth Sci. 1998, 26, 315. [Google Scholar]
  32. Liu, Y.; Jiang, L.; Song, Y.; Zhao, Y.; Zhang, Y.; Wang, D. Estimation of minimum miscibility pressure (MMP) of CO2 and liquid n-alkane systems using an improved MRI technique. Magn. Reson. Imaging 2016, 34, 97–104. [Google Scholar] [CrossRef] [PubMed]
  33. Yang, Z.; Li, M.; Peng, B.; Lin, M.; Dong, Z. Dispersion property of CO2 in oil. 1. Volume expansion of CO2+alkane at near critical and supercritical condition of CO2. J. Chem. Eng. Data 2012, 57, 882–889. [Google Scholar] [CrossRef]
  34. Chrastil, J. Solubility of solids and liquids in supercritical gases. J. Phys. Chem. 1982, 86, 3016–3021. [Google Scholar] [CrossRef]
  35. Jou, F.Y.; Mather, A.E. Solubility of carbon dioxide in an aqueous mixture of methyldiethanolamine and N-methylpyrrolidone at elevated pressures. Fluid Phase Equilib. 2005, 228, 465–469. [Google Scholar] [CrossRef]
  36. Paninho, A.B.; Nunes, A.V.M.; Paiva, A.; Najdanovic-Visak, V. High pressure phase behavior of the binary system (ethyl lactate+ carbon dioxide). Fluid Phase Equilib. 2013, 360, 129–133. [Google Scholar] [CrossRef]
  37. Fornari, T.; Hernández, E.J.; Reglero, G. Solubility of supercritical gases in organic liquids. J. Supercrit. Fluids 2009, 51, 115–122. [Google Scholar] [CrossRef]
  38. Lashkarbolooki, M.; Eftekhari, M.J.; Najimi, S.; Ayatollahi, S. Minimum miscibility pressure of CO2 and crude oil during CO2 injection in the reservoir. J. Supercrit. Fluids 2017, 127, 121–128. [Google Scholar] [CrossRef]
  39. Bon, J.; Sarma, H.K.; Theophilos, A.M. An Investigation of Minimum Miscibility Pressure for CO2—Rich Injection Gases with Pentanes-Plus Fraction. In Proceedings of the SPE International Improved Oil Recovery Conference, Kuala Lumpur, Malaysia, 5–6 December 2005. [Google Scholar]
Figure 1. Schematic diagram of the measurement apparatus of the solubility of CO2 in n-decane and n-decane + n-hexane system.
Processes 11 01137 g001
Figure 2. Variation of the Raman peak intensity ratios of mixture with different CO2 concentrations and time.
Processes 11 01137 g002
Figure 3. The Raman spectra of the CO2-saturated solution from 0 to 120 min after reaching the phase equilibrium, (a) CO2 + n-decane, (b) CO2 + n-decane + n-hexane.
Processes 11 01137 g003
Figure 4. Verifying the relationship between CO2 concentration and the Raman peak intensity ratio of CO2 + n-decane + n-hexane at different temperatures.
Processes 11 01137 g004
Figure 5. (a) The solubility of CO2 + n-decane system at 303.15~353.15 K and 0~15 MPa; (b) The solubility of CO2 + n-decane + n-hexane system at 303.15~353.15 K and 0~15 Mpa.
Processes 11 01137 g005
Figure 6. Comparison between experimental data and model calculated data of the solubility of CO2 in n-decane + n-hexane system.
Processes 11 01137 g006
Table 1. The Raman peak intensity ratio of mixture at different time.
T ,   C CO 2 1 h2 h3 h4 h5 h6 h7 h
CO2 + n-decane
303.15 K
0.5621 mol/kg
0.043780.045380.040390.041850.041280.041360.04146
313.15 K
0.6606 mol/kg
0.051430.047960.046570.048520.048340.048780.04865
CO2 + n-decane + n-hexane
303.15 K
0.1886 mol/kg
0.014210.015520.014320.014080.014070.014080.01409
313.15 K
0.2974 mol/kg
0.022350.022010.021690.021460.021480.021510.02142
Table 2. The Raman peak intensity ratios of mixture at three positions at different temperatures and pressures.
Temperature, Pressure100 μm200 μm300 μmStandard Deviation SD
CO2 + n-decane
303.15 K, 2.82 MPa0.16570.16640.16670.00051
313.15 K, 3.93 MPa0.20450.20530.20540.00049
323.15 K, 4.81 MPa0.22370.22310.22380.00041
333.15 K, 6.53 MPa0.37540.37520.37610.00049
343.15 K, 6.64 MPa0.30850.30910.30840.00034
353.15 K, 10.08 MPa0.66930.66900.67020.00062
CO2 + n-decane + n-hexane
303.15 K, 3.00 MPa0.16940.16940.17010.0004
313.15 K, 2.02 MPa0.087480.087750.087440.0002
323.15 K, 3.10 MPa0.13150.13170.13180.0001
333.15 K, 6.53 MPa0.41460.41460.41470.0001
343.15 K, 8.32 MPa0.59020.59040.59130.0006
353.15 K, 10.45 MPa0.67320.67330.67370.0003
Table 3. The Raman peak intensity ratio of CO2 + n-decane system at different pressures.
C CO 2
mol/kg
P
MPa
Peak Intensity RatioSD C CO 2
mol/kg
P
MPa
Peak Intensity RatioSD
303.15 K323.15 K
0.56214.030.041200.000240.76126.150.054860.00022
5.790.041147.780.05430
7.310.041309.070.05469
8.650.0416910.160.05476
9.810.0410411.810.05449
11.210.0414613.250.05441
343.15 K333.15 K
0.86007.350.059900.000260.95965.480.067310.00027
10.130.060146.650.06785
11.850.060328.100.06757
13.110.060279.310.06782
14.420.0606410.500.06799
15.750.0605211.430.06802
Table 4. The Raman peak intensity ratio of CO2 + n-decane mixture at different temperatures and CO2 concentrations.
T (K)303.15313.15323.15333.15343.15353.15SD
C CO 2 (mol/kg)
0.56210.041690.040620.040290.039270.038740.037290.0015
0.66060.049530.048780.048190.047690.047100.046380.0011
0.76120.055630.054830.054290.054100.053530.053150.00089
0.86000.063050.062400.061700.061250.060510.060040.0011
0.95960.070230.069340.068530.067850.067060.066730.0013
Table 5. The Raman peak intensity ratio of CO2 + n-decane + n-hexane at different temperatures and CO2 concentrations.
T (K)303.15313.15323.15333.15343.15353.15SD
C CO 2 (mol/kg)
0.18860.014090.013700.013500.013040.012720.012510.0006
0.29740.022600.021500.021180.020820.020410.020090.0009
0.70110.051620.051140.050480.050050.049400.049110.0010
Table 6. The standard curve relationship between CO2 concentration and the Raman peak intensity ratio of CO2 + n-decane system.
T (K)Fitting Equation
303.15λ = 0.0710 × CCO2 + 0.0020 (R2 = 0.9983)
313.15 λ = 0.0715 × CCO2 + 0.0008 (R2 = 0.9977)
323.15 λ = 0.0704 × CCO2 + 0.0011 (R2 = 0.9982)
333.15 λ = 0.0711 × CCO2 − 0.00006 (R2 = 0.9970)
343.15λ = 0.0704 × CCO2 − 0.0002 (R2 = 0.9969)
353.15λ = 0.0729 × CCO2 − 0.0028 (R2 = 0.9944)
Table 7. The solubility of CO2 + n-decane system at 303.15~353.15 K and 0~15 MPa.
Temperature (K)Pressure (MPa)Solubility (mol/kg)Temperature (K)Pressure (MPa)Solubility (mol/kg)
303.152.922.3741313.153.142.1676
3.593.56544.063.2723
4.235.36154.524.2598
5.129.88195.486.9693
5.8315.44306.2810.5335
6.6526.85517.1316.2304
7.0333.93677.9523.8631
7.5849.84258.4932.3855
8.0364.00848.9842.8045
--9.4554.6061
323.153.141.9191333.154.122.4537
4.092.69785.113.4143
5.013.71915.984.3792
6.015.73336.685.8202
7.4310.54757.888.9228
8.2114.90788.2310.1629
9.4625.58728.7513.1587
9.8830.28659.6317.8441
10.5641.461010.7727.5098
————11.7438.4256
————12.8556.8202
343.153.351.6355353.154.331.9795
4.352.20145.452.5699
5.182.75817.124.0630
6.834.57818.836.3712
8.026.726610.189.2589
8.768.503210.9811.3027
9.6611.049012.0315.5671
10.4814.650412.7118.9835
11.2819.145514.2528.6054
12.5828.777515.2838.6424
13.3837.0169————
Table 8. The solubility of CO2 + n-decane + n-hexane system at 303.15~353.15 K and 0~15 MPa.
Temperature (K)Pressure (MPa)Solubility (mol/kg)Temperature (K)Pressure (MPa)Solubility (mol/kg)
303.152.001.2874313.152.001.1989
3.002.38233.102.2014
3.313.19344.003.2599
4.325.68074.424.0249
5.19.99445.125.9455
5.815.76936.2310.4441
6.1820.76236.9115.1131
6.6027.49367.3919.6187
6.9835.10557.8625.0726
7.5149.99728.2530.7025
7.9265.72856 8.7539.8393
323.152.011.1464333.152.001.0737
3.141.90253.001.4642
4.112.76634.122.5187
5.013.68245.123.4375
5.524.92626.024.4820
6.015.88656.625.6446
7.3110.83127.587.8596
8.1515.91358.059.8820
8.8221.07808.6512.7374
9.3827.14759.1814.8694
9.8632.98169.8518.9972
10.4842.8794
343.152.001.0414353.152.001.0127
3.311.61153.001.3549
4.332.20124.382.0044
5.162.73495.422.5910
6.023.63467.024.0900
6.834.65987.835.0452
7.535.79918.526.1411
8.026.86879.838.8753
9.1210.199110.3210.4260
9.6712.116911.1213.7493
10.0613.776511.8917.0370
10.8317.359412.5820.4384
11.5021.620412.8322.2329
Table 9. Fitting equations of solubility and pressure of CO2 + n-decane system.
T (K)Fitting EquationsR2
303.15P = 1.5326lnS + 1.62420.9998
313.15P = 1.9485lnS + 1.69660.9996
323.15P = 2.3796lnS + 1.75910.9991
333.15P = 2.7238lnS + 1.81940.9989
343.15P = 3.1907lnS + 1.89540.9997
353.15P = 3.6666lnS + 1.96610.9996
Disclaimer/Publisher’s Note: The statements, opinions and data contained in all publications are solely those of the individual author(s) and contributor(s) and not of MDPI and/or the editor(s). MDPI and/or the editor(s) disclaim responsibility for any injury to people or property resulting from any ideas, methods, instructions or products referred to in the content.

