Article

Adversarial Training Collaborating Multi-Path Context Feature Aggregation Network for Maize Disease Density Prediction

1
School of Information Science and Engineering, Wuchang Shouyi University, Wuhan 430064, China
2
Electronic Information School, Wuhan University, Wuhan 430072, China
3
School of Computer Science, Hubei University of Technology, Wuhan 430068, China
*
Author to whom correspondence should be addressed.
These authors contributed equally to this work.
Processes 2023, 11(4), 1132; https://doi.org/10.3390/pr11041132
Submission received: 22 February 2023 / Revised: 31 March 2023 / Accepted: 5 April 2023 / Published: 6 April 2023
(This article belongs to the Special Issue Sanitary and Environmental Engineering: Relevance and Concerns)

Abstract

:
Maize is one of the world’s major food crops, and its yields are closely related to the sustenance of people. However, its cultivation is hampered by various diseases. Meanwhile, maize diseases are characterized by spots of varying and irregular shapes, which makes identifying them with current methods challenging. Therefore, we propose an adversarial training collaborating multi-path context feature aggregation network for maize disease density prediction. Specifically, our multi-scale patch-embedding module uses multi-scale convolution to extract feature maps of different sizes from maize images and performs a patch-embedding operation. Then, we adopt the multi-path context-feature aggregation module, which is divided into four paths to further extract detailed features and long-range information. As part of the aggregation module, the multi-scale feature-interaction operation will skillfully integrate rough and detailed features at the same feature level, thereby improving prediction accuracy. By adding noise interference to the input maize image, our adversarial training method can produce adversarial samples. These samples will interfere with the normal training of the network—thus improving its robustness. We tested our proposed method on the Plant Village dataset, which contains three types of diseased and healthy maize leaves. Our method achieved an average accuracy of 99.50%, surpassing seven mainstream models and showing its effectiveness in maize disease density prediction. This research has theoretical and applied significance for the intelligent and accurate detection of corn leaf diseases.

1. Introduction

Crop yields are an instrumental factor in ensuring sustainable economic growth [1]. Maize has excellent adaptability, a wide planting area and distribution system, a variety of applications, and the potential to have its production increased [2,3]. As one of the most widely distributed crops in the world, it ranks second only to rice and wheat in terms of sowing area and production [4,5]. In spite of this, maize yield is impacted by many factors—including soil, heat, water, natural disasters, and disease—which result in a loss of 6–10% of corn production every year [6]. It is therefore crucial to detect and monitor diseases as early as possible during the growth of maize. Statistics indicate that there are more than 80 kinds of maize diseases in the world [7]. Among the most common maize diseases are large and small leaf spots, curved spore leaf spots, rust, brown spots, etc.—all of which adversely affect maize yield [8]. Presently, the identification of maize diseases is largely dependent on manual observations by growers [9]. This is time-consuming and laborious and can result in misjudgments due to a lack of professional knowledge [10]. At the same time, this makes it difficult to implement timely preventive and control programs. As a result, there is an urgent need for an intelligent and effective method that can be used for identifying maize diseases and increasing maize yields [11,12].
Up to now, many researchers have proposed various methods for crop disease identification. These methods are mainly divided into two categories: machine learning methods based on traditional features and automatic feature-learning methods based on deep learning [13,14,15]. For machine learning methods, an example is the work of Zhang et al. [16], in which a genetic support vector machine (SVM) was trained to classify six maize diseases with an average classification accuracy of 90.25%. Aravind et al. [17] used an SVM classifier to classify maize diseases and achieved an average accuracy rate of 83.7%. Zhang et al. [18] first segmented significant disease features from maize pictures, and then followed this by further classifying maize diseases using the k-nearest neighbor (KNN) with an accuracy of over 90%. Alehegn [19] applied an SVM to extract color, grain, and shape information from Ethiopian maize leaves, achieving an average accuracy of 95.63% in a dataset containing 800 maize leaves. Nonetheless, machine learning methods require training data and hand-designed features that are high quality, and thus the feature extraction ability for some data is poor and lacks robustness, which leads to unsatisfactory recognition accuracy. As for deep learning methods, they benefit from the powerful feature-extraction capabilities of convolution neural networks (CNNs). Waheed et al. [20] proposed an optimized dense CNN architecture (DenseNet) for the identification and classification of three types of diseased maize leaves in addition to healthy maize leaves. Gui et al. [21] proposed an improved CNN model for plant disease identification in the field by exploring the potential and generalization ability of CNN models, achieving a 72.03% accuracy. Qian et al. [22] explored the effect of a Transformer on maize disease identification, and then proposed an improved model on the basis of self-attention, which outperformed five mainstream CNN models. Dechant et al. [23] developed an automatic identification system for leaf blight detection in the field environment. Their method overcame the irregular leaf interference in the field environment and achieved 96.7% accuracy. For a four-class maize leaf recognition task, Xu et al. [24] implemented the Inception module in AlexNet, designed TCI-ALEXN, and avoided overfitting by using a global pooling layer. Ahila et al. [25] proposed a modified CNN-based LeNet method for diseased maize leaf identification and classification, and achieved 97.89% accuracy. Even though all of the above methods are capable of generating better detection results, the majority of them only use a CNN or a Transformer. This method does not consider detailed and long-range features, making it difficult to accurately predict and identify maize diseases [26]. This paper attempts to make maize disease density predictions by combining a depth convolution and a Transformer. Our main objective was to extract different features from various types of corn disease images with similar characteristics. At the same time, we needed to overcome the complex background noise to improve the prediction accuracy. To this end, we proposed an adversarial training collaborating multi-path context-feature aggregation network for maize disease density prediction. Specifically, we used multi-scale patch embedding to initially obtain multi-scale features in maize disease images, and multi-path context-feature aggregation to further obtain detailed and long-range feature information and aggregate it at the same feature level. Lastly, we used the adversarial training method to obtain adversarial samples by adding noise to the input maize images. This perturbed the training process—thus further improving the model’s robustness and resistance to noise. The contributions of this paper are summarized as follows:
(1)
We employ a multi-scale patch embedding module to extract multi-scale features from various types of maize images using multi-scale convolution with overlapping parts—thus adapting to different maize disease characteristics.
(2)
Our proposed multi-path context feature aggregation module uses a depth convolution and Transformer encoder to further extract detailed features and long-range features, and allows these two to interact in the same dimension in order for the multi-scale features to effectively improve the network’s ability to characterize features.
(3)
We use the adversarial training method to generate adversarial samples by adding noise perturbations to the input maize images; this disrupts the normal training of the network—thus improving the robustness of the network.

2. Materials and Methods

2.1. Dataset

The experimental data used in this paper were primarily derived from the Plant Village international common dataset, which contains a large number of images depicting plant diseases. We used three kinds of diseased maize leaves as well as healthy maize leaves in this dataset as experimental data. The three maize disease species that were identified included leaf blight disease [27], gray leaf disease [28], and leaf rust disease [29]—with a total of 7701 images. Figure 1 illustrates some data images of the diseased and healthy maize leaves.
Figure 1 illustrates the individual characteristics of the diseased maize leaves and healthy maize leaves. The leaf surfaces of healthy leaves are bright and smooth, showing no obvious disease symptoms; blighted leaves show gray or yellow–brown spots that do not expand, but spread parallel to the leaf veins; gray leaves have no obvious brown spots on the edges, but have more spots appearing parallel to the leaf veins; and rusted leaves show herpetic patches with colors from yellow to brown on both sides of the leaves, which are surrounded by yellow haloes.
The original resolution of the images in the dataset was 256 × 256 pixels, and in order to better fit our proposed network structure, we adjusted the images to be 224 × 224 pixels. In addition, the overall dataset was divided into a training set and a testing set. Specifically, the training set rate for leaf blight, gray leaf, healthy leaf, and leaf rust images was 78%, 75%, 75%, and 80%, respectively. Table 1 summarizes the number of images in the training set and testing set after the dataset division.

2.2. Overview of Network

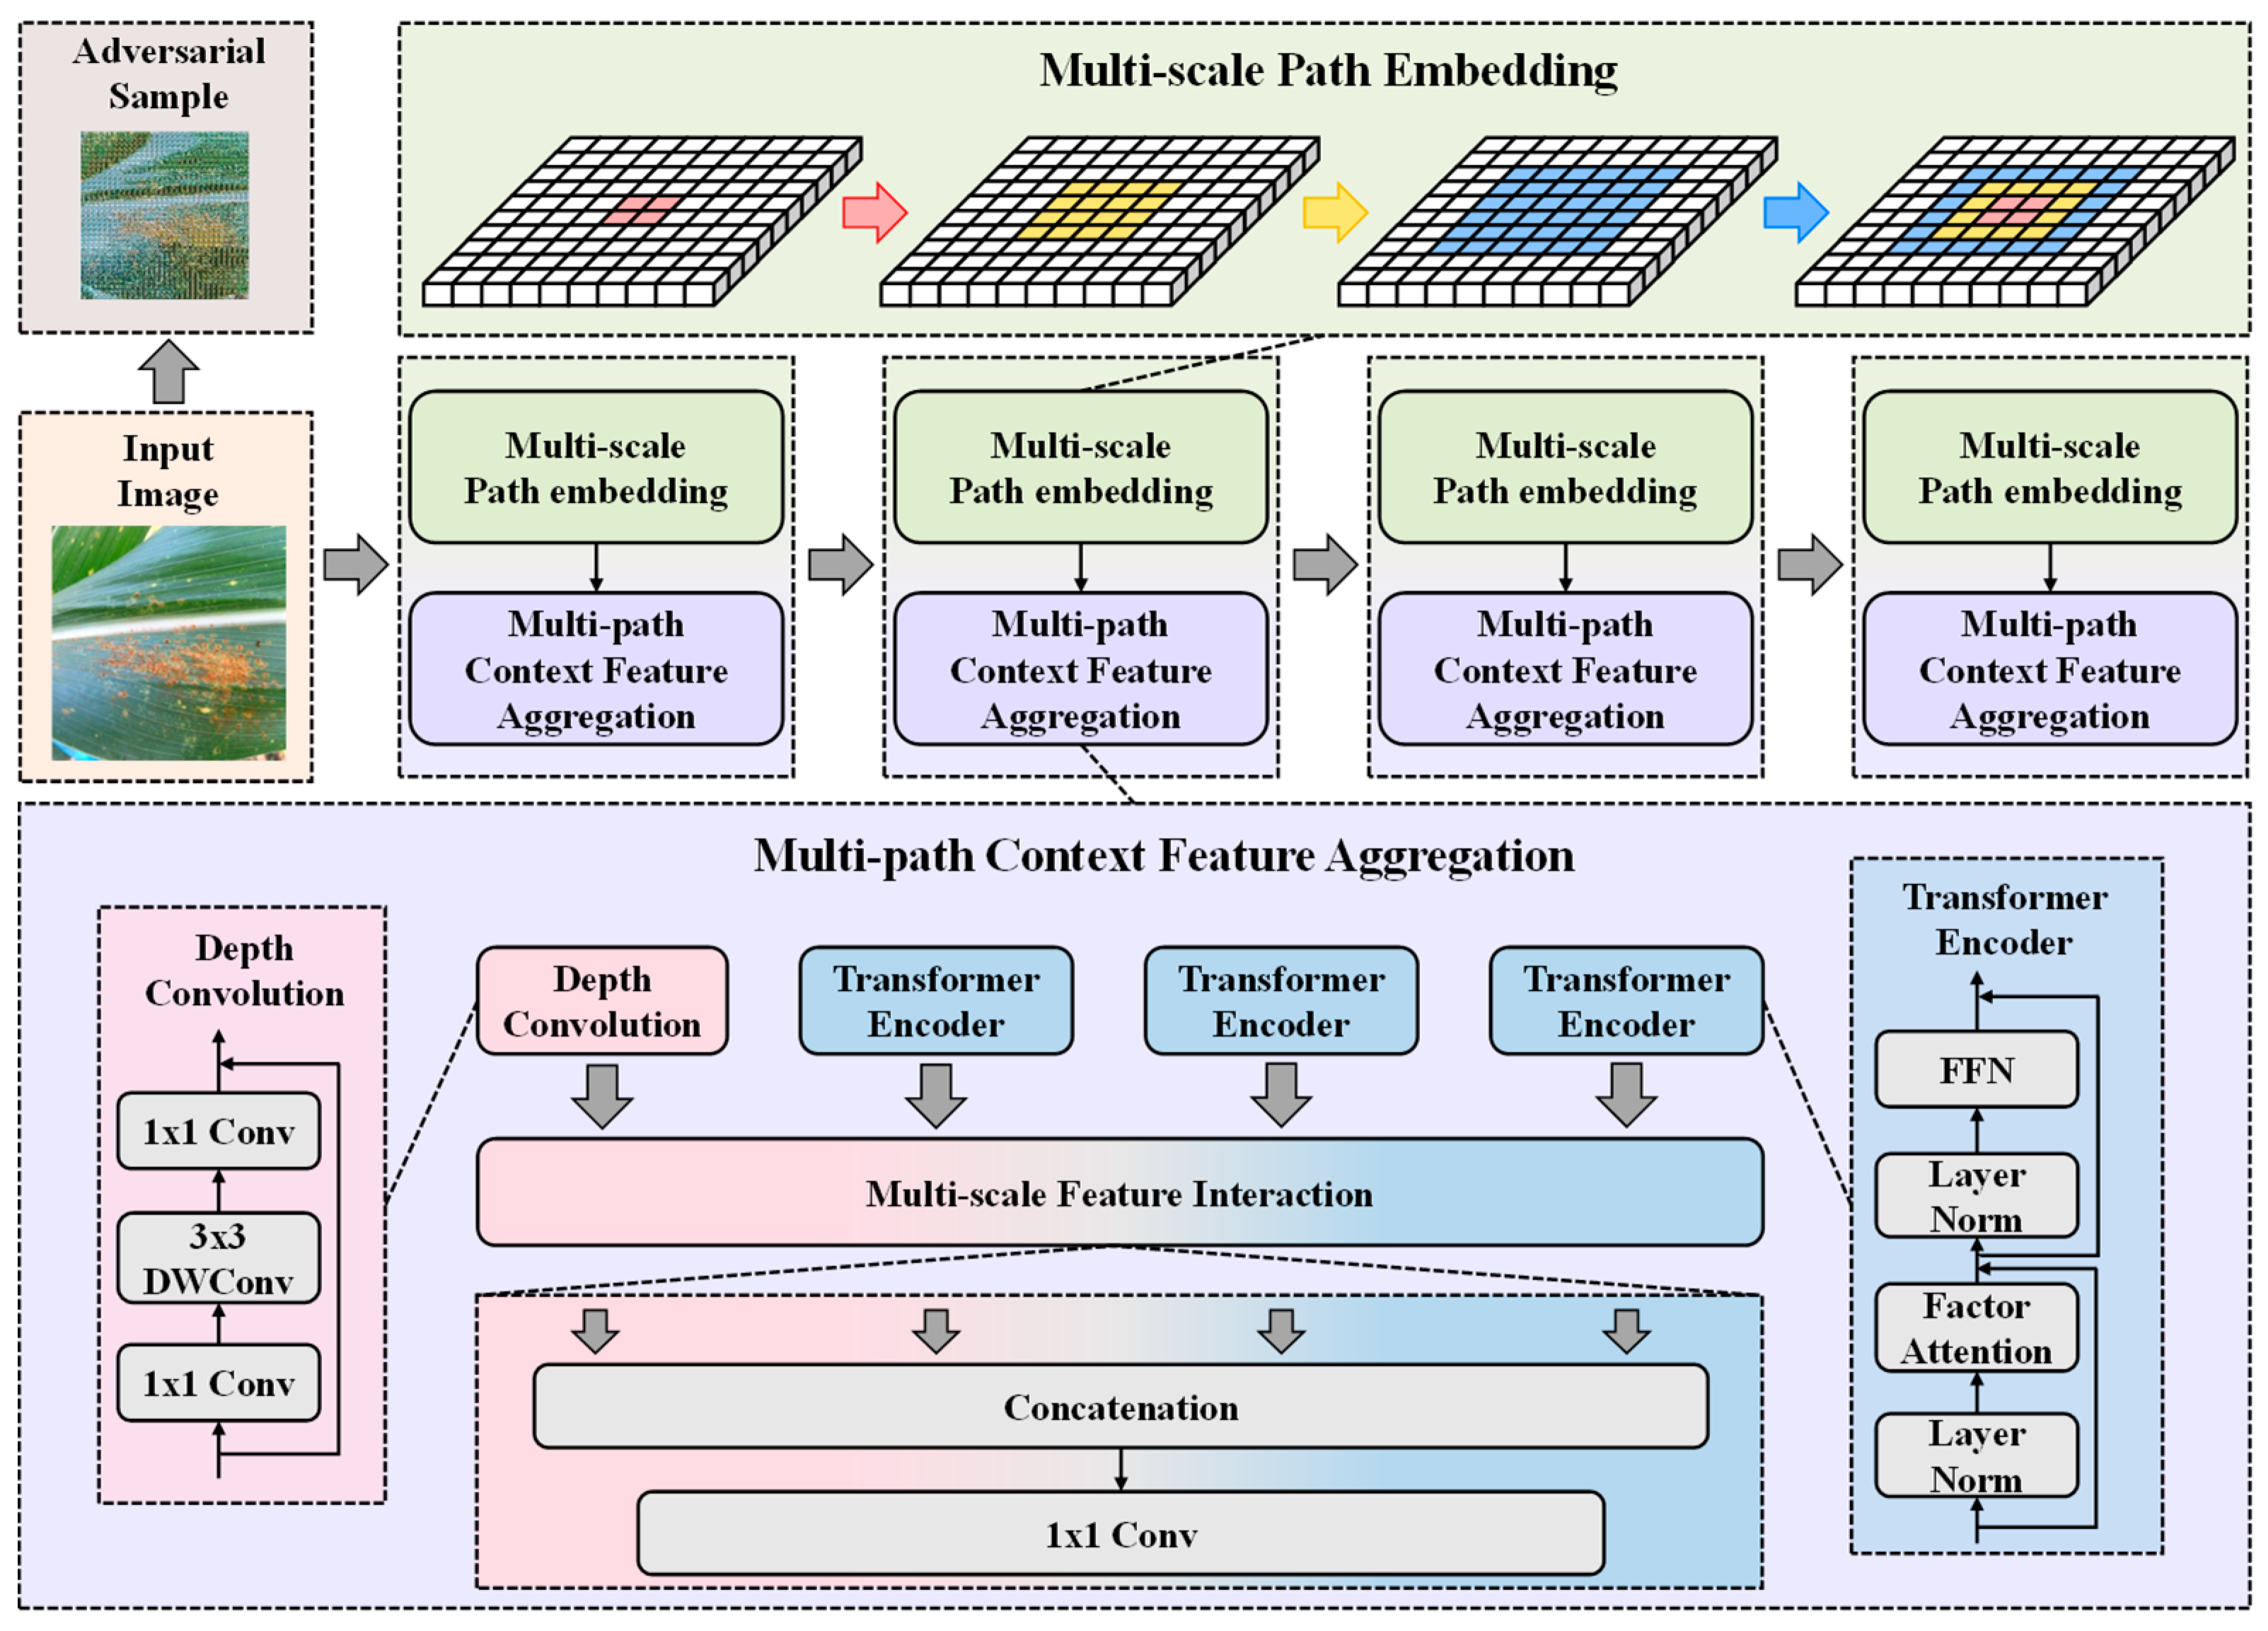
Figure 2 shows the overview of the proposed adversarial training collaborating multi-path context feature aggregation network. The implementation process of our method was mainly divided into four steps, and each step was further divided into two parts: multi-scale patch embedding and multi-path context-feature aggregation, with the aim of obtaining multi-scale maize disease characteristics. Specifically, the multi-scale patch-embedding module extracted feature maps of different sizes by multi-scale convolution and performed a patch embedding operation. During the embedding of the multi-scale patch, it was flattened into tokens of different scales. Features with the same sequence length were output after adjusting the filling step of the convolution. In addition, the multi-path context feature aggregation module transferred the tokens with the same sequence length independently and simultaneously to the deep convolution and Transformer encoder through multiple paths for the further extraction of detailed features, and then performed a multi-scale feature interaction—thus identifying coarse and detailed feature representations at the same feature level. At the same time, our adversarial training module added noise to the input image to obtain the adversarial sample to improve the network’s resistance to noise and ultimately improve its robustness.

2.3. Multi-Scale Patch Embedding

Since the selected diseased maize leaves had small disease spots on the blighted leaves and large rust spots on the rusted leaves, conventional convolution could not take into account both detailed and large-scale disease features. To this end, we adapted multi-scale convolution—which is different from conventional convolution—to obtain multi-level disease-feature information. As shown in Figure 3, our multi-scale convolution was divided into overlapping 3 × 3, 5 × 5, and 7 × 7 parts.
The three convolution kernels were cascaded to obtain tokens with rich maize-disease information at multiple scales, and the height and width of the token feature map dimensions were calculated as follows:
H i = H i 1 k + 2 p s + 1 , W i = W i 1 k + 2 p s + 1
where k represents the size of the convolution kernel in a 2D convolution, s represents the stride, and p represents the padding. We can adjust the sequence length of the token by changing the stride and padding; this ensures that the output of different convolution kernel sizes attains the same size patch for embedding after convolution. In addition, the Hardswish activation function was executed once after each convolution.

2.4. Multi-Path Context-Feature Aggregation

Although multi-scale convolution can focus on locally connected information and retain a sense of local details, it tends to ignore correlations between patches. On the other hand, a Transformer is capable of obtaining long-range information. When detecting healthy leaves, it is imperative to ensure that local patches are in a healthy condition; this requires not only detailed information at the regional level, but also long-range information. Accordingly, our proposed multi-path context-feature aggregation module further processes multi-scale patches by performing depth convolution and Transformer encoder operations. Thus, local details and long-range information on maize leaves can be obtained simultaneously. Specifically, depth convolution is a composite component that consists of a 1 × 1 convolution, a 3 × 3 DW convolution, and a 1 × 1 convolution with the same channel size. Our Transformer encoder used FactorAtt, which was proposed for a CoAT in [30] and is calculated as follows:
FactorAtt ( Q , K , V ) = Q C ( s o f t m a x ( K ) T V )
where Q, K, and V are the linearly projected queries, keys, and values of the Transformer encoder, respectively. Since the pieces of extracted detailed and long-range feature information are currently independent of each other, we could not maximize their value. Therefore, we performed a multi-scale feature-interaction operation to allow for interactions between detailed and long-range features for enriched representations:
A i = C o n c a t ( [ D i , L i , 0 , , L i , j ] )
where D i represents the detailed feature at stage i, j represents the path of the Transformer encoder, and L i , j represents the long-range feature at stage i in path j. In our implementation, j = 3, which means that there are three Transformer encoder paths, and A i refers to the final aggregated feature.

2.5. Loss Function

Since our maize disease prediction is actually a multi-classification task with four categories in total, we used cross-entropy loss—which is common in classification tasks—as the loss function. In our implementation, each class was compared against all others (as one). We used the softmax function to transform numerical results into probability values. Moreover, the predicted maize type was determined with the maximum probability values—thus achieving multi-classification. Cross-entropy loss was calculated as follows:
L ( p c ) = c = 1 K y c log ( p c )
where K is the total number of maize leaf species, c is the current predicted maize leaf species, y c is the current actual maize leaf species, and p c is the probability that our method will predict the current sample as maize leaf species c.
It is possible to smooth losses by using adversarial training under the given input conditions, which is also an effective technique for data enhancement. Training for deep learning is often sensitive to perturbing or noisy data. In the case of maize disease images, there are differences between samples due to the diversity of the data, which poses a challenge for the model training process. Thus, we adapted adversarial training loss for the purpose of regularization, which was calculated as follows:
L A T = D [ p ( y | x ) , p ( y | x + r a d v , θ ) ]
where r c n represents the added counter noise to the input maize images; this was calculated as follows:
r c n arg max r { D [ p ( y | x ) , p ( y | x + r , θ ] ; r 2 λ }
In the above equations, x represents the input data and y represents the output results. D represents the non-negative measurement of the output after adding noise to the input maize data. p ( y | x ) represents the conditional probability of the input x . represents the L2 norm, limiting the noise value between 0 and 1. r represents the noise in the input maize image, and its distribution follows a mean value of 0 and a variance of 1. The specific noise value is 1 × 10⁻⁶, and λ represents the tolerance value, which is set at 0.5.
KL divergence, sometimes referred to as information divergence, is basically a measure of the relative entropy between characteristics. It is an asymmetric measure that was employed to quantify the difference between the perturbed samples and the initially expected samples in the probability distribution. We calculated it as follows:
D K L ( P Q ) i = 1 N [ P ( x i ) log P ( x i ) P ( x i ) log Q ( x i ) ]
where N represents the number of input maize samples, P ( x i ) represents the actual prediction probability of sample i , and Q ( x i ) represents the prediction probability after noise has been added. It is noteworthy that this loss produces a perturbation for the output results of the network rather than the actual corn disease species. Then, the optimization process was performed by measuring the predicted probabilities before and after the addition of noise.
Therefore, we combined the cross-entropy loss and adversarial training loss as the loss function.

3. Experiments and Results

3.1. Experimental Settings

We performed all of our experiments on a tower server running the Ubuntu 20.04.2 LTS operating system on an Intel(R) Xeon(R) Gold 6226R CPU @ 2.90 GHz CPU (Santa Clara, CA, USA) and an Nvidia Tesla A100 with 80 GB of GPU (Santa Clara, CA, USA) memory. To speed up the training process, our experiments were implemented using the PyTorch deep learning framework. For training, all the experiments were run with a batch size of 32, and the total number of epochs was 200. Our input image size was resized to 224 × 224 pixels. We used the Adam optimizer with an initial learning rate = 0.00008 and a weight decay α = 0.00004 for the rest of the epochs. The specific settings for the hyperparameters during our adversarial training were a perturbation value of 1 × 10⁻⁶ and a tolerance value of 0.5.

3.2. Evaluation Metrics

We chose accuracy, precision, and recall metrics to evaluate the performance of each method in terms of accurate identification, missed detection, and false identification. These metrics were defined as follows:
A c c u r a c y = T P + T N T P + T N + F P + F N
P r e c i s i o n = T P T P + F P
R e c a l l = T P T P + F N
where TP represents the number of true positives, TN represents the number of true negatives, FP represents the number of false positives, and FN represents the number of false negatives.

3.3. Quantitative Analysis

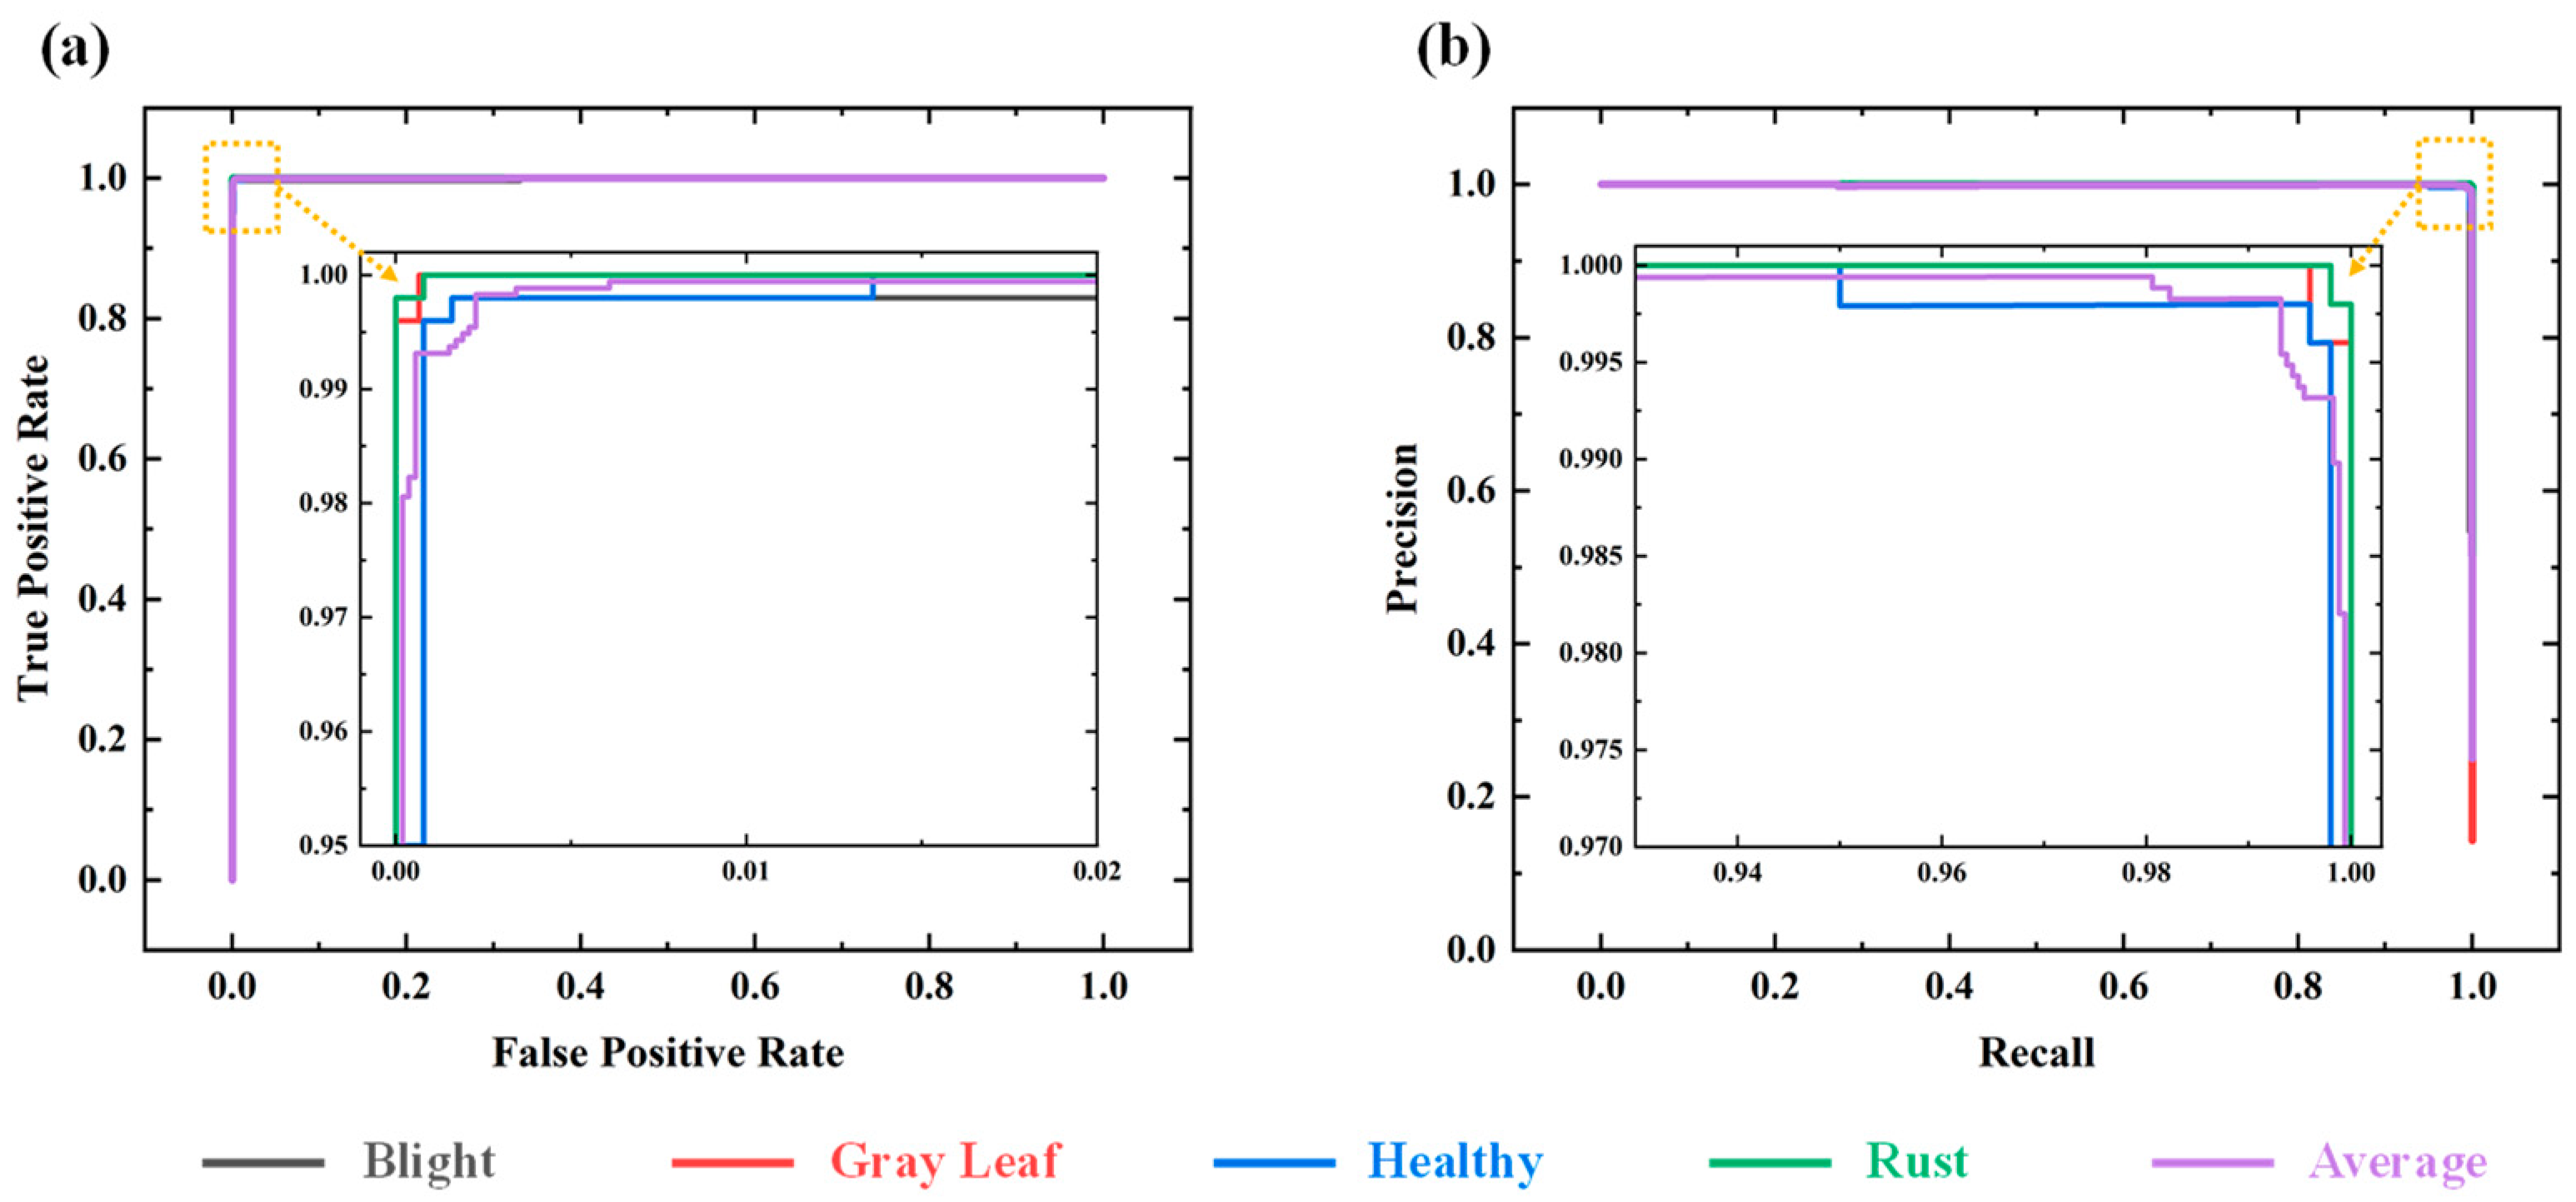
The receiver operating characteristic (ROC) and precision-recall (PR) curves are shown in Figure 4a,b, respectively, and both demonstrate the excellent prediction performance of our method. Since the values of the curves were close to 1, there was an overlap of the curves. Therefore, to facilitate observations with the experimental results, we further zoomed in on the images. The larger the area formed by the curve with the horizontal axis for either the ROC curve or PR curve, the better the performance. Clearly, our method generated near-perfect metric results, as the two curves were very close to the upper-left and upper-right corners. This shows that our method, which uses multi-scale patch embedding and multi-path context-feature aggregation, can further enhance the overall prediction performance for maize disease density prediction. It is evident that our method, which makes use of multi-scale patch embedding and multi-path context-feature aggregation, allows us to extract and characterize the features of diseased and healthy maize leaves more accurately.
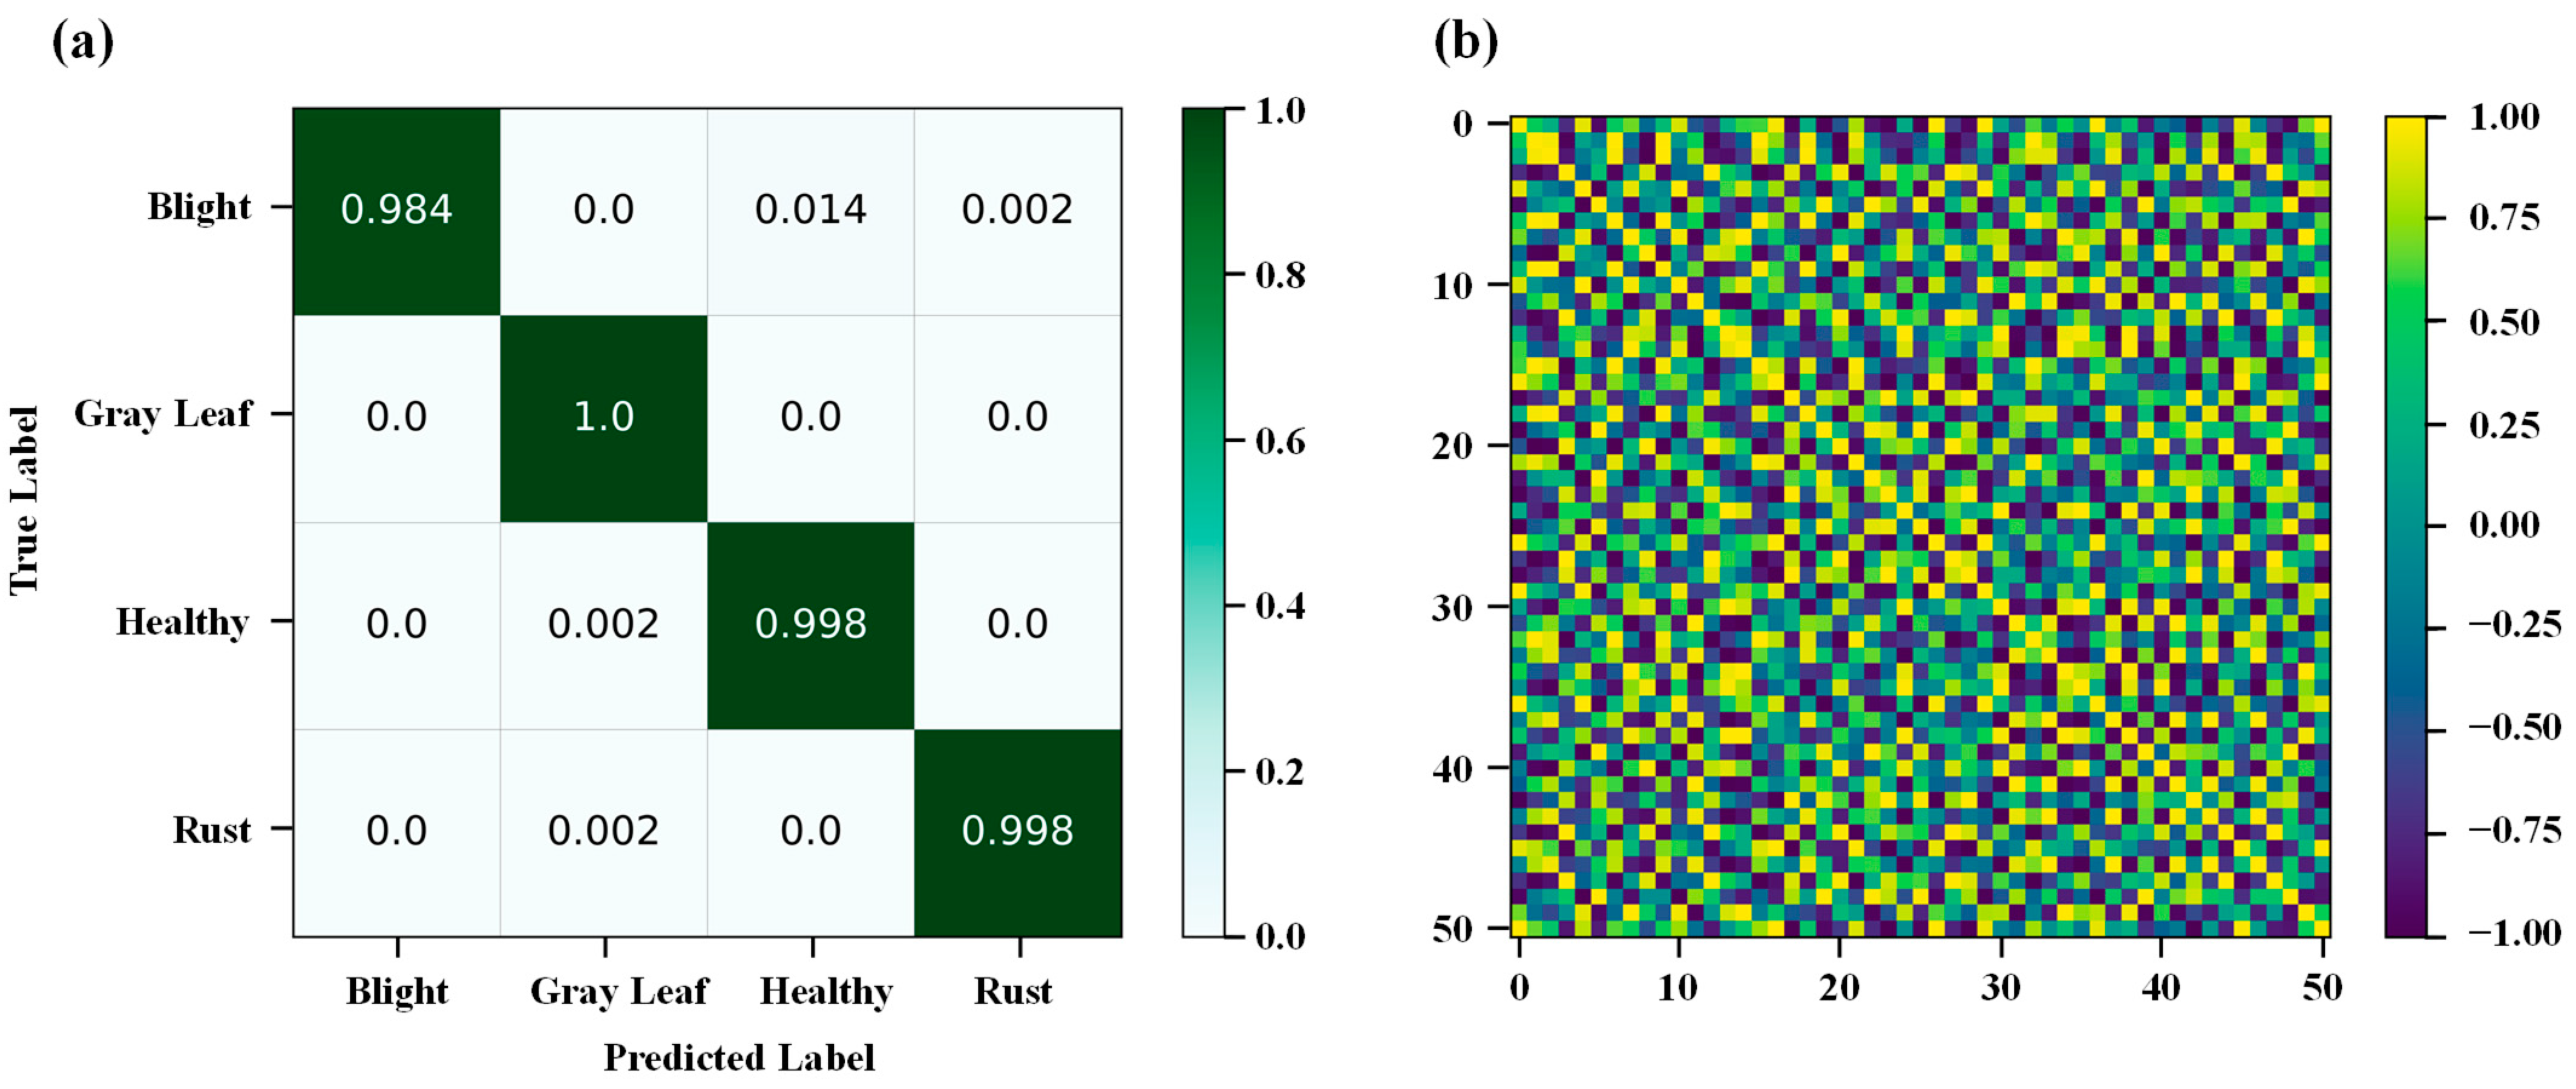
As shown in Figure 5a, we computed the confusion matrix to obtain explanatory insights into the maize disease density prediction results. The dark-colored squares on the diagonal indicate correct predictions, while the other light-colored squares indicate incorrect predictions. We can see that the diagonal prediction values were close to 1. It is evident from these results that our method was capable of obtaining the corresponding features for the three types of diseased maize leaves and the healthy maize leaves—thereby allowing us to make correct density predictions.
Our network was divided into four stages, with each stage progressively refining the acquired features. At the final stage of the net process, we chose 51 random samples from the validation set; first, we clustered them, followed by calculating the Euclidean distances between each pair, computing similarity scores (ranging from 0 to 1), and finally, plotting the correlation matrix in Figure 5b. The highest value is highlighted on the diagonal of the correlation matrix, which indicates that the distance between the two feature maps was relatively close to zero. In addition to the diagonal data, the similarity scores for the remaining data were also high, which indicates that the feature representations learned by our method through multi-scale patch embedding and multi-path context-feature aggregation were very similar to the actual feature representations in the Euclidean distance space—demonstrating that our method can obtain robust representations of feature information.
As shown in Table 2, we compared the results of the various methods (VGG11 [31], EfficientNet [32], Inception-v3 [33], MobileNet [34], ResNet50 [35], ViT [36], and Improved ViT [22]) by using three metrics on the Plant Village dataset. Among them, VGG11, EfficientNet, Inception-v3, MobileNet, and ResNet50 had an average accuracy of 97.9%, 91.6%, 97.2%, 90.2% and 96.6%, respectively. Benefiting from the self-attentive mechanism in the Transformer, ViT, Improved ViT, and our method achieved an average accuracy of 93.9%, 98.7%, and 99.5%, respectively—which is much higher than that of other CNN-based methods. For the precision and recall metrics, we tested the results of predictive metrics for each of the three types of diseased maize leaves as well as the healthy leaves according to the distribution of the dataset. As a result of the clever combination of depth convolution and a Transformer encoder, we achieved precision and recall metrics of 98.6% and 99.8% on healthy leaves, respectively. In addition, our method detected gray leaves with a recall value of 100%; this is an encouraging result, indicating that our multi-scale patch embedding module can effectively extract gray leaves’ disease characteristics.

3.4. Interpretability Analysis

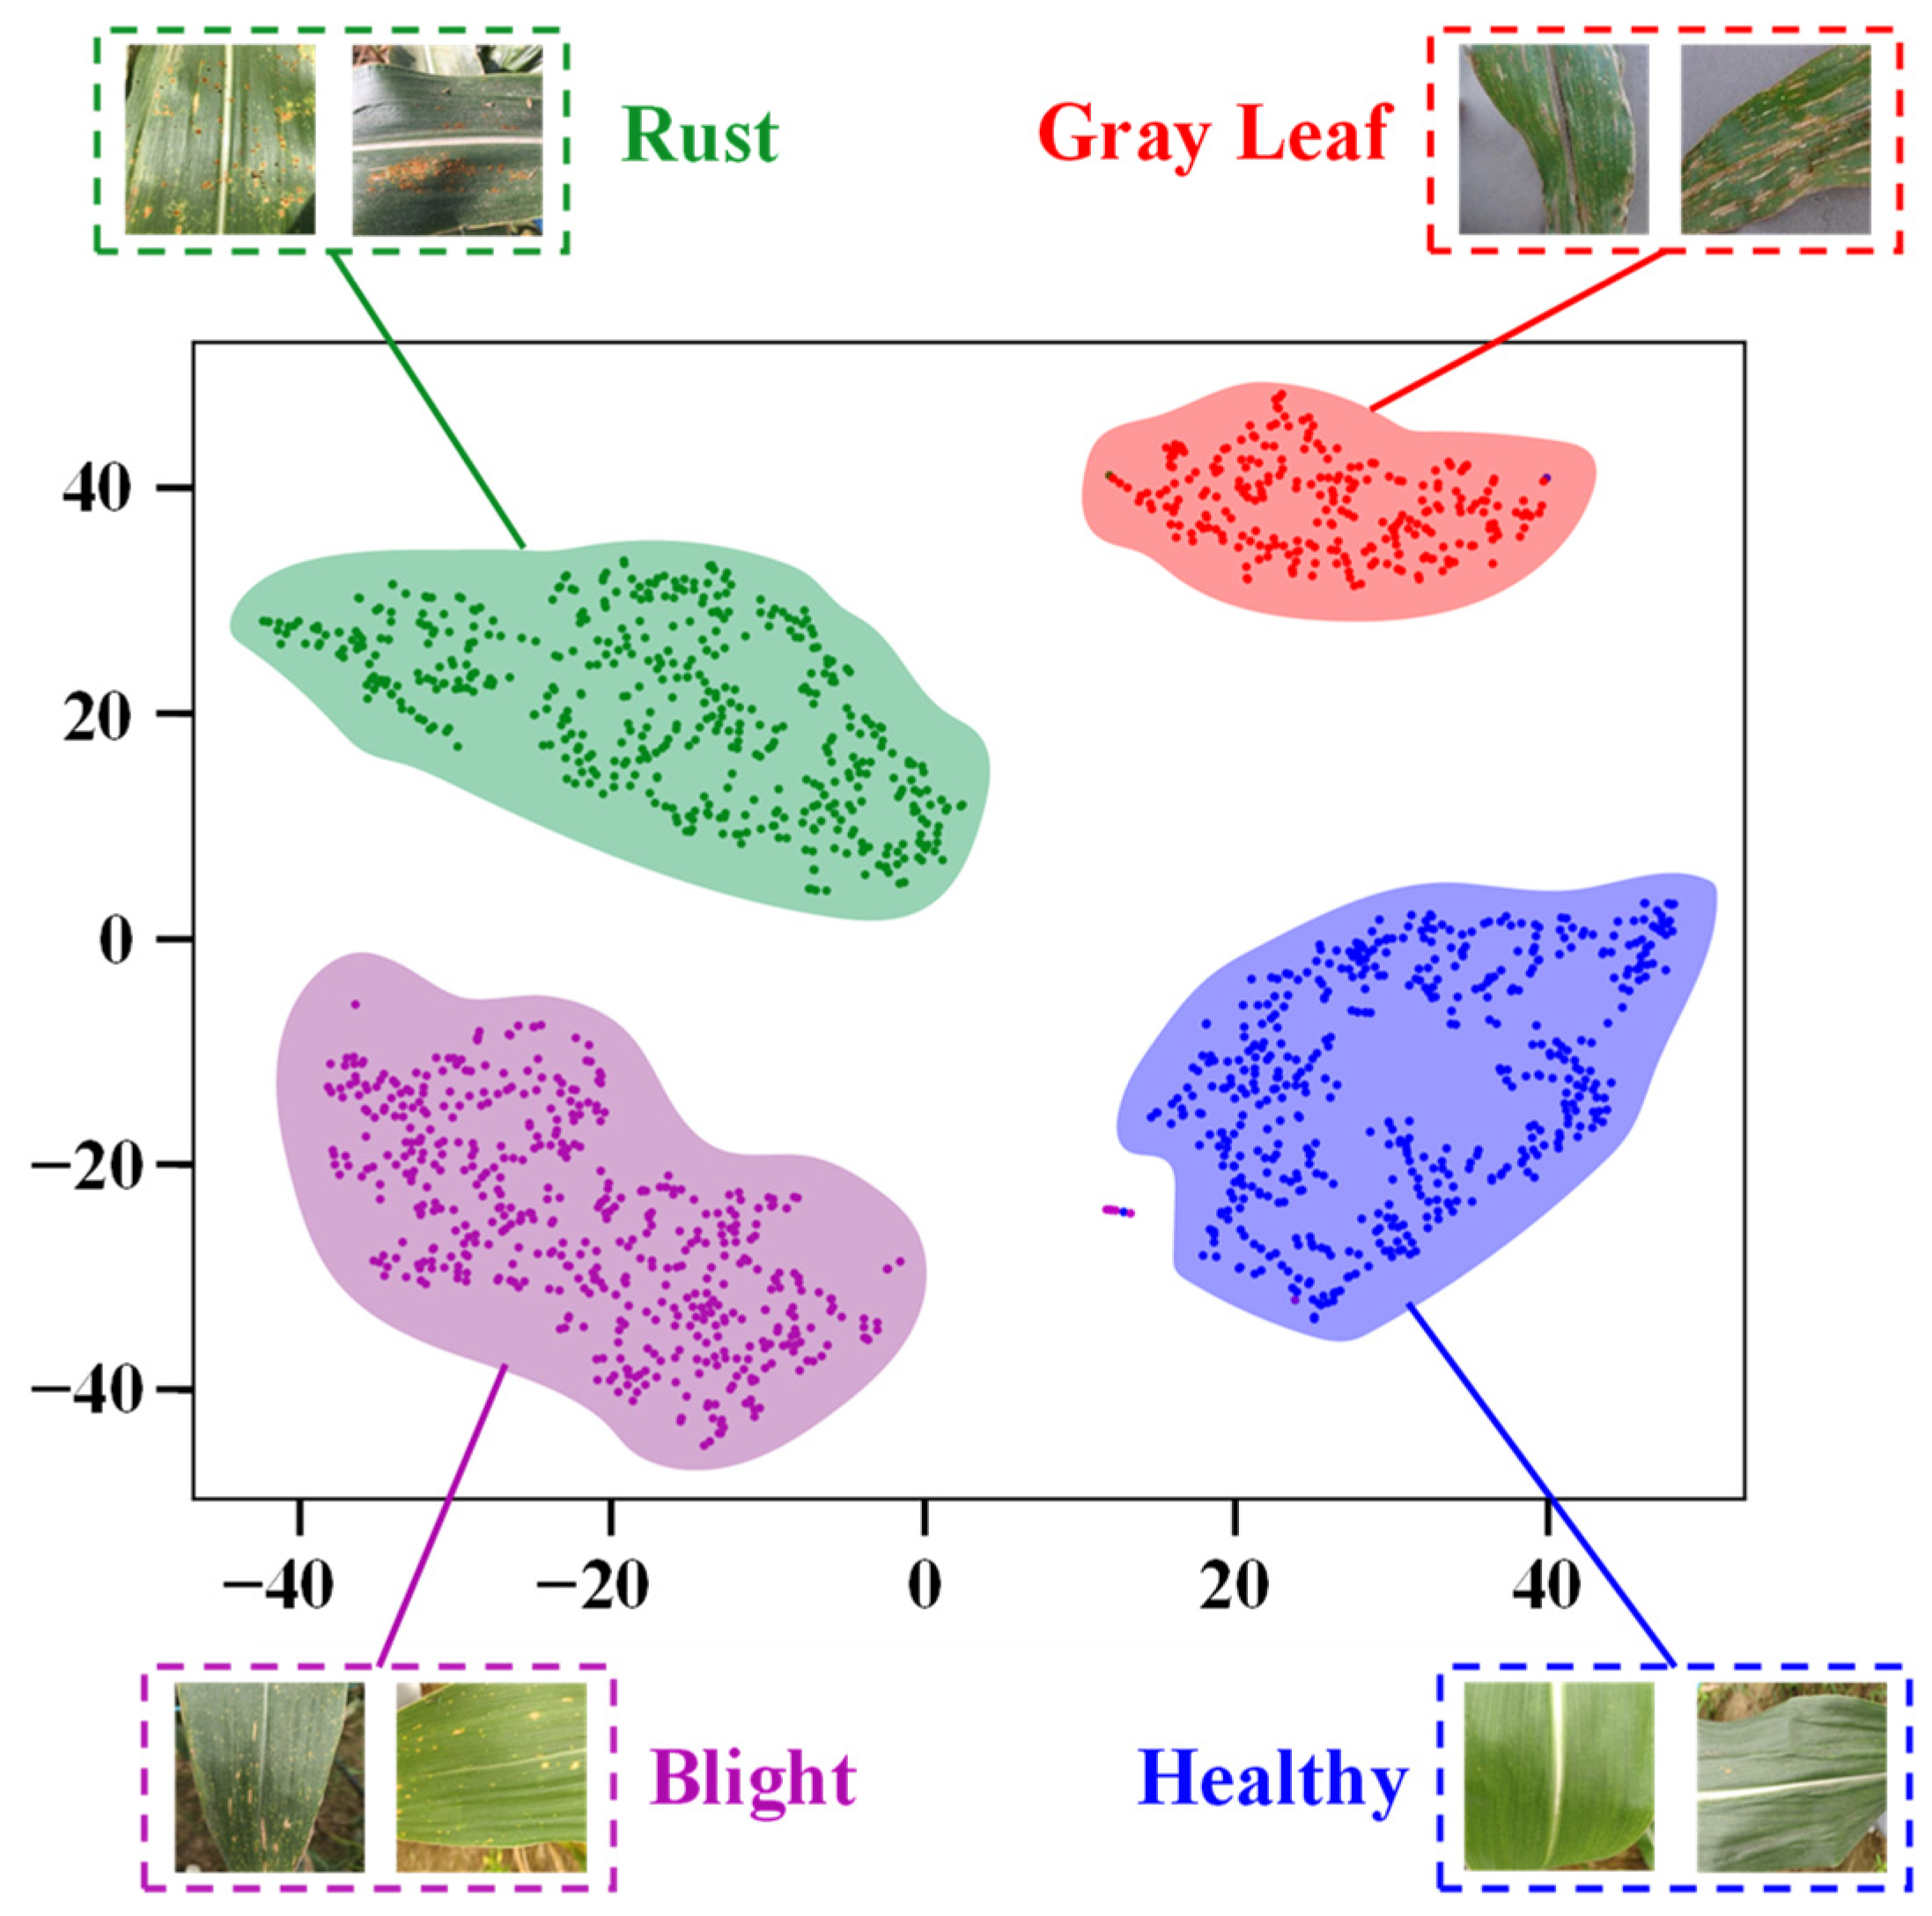
By utilizing the t-distributed stochastic neighbor embedding algorithm (t-SNE) [37], the regional variation in data density is represented by distance, and the size of the clustering set does not reflect the actual distance. Taking advantage of this nonlinear generative relationship, t-SNE is able to classify data results more accurately. As shown in Figure 6, the various colors indicated similarities between the three types of diseased maize leaves and the healthy leaves. Except for a small number of blight samples scattered far from the set, the other three types of samples were well grouped in their own neighborhoods. As a result, we can conclude that our proposed method is able to learn to identify similar representations from different maize samples.

4. Discussion

Maize disease recognition is of paramount importance in the agricultural field, and many researchers have studied a variety of algorithms for disease recognition; however, there are still defects. Traditional machine learning methods have a poor feature extraction ability, lack of robustness, and high requirements for training data quality—resulting in a low recognition accuracy. Deep learning methods are mostly based on neural networks; detecting and predicting maize diseases effectively and accurately is difficult because only local characteristics are taken into account and global information is not incorporated.
Despite the fact that we used images of three different varieties of diseased maize leaves in addition to healthy maize leaves, their appearance features were relatively similar—in particular, their predominant color was green. In terms of lesion characteristics, there were no significant differences between the three types of diseased leaves (mostly small spots), which presented an additional challenge for the detection method.
In our experiments, we tested eight methods: five CNN-based and three Transformer-based methods. CNN-based approaches rely primarily on convolutional methods for implementation and have the advantage of extracting local features. Our experimental results indicated that VGG-11 achieved an average accuracy of 97.6%. In addition, Thakur et al. [38] created a lightweight VGGNet to detect three crop diseases with an accuracy of 99.16%. Li et al. [39] combined inflated convolution and attention mechanisms to detect corn diseases in a field environment.
The CNN-based methods produced good results; however, the overall effect was not as effective as the Transformer-based methods due to the complex backgrounds of the corn images in natural environments and the close relationships between the spots—whereas convolution ignored long-range information, which is extremely important [40]. From our experimental results, we can see that the patch-embedding operation segmented the maize image into multiple patches and enhanced the correlation between the regions—thereby improving the feature representation of the disease. The Improved ViT and our method both achieved 100% recall metrics for two maize diseases—leaf rust and leaf blight—further demonstrating the Transformer’s effectiveness for maize disease detection.
Based on the above discussion, our adversarial training collaborating multi-path context feature aggregation network is able to obtain tokens of different scales through multi-scale patch embedding, which can be independently input into Transformer encoders through multiple paths. In the process of multi-path context feature aggregation, multi-scale feature interactions can connect local features extracted by convolution with global features obtained by the Transformer, which can maximize the advantages of the local connectivity of convolution and the global relevance of the Transformer. Finally, the robustness and feature extraction ability of the model are further improved by the adversarial training method. On the Plant Village dataset—consisting of three diseases (blighted leaves, gray leaves, and rusted leaves) and healthy maize leaves—we achieved an average accuracy of 99.50%. Our method has a strong practical application value; it can help planters detect disease in a timely and accurate manner. It can also prevent and control pests and diseases, improve maize yield, and increase economic benefits.

5. Conclusions

In this paper, we proposed an adversarial training collaborating multi-path context feature aggregation network for maize disease density prediction. Multi-scale patch embedding is capable of extracting multiple tokens with corresponding features from various maize disease images, while multi-path context feature aggregation independently interacts with the extracted tokens at different scales through multiple paths—thus achieving effective multi-scale feature aggregation. Finally, we used the adversarial training method to reduce the problem of network overfitting and further improve the robustness and generalization of the model. We conducted quantitative analysis and interpretability analysis on the Plant Village dataset. As a result, we achieved high-quality results—with a recognition accuracy of 98.4%, 99.60%, 98.62%, and 99.80% for leaf blight, gray leaf, healthy leaf, and leaf rust images, respectively. In the future, we will further optimize the network structure to improve its recognition accuracy, and also apply it for the recognition of more kinds of plant diseases.

Author Contributions

Conceptualization, W.Y., P.S. and Z.Y.; methodology, W.Y.; software, Z.Z.; validation, C.X.; formal analysis, L.M.; investigation, L.M.; data curation, P.S.; writing—original draft preparation, Z.Y.; writing—review and editing, P.S.; visualization, Z.Z.; supervision, W.Y. and Y.L.; project administration, W.Y.; funding acquisition, W.Y., Z.Z. and C.X. All authors have read and agreed to the published version of the manuscript.

Funding

This research was funded by the National Natural Science Foundation of China (Nos. 41601443 and 42071353); Scientific Research Foundation for Doctoral Program of Hubei University of Technology (BSQD2020056); Science and Technology Research Project of Education Department of Hubei Province (B2021351); Natural Science Foundation of Hubei Province (2022CFB501); and University Student Innovation and Entrepreneurship Training Program Project (202210500028).

Data Availability Statement

Not applicable.

Conflicts of Interest

The authors declare no conflict of interest.

References

  1. Upadhyay, M.K.; Shukla, A.; Yadav, P.; Srivastava, S. A review of arsenic in crops, vegetables, animals and food products. Food Chem. 2019, 276, 608–618. [Google Scholar] [CrossRef] [PubMed]
  2. Hou, P.; Liu, Y.; Liu, W.; Liu, G.; Xie, R.; Wang, K.; Ming, B.; Wang, Y.; Zhao, R.; Zhang, W. How to increase maize production without extra nitrogen input. Resour. Conserv. Recycl. 2020, 160, 104913. [Google Scholar] [CrossRef]
  3. Adisa, O.M.; Botai, J.O.; Adeola, A.M.; Hassen, A.; Botai, C.M.; Darkey, D.; Tesfamariam, E. Application of artificial neural network for predicting maize production in South Africa. Sustainability 2019, 11, 1145. [Google Scholar] [CrossRef] [Green Version]
  4. Kaur, N.; Vashist, K.K.; Brar, A. Energy and productivity analysis of maize based crop sequences compared to rice-wheat system under different moisture regimes. Energy 2021, 216, 119286. [Google Scholar] [CrossRef]
  5. Letsoin, S.M.A.; Purwestri, R.C.; Perdana, M.C.; Hnizdil, P.; Herak, D. Monitoring of Paddy and Maize Fields Using Sentinel-1 SAR Data and NGB Images: A Case Study in Papua, Indonesia. Processes 2023, 11, 647. [Google Scholar] [CrossRef]
  6. Zhou, L.; Gu, X.; Cheng, S.; Yang, G.; Shu, M.; Sun, Q. Analysis of plant height changes of lodged maize using UAV-LiDAR data. Agriculture 2020, 10, 146. [Google Scholar] [CrossRef]
  7. Zhang, Y.; Wa, S.; Liu, Y.; Zhou, X.; Sun, P.; Ma, Q. High-accuracy detection of maize leaf diseases CNN based on multi-pathway activation function module. Remote Sens. 2021, 13, 4218. [Google Scholar] [CrossRef]
  8. Arora, J.; Agrawal, U. Classification of Maize leaf diseases from healthy leaves using Deep Forest. J. Artif. Intell. Syst. 2020, 2, 14–26. [Google Scholar] [CrossRef] [Green Version]
  9. Ali, I.; HUO, X.-x.; Khan, I.; Ali, H.; Khan, B.; Khan, S.U. Technical efficiency of hybrid maize growers: A stochastic frontier model approach. J. Integr. Agric. 2019, 18, 2408–2421. [Google Scholar] [CrossRef]
  10. Alemu, G.T.; Nigussie, Z.; Haregeweyn, N.; Berhanie, Z.; Wondimagegnehu, B.A.; Ayalew, Z.; Molla, D.; Okoyo, E.N.; Baributsa, D. Cost-benefit analysis of on-farm grain storage hermetic bags among small-scale maize growers in northwestern Ethiopia. Crop Prot. 2021, 143, 105478. [Google Scholar] [CrossRef]
  11. Lv, M.; Zhou, G.; He, M.; Chen, A.; Zhang, W.; Hu, Y. Maize leaf disease identification based on feature enhancement and DMS-robust alexnet. IEEE Access 2020, 8, 57952–57966. [Google Scholar] [CrossRef]
  12. Waldamichael, F.G.; Debelee, T.G.; Schwenker, F.; Ayano, Y.M.; Kebede, S.R. Machine learning in cereal crops disease detection: A review. Algorithms 2022, 15, 75. [Google Scholar] [CrossRef]
  13. Chen, J.; Wang, W.; Zhang, D.; Zeb, A.; Nanehkaran, Y.A. Attention embedded lightweight network for maize disease recognition. Plant Pathol. 2021, 70, 630–642. [Google Scholar] [CrossRef]
  14. Orchi, H.; Sadik, M.; Khaldoun, M. On using artificial intelligence and the internet of things for crop disease detection: A contemporary survey. Agriculture 2022, 12, 9. [Google Scholar] [CrossRef]
  15. Fenu, G.; Malloci, F.M. Forecasting plant and crop disease: An explorative study on current algorithms. Big Data Cogn. Comput. 2021, 5, 2. [Google Scholar] [CrossRef]
  16. Zhang, Z.; He, X.; Sun, X.; Guo, L.; Wang, J.; Wang, F. Image recognition of maize leaf disease based on GA-SVM. Chem. Eng. Trans. 2015, 46, 199–204. [Google Scholar]
  17. Aravind, K.; Raja, P.; Mukesh, K.; Aniirudh, R.; Ashiwin, R.; Szczepanski, C. Disease classification in maize crop using bag of features and multiclass support vector machine. In Proceedings of the 2nd International Conference on Inventive Systems and Control, Coimbatore, India, 19–20 January 2018; pp. 1191–1196. [Google Scholar]
  18. Zhang, S.; Shang, Y.; Wang, L. Plant disease recognition based on plant leaf image. J. Anim. Plant Sci. 2015, 25, 42–45. [Google Scholar]
  19. Alehegn, E. Ethiopian maize diseases recognition and classification using support vector machine. Int. J. Comput. Vis. Robot. 2019, 9, 90–109. [Google Scholar] [CrossRef]
  20. Waheed, A.; Goyal, M.; Gupta, D.; Khanna, A.; Hassanien, A.E.; Pandey, H.M. An optimized dense convolutional neural network model for disease recognition and classification in corn leaf. Comput. Electron. Agric. 2020, 175, 105456. [Google Scholar] [CrossRef]
  21. Gui, P.; Dang, W.; Zhu, F.; Zhao, Q. Towards automatic field plant disease recognition. Comput. Electron. Agric. 2021, 191, 106523. [Google Scholar] [CrossRef]
  22. Qian, X.; Zhang, C.; Chen, L.; Li, K. Deep learning-based identification of maize leaf diseases is improved by an attention mechanism: Self-Attention. Front. Plant Sci. 2022, 13, 864486. [Google Scholar] [CrossRef] [PubMed]
  23. DeChant, C.; Wiesner-Hanks, T.; Chen, S.; Stewart, E.L.; Yosinski, J.; Gore, M.A.; Nelson, R.J.; Lipson, H. Automated identification of northern leaf blight-infected maize plants from field imagery using deep learning. Phytopathology 2017, 107, 1426–1432. [Google Scholar] [CrossRef] [PubMed] [Green Version]
  24. Xu, Y.; Zhao, B.; Zhai, Y.; Chen, Q.; Zhou, Y. Maize diseases identification method based on multi-scale convolutional global pooling neural network. IEEE Access 2021, 9, 27959–27970. [Google Scholar] [CrossRef]
  25. Ahila Priyadharshini, R.; Arivazhagan, S.; Arun, M.; Mirnalini, A. Maize leaf disease classification using deep convolutional neural networks. Neural Comput. Appl. 2019, 31, 8887–8895. [Google Scholar] [CrossRef]
  26. Lee, Y.; Kim, J.; Willette, J.; Hwang, S.J. Mpvit: Multi-path vision transformer for dense prediction. In Proceedings of the IEEE/CVF Conference on Computer Vision and Pattern Recognition, New Orleans, Louisiana, USA, 19–24 June 2022; pp. 7287–7296. [Google Scholar]
  27. Aregbesola, E.; Ortega-Beltran, A.; Falade, T.; Jonathan, G.; Hearne, S.; Bandyopadhyay, R. A detached leaf assay to rapidly screen for resistance of maize to Bipolaris maydis, the causal agent of southern corn leaf blight. Eur. J. Plant Pathol. 2020, 156, 133–145. [Google Scholar] [CrossRef] [Green Version]
  28. Saito, B.C.; Silva, L.Q.; Andrade, J.A.d.C.; Goodman, M.M. Adaptability and stability of corn inbred lines regarding resistance to gray leaf spot and northern leaf blight. Crop Breed. Appl. Biotechnol. 2018, 18, 148–154. [Google Scholar] [CrossRef] [Green Version]
  29. Wang, S.; Chen, Z.; Tian, L.; Ding, Y.; Zhang, J.; Zhou, J.; Liu, P.; Chen, Y.; Wu, L. Comparative proteomics combined with analyses of transgenic plants reveal Zm REM 1.3 mediates maize resistance to southern corn rust. Plant Biotechnol. J. 2019, 17, 2153–2168. [Google Scholar] [CrossRef]
  30. Dai, Z.; Liu, H.; Le, Q.V.; Tan, M. Coatnet: Marrying convolution and attention for all data sizes. Adv. Neural Inf. Process. Syst. 2021, 34, 3965–3977. [Google Scholar]
  31. Simonyan, K.; Zisserman, A. Very deep convolutional networks for large-scale image recognition. arXiv 2014, arXiv:1409.1556. [Google Scholar]
  32. Tan, M.; Le, Q. Efficientnet: Rethinking model scaling for convolutional neural networks. In Proceedings of the International Conference on Machine Learning, Long Beach, CA, USA, 10–15 June 2019; pp. 6105–6114. [Google Scholar]
  33. Szegedy, C.; Vanhoucke, V.; Ioffe, S.; Shlens, J.; Wojna, Z. Rethinking the inception architecture for computer vision. In Proceedings of the IEEE Conference on Computer Vision and Pattern Recognition, Las Vegas, NV, USA, 27–30 June 2016; pp. 2818–2826. [Google Scholar]
  34. Sandler, M.; Howard, A.; Zhu, M.; Zhmoginov, A.; Chen, L.-C. Mobilenetv2: Inverted residuals and linear bottlenecks. In Proceedings of the IEEE Conference on Computer Vision and Pattern Recognition, Salt Lake City, UT, USA, 18–23 June 2018; pp. 4510–4520. [Google Scholar]
  35. He, K.; Zhang, X.; Ren, S.; Sun, J. Deep residual learning for image recognition. In Proceedings of the IEEE Conference on Computer Vision and Pattern Recognition, Las Vegas, NV, USA, 27–30 June 2016; pp. 770–778. [Google Scholar]
  36. Dosovitskiy, A.; Beyer, L.; Kolesnikov, A.; Weissenborn, D.; Zhai, X.; Unterthiner, T.; Dehghani, M.; Minderer, M.; Heigold, G.; Gelly, S. An image is worth 16x16 words: Transformers for image recognition at scale. arXiv 2020, arXiv:2010.11929. [Google Scholar]
  37. Linderman, G.C.; Steinerberger, S. Clustering with t-SNE, provably. SIAM J. Math. Data Sci. 2019, 1, 313–332. [Google Scholar] [CrossRef] [PubMed] [Green Version]
  38. Thakur, P.S.; Sheorey, T.; Ojha, A. VGG-ICNN: A Lightweight CNN model for crop disease identification. Multimed. Tools Appl. 2023, 82, 497–520. [Google Scholar] [CrossRef]
  39. Li, E.; Wang, L.; Xie, Q.; Gao, R.; Su, Z.; Li, Y. A novel deep learning method for maize disease identification based on small sample-size and complex background datasets. Ecol. Inform. 2023, 75, 102011. [Google Scholar] [CrossRef]
  40. Li, X.; Chen, X.; Yang, J.; Li, S. Transformer helps identify kiwifruit diseases in complex natural environments. Comput. Electron. Agric. 2022, 200, 107258. [Google Scholar] [CrossRef]
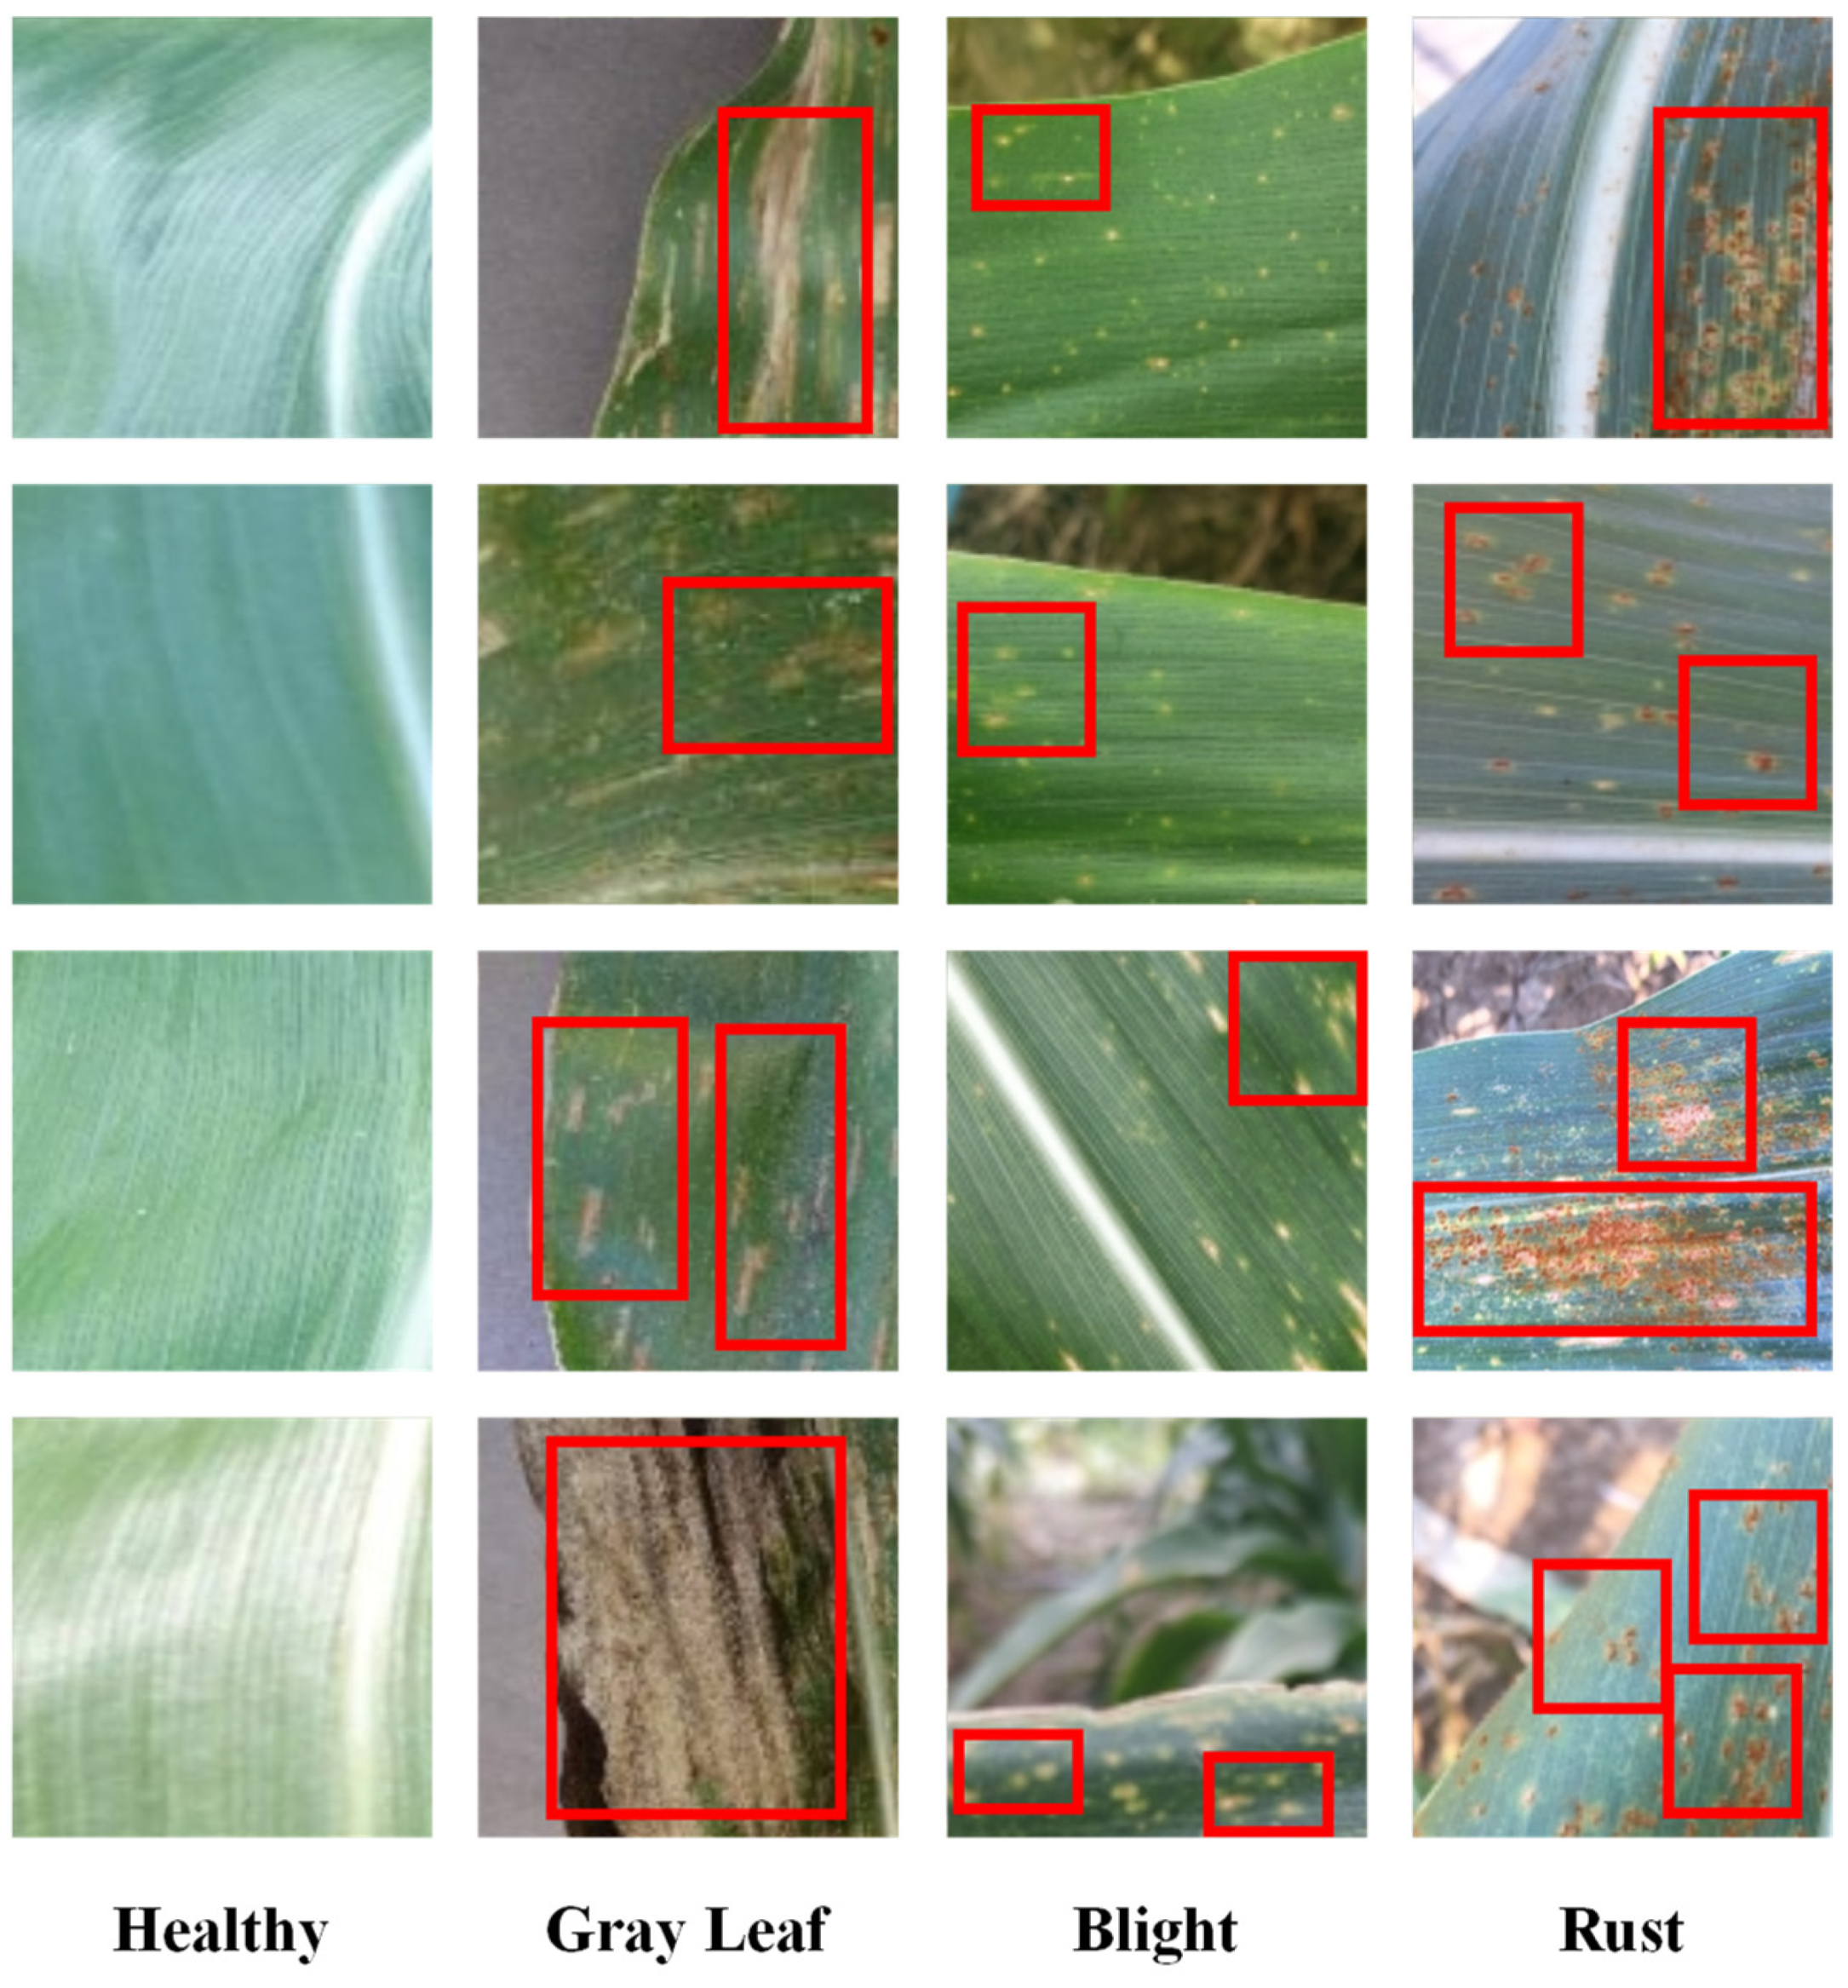
Figure 1. Depiction of diseased and healthy maize leaves from the Plant Village dataset. Note that the red rectangles correspond to maize disease characteristics.
Processes 11 01132 g001
Figure 2. Overview of the proposed adversarial training, collaborating, multi-path context-feature aggregation network.
Processes 11 01132 g002
Figure 3. Schematic diagram of the multi-scale patch embedding.
Processes 11 01132 g003
Figure 4. Results of the quantitative analysis. (a) ROC curve of maize disease prediction. (b) PR curve of maize disease prediction. Note that the yellow rectangle and arrow are for expanded display.
Processes 11 01132 g004
Figure 5. Results of the quantitative analysis. (a) Confusion matrix. (b) Correlation matrix of 51 randomly chosen testing maize samples.
Processes 11 01132 g005
Figure 6. t-SNE visualization of the feature representations of the validation set.
Processes 11 01132 g006
Table 1. Distribution details of the maize disease dataset.
TypeLeaf BlightGray LeafHealthy LeafLeaf Rust
Training Set174375019351523
Testing Set500250500500
Total2243100024352023
Table 2. Comparison of three metrics to the results of other methods.
MetricsVGG11EfficientNetInception-v3MobileNetResNet50ViTImproved ViTOur Proposed Method
Accuracy97.9%91.6%97.2%90.2%96.6%93.9%98.7%99.5%
Precision
Leaf Blight99%90%97%88%99%92%99%98.4%
Gray Leaf100%97%99%99%100%96%100%99.6%
Healthy Leaf96%88%96%88%94%91%97%98.6%
Leaf Rust98%94%98%92%96%98%99%99.8%
Recall
Leaf Blight96%86%94%86%91%90%97%98.4%
Gray Leaf97%89%98%85%97%92%99%100%
Healthy Leaf100%92%98%93%99%95%99%99.8%
Leaf Rust99%98%100%96%99%97%100%99.8%
Disclaimer/Publisher’s Note: The statements, opinions and data contained in all publications are solely those of the individual author(s) and contributor(s) and not of MDPI and/or the editor(s). MDPI and/or the editor(s) disclaim responsibility for any injury to people or property resulting from any ideas, methods, instructions or products referred to in the content.