Article

Adsorption of As and Pb by Stone Powder/Chitosan/Maghemite Composite Beads (SCM Beads): Kinetics and Column Study

School of Architectural, Civil, Environmental, and Energy Engineering, Kyungpook National University, Daegu 41566, Republic of Korea
*
Author to whom correspondence should be addressed.
Processes 2023, 11(2), 581; https://doi.org/10.3390/pr11020581
Submission received: 24 December 2022 / Revised: 9 February 2023 / Accepted: 13 February 2023 / Published: 14 February 2023

Abstract

:
Adsorption kinetics of As and Pb onto composite beads synthesized with stone powder, chitosan, and maghemite (SCM beads) with weight ratio of 1:1:0.5 were investigated in batch mode. Several kinetic models such as pseudo-first order kinetic model (PFOKM), pseudo-second order kinetic model (PSOKM), two compartment first order kinetic model (TCFOKM), and modified two compartment first order kinetic model (MTCFOKM) were utilized to analyze the kinetics. Although the beads had low specific surface area and pore volume, MTCFOKM, one of two compartment models, could predict the most accurately because the As and Pb were adsorbed onto at least two kinds of adsorption sites such as functional groups in chitosan and Fe in maghemite. In MTCFOKM, both the fast adsorption fraction (f1’) and the fast adsorption constant (k1’) for Pb were higher than those for As. Therefore, the equilibrium time (teq) for Pb adsorption was shorter than that for As adsorption, indicating that Pb adsorption was more affinitive than As adsorption onto SCM beads (especially maghemite). Column study with a bed column reactor packed with the SCM beads was also conducted. For column study, the effect of flow rate and pore volume on removal efficiency of As and Pb was also investigated. Three models such as the Thomas, Adams-Bohart (A-B), and Yoon-Nelson (Y-N) models were used to fit the column experimental data to analyze the breakthrough curves and the saturation time. Both Thomas and Y-N models were most appropriate. Conclusively, the SCM beads are suitable for adsorption treatment of As and Pb from contaminated groundwater and are particularly effective in Pb removal.

1. Introduction

Arsenic (As) and lead (Pb) contamination of surface water and groundwater has become a worldwide serious environmental problem [1,2]. As is recognized as the most hazardous element along with Pb. Many people have been exposed to high levels of As and Pb via intake of contaminated surface water and groundwater [3,4]. In particular, serious As concentration problems in groundwater have been reported not only in Southeast Asian countries but also in the United States, Mexico, Argentina, and Austria. [5] Groundwater contamination has been due to various contamination sources such as mining, fertilizers, sewage sludge, chemical industry, and electronics [6,7]. Therefore, in order to protect the health of humans and ecosystems from continuous exposure to As and Pb, various technologies that can remove effectively As and Pb are continuously being studied.
Adsorption has been considered as one of the effective As and Pb removal technologies [8,9,10]. Many innovative adsorbents including iron-based magnetic composites, green biosorbents and bismuthal nanocomposites have been synthesized and evaluated for heavy metal removal [8,11,12,13,14,15,16,17]. In particular, various types of iron-based adsorbents such as goethite, ferrihydrite, hematite, magnetite, and maghemite as well as synthetized iron-based composite beads have been actively developed and tested [11,12,13,14,15]. In previous study [18], stone powder/chitosan/maghemite (SCM) composite beads were synthesized with component weight ratio of 1/1/0.1, 1/1/0.3, and 1/1/0.5 (wt.) to remove As and Pb. The stone powder (SP) was used to act as a frame structure, chitosan was used as a cross-linker supported by using triphosphate which can be prevent the liquidation of chitosan [12,14,19], and maghemite acted as the main adsorbent among the bead components. The maghemite was also known as its magneticity which can help to be convenient for installation and retrieval on site.
In previous studies [15,18], adsorption capability of the SCM beads for As and Pb was estimated throughout adsorption isotherm experiments. Several isotherm models (Langmuir, Freundlich, and D-R models) were utilized to obtain the maximum adsorption capacity. The results showed that the SCM beads had maximum adsorption capacities of 1.83 and 50.0 mmol/kg for As and Pb, respectively, and the optimum weight ratio of stone powder, chitosan, and maghemite in the beads for the maximum adsorption performance of the beads was 1:1:0.5. This research had significance in contributing to recycle the wasted stone powder for environmental purpose as well as construction purpose in Republic of Korea. However, further studies are still required for field application, such as adsorption rate, adsorption equilibrium time, effect of other ions, groundwater flow rate, pore volume, flow length (e.g., bed height), and stability of beads against field conditions.
Adsorption kinetic study is necessary as a prerequisite for field application. Particularly, the analysis of the two-compartment kinetics model is attracting attention since the multi-component adsorbent has non-uniform adsorption sites [20]. The column studies are also necessary to obtain some fundamental data before field applications related to the effects of groundwater flow rate, pore volume, and bed height on As and Pb adsorptive removal [21]. However, since research on SCM is still in its infancy, laboratory interpretation of influencing factors is given priority before field application.
The objective of this study is to evaluate the adsorption rate and equilibrium time via adsorption kinetic experiments and kinetic model analysis. The adsorption kinetic models utilized in this study were pseudo-first order kinetic model (PFOKM), pseudo-second order kinetic model (PSOKM), two compartment first-order kinetic model (TCFOKM), and modified TCFOKM (MTCFOKM). A fixed bed column experiments packed with the composite bead adsorbent were also carried out with different flow rates to determine the effect of flow rate on As and Pb breakthrough curves and on the maximum capacity of the fixed bed by using several column models such as Thomas model, Adams-Bohart model, and Yoon-Nelson model.

2. Materials and Methods

2.1. Materials

Stone powder was obtained from a masonry mill in Yeongcheon, Republic of Korea and sieved using a 75 μm mesh (sieve #200) before use [18,22]. Chitosan with 75–85% degree of deacetylation was purchased from Showa, Japan. Arsenic and Lead were used as the metal pollutants. As the arsenic source, disodium arsenate heptahydrate (Na2HAsO4, >99%) was purchased from Wako, Japan and for the Pb source, lead nitrate (Pb(NO3)2, >99%) was purchased from Duksan Co., Ansan, Korea. Iron(II) chloride (FeCl2, >99%), iron(III) chloride anhydrous (FeCl3, >98%), acetic acid (CH3COOH, >98%), and hydrochloric acid (HCl, 35–37%) were purchased from Duksan Co., Ansan, Korea. Sodium tripolyphosphate (STPP, NaP3O10, >99%) and sodium bicarbonate (NaHCO3, >99%) were also purchased from Daejung Co., Siheung, Republic of Korea. Iron(III) nitrate (Fe(NO3)3 9H2O, >98%) were also purchased from OCI Co., Seoul, Republic of Korea.

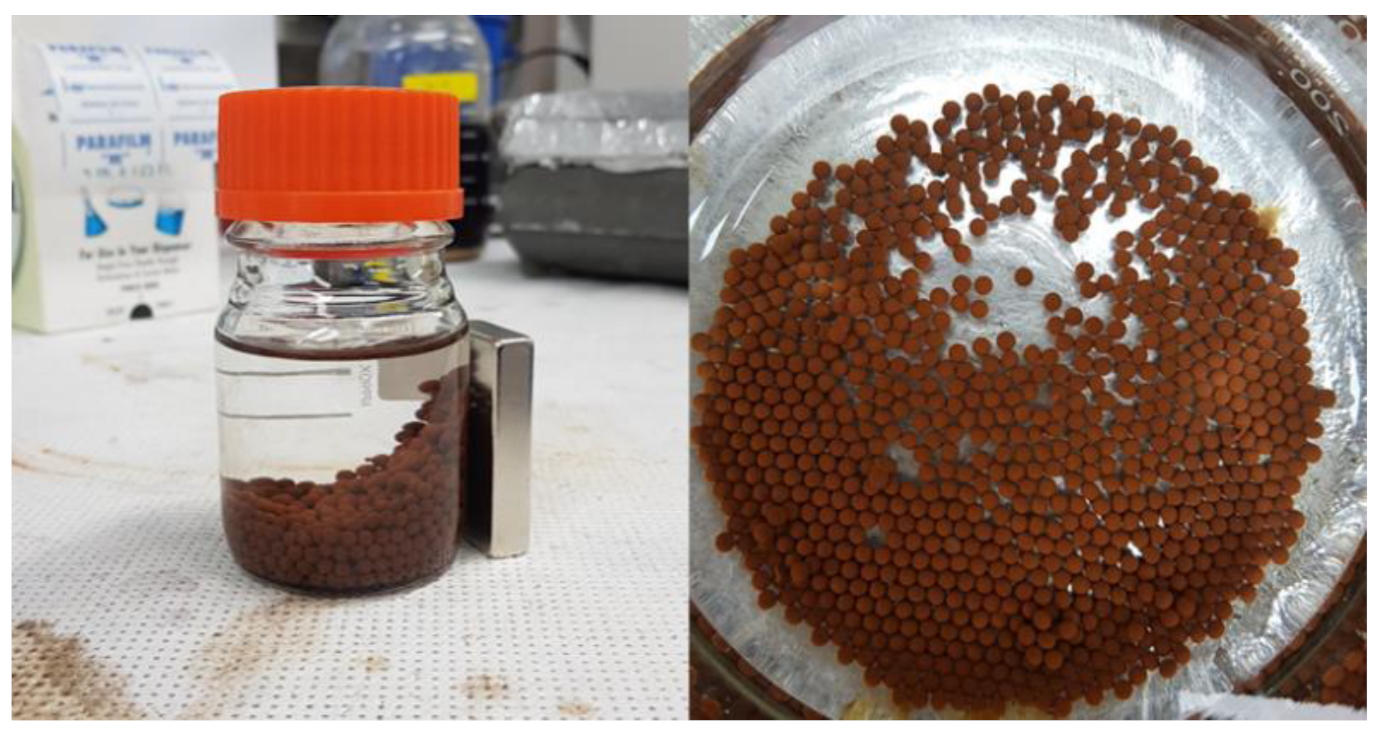
2.2. Preparation of SCM Beads

The ferrofluid solution was prepared by adding an aqueous mixture of ferric chloride and ferrous chloride based on the protocol of modified Massart’s method [23]. The SCM beads were synthesized by mixing stone powder, chitosan, and the ferrofluid solution which was also described elsewhere [15,18,22,23,24]. In brief, chitosan solution with 2 g in 100 mL of 2% acetic acid, 2 g of stone powder and an appropriate amount of ferrofluid solution containing 0.67 g of maghemite (Fe3O4) were mixed together at about 50°C until the viscosity of the mixed solution reached about 25~28 mPa·s. The SCM mixture was added dropwise into 500 mL of 0.5 M sodium triphosphate (STPP) solution using syringe pump. The synthesized beads were cured for about 24 h, washed twice with ultrapure water, and then dried at 50°C in an oven for 24 h before use. The beads under wet condition had a spherical shape with diameters of about 3.0 mm as shown in Figure 1, but after drying they were contracted and wrinkled to 2.0 mm in diameter (Figure 1a). For the beads used in this study, the ratio of stone powder/chitosan/maghemite was 1/1/0.5 (weight ratio) which was the optimum ratio for As and Pb removal in the previous study [15,18].

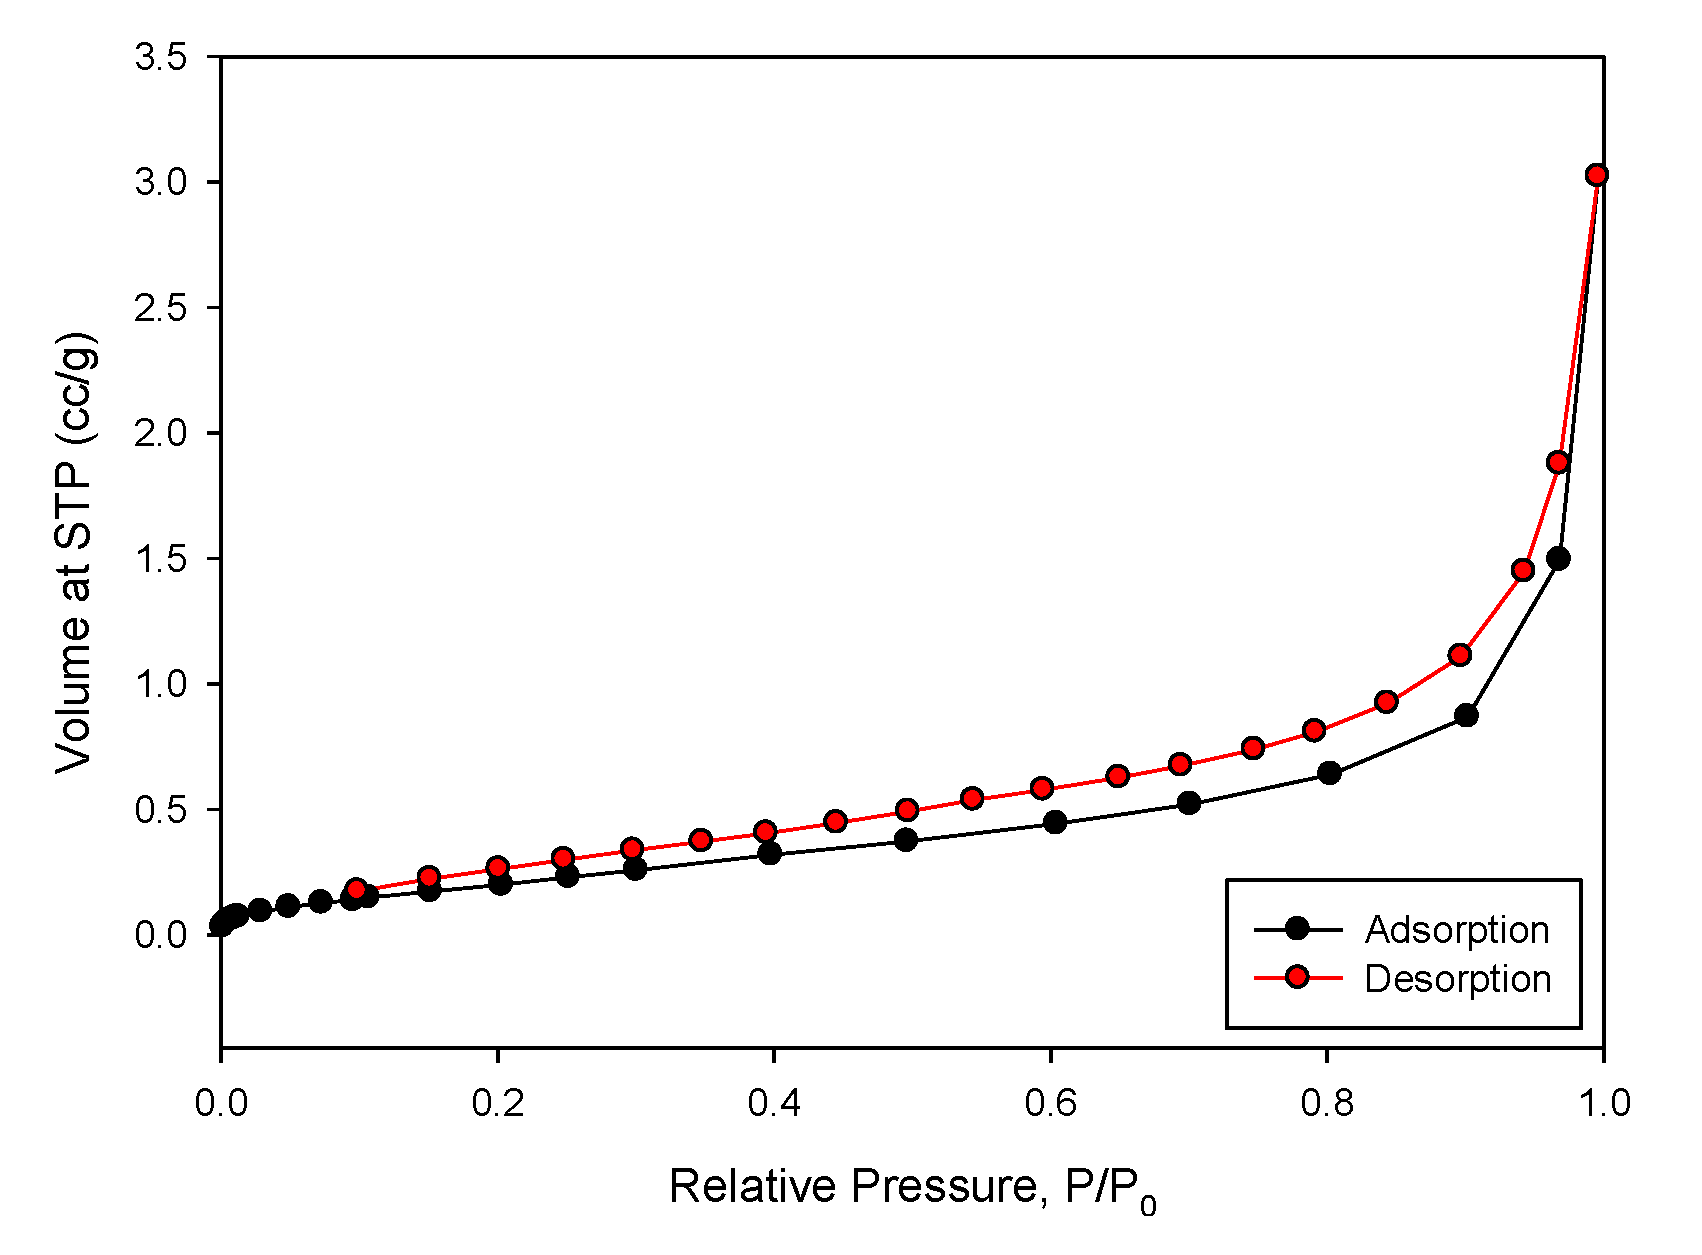
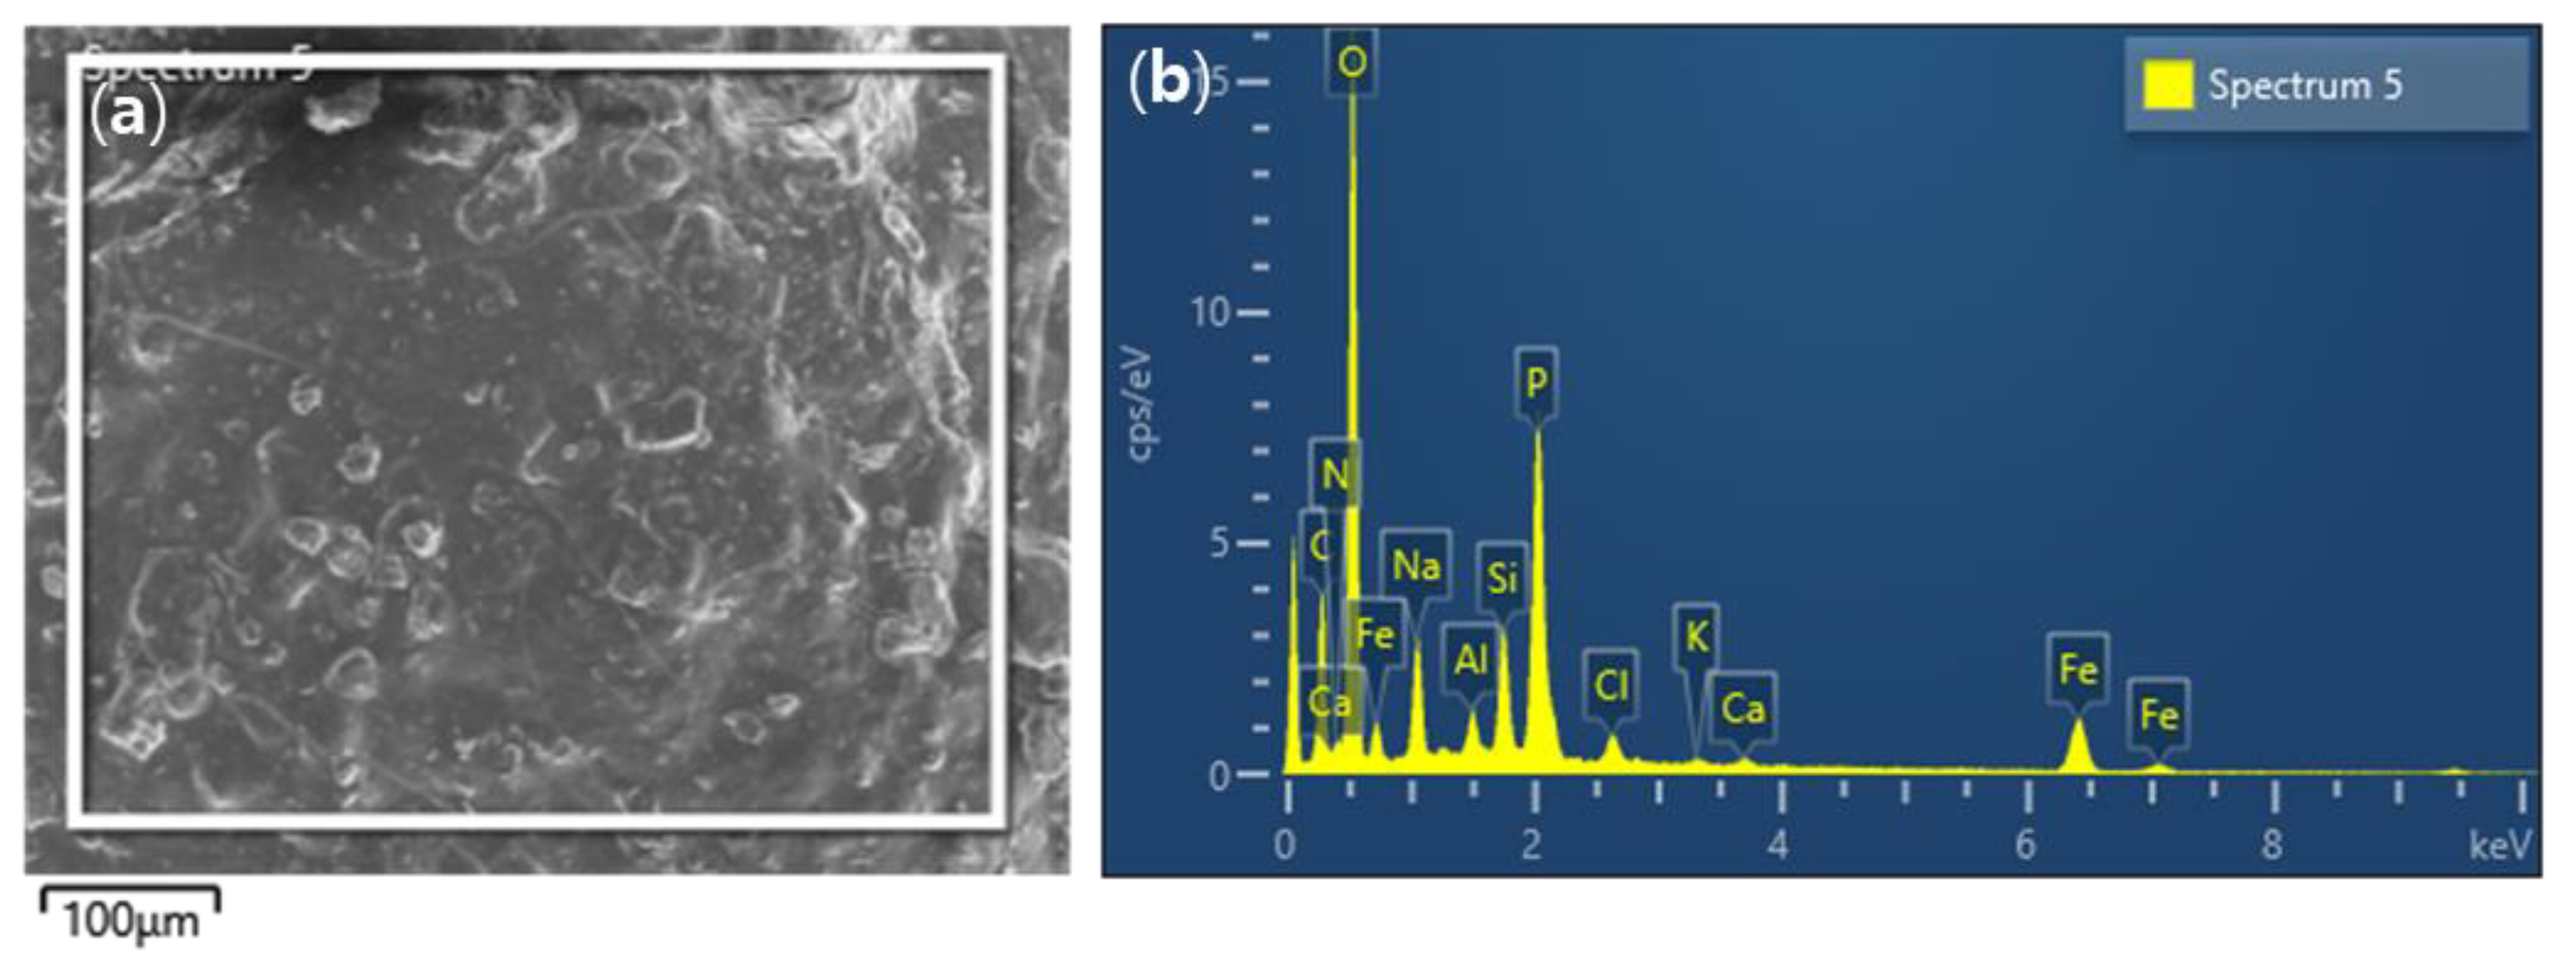
2.3. Characterization of SCM Beads

The shape, the morphology, the surface area, and pore size of the beads were employed to investigate the characteristics by using a microscope (Zeiss, Axioplan 2 Imaging, Axiovert 200, Jena, Germany) and the Brunauer-Emmett-Teller (BET) method (BET Quantachrome, Autosorb-iQ, Boynton Beach, FL, USA), respectively, at the Instrumental Analysis Center of Kyungpook National University, South Korea. The BET adsorption isotherm result is presented in Figure 2.
Figure 3 shows the photo (Figure 3a) and micrograph (Figure 3b) for the dried SCM beads. As shown in Figure 3b, the dried SCM beads were a hollow hemispherical shape, and compared to spheres, the surface area is almost the same, but the volume is relatively small, which is advantageous for adsorption. The BET surface area and the pore volume of the beads were 0.834 m2/g and 0.00467 cm3/g, respectively, which were already described elsewhere [15,18]. As compared to other adsorbents such as activated carbon, SCM beads have very low surface area and pore volume. This indicates that most of As and Pb adsorption is meant to occur at the SCM surface. Therefore, the adsorption rate would be depended on the adsorption affinity between adsorbates (e.g., As and Pb) and adsorption sites of the SCM surface consisting of the multiple components. The Fe content in SCM beads 1/1/0.5 was 2.89%, indicating sufficient adsorption sites as reported in the previous study [15].
A field emission scanning electron microscope (FE-SEM, SU8220, Hitachi, Tokyo, Japan) and an energy dispersive X-ray spectroscope (EDS, Horiba E-MAX EDS detector, Kyoto, Japan) was used to observe the morphology and chemical compositions of the SCM beads. Figure 4 shows the SEM and EDS graphs for the SCM beads used in this study. From the EDS analytic results, C, O, Fe, and P are prominent elements for the SCM beads. Particularly, Fe content is 10.03% (wt%). Fe presenting in maghemite are considered to be the main adsorption site for As and Pb [25].

2.4. Adsorption Kinetic Experiments

To investigate the adsorption velocity and equilibrium time, kinetic experiments for As and Pb adsorption onto the SCM beads were conducted in batch mode using 50 mL polyethylene centrifuge tubes (SPL Korea). Control vial without beads was also conducted to confirm no loss of As and Pb concentrations due to attachment of As and Pb onto the surface of the tube (data not shown).
The tubes containing 0.5 g of SCM beads was carefully filled with As or Pb stock solutions minimizing the head space. The 0.01 M NaNO3 solution was used as a background electrolyte. The pH of the electrolyte solution was in the range of 4 to 5 adjusted with 0.1 N HCl and 0.1 N NaOH. The initial concentrations of As and Pb were 10 mg/L (0.133 mmol/L) and 100 mg/L (0.483 mmol/L), respectively. The background electrolyte of 0.01 M NaNO3 was also adjusted. The tubes were capped tightly and placed on an orbital shaker and then shaken at 20 °C and 200 rpm.
After predetermined time intervals (0, 0.25, 0.5, 0.75, 1, 2, 4, 6, 8, 12, 16, 20, and 24 h), the tubes were collected and magnetic separation of the beads from the solution. The supernatant was taken and filtered through a 0.2 μm membrane filter (cellulose nitrate membrane filter, Whatman, Maidstone, UK). The 10 mL of filtrate was acidified with 1 N HNO3 to completely dissolve As and Pb in the filtrate. The As and Pb concentrations in the filtrate were analyzed using an inductively coupled plasma (ICP, Optima 2100 DV, PerkinElmer, Hägersten, Sweden). All experiments were conducted in duplicate.
The solid phase adsorbed amount, q (mmol/kg), was calculated using Equation (1):
q = ( C 0 C ) V W × 1000
where C0 is the initial solute concentration (mmol/L), C is the residual solute concentration (mmol/L), V is the sample volume (L), and W is the weight of the SCM beads (g).

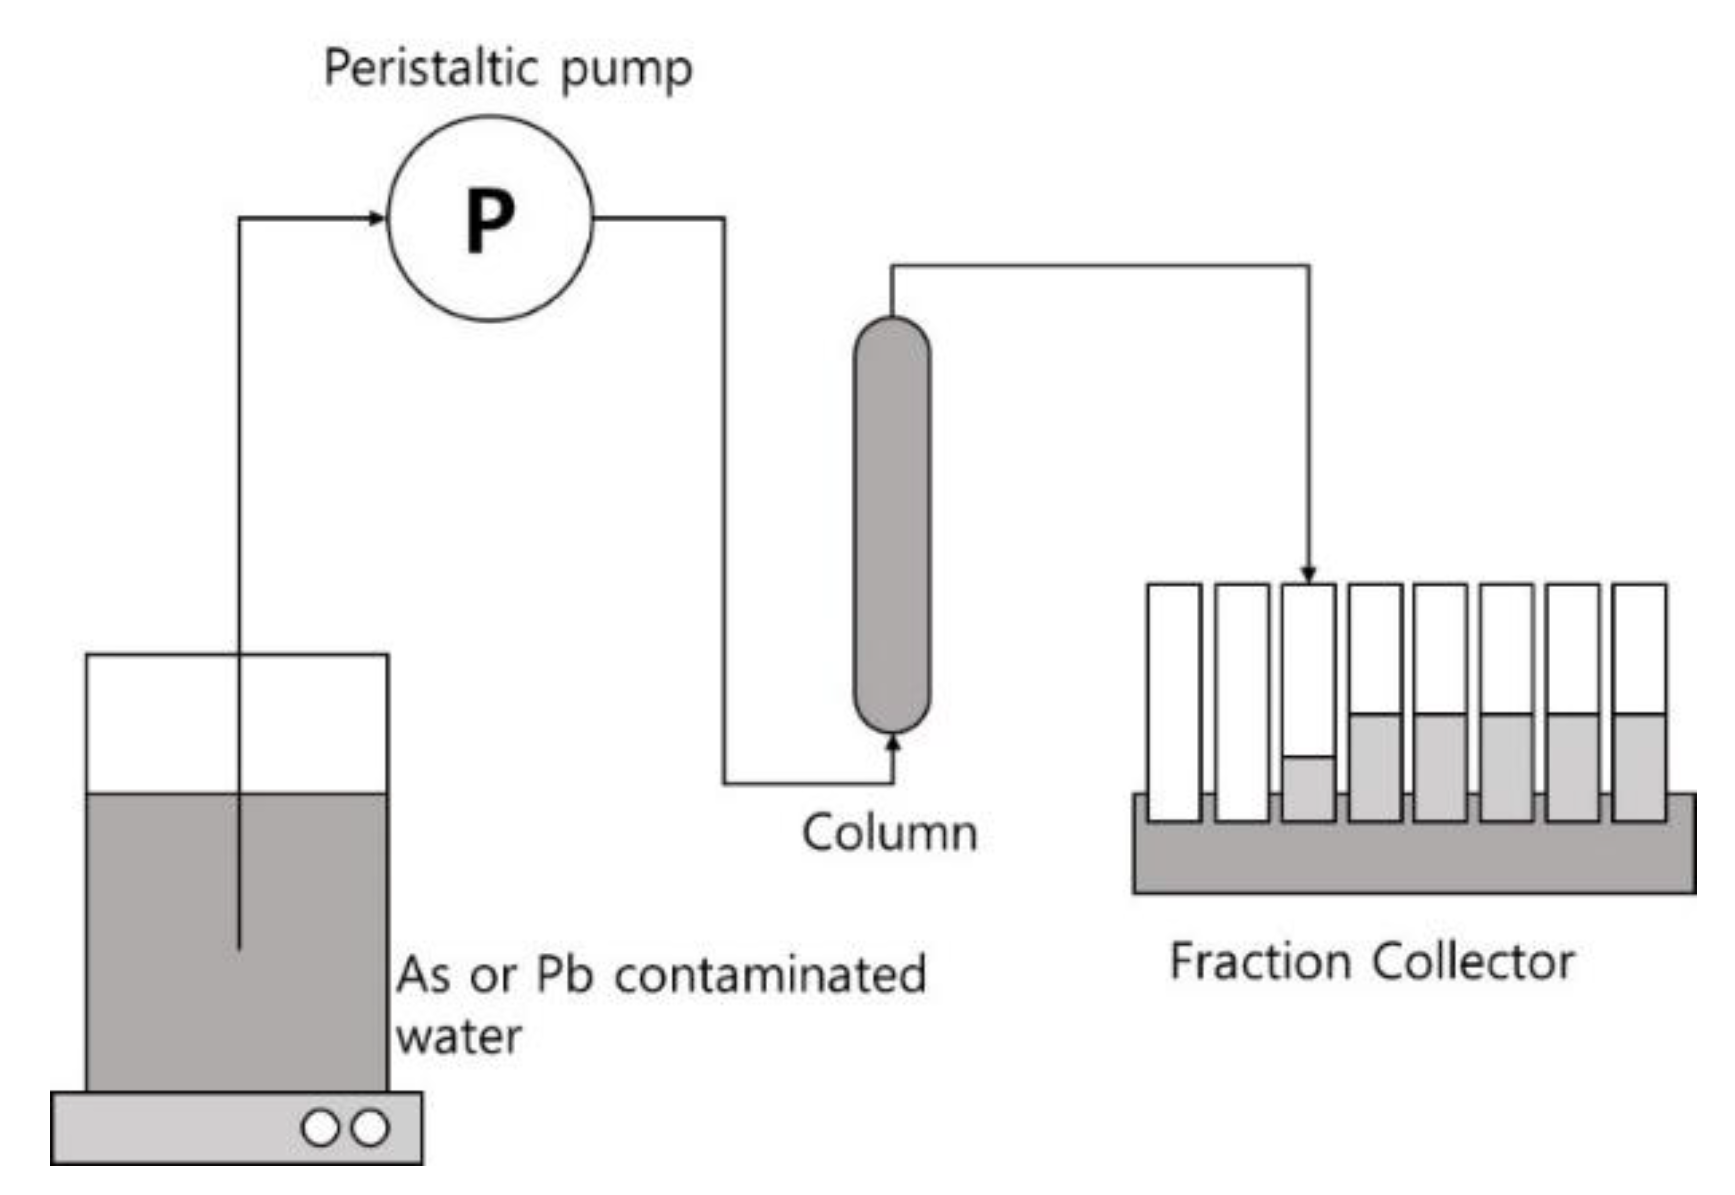
2.5. Continuous-Flow Column Experiments

Figure 5 describes a schematic diagram of a column reactor system consisting of an influent tank, a peristaltic pump, a glass column body, and a fraction collector. The glass column was designed with 25 mm outer diameter, 20 mm inner diameter, and 150 mm length. To induce dispersion of the wastewater, the upper and lower parts of 10 mm were filled with glass wool. The SCM beads with approximately 2 mm diameter were packed into the column. Contaminated solutions of 1 mg/L As or 1000 mg/L Pb were passed through the column at three rates: 0.15, 0.44 and 3.3 cm/min, corresponding to retention times of 100 min, 22.6 min and 4.52 min. Samples passing through the column were collected at regular time intervals using an automatic fraction collector (BS-100A, Qingpu-Huxi Ins., Shanghai, China). The collected samples were weighed to calculated the quantity of effluent, centrifuged for 10 min at 2500 rpm and filtered using a 0.2 μm membrane filter (cellulose nitrate membrane filter, Whatman). The As and Pb concentrations in the filtrate were analyzed by an ICP (Optima 2100 DV, PerkinElmer, Hägersten, Sweden). All experiments were also conducted in duplicate.
The maximum capacity can be calculated experimentally from the breakthrough curve results [21].
q = Q 1000 t = 0 t = t o t a l C 0 d t
q max = q m
where q is the maximum quantity of As and Pb adsorbed onto the fixed bed (mg), Q is the flow rate (mL/min), C0 is the influent concentration of As and Pb, qmax is the maximum capacity of the fixed bed (mg/kg), and m is the mass of the SCM beads (kg).
After analyzing the concentration of As or Pb for the raw water and the samples collected in the fraction collector, it was expressed as the sample concentration to the raw water concentration ratio (C/C0). The relationship between C/C0 and time or pore volume (PV) was plotted, and a breakthrough curve was determined from the results. The removal efficiency (R) up to the nth sample was calculated by Equation (4). [22].
R n = i = 1 n [ Q i × ( C 0 C i ) ] i = 1 n [ Q i × C 0 ]
where Qi is the sample volume in the i th collection tube the maximum quantity of As and Pb adsorbed onto the fixed bed (mg), Q is the flow rate (mL/min), C0 is the influent concentration of As and Pb, qmax is the maximum capacity of the fixed bed (mg/kg), and m is the mass of the SCM beads (kg), respectively.

2.6. Model Analysis

2.6.1. Kinetic Models

Several adsorption kinetic models were used to investigate the adsorption rate and equilibrium time. The kinetic models used in this study were pseudo-first-order kinetic model (PFOKM), pseudo-second-order kinetic model (PSOKM), two compartment first-order kinetic model (TCFOKM), and modified two compartment first-order kinetic model (MTCFOKM) [20].
The PFOKM has been widely used to predict adsorption kinetics. For adsorption Equation (5) was used [23].
q ( t ) = q e 1 e k 1 t
where k1 is the rate constant (d−1) and qe is the adsorption equilibrium concentration in the solid phase (mmol/kg).
The PSOKM based on adsorption equilibrium capacity is expressed as Equation (6) [20].
q ( t ) = t 1 / k 2 q e 2 + t / q e
where k2 is the rate constant (d−1) and qe is the adsorption equilibrium concentration in the solid phase (mmol/kg). From PSOKM, the initial adsorption velocity (v0) can be calculated as follows [26].
v 0 = k 2 q e 2
The TCFOKM was assumed to consist of the sum of the two first-order kinetic adsorption rates in the fast and slow fractions [20].
q ( t ) = q 0 f 1 1 e k 1 t + f 2 1 e k 2 t
where q0 is the expected saturation concentration of As and Pb in solid phase (mmol/kg), f1 and f2 are the fast and slow fractions (-), respectively, and k1 and k2 are the adsorption rate constants in the fast and slow fractions (d−1), respectively. However, the TCFOKM has a mathematical limitation because q(t) becomes q0, not equilibrium concentration, qe, as t = ∞. therefore, this model cannot determine the equilibrium concentration.
Therefore, The TCFOKM was modified to overcome the mathematical limitations. The equilibrium concentration (qe) was used instead of q0. The Modified TCFOKM (MTCFOKM) was a 4-parameter model [20].
q ( t ) = q e f 1 1 e k 1 t + f 2 1 e k 2 t
where qe is the expected equilibrium concentration of As and Pb in solid phase (mmol/kg), f1′ and f2′ are the fast and slow fractions, respectively, and k1′ and k2′ are the adsorption rate constants in the fast and slow fractions (1/d), respectively.
The original intraparticle diffusion model is described as the following form [27]:
q ( t ) = k t 0.5
where k is the intraparticle diffusion rate constant (mmol/g/h).
All model parameters were estimated by non-linear regression using a commercial software TableCurve 2D v5.01.02 (Inpixon Co., Palo Alto, CA, USA).

2.6.2. Column Models

The experimental data were curve-fitted with Thomas model, Yoon-Nelson model (Y-N model) and Adam and Bohart model (A-B model) [21,28,29].
The Thomas adsorption model can present the maximum adsorbed solid phase concentration and adsorption ratio from continuous flow column experimental data [29J. The Thomas model was presented as an assumption of the Langmuir kinetics of adsorption-desorption [28,29]. The rate driving force for the adsorption-desorption depends on the second-order reverse kinetics without considering axial dispersion. The Thomas model can be expressed as follows:
ln C 0 C t 1 = k T H q 0 m Q k T H C 0 V e f f Q
where kTH is the Thomas rate constant (L/mg/min), q0 is the maximum adsorption capacity (mg/kg), Q is the mean flow rate (L/min), m is the weight of adsorbent (kg), C0 is the initial concentration of adsorbate (mg/L), and Veff is the effluent (L).
The Yoon-Nelson model (Y-N model) is an extremely compressed model based on the decrease in the adsorption probability of each adsorbate is proportional to the breakthrough point of the adsorbate [25,26]. The Y-N equation is expressed as Equation (12).
ln C t C 0 C t = k Y N t τ k Y N
where kYN is the Yoon-Nelson model constant (L/mg/min) and τ is the time required for 50% adsorbate breakthrough (min).
The Adams-Bohart model suggests that the adsorption rate depends on the concentration of the adsorbate and the residual capacity of adsorption [28,29].
ln C t C 0 = K A B C 0 t K A B N 0 z u
where KAB is the Adam-Bohart kinetic constant (L/mg/min), N0 is the saturation concentration in liquid phase (mg/L), z is the column bed depth (cm), and u is the flow velocity through the bed section area (cm/min).

3. Results and Discussion

3.1. Adsorption Batch Studies

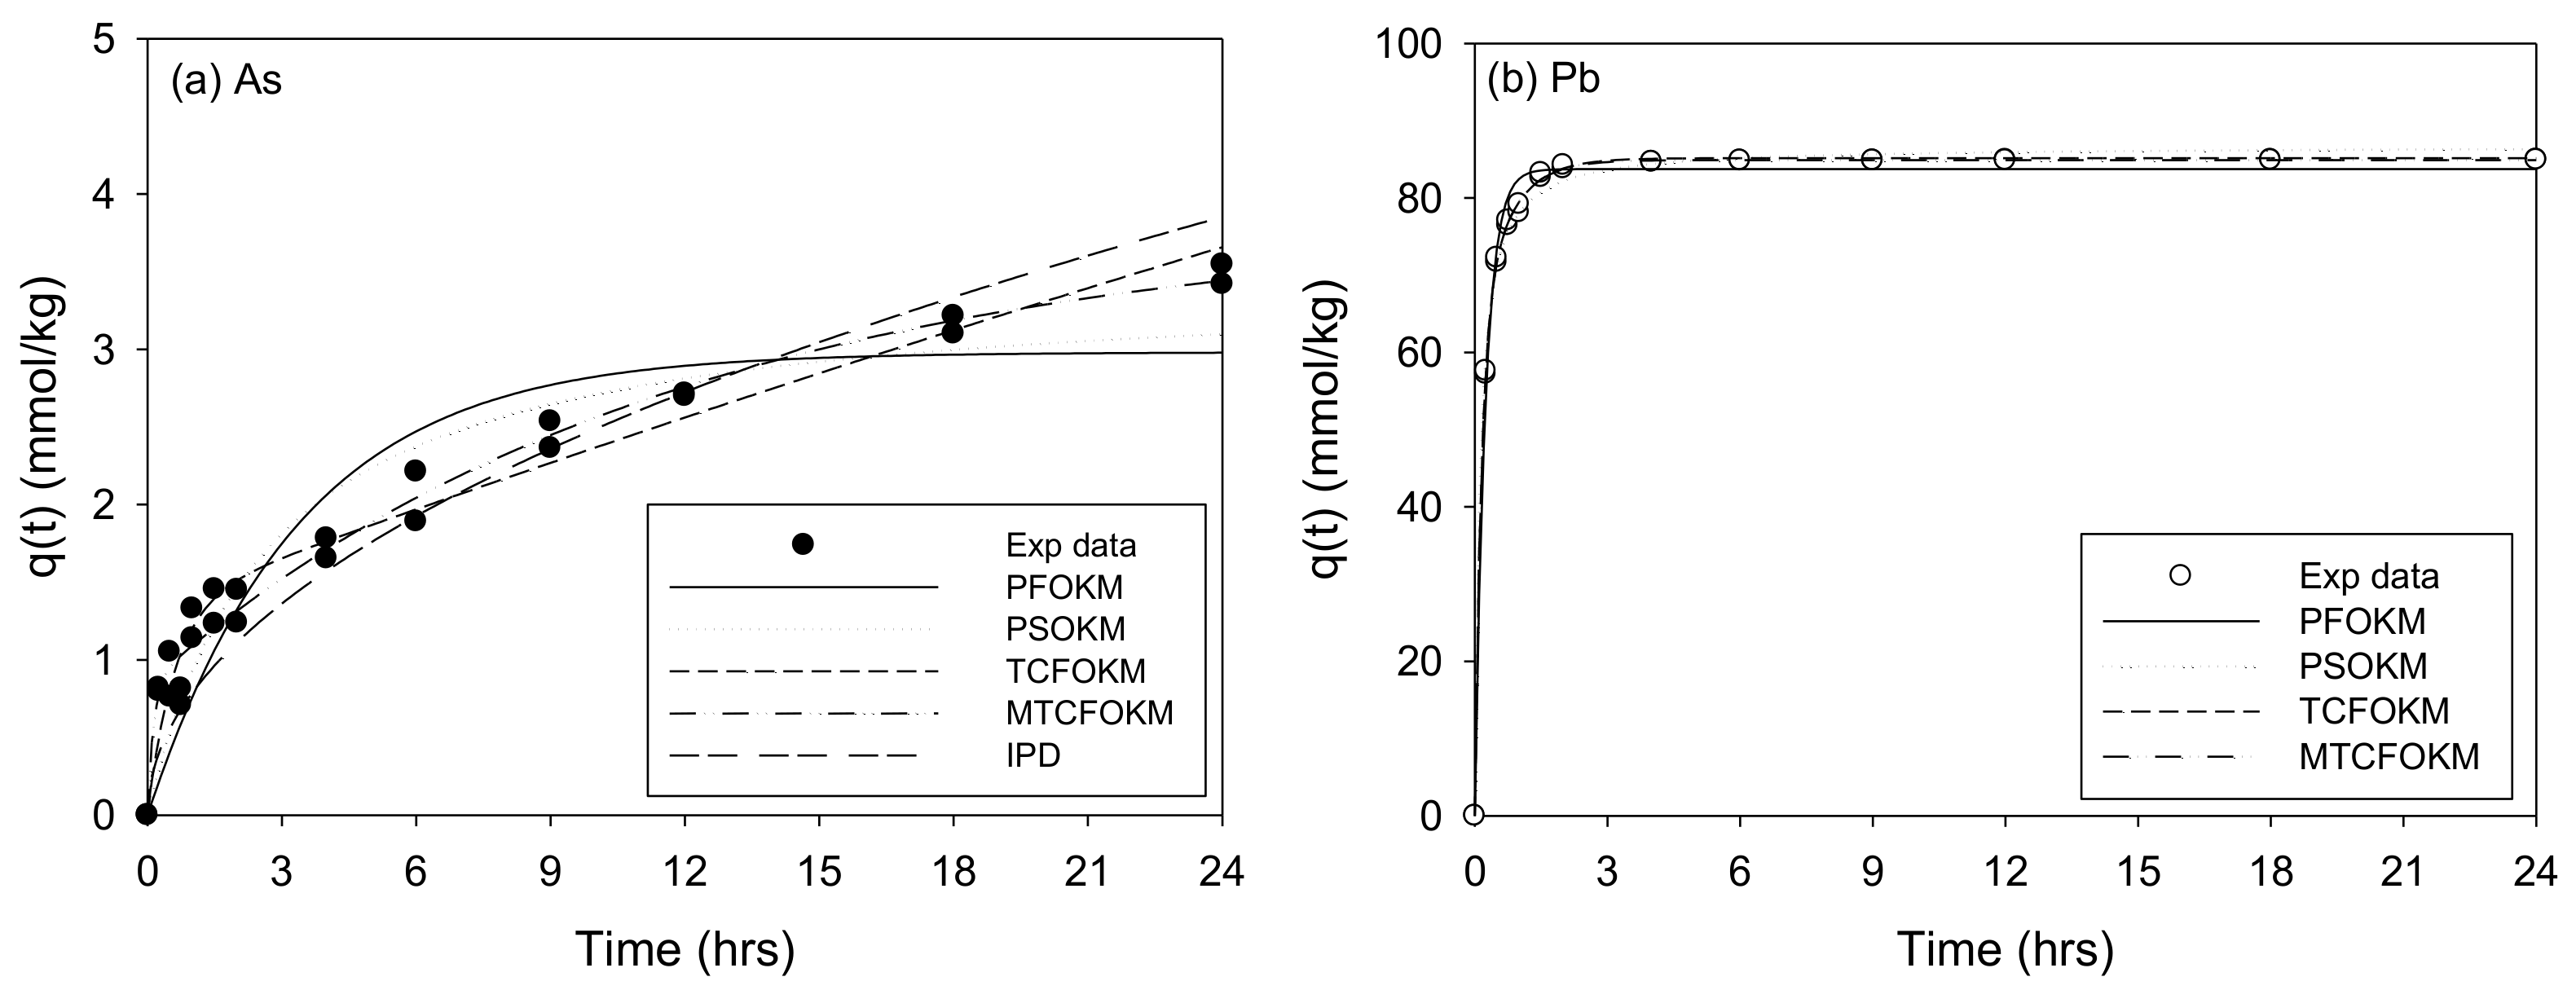
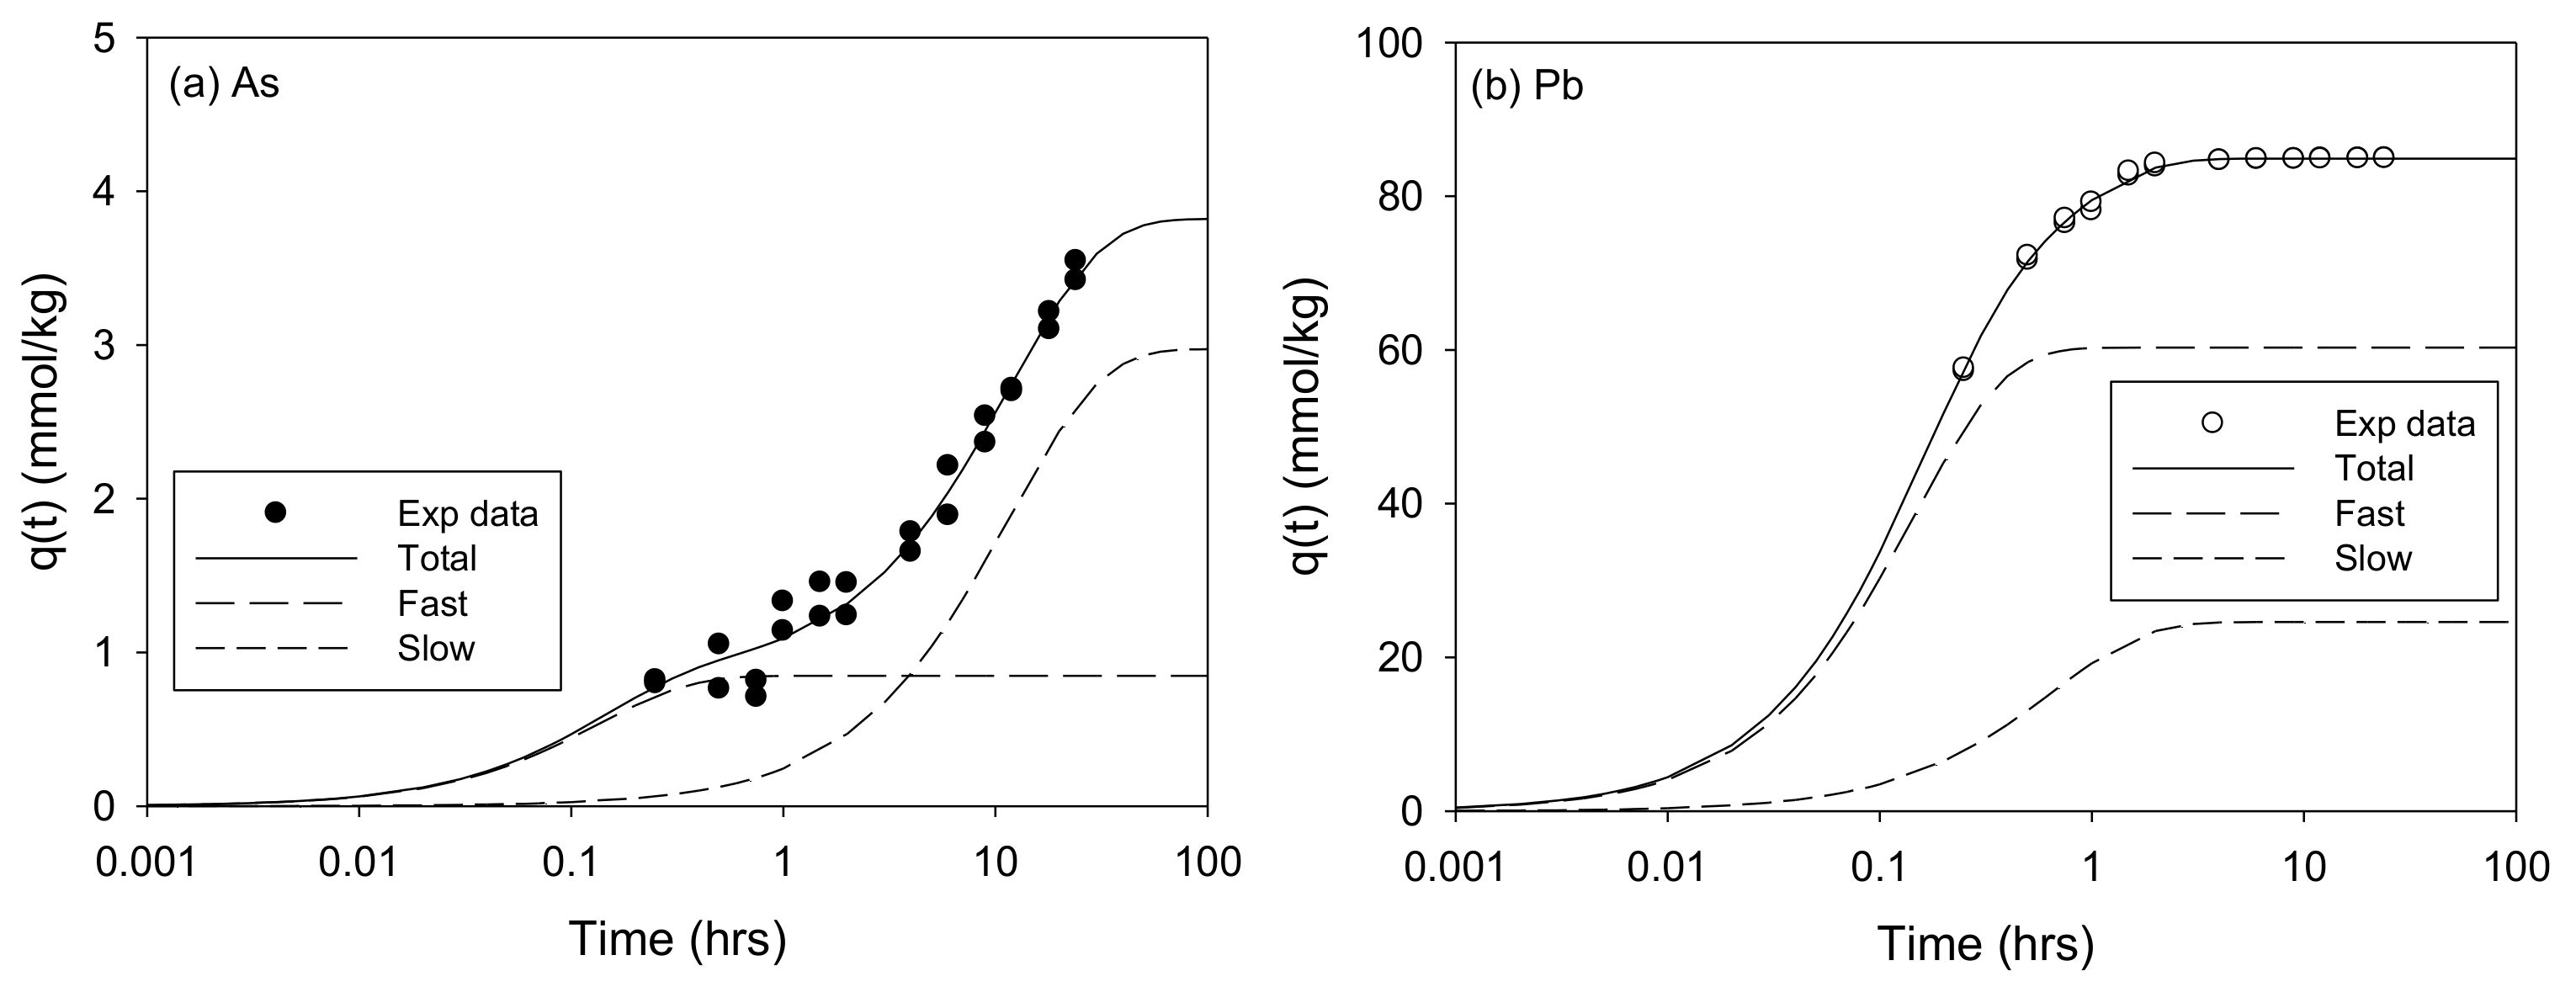
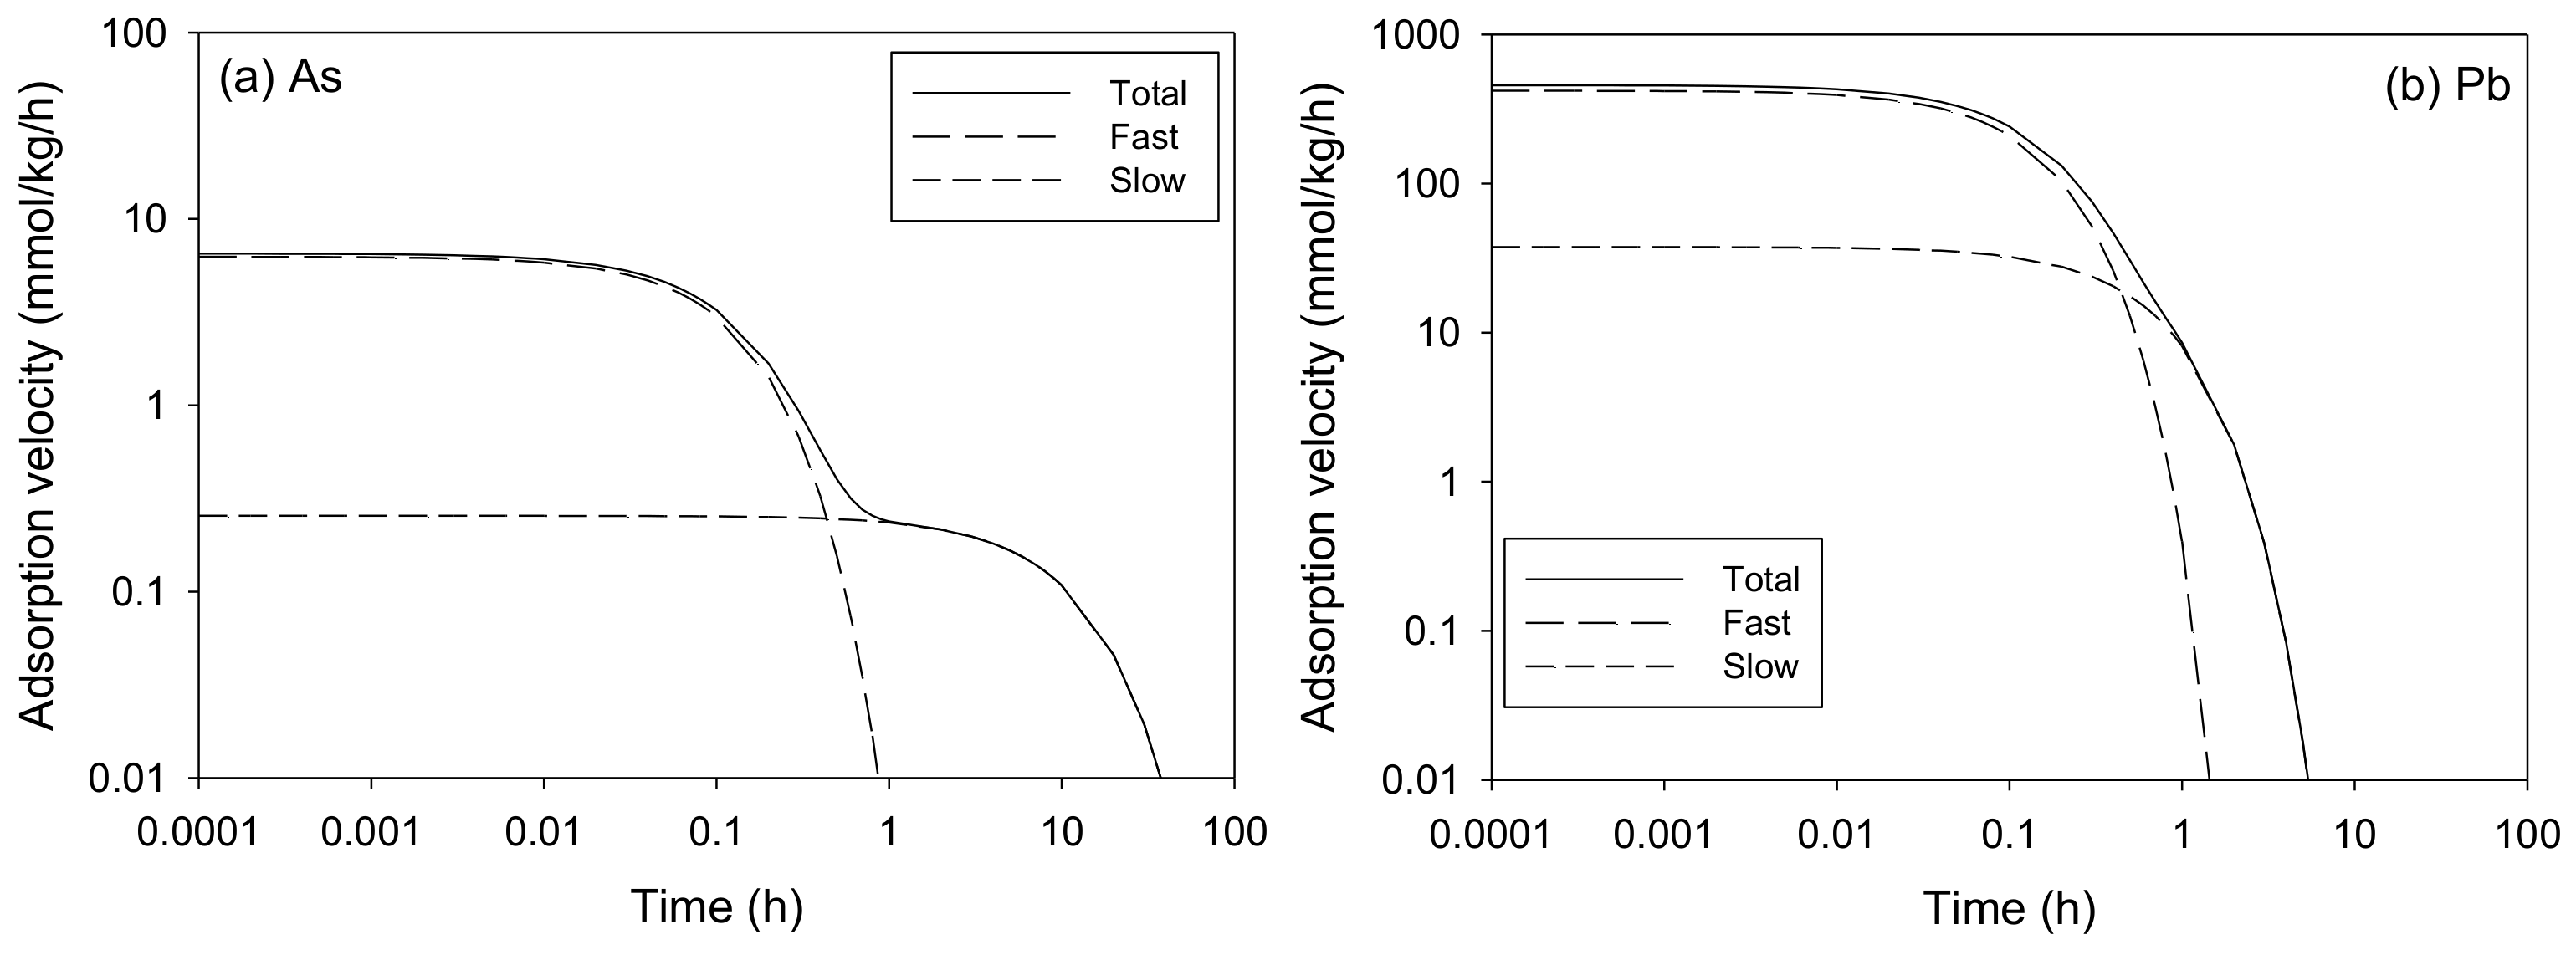
The Adsorption Kinetics of As and Pb onto the SCM Beads

The adsorption kinetics experiments of As onto the SCM beads were conducted to investigate the adsorption rate and several adsorption kinetic models were fitted to the adsorption kinetic data. The experiments were conducted at about pH 4 adjusted with 0.1 N HCl and 0.1 N NaOH. With Minteq 3.1 analysis in previous study [15,22], in the range of pH 4–5, As and Pb species are presented as H2AsO4 ion and Pb2+ ion. The different features between As and Pb at that pH might affect the adsorption affinity of them onto the SCM beads.
Figure 6 shows the adsorption rates of As and Pb onto the SCM beads over time and the experimental data was analyzed with adsorption kinetic models (PFOKM, PSOKM, TCFOKM, and MTCFOKM). Table 1 summarizes the parameters of the kinetic models, and the R2 value of all kinetic models was more than 0.86 and 0.99 for As and Pb, respectively. In As adsorption, there was a slight difference in the R2 value of each model, but in Pb adsorption there was almost no difference, making it difficult to determine the most suitable model. On the other hand, the sum of square error (SSE) value showed a large difference (Table 1).
S S E = q exp q c a l 2 N
The SSE values calculated from PFOKM, PSOKM, TCFOKM, and MTCFOKM were 3.523, 2.138, 0.836, and 0.443 for As adsorption, and 91.38, 48.72, 4.572, and 3.821 for Pb adsorption, respectively as shown in Table 1. Therefore, MTCFOKM with the lowest SSE value was found to be the most suitable for describing the adsorption behaviors of both As and Pb. Since the R2 and SSE values for PSOKM were also good, it is considered that chemisorption involving valence forces were also affecting the adsorption rate [30,31].
Adsorption generally occurs with 4 steps. Nadeem et al. [32] reported that Ni(II) and Co(II) sorption followed a two-step mechanism where a passive surface transport (very rapid) and the second passive diffusion step (longer). In this study, since the BET surface area and pore volume of the SCM beads were very low (less than 0.834 m2/g and 0.00467 cm3/g, respectively), it was expected that the external diffusion (film diffusion) and adsorption onto active sites were probably the main adsorption rate limiting mechanisms. However, the experimental data on As adsorption kinetics fitted well to the intraparticle diffusion (IPD) model. The intraparticle model was also applied in order to evaluate the diffusion effect in pores on adsorption rate.
The As concentration in solid phase of the SCM beads at equilibrium was 2.980, 3.447, and 3.820 mmol/kg for PFOKM, PSOKM, and MTCFOKM, respectively, and the Pb concentration was 83.72, 86.72, and 84.89 mmol/kg for PFOKM, PSOKM, and MTCFOKM, respectively, which showed that the amount of Pb adsorption was over 20 times higher than that of As adsorption. Pak et al. [15] conducted the As and Pb adsorption isotherm experiments and fitted the data with Langmuir, Freundlich, and Dubinin-Radushkevich isotherm model. It was found that the adsorption amount of Pb was much higher than that of As, consistent with the adsorption amount at equilibrium condition in this study. Banerjee et al. [33] reported that Fe-OH surface of the adsorbent is available for H2AsO4 adsorption. Jung et al. [18] also studied that the stone powder and chitosan also have capacities for As and Pb adsorption. Therefore, the beads synthesized from the three components such as stone powder, chitosan, and Fe-oxide are expected to have multi-adsorption sites. In this study, it was not clear what caused the higher adsorption amount and rate of Pb compared to As. However, since the surface charge of the beads is negative at pH 4, it is considered reasonable to conclude that Pb has a more favorable adsorption rate than As due to the electrostatic state. Idris et al. [34] also reported that beads based maghemite nanoparticles has the selectivity of Pb2+ ions compared to the other ions. Zhao et al. [7] also reported the highly efficient removal of bivalent heavy metals by magnetic composite including Fe3O4. These may also be one reason.
Meanwhile, among the kinetic models, MTCFOKM was found to be the most reliable model for both As and Pb adsorption due to the highest R2 values (0.983 and 1.000, respectively). Since beads do not have uniform adsorption sites, multi-compartment adsorption models such as a two-compartment model are considered as appropriate model [20]. TCFOKM and MTCFOKM can be applied more appropriately to beads analyze the difference in adsorption rates by dividing them into fast and slow adsorption parts. Overall, the MTCFOKM model showed the most accurate results, so only this model was used for analysis of adsorption characteristics for As and Pb.
On the other hand, intraparticle model(IPD) was also applied to fit As and Pb adsorption data. For As adsorption kinetics, k value was 0.786 mmol/kg/h0.5. with R2 = 0.9204 whereas IPD model could not fit the Pb adsorption kinetics data because the Pb adsorption curve initially rises too steeply which could not be explained with the model. Therefore, Pb adsorption onto the SCM beads was depended on film diffusion and adsorption onto active sites instead of internal diffusion.
As can be seen from Table 1, the adsorption rate of Pb onto the SCM beads was faster than that of As according to the first order adsorption rate constant (k1) in PFOKM for Pb (4.199/h) higher than k1 for As (0.295/h) as well as the initial adsorption velocity (v0) for Pb (351.6 mmol/kg/h) was also much faster than that for As (0.878 mmol/kg/h). However, the second order rate constant (k2) in PSOKM model for Pb adsorption (0.104/h) was almost similar to that for As adsorption (0.107/h), whereas v0 for Pb adsorption (778.8 mmol/kg/h) was higher than that for As adsorption (1.272 mmol/kg/h) because of higher Pb concentration.
Two-compartment first order model (TCFOKM) shows the fast and the slow adsorption fractions (f1 and f2) and rates (k1 and k2), respectively [35,36]. Kim et al. [35] reported that the TCFOKM could successively analyze the sorption kinetics of 2-chlorophenol on hexadecyltrimethyl ammonium montmorillonites. Kwak et al. [36] also reported the better expectation of TCFOKM than other models such as PFOKM and PSOKM for kinetics analysis of Cd and Pb sorption onto three natural sediments. In this study, according to the TCFOKM analysis, fast adsorption and slow adsorption of As and Pb showed completely different results. In the case of As adsorption, the fast adsorption fraction was only less than 10%, but the slow adsorption fraction counted for more than 90% which dominated the As adsorption rate. The fast and slow adsorption rate constants (k1 and k2) showed that k1 were significantly higher than k2. Unlike As adsorption characteristics, Pb adsorption showed that the fraction of fast adsorption rate was 0.72, and the adsorption rate (k1 = 6.84/h and k2 = 1.44/h for fast and slow adsorption) was also very fast compared to the As adsorption (k1 = 1.67/h and k2 = 0.008/h, respectively).
Except for the equilibrium time, MTCFOKM also showed a pattern similar to that of TCFOKM [37]. As shown in Table 1, the fast adsorption fraction (f1′) and the slow adsorption part (f2′) were 22.2% and 77.8% for As and 71.0% and 29.0% for Pb, respectively. It means that the fast adsorption of Pb was dominant whereas slow adsorption was dominant for As. The adsorption equilibrium time (teq) for MTCFOKM was determined by calculating the time for q(t) to reach 99% of qe, showing 42.6 h and 1.75 h of the equilibrium time for As and Pb, respectively. From the modeling results, it was found that Pb adsorption was faster than that of As, so that the adsorption equilibrium of Pb was achieved faster.
Like TCFOKM, MTCFOKM can also be analyzed by dividing the adsorption rate into fast and slow portions. The amounts of As and Pb related to fast adsorption and slow adsorption are expressed in Equations (15) and (17), respectively. The adsorption velocity was calculated by differentiating the adsorption amount with time (Equation (16) for fast adsorption and Equation (18) for slow adsorption).
q ( t ) f a s t = q e f 1 ( 1 e k 1 t )
q ( t ) f a s t d t = q e f 1 k 1 e k 1 t
Also, the slow adsorption amount and rate can be expressed by Equations (17) and (18), respectively.
q ( t ) s l o w = q e ( 1 f 1 ) ( 1 e k 2 t )
q ( t ) s l o w d t = q e ( 1 f 1 ) k 2 e k 2 t
Figure 7 and Figure 8 show that the amount and the velocity of the fast adsorption and the slow adsorption analyzed by MTCFOKM, respectively. The adsorption rate coefficient (k1′ for fast adsorption and k2′ for slow adsorption) was 7.398/h and 0.086/h for As adsorption and 6.958/h and 1.526/h for Pb adsorption, respectively. In the case of the fast adsorption rate, As and Pb were similar, but the slow adsorption rate of Pb 1.53/h was much higher than that of As (0.086/h). Conclusively, for As adsorption, the high k1′ with very low fraction (f1′) and very low k2′ with high f2′ simultaneously occurred so that overall As adsorption rate was relatively low. But for Pb adsorption, the high k1′ with high f1′ and relatively high k2′ with low f2′ simultaneously occurred so that overall Pb adsorption rate was fast.
As shown in Figure 7a, the amount of As with the fast adsorption increased and finished at 1 mmol/kg within 1 h whereas the slow adsorption got dominated after about 4 h. In case of Pb adsorption (Figure 7b), fast adsorption compared to slow adsorption dominated the adsorption rate over the entire operating time. The point at which the adsorption rate fell to 0.01 mmol/kg/h or less was set as the reaction end point.
The fast and slow adsorption velocity for As and Pb is shown in Figure 8. As shown in Figure 8a (in the case of As), at the beginning within 0.1 h, the fast adsorption rate appeared about 10 times faster than the slow adsorption rate, but the adsorption rate rapidly dropped at about 0.1 h and ended at about 1 h. In the case of the slow adsorption rate, it was maintained constant until about 5 h, then started to decrease from 10 h and ended at about 38 h. The reaction end point was considered as the time when the adsorption rate fell below 0.01 mmol/kg/h.
In the case of Pb adsorption (Figure 8b), it was found that the fast adsorption rate dominates. The fast adsorption started to decrease within 0.1 h and dropped below 0.01 mmol/kg/h at 1.5 h and the slow adsorption also started to decrease from 0.1 h and ended at about 6 h. When the reaction end time calculated in the model, fast adsorption was 1.53 h and slow adsorption was 5.4 h, respectively which was faster than that of As adsorption. The high initial concentration of Pb supplied might also cause the driving force to overcome the existing mass transfer resistance between the aqueous and solid phase [38].

3.2. The Column Studies

3.2.1. CXTFIT Analysis

CXTFIT model have been used to predict the fate and transport of solutes such as metals in the subsurface using the convection-dispersion equation (CDE) to experimental results [39,40]. The movement of dissolved contaminants such as metal ion in soils and groundwater can be analyzed by theoretical models such as CTXFIT model. In this study, the CTXFIT model was applied to the SCM beads packed into the glass column. The variables used were the velocity (v), the dispersion coefficient (D), and the distribution coefficient (K) [34]. In this study, the behavior of pollutants was analyzed through the computer program of CXTFIT version 2.0. For the CXTFIT experiment, the velocity (v), diffusion this program, and Cl as a non-reactive material was used to obtain the velocity (v), diffusion coefficient (d), and retardation factor (R) [39]. In this study, the CXTFIT model was performed by setting the flow velocity to 0.39 (slow), and 10 cm/min (fast). As a result, v, d and R values estimated by CXTRIT model were 0.39 cm/min, 0.48 cm2/min and 1.0 for set v = 0.39 cm/min, and 12.8 cm/min, 23.9 cm2/min and 0.9995 for set v = 10 cm/min (data not shown). It is considered that the fate and transport of solute in the bead column is caused by both flow velocity and dispersion.

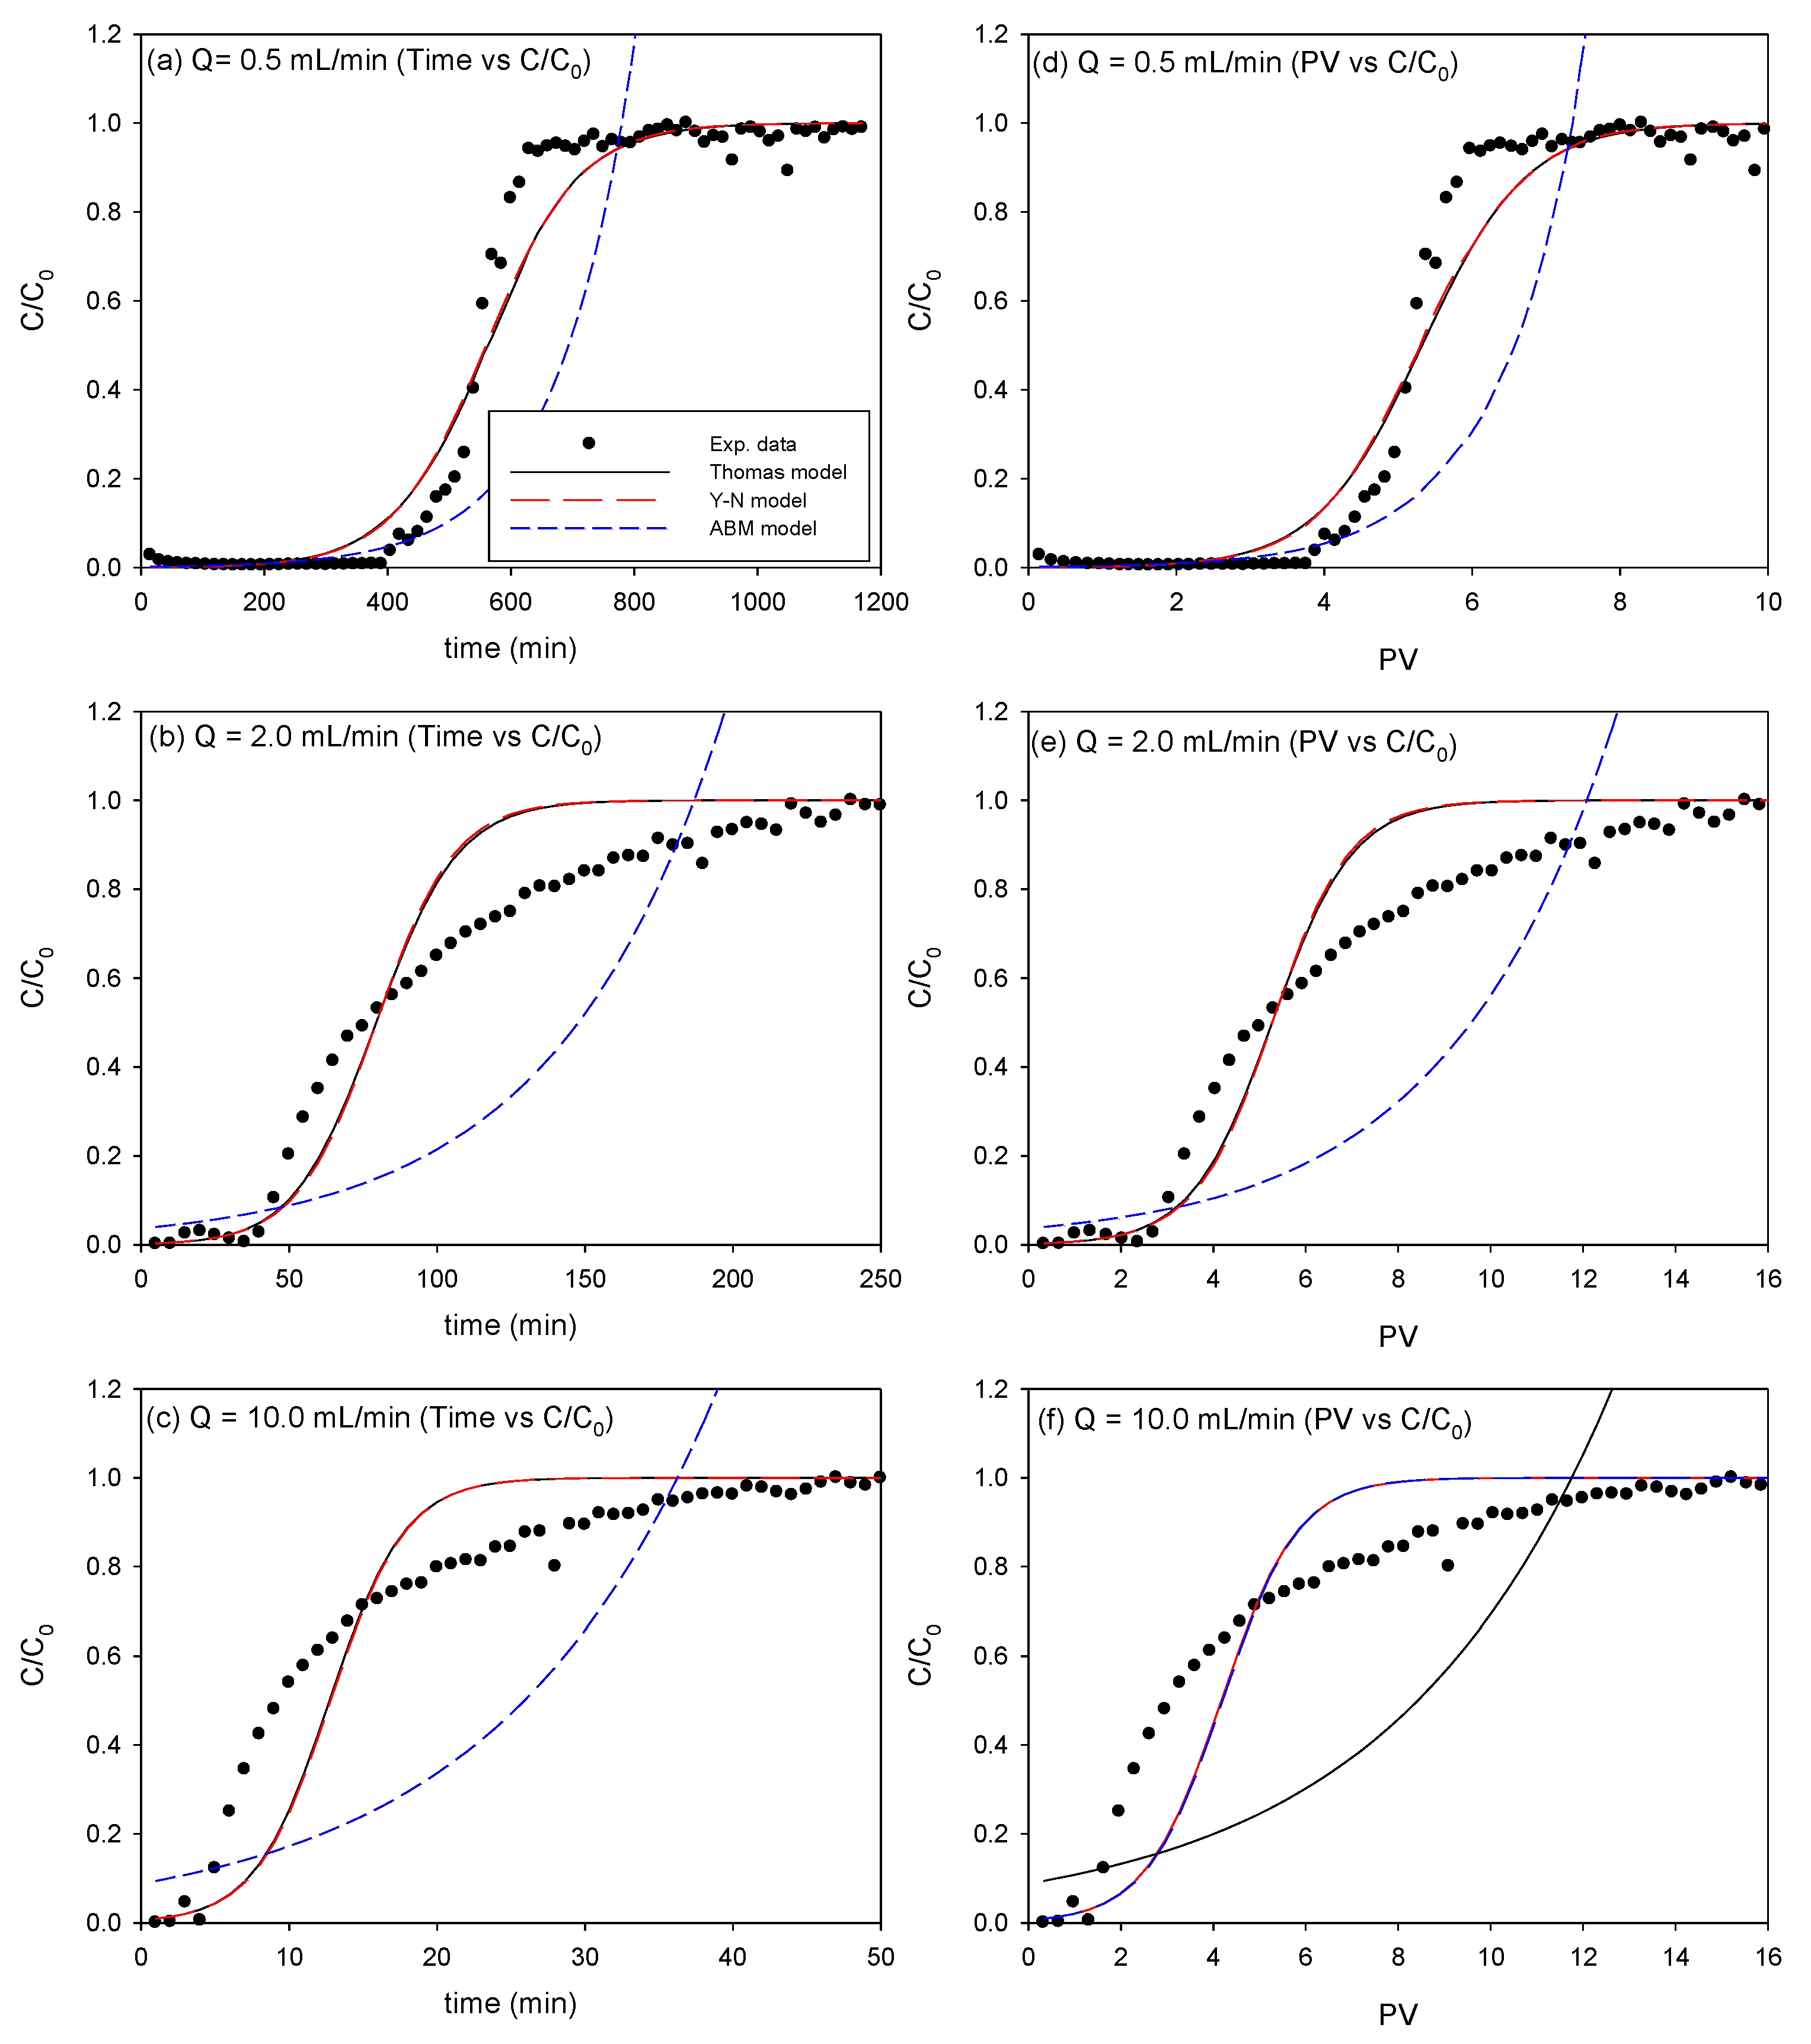
3.2.2. Effect of Flow Rate for As Removal via Model Analysis

For the column experiment, the As concentration in the column experiment was performed at 10 mg/L the same as in the adsorption kinetics experiment. Due to relatively short retention time, however, the amount of adsorbed As was relatively very small and the breakthrough appeared early, making column analysis difficult. Therefore, the As concentration was set to 1 mg/L, in the column experiment.
The As breakthrough adsorption curves for different flow rates (0.5, 2.0, and 10 mL/min) at 1 mg/L of As concentration are shown in Figure 9. The breakthrough curves via time and pore volume (PV) are presented in Figure 9a–f, respectively. For all the flow rate, the breakthrough curves have a large ‘S’ shape which is similar to other research results [29,41,42]. As the flow rate increased (Figure 9a–c), the breakthrough curve became steeper because the shorter retention time provides insufficient time for adsorption [29]. The breakthrough and saturation time also decreased as the flow rate increased.
The breakthrough times for flow rate of 0.5, 2.0, and 10 mL/min was about 160 min, 16 min, and 4 min, respectively, showing the decrease in the breakthrough time as the flow rate increased. The saturation time for flow rate of 0.5, 2.0, and 10 mL/min was also about 500 min, 50 min, and about 20 min, respectively. In Figure 9d–f, breakthrough time was approximately 2.5 PV, 1.0 PV, and 0.8 PV for the flow rate of 0.5, 2.0, and 10 mL/min, respectively, with saturation time of about 10 PV for all flow rates.
As a result of applying each model for As column study, the Thomas model and the Yoon-Nelson (Y-N) model showed very similar behavioral characteristics, making it difficult to distinguish them as shown in Figure 9. The results are presented in Table 2 that the determination coefficient (R2) of the Thomas and Y-N models are high with the range from 0.731 to 0.989. For flow rate of 10.0 mL/min, the two models did not effectively curve fit the experimental results because the breakpoint appeared too early while the two models are symmetrical. This indicates that, at low flow rates (0.5 and 2.0 mL/min), the Langmuir type adsorption of As occurred in the column [42]. The high R2 value of Thomas model means that the Langmuir type adsorption (i.e., monolayer adsorption) of As onto the surface of the SCM beads occurred, except for 10.0 mL/min of flow rate. Meanwhile, the Adams-Bohart model with R2 = 0.124 to 0.300 had less satisfaction than Thomas and Y-N models.
As the flow rate increased, the value of kTH increased significantly but q0 in Thomas model did not increase caused unavailability of the reaction sites. For Y-N model, an increase of the flow rate also led to an increase of kYN significantly and a remarkable decrease of τ0 as the column saturation reached more quickly. A-B analysis was meaningless because of very low R2 value.

3.2.3. Effect of Flow Rate for Pb Removal

At first, a column experiment was performed with the Pb concentration at 100 mg/L, the same as the concentration in the Pb kinetic experiment, but the experiment failed because Pb was not detected in the effluent during the experiment. Therefore, the modified column experiment was performed by raising the Pb concentration from 100 mg/L to 1000 mg/L.
The Pb breakthrough adsorption curves for different flow rates (0.5, 2.0, and 10 mL/min) at 1000 mg/L of Pb concentration for time and pore volume (PV) are shown in Figure 10a–f, respectively. The R2 values also the highest for Thomas and N-Y models, indicating that the Langmuir type adsorption of Pb may occur in the column, which is similar to As adsorption in this study. At the lowest flow rate (0.5 mL/min) in Figure 10a, the C/C0 curve became steeper at around 400 min and flattened at 600 min. But as the flow rate increased, the breakthrough curves became gentler and continuously increased. It is because the insufficient time was provided for adsorption [29] although the adsorption rate of Pb was faster than that of As.
The breakthrough times for flow rate of 0.5, 2.0, and 10 mL/min was about 400 min, 50 min, and 4 min, respectively, showing the decrease in the breakthrough time as the flow rate increased but much longer than those of As adsorption. The continuous increase in the breakthrough curve at high flow rate (e.g., 2 and 10 mL/min) caused to be difficult to determine the saturation time. This is considered to be due to the high Pb concentration in the influent and the insufficient adsorption of Pb at the short retention time of the column. Approximate saturation times estimated by Thomas and Y-N model for flow rates of 0.5, 2.0, and 10 mL/min were 800, 150 and 30 min, respectively. In Figure 10d–f, breakthrough pore volumes were approximately 2.5, 1.0, and 0.8 PV for flow rates of 0.5, 2.0, and 10 mL/min, respectively. The parameters of the three models (Thomas model, Y-N model, and A-B model) for Pb column study are summarized in Table 3. As a result of applying each model for Pb column study, Thomas model and Y-N model showed a good correlation, making it difficult to distinguish them.
With an increase in flow rate, the value of kTH increased but q0 in Thomas model decreased by causing unavailability of the reaction sites. For Y-N model, an increase of the flow rate also led to an increase of kYN and a decrease of τ0 as the column saturation reached more quickly. However, A-B analysis was meaningless because of very low R2 value. Although A-B model was not satisfactory for prediction, the adsorption capacity of the bed (N0) for Pb adsorption was much higher than that for As adsorption.

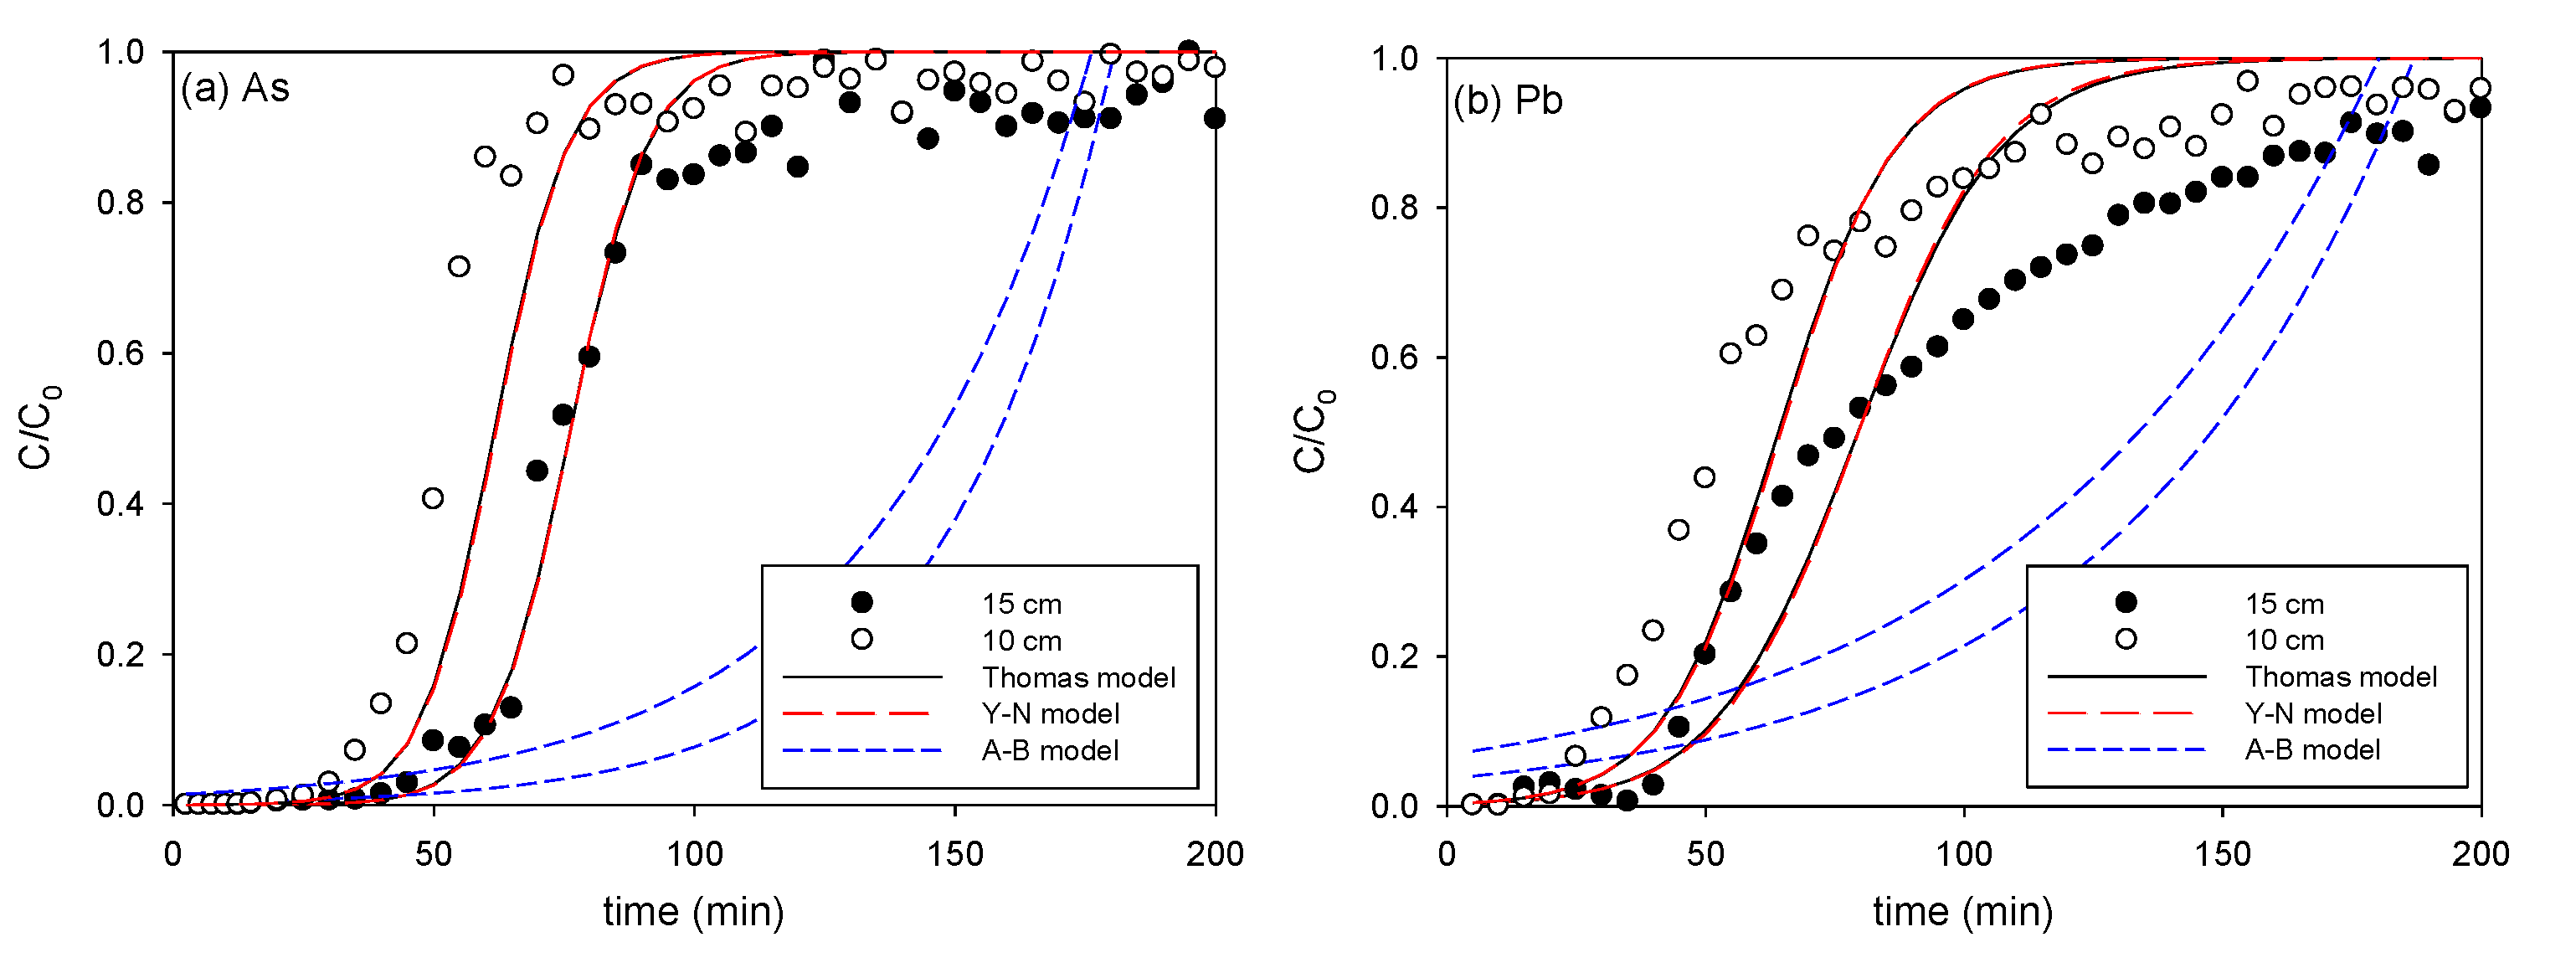
3.2.4. Effect of Bed Height

The effect of bed height (10 or 15 cm) on the breakthrough curve at a As (1 mg/L) and Pb (1000 mg/L) of initial concentrations and constant flow rate (2 mL/min) is shown in Figure 11. Table 4 presented the parameters of the three models for As and Pb adsorption at different bed height (10 and 15 cm). As bed length was relatively short, kTH and q0 in Thomas model increased but τ in Y-N model decrease. Thus, lower bed height would decrease the adsorption of As and Pb on the column. On the other hand, A-B model is less satisfactory than Thomas and Y-N model as well as is not close to breakthrough curves. This is also consistent with the results of other literatures [21,29].

4. Conclusions

The adsorption kinetics of As and Pb onto SCM beads synthesized with stone powder, chitosan, and maghemite were analyzed. The SCM beads adsorbed Pb faster than As, and the higher amount of Pb was adsorbed at the equilibrium state relatively As. Several adsorption kinetic models, 4-parameter MTCFOKM was the most appropriate model. According to analysis by MTCFOKM model, As adsorption was dominated by high fraction of slow adsorption with very slow fraction, whereas Pb adsorption was dominated by relatively high fraction of fast adsorption. In addition, column experiments were also conducted to remove As and Pb from the contaminated water with several flow rate using SCM beads for field application. Due to slow adsorption rate of As onto the SCM beads, the retention time of the influent in the column was not enough to remove As and Pb sufficiently. The Thomas, Y-N, and A-B models were used to apply to the experimental data. The Thomas and the Y-N models looked appropriate with high R2 value whereas A-B model is not applicable for the description of the breakthrough curves. The maximum concentration of the adsorbed Pb in the fixed bed in column was higher than that of As. It indicates that Pb adsorption is more favorable than As adsorption. The breakpoint for As and Pb adsorption got earlier as flow rate increased. Conclusively, the SCM beads have a strong potential for the remediation of the groundwater contaminated with Pb followed by As. But further researches such as studying stability of the beads’ capacity for metal adsorption for long time operation is still required to apply the field treatment.

Author Contributions

Conceptualization, G.S. and S.O.; methodology, S.O.; validation, S.O.; formal analysis, S.O.; data curation, S.O.; writing—original draft preparation, S.O.; writing—review and editing, G.S. and S.O.; supervision, S.O.; funding acquisition, G.S. and S.O. All authors have read and agreed to the published version of the manuscript.

Funding

This work was supported by the Daewoong Construction. Inc. This research was also funded by Korea Research Foundation (NRF-2018R1D1A1B07049783).

Institutional Review Board Statement

Not applicable.

Informed Consent Statement

Not applicable.

Data Availability Statement

Not applicable.

Acknowledgments

The author thanks We and Pak for supporting the experiments of this study.

Conflicts of Interest

The authors declare no conflict of interest.

References

  1. Zhang, W.; Singh, P.; Issa, T.B. The effect of Cl-, PO43−, and SiO32− on the adsorption of As(V) and As(III) on bauxite in water. Int. J. Eng. Sci. Technol. 2015, 7, 30–36. [Google Scholar] [CrossRef]
  2. Karrari, P.; Mehrpour, O.; Abdollahi, M. A systematic review on status of lead pollution and toxicity in Iran; Guidance for preventive measures. DARU J. Pharma. Sci. 2012, 20, 2–17. [Google Scholar] [CrossRef] [PubMed]
  3. Postma, D.; Mai, N.T.H.; Lan, V.M.; Trang, P.T.K.; So, H.U.; Nhan, P.Q.; Larsen, F.; Viet, P.H.; Jakobsen, R. Fate of arsenic during red river water infiltration into aquifers beneath Hanoi, Vietnam. Environ. Sci. Technol. 2017, 51, 838–845. [Google Scholar] [CrossRef] [PubMed]
  4. Clausen, J.L.; Bostick, B.; Korte, N. Migration of lead in surface water, pore water, and groundwater with a focus on firing ranges. Crit. Rev. Environ. Sci. Technol. 2011, 41, 1397–1448. [Google Scholar] [CrossRef]
  5. Komarek, M.; Vanek, A.; Ettler, V. Chemical stabilization of metals and arsenic in contaminate soils using oxides-a review. Environ. Pollut. 2013, 172, 9–22. [Google Scholar] [CrossRef]
  6. Trancoso, M.A.; Dos Santos, C.; Gonsalves, M.L.S. Lead sorption to selected Portuguese soils. Eur. J. Soil Sci. 2007, 58, 854–863. [Google Scholar] [CrossRef]
  7. Zhao, J.; Liu, J.; Li, N.; Wang, W.; Nan, J.; Zhao, Z.; Cui, F. Highly efficient removal of bivalent heavy metals from aqueous systems by magnetic porous Fe3O4-MnO2: Adsorption behavior and process. Chem. Eng. J. 2016, 304, 737–746. [Google Scholar] [CrossRef]
  8. Cantu, J.; Gonzalez, L.E.; Goodship, J.; Contreras, M.; Joseph, M.; Garza, C.; Eubanks, T.M.; Parsons, J.G. Removal of arsenic from water using synthetic Fe7S8 nanoparticles. Chem. Eng. J. 2016, 290, 428–437. [Google Scholar] [CrossRef]
  9. Siddiqui, S.I.; Chaudhry, S.A. Iron oxide and its modified forms as an adsorbent for arsenic removal: A comprehensive recent advancement. Proc. Safety Environ. Protect. 2017, 111, 592–626. [Google Scholar] [CrossRef]
  10. Adhikari, T.; Singh, M.V. Sorption characteristics of lead and cadmium in some soils of India. Geoderma 2003, 114, 81–92. [Google Scholar] [CrossRef]
  11. Manindy-Pajany, Y.; Hurel, C.; Marmier, N.; Romeo, M. Arsenic (V) adsorption from aqueous solution onto goethite, hematite, magnetite and zero-valent iron: Effects of pH, concentration and reversibility. Desalination 2011, 281, 93–99. [Google Scholar] [CrossRef]
  12. Cho, D.W.; Jeon, B.H.; Chon, C.M.; Schwartz, F.W.; Jeong, Y.; Song., H. Magnetic chitosan composite for adsorption of cationic and anionic dyes in aqueous solution. J. Ind. Eng. Chem. 2015, 28, 60–66. [Google Scholar] [CrossRef]
  13. Podder, M.S.; Majumder, C.B. Application of granular activated carbon/MnFe2O4 composite immobilized on C. glutamicum MTCC 2745 to remove As(III) and As(V): Kinetic, mechanistic and thermodynamic studies. Spectrochim. Acta A Mol. Biomol. Spectrosc. 2016, 153, 298–314. [Google Scholar] [CrossRef]
  14. Ngah, W.S.W.; Fatinathan, S. Adsorption characterization of Ph(II) and Cu(II) ions onto chitosan-tripolyphosphate beads: Kinetic, equilibrium and thermodynamic studies. J. Environ. Manag. 2010, 91, 958–969. [Google Scholar] [CrossRef]
  15. Pak, H.; Phiri, J.; We, J.H.; Jung, K.; Oh, S. Adsorptive removal of arsenic and lead by stone-powder/chitosan/maghemite composite beads. Int. J. Environ. Res. Pub. Health 2021, 20, 8808. [Google Scholar] [CrossRef]
  16. Zafar, M.N.; Parveen, A.; Nadeem, R. A pretreated green biosorbent based on neem leaves biomass for the removal of lead from wastewater. Desal. Water Treat. 2013, 51, 4459–4466. [Google Scholar] [CrossRef]
  17. Batool, M.; Nazar, M.F.; Awan, A.; Tahir, M.B.; Rahdar, A.; Shalan, A.E.; Lanceros-Mendez, S.; Zafar, M.N. Bismuth-based heterojunction nanocomposites for photocatalysis and heavy metal detection applications. Nano Struct Nano Object. 2021, 27, 100762. [Google Scholar] [CrossRef]
  18. Jung, G.H. Adsorptive Removal of Arsenic and Lead by Using Stone Powder-Chitosan-Magnetic Beads. Ph.D. Dissertation, Kyungpook National University, Daegu, Republic of Korea, 2019. [Google Scholar]
  19. Sureshkumar, M.K.; Das, D.; Mallia, M.B.; Gupta, P.C. Adsorption of uranium from aqueous solution using chitosan-tripolyphosphate (CTPP) beads. J. Hazard. Mater. 2010, 184, 65–72. [Google Scholar] [CrossRef]
  20. Oh, S. Analysis of sorption kinetics of ibuprofen on sediment using modified two-compartment first order kinetic model (MTCFOKM). KSWST J. Water Treat. 2015, 23, 161–171. [Google Scholar] [CrossRef]
  21. Brion-Roby, R.; Gagnon, J.; Deschenes, J.S.; Chabot, B. Investigation of fixed bed adsorption column operation parameters using a chitosan material for treatment of arsenate contaminated water. J. Environ. Chem. Eng. 2018, 6, 505–511. [Google Scholar] [CrossRef]
  22. Song, G.H. Column study on the characteristics of As and Pb adsorption onto stone powder-based magnetic beads. Ph.D. Dissertation, Kyungpook National University, Daegu, Republic of Korea, 2020. [Google Scholar]
  23. Massart, R. Preparation of aqueous magnetic liquids in alkaline and acidic media. IEEE Trans. Magn. 1981, 17, 1247–1248. [Google Scholar] [CrossRef]
  24. Bee, A.; Obeid, L.; Mbolantenaina, R.; Welschbillig, M.; Talbot, D. Magnetic chitosan/clay beads: A magsorbent for the removal of cationic dye from water. J. Magnetism Magnet. Mater. 2017, 421, 59–64. [Google Scholar] [CrossRef]
  25. Ghosh, M.K.; Poinern, G.E.J.; Issa, T.B.; Singh, P. Arsenic adsorption on goethite nanoparticles produced through hydrazine sulfate assisted synthesis method. Korean J. Chem. Eng. 2012, 29, 95–102. [Google Scholar] [CrossRef]
  26. Oh, S.; Wang, Q.; Shin, W.S.; Song, D.I. Sorption and desorption kinetics of PAHs in coastal sediment. Korean J. Chem. Eng. 2013, 30, 145–153. [Google Scholar] [CrossRef]
  27. Pan, M.; Lin, X.; Xie, J.; Huang, X. Kinetic, equilibrium and thermodynamic studies for phosphate adsorption on aluminum hydroxide modified palygorskite nano-composites. RSC Adv. 2017, 7, 4492–4500. [Google Scholar] [CrossRef]
  28. Chowdhury, Z.Z.; Zain, S.M.; Rashid, A.K.; Rafique, R.f.; Khalid, K. Breakthrough curve analysis for column dynamics sorption of Mn(II) ions from wastewater by using Mangostana garcinia peel-based granular-activated carbon. J. Chem. 2013, 2013, 959761. [Google Scholar] [CrossRef]
  29. Jang, J.S.; Lee, D.S. Enhanced adsorption of cesium on PVA-alginate encapsulated Prussian blue-graphene oxide hydrogel beads in a fixed-bed column system. Biores. Technol. 2016, 218, 294–300. [Google Scholar] [CrossRef]
  30. Mu, W.; Bao, D.; Chang, C.; Lian, F. Adsorption of methyl blue by maize waste based biochar: Adsorption kinetics and isotherms. J. Phys. Conf. Ser. 2020, 1622, 012081. [Google Scholar] [CrossRef]
  31. Kiwaan, H.A.; Mohamed, F.S.; El-Bindary, A.A.; El-Ghamaz, N.A.; Abo-Yassin, H.R.; El-Bindary, M.A. Synthesis, identification and application of metal organic framework for removal of industrial cationic dyes. J. Mol. Liq. 2021, 342, 117435. [Google Scholar] [CrossRef]
  32. Nadeem, R.; Zafar, M.N.; Afzal, A.; Hanif, M.A.; Saeed, R. Potential of NaOH pretreated Mangifera indica waste biomass for the mitigation of Ni(II) and Co(II) from aqueous solutions. J. Taiwan Inst. Chem. Eng. 2014, 45, 967–972. [Google Scholar] [CrossRef]
  33. Banerjee, K.; Amy, G.L.; Prevost, M.; Nour, S.; Jekel, M.; Gallagher, P.M.; Blumenschein, C.D. Kinetic and thermodynamic aspects of adsorption of arsenic onto granular ferric hydroxide (GFH). Water Res. 2008, 42, 3371–3378. [Google Scholar] [CrossRef]
  34. Idris, A.; Ismail, N.S.M.; Hassan, N.; Misran, E. Synthesis of magnetic alginate beads based on maghemite nanoparticles for Pb(II) removal in aqueous solution. J. Ind. Eng. Chem. 2012, 18, 1582–1589. [Google Scholar] [CrossRef]
  35. Kim, J.H.; Shin, W.S.; Kim, Y.H.; Choi, S.J.; Jo, W.K.; Song, D.I. Sorption and desorption kinetics of chlorophenols in hexadecyltrimethyl ammonium-montmorillonites and their model analysis. Korean J. Chem. Eng. 2005, 22, 857–864. [Google Scholar] [CrossRef]
  36. Kwak, M.Y.; Shin, W.S.; Ko, S.O.; Park, J.W.; Jeong, Y.K. Modeling on the sorption kinetics of lead and cadmium onto natural sediments. Korean J. Limnol. 2006, 39, 450–461. [Google Scholar]
  37. Oh, S.; Wu, Q.; Song, D.I.; Shin, W.S. Sorption and desorption kinetics of naphthalene and phenanthrene on black carbon in sediment. J. Soil Groundwater Environ. 2011, 16, 79–94. [Google Scholar] [CrossRef]
  38. Iram, M.; Guo, G.; Guan, Y.P.; Ishfaq, A.; Liu, H.Z. Adsorption and magnetic removal of neutral red dye from aqueous solution using Fe3O4 hollow nanospheres. J. Hazard. Mater. 2010, 181, 1039–1050. [Google Scholar] [CrossRef]
  39. Toride, N.; Leji, F.J.; van Genuchten, M.T. The CXTFIT Code for Estimating Transport Parameters from Laboratory or Field Tracer Experiments. Version 2.1. U.S. Salinity Laboratory Agricultural Research Service; U.S. Department of Agriculture: Riverside, CA, USA.
  40. El-Sadek, A. Comparison between numerical and analytical solution of solute transport models. J. African Earth Sci. 2009, 55, 63–68. [Google Scholar] [CrossRef]
  41. Patel, H. Fixed-bed column adsorption study: A comprehensive review. Appl. Water Sci. 2019, 9, 45. [Google Scholar] [CrossRef]
  42. Juela, D.; Vera, M.; Cruzat, C.; Alvarez, X.; Vanegas, E. Mathematical modeling and numerical simulation of sulfamethoxazole adsorption onto sugarcane bagasse in a fixed-bed column. Chemosphere 2021, 280, 130687. [Google Scholar] [CrossRef]
Figure 1. SCM beads under wet condition.
Processes 11 00581 g001
Figure 2. BET adsorption isotherm curves of the SCM beads.
Processes 11 00581 g002
Figure 3. Images of the dried SCM beads: (a) photo and (b) micrograph (×25).
Processes 11 00581 g003
Figure 4. Images of (a) SEM and (b) EDS spectra of the SCM beads.
Processes 11 00581 g004
Figure 5. A schematic diagram of a column reactor system.
Processes 11 00581 g005
Figure 6. Adsorption kinetics of (a) As and (b) Pb onto SCM beads.
Processes 11 00581 g006
Figure 7. The amount of As and Pb of fast and slow adsorption by MTCFOKM with semi-log scale: (a) As and (b) Pb.
Processes 11 00581 g007
Figure 8. Analysis of the fast and slow adsorption velocity from MTCFOKM with semi-log scale: (a) As and (b) Pb.
Processes 11 00581 g008
Figure 9. The effect of flow rate on the As adsorption breakthrough curves: (ac) C/C0 vs. time and (df) C/C0 vs. PV.
Processes 11 00581 g009
Figure 10. The effect of flow rate on the Pb adsorption breakthrough curves: (ac) C/C0 vs. time and (df) C/C0 vs. PV.
Processes 11 00581 g010
Figure 11. The effect of bed height on (a) As and (b) Pb adsorption breakthrough curves.
Processes 11 00581 g011
Table 1. Parameters for adsorption kinetics of As and Pb onto SCM beads.
Modelqe
(mmol/kg)
f1 (or f1′)
(-)
k1(or k1′)
(1/h)
f2 (or f2′)
(-)
k2 (or k2′)
(1/h)
teq
(h)
v0
(mmol/kg/h)
R2SSE
As
PFOKM2.980 ± 0.157-0.295 ± 0.048--15.630.8780.8623.523
PSOKM3.447 ± 0.184---0.107 ± 0.024268.31.2720.9162.138
TCFOKM-0.096 ± 0.0071.673 ± 0.3510.9040.008 ± 0.001-2.3600.9670.836
MTCFOKM3.820 ± 0.2210.222 ± 0.0167.398 ± 3.5380.7780.086 ± 0.01442.636.5210.9830.443
Pb
PFOKM83.72 ± 0.46-4.199 ± 0.162--1.10351.60.99391.38
PSOKM86.72 ± 0.41---0.104 ± 0.00511.0778.80.99648.72
TCFOKM-0.722 ± 0.0306.842 ± 0.3610.2781.436 ± 0.115-454.61.0004.572
MTCFOKM84.89 ± 0.120.710 ± 0.0326.958 ± 0.3820.2901.526 ± 0.1281.75457.11.0003.821
Table 2. Parameters of Thomas, Yoon-Nelson, and Adams-Bohart models for As column.
Q
(mL/min)
Thomas ModelYoon-Nelson ModelAdams-Bohart Model
kTH
(L/mg/min)
q0
(mg/kg)
R2kYN
(L/min)
τ
(min)
R2kAB
(L/mg/min)
N0
(mg/L)
R2
0.50.0402.470.9270.036255.20.9270.0124.990.300
2.00.1432.940.9890.13776.310.9890.0366.790.172
10.01.1841.820.7321.6786.6170.7310.05010.390.124
Table 3. Parameters of Thomas, Yoon-Nelson, and Adams-Bohart models for Pb column.
Q
(mL/min)
Thomas ModelYoon-Nelson ModelAdams-Bohart Model
kTH
(L/mg/min)
q0
(mg/kg)
R2kYN
(L/min)
τ
(min)
R2kAB
(L/mg/min)
N0
(mg/L)
R2
0.52.7 × 10−526550.9530.011590.50.9518.0 × 10−674610.354
2.01.0 × 10−423990.9530.07679.60.9492.3 × 10−560130.483
10.05.3 × 10−418620.9080.39612.80.9068.1 × 10−563660.444
Table 4. Parameters of Thomas, Yoon-Nelson, and Adams-Bohart models for As and Pb at different bed height experiment.
Bed Height
(cm)
Thomas ModelYoon-Nelson ModelAdams-Bohart Model
kTH
(L/mg/min)
q0
(mg/kg)
R2kYN
(L/min)
τ
(min)
R2kAB
(L/mg/min)
N0
(mg/L)
R2
As
100.1533.3750.9340.14262.000.9310.0289.590.153
150.1432.9400.9890.13776.310.9890.0366.790.172
Pb
101.2 × 10−429380.9440.09064.550.9401.9 × 10−588470.355
151.0 × 10−423990.9530.07679.600.9492.3 × 10−560130.483
Disclaimer/Publisher’s Note: The statements, opinions and data contained in all publications are solely those of the individual author(s) and contributor(s) and not of MDPI and/or the editor(s). MDPI and/or the editor(s) disclaim responsibility for any injury to people or property resulting from any ideas, methods, instructions or products referred to in the content.

