

Research on Motor Rotor Loss of High-Speed Air Compressor in the Application of Hydrogen Fuel Cell Vehicle
1
Gree Electric Appliances, Inc. of Zhuhai, Zhuhai 519000, China
2
State Key Laboratory of Air-Conditioning Equipment and System Energy Conservation, Zhuhai 519070, China
3
College of Energy and Power Engineering, Xi’an Jiaotong University, Xi’an 710049, China
*
Author to whom correspondence should be addressed.
Processes 2023, 11(2), 475; https://doi.org/10.3390/pr11020475
Submission received: 8 December 2022
/
Revised: 15 January 2023
/
Accepted: 28 January 2023
/
Published: 4 February 2023
Abstract
:As an important component of hydrogen fuel cell vehicles, the air compressor with an air foil bearing rotates at tens of thousands of revolutions per minute. The heat generation concentration problem caused by the high-speed motor loss seriously affects the safe and normal operation of the motor, so it is very important to clarify the loss distribution of the high-speed motor and adopt a targeted loss reduction design for air compressor heat dissipation. In this paper, for an air compressor with a foil bearing with a rated speed of 80,000 rpm, an empirical formula and a three-dimensional transient magnetic field finite element model are used to model and calculate the air friction loss, stator core loss, winding loss and permanent magnet eddy current loss. The accuracy of the analytical calculation method is verified by torque test experiments under different revolutions, and the average simulation accuracy can reach 91.1%. Then, the distribution of the air friction loss, stator core loss, winding loss and eddy current loss of the air compressor motor at different revolutions is obtained by using this method. The results show that the proposed method can effectively calculate the motor rotor loss of a high-speed air compressor with air foil bearing. Although the motor efficiency increases with the increase in motor speed, the absolute value of loss also increases with the increase in motor speed. Stator core loss and air friction loss are the main sources of loss, accounting for 55.64% and 29% of the total motor loss, respectively. The electromagnetic loss of winding, the eddy current and other alloys account for a relatively small proportion, which is 15% in total. The conclusions obtained in this paper can effectively guide calculations of motor loss the motor heat dissipation design of a high-speed air compressor with an air foil bearing.
1. Introduction
With the increasingly critical problems of energy shortage and environmental damage, the new energy field has attracted growing attention. In the automotive industry, hydrogen fuel cell electric vehicles provide kinetic energy through the reaction of hydrogen and oxygen on the electrode with the chemical production of only water, for truly zero emissions and zero pollution [1]. Additionally, the energy conversion efficiency of hydrogen fuel cells can reach 60~80% because the reaction is not limited by the Carnot cycle [2,3]. Vehicles containing hydrogen fuel cells also have the advantages of a long driving range and a short refueling time, making these vehicles highly promising as new energy vehicles [4,5]. In the automotive industry, hydrogen fuel cell electric vehicles are considered to be one of the important directions in the development of new energy vehicles.
The air supply system in hydrogen energy vehicles has a significant impact on the dynamic performance of the hydrogen energy vehicles. The air compressor is a key component used to enhance the reaction efficiency. According to the research of Argonne and the DOE in the United States, the cost of the air compressor ranks second in the total cost of the entire fuel cell system [6,7]. Its performance directly affects the overall efficiency and power density of the fuel cells. Therefore, it is of great significance to develop a miniaturized, wide working condition compressor suitable for the vehicles’ working environment. At present, the air compressors used in fuel cell vehicles mainly include roots compressors, screw compressors, vortex compressors, sliding vane compressors and centrifugal compressors. Among them, scroll, screw and centrifugal air compressors have the best comprehensive performance. However, there is friction between the blades of the scroll and screw compressors, and the noise and impact on quality are considerable. In contrast, the centrifugal compressor is the first choice among air compressors for fuel cell vehicles. Internationally famous automobile companies have gradually adopted high-speed centrifugal compressors as vehicle mounted air compressors, and using a single-stage centrifugal compressor has gradually become a trend.
Nowadays, fuel cell air compressors for vehicles are constantly being developed towards the goal of ultra-high speed to meet the air supply demand of high-power fuel cell systems, while achieving the goal of having a small volume and thus reducing the land occupation. Increasing the rotor speed is the key way to ensure that the air compressor can supply air with a high pressure ratio and a large flow rate while having a small volume and light weight [8,9]. In 2010, the U.S. Department of Energy cooperated with Honeywell to develop a gas supply management system based on a centrifugal compressor, which was applied to an 80 kW PEMFC with a maximum speed of 1.1 × 10⁵ rpm [10]. Zhao et al. applied the rated speed to a 2.5 × 10⁵ rpm ultra-high-speed centrifugal compressor in a 10 kW PEMFC system, driven by a speed sensorless permanent magnet synchronous motor with the maximum pressure and flow of 1.6 × 10⁵ Pa and 20 g/s, with a weight of only 0.6 kg [11,12]. The above research shows that this kind of compressor has great potential for use in fuel cell vehicles.
As a driving part, the motor drives the compressor to rotate, which is source of the power for compressing gas. For a high-speed air compressor, the motor loss will increase with an increase in speed. In order to reduce the motor loss and carry out targeted energy conservation and emission reduction, it is necessary to clarify the distribution of the various losses of the motor. Soong W. L. et al. created an electromagnetic and mechanical design for a high-speed and efficient induction motor for centrifugal compressor, and compared the electromagnetic characteristics, loss and mechanical characteristics of three different types of motors (switched reluctance motor, permanent magnet synchronous motor, induction motor) [13]. Seok Mayeong Jang et al. introduced the design and performed an analysis of a high-speed, 50 kW, 700,000 rpm centrifugal compressor. The structural design criteria and power loss of the high-speed motor are analyzed using the theoretical analysis method, and the results are verified using the finite element method [14]. Baek [15] analyzed the iron loss and compared the iron loss of three different magnet shapes (single V type, single flat type and double triangle type) in the rotor structure of a built-in permanent magnet synchronous motor. Yang [16] studied the iron loss and eddy current loss of different voltage harmonics and revealed the change of loss, the temperature rise and the change mechanism for eddy current loss. According to the double “V” curves of the power and current with respect to voltage, Zhang Yongping [17] optimized the no-load loss and load loss separation experiments to separate each part of the loss. However, this method separates the winding loss, mechanical loss, iron loss and stray loss, but does not separate the loss of the rotor. At present, the research on motor loss is mostly focused on the electromagnetic loss, and the overall loss distribution of the motor, including the air friction loss, is lacking. In addition, the loss separation has only been carried out under the rated working conditions. The loss for each part of the motor under the condition of variable speed is lacking.
As mentioned above, small centrifugal air compressors have great potential for use in vehicle mounted fuel cell systems. Reducing the loss of high-speed air compressors to save resources and reduce costs is an urgent problem to solve. At present, the research on the loss distribution of the high-speed motors of hydrogen fuel cell air compressors is limited. Most studies focus on the electromagnetic loss and lack the overall loss distribution of the motor, which would include the wind and friction losses. In addition, the loss separation is only carried out under the rated working conditions. The loss of each part of the motor under the condition of variable speed is lacking. It is very important to define the loss distribution of a high-speed motor and adopt a targeted loss reduction design for air compressor heat dissipation design. Based on this, the air friction loss, stator core loss, winding loss and permanent magnet eddy current loss of a foil bearing air compressor with a rated speed of 80,000 rpm are modeled and calculated using an empirical formula and a three-dimensional transient magnetic field finite element model. The accuracy of the analysis and the calculation method are verified using torque test experiments at different speeds. On the basis of the existing effective calculation methods, this paper proposes a method of motor loss separation that can be applied to the high-speed air compressors in hydrogen fuel cell vehicles. Using this method, the distributions of the air friction loss, stator core loss, winding loss and eddy current loss of an air compressor motor at different speeds are obtained. The changes in the various losses of the motor with the increase in speed are also analyzed. In subsequent designs aimed at loss reduction and heat dissipation, specific and targeted solutions can be proposed for those losses that account for a large proportion of the total loss and change with increases in speed according to the methods and conclusions proposed in this paper. This study can therefore effectively guide the motor loss calculation and motor heat dissipation design of high-speed air compressors with air foil bearings.
2. Analytical Calculation of Air Friction Loss
When a rotor rotates at a high speed, there is a large relative motion between the rotor and the air, resulting in tangential friction and air friction loss. There are two main types of rotor air friction loss: cylinder surface air friction loss and disk surface air friction loss. The air friction loss on the cylinder surface is the friction loss between the cylindrical surface of the rotor and the air, and the disk surface friction loss is the friction loss between the surfaces on both sides of the disk structure of the end face of the rotor thrust plate and the air.
2.1. Cylinder Surface Air Friction Loss
The cylinder surface air friction loss of the rotor can be calculated according to Formula (1) [18,19,20]:
where k1 is the roughness coefficient, and k1 of smooth surface is taken as 1; Cfa is the cylinder surface air friction coefficient; ρ is the gas density, ω is the angular velocity of the cylinder, and r and l are the radius and axial length of the cylinder, respectively.
The air friction coefficient Cfa can be calculated using Formulas (2) and (3) [21]:
where δ is the radial air gap thickness and Reδ is the tangential Reynolds number. The tangential speed is determined by the rotor speed, and the tangential Reynolds number can be calculated using Formula (4):
where μ is the dynamic viscosity of the gas and u1 is the tangential velocity of the shaft.
For a rotating body in free space, the axial Reynolds number is calculated as follows:
2.2. Disk Surface Air Friction Loss
The shaft surface air friction loss of the rotor can be calculated according to Formula (7):
where Pe is the sum of the loss values of the two disk surfaces, Cfe is the air friction coefficient of the disk surface, r1 is the inner radius of the thrust plate and r2 is the outer radius of the thrust plate, as shown in Figure 1a.
According to the relationship between the spacing ratio (s/r2: the ratio of the distance from the thrust plate to the thrust bearing to the outer diameter of the thrust plate) and the Reynolds number, four regions are defined in a schematic diagram as shown in Figure 1b. Regions I and II are laminar flow zones and regions III and IV are turbulent flow zones, while only tangential velocity is reflected in regions I and III and there is a radial pumping effect in regions II and IV. The Cfe calculation formula of the disk surface friction coefficient of each region is as follows [22]:
For a body rotating in free space, the empirical formulas of friction coefficient are:
The above Cfe formulas are applicable to the Reynolds number in the range 103 to 107, and the spacing ratio (s/r2) in the range of 0.0127 to 0.217.
2.3. Calculation of Air Friction Loss of Air Compressor
The above formulas can be used to construct a model to calculate the air friction loss caused by the high-speed rotation of the rotors of ultra-high-speed air compressors with air foil bearings. The calculation model is shown in Figure 2. In this model, the rotor mainly includes a spindle and thrust plate. The clearance of each air foil bearing is assumed to be consistent with δ1 in the process of movement. The specific parameter values are listed in Table 1.
3. Simulation Calculation of Electromagnetic Loss
When the motor is running, the motor no-load loss includes stator core loss, permanent magnet eddy current loss (in some cases this may be considered stray loss) and air friction loss. Motor load loss includes winding loss and stray loss. In this work, the air friction loss of the motor was assessed using a combination of simulation and measurement. The formula is as follows:
where PLoss is the total loss of the motor measured in the experiment, while PFe, PCu and PSolid are the core loss, winding loss and eddy current loss, respectively, obtained using finite element simulation.
3.1. Maxwell Theoretical Equations
For simulation, it is necessary to analyze the mechanical movement within a certain period of time. Here, the excitation input is mostly a three-phase sine wave current, which can be solved using a transient magnetic field. The formula of the vector and scalar magnetic potential in the three-dimensional transient state is [23]:
where H is the magnetic field intensity, J is the current density, B is the magnetic induction intensity, E is the electric field intensity and A is the magnetic potential. Using the above equation, the following two identities can be obtained.
This theoretical equation is used to solve a three-dimensional transient magnetic field. For a mechanical transient solution, the discrete displacement or angle must be calculated, and its equation can be expressed as follows.
where x represents the mechanical displacement, i.e., the displacement or angle that is discretized [24].
The Bertotti separation model is typically used to solve for the stator core loss using the finite element method, which decomposes the core loss into three parts: hysteresis loss, eddy current loss and additional eddy current loss [25]. The loss formula of the motor core per unit mass is as follows:
By refining the iron loss calculation model, a calculation formula based on loss coefficient and magnetic flux density maximum can be obtained.
where kh, kc, ke are the hysteresis loss coefficient, eddy current loss coefficient and additional loss coefficient of stator materials, respectively. Bm is the magnetic density amplitude of each point in the stator; α is the Steinmetz coefficient, which ranges from 0.7 to 2.2 according to the properties of the material properties.
The simulation simplifies the skin effect of copper wire, so only the traditional DC loss is needed to calculate the winding loss [26]:
where m is the coefficient. When R represents the phase resistance, m of the three-phase motor is 3.
In the finite element time domain, the magnetic field equation can be expressed as:
where As is the magnetic vector potential, Js is the source current density, E is the potential scalar and Hc is the permanent magnet coercivity. When the magnetic field in the magnetic steel and the magnetic steel sheath changes, the induced current generated is eddy current. The eddy current loss is calculated using the z-direction component Js of current density, and its finite element simulation equation can be expressed as follows:
3.2. Basic Assumptions and Model Building
Here, ANSYS Maxwell finite element software was used to solve the three-dimensional machine model. To facilitate calculation, the following assumptions were made for the motor model without affecting the results:
- The core loss model adopted the classical calculation formula and ignored any loss change caused by the stacking times of the stator cores;
- The non-uniformity of the permanent magnet structure and the influence of the motor temperature change on the calculation of the motor loss were not considered in this model;
- To avoid mutual interference between the motion domain and the bearing, the gap between the bearing and the rotating shaft was enlarged to 0.9 mm. The windings were treated as stranded winding, and the effect of skin effect was not considered.
The main parameters of the motor are shown in Table 2. The motor body structure includes an 18 slot stator, double-layer winding and the magnetic steel and sheath. The screw holes and chamfers of shell, diffuser and bearing were simplified in the model. The winding modeling was refined to exhibit axial asymmetric distribution. The Dirichlet boundary condition was given in the model, with shaft–rotor–magnetic-steel–sheath as the motion domain. Using the air gap length as the grid standard, the grid of motion domain and stator was refined to 1/2 of the air gap length, and the boundary layer of magnetic steel and sheath was generated. The resulting high-speed permanent magnet motor model established using the above reasonable assumptions, and the model processing is shown in Figure 3.
Silicon steel B27AV1400 was selected as the stator core material of the prototype. According to the alternating magnetization loss curve of silicon steel, the loss coefficient of the model can be fitted using the least square method. Using simulation analyses of different speed conditions, the B-P curve at multi-frequency was selected during fitting. The specific curve and fitting results are shown in Figure 4 and Table 3.
4. Experimental Verification
4.1. Test Method
To measure the loss and efficiency of the motor, the loss separation method was used. The voltage of the rated frequency was applied to the tested motor, and the input power p1 was recorded. The experimental platform is shown in Figure 5, with a 540 V output DC power source, variable-frequency drive, power meter and motor. The voltage port of the power meter is connected between the frequency converter and the motor through the terminal, and the current data is clamped with AC current pliers. The output torque of the motor can be measured using a torque-measuring instrument, and the output power p2 of the motor is:
where T is the output torque of the motor and n is the synchronous rotation speeds of the motor. Motor efficiency η and Loss Ploss are:
To further verify the accuracy of the winding model, the phase resistance of the motor was measured experimentally. During measurement, the motor was at room temperature and the rotor was stationary. A DC resistance tester was used, as shown in Figure 6. Since the Y-connection three-phase winding of the motor is internally connected, there are only three outgoing terminals. The resistance value of each phase was calculated according to the following formula:
4.2. Simulation Model Verification
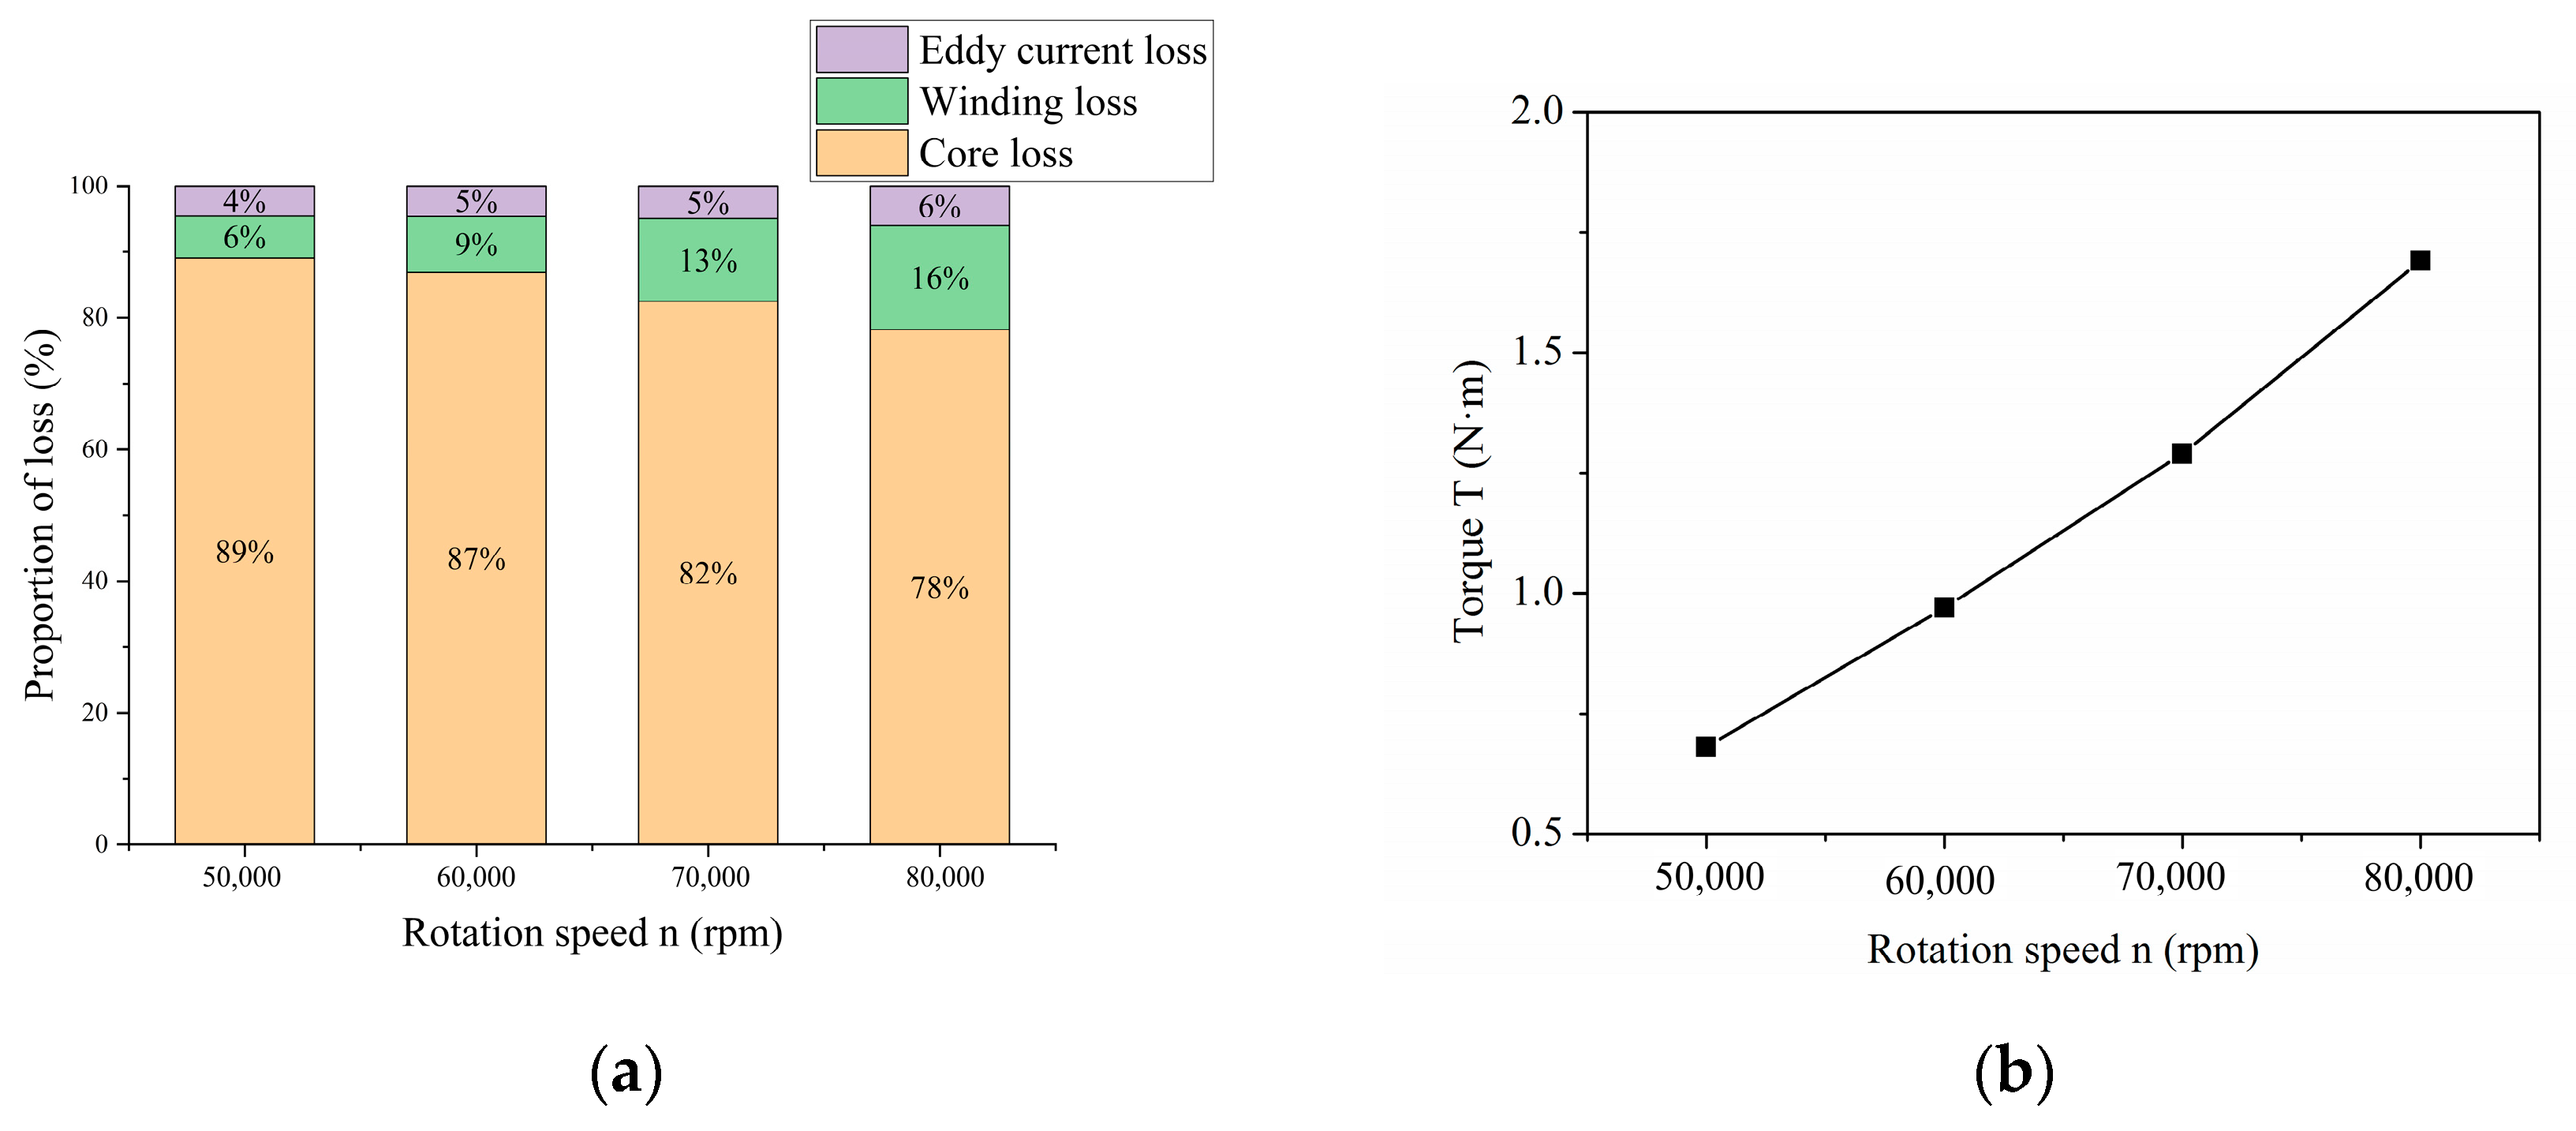
Under the 540 V rated voltage, the motor operating frequency was adjusted, and P1 and T were measured when the readings of power meter and torque meter became stable. The experimental data are shown in Table 4. The torque comparison results from the simulation and test data from 50,000 rpm to 80,000 rpm are shown in Figure 7. The simulation gave torque values slightly higher than the test values, but with consistent trends and average accuracy of 91.1%.
Finally, the measured phase resistance of the motor at 25 °C is R25 = 0.00187 Ω, which can be converted to 0.0227 Ω at 75 °C. The simulation data for the winding loss allowed the calculation of a phase resistance of 0.0256 Ω, which is close to the measured value, demonstrating good modeling accuracy.
5. Results and Discussion
5.1. Analysis of Air Friction Loss
As can be seen from Figure 8a, when the rotation speeds range from 50,000 rpm to 80,000 rpm, the largest proportion of air friction loss is the cylinder surface loss of the main shaft, at about 55%, followed by the disk surface loss of the thrust plate, at about 36%. The cylinder surface and disk surface loss of the thrust plate account for only a relatively small proportion, about 9% in total. Given the small volume of the thrust plate, the heat flux generated by the wind friction loss here is large, and this is a difficulty addressed in the heat dissipation design. As shown in Figure 8b, the overall air friction loss increases exponentially with increases in the rotation speeds, reaching 195.84 W at the rated 80,000 rpm.
Due to the complexity of the air compressor structure, the analytic method theory was used to estimate the air friction loss and the change trend in the rotation speed for the analysis of the overall heat flow density distribution. The loss separation method was used to determine the specific numerical air friction loss, and this information was used in the subsequent cooling scheme design, which utilized accurate input parameters.
According to the experimental test, the total loss at 50,000 rpm to 80,000 rpm is obtained, and, combined with the simulation calculation results, the air friction loss at different revolutions is separated, as shown in Figure 9. The loss is generally on the rise, and the air friction loss accounts for about 29% of the total loss.
5.2. Analysis of Electromagnetic Loss Simulation Results
Maxwell 3D cannot use adaptive mesh generation in transient analysis, so it was necessary to verify the mesh independence to eliminate the potential for error arising from differences in mesh generation. The motor model was divided into four kinds of meshes with different degrees of refinement: 101,517, 387,980, 504,933 and 1,133,367. The losses obtained from these different meshes were determined as shown in Figure 10. The curved surface and boundary layer meshes had large influences on the magnetic field solution, and the core loss and eddy current loss fluctuated greatly, but there were few changes in winding loss and torque. From 504,933 to 1,133,367 grids, there were loss differences of 0.8%, 0.9% and 1%, respectively, with no change in torque. Considering the grid error and computer simulation cost, 504,933-grid division was finally selected based on the results.
The calculated stator core loss distribution results for 80,000 rpm are shown in Figure 11.
As shown in Figure 11, the maximum magnetic induction intensity occurs at the junction between the stator gear and the yoke. After one power cycle, the core loss value does not rise or show periodicity, but fluctuates stably between 270 W and 500 W. Here, the end winding of the motor accounted for 72.7% of the total length, with losses of asymmetric end winding of 26.1 W and 21.2 W. Other losses determined using three-dimensional simulation are shown in Table 5 and Figure 12. The electromagnetic loss of the whole machine is 410.93 W, and core loss accounted for the highest proportion of the total loss, 78%. The external alloy material of the motor will also be affected by the magnetic field and cause loss, but this loss is too low to be considered.
To compare the air friction loss results more comprehensively, we varied the rotation speeds and excitation for the same motor model, and solved for the motor data at 50,000 rpm, 60,000 rpm and 70,000 rpm, as shown in Figure 13. With increased rotation speeds, the total output power of the motor increased, and the rotating magnetic field became stronger, so the output torque exhibited an upward trend. The stator core loss and winding loss changed greatly. With the change in the rotation speeds, the magnetic field-related parameters in the stator core also change, such as the frequency f and maximum magnetic induction Bm. Overall, increased rotation speeds increased the excitation and copper loss with the increase in current.
5.3. Overall Analysis of Motor Loss
After the losses of each part of the motor are separated, the loss values for each part are calculated, respectively, when the speed is 50,000 rpm, 60,000 rpm, 70,000 rpm, 80,000 rpm. As the speed increases, the motor efficiency increases from 93.11% to 95.62%. However, at the same time, the absolute value of the loss value also increases, from 280 W to 760 W. Among the losses, the proportion of the stator iron loss decreases relatively with the increase in speed, from 73% to 56%, but it still accounts for a large proportion of the total loss, more than 50%. Therefore, it is crucial to study the loss distribution in order to reduce the loss as much as possible to improve the motor rotor efficiency of the high-speed air compressor with an air foil bearing. The proportion of motor air friction loss increases from 18% to 29% as the speed increases. Therefore, it is of great significance to study the distribution of the motor rotor air friction loss of the air compressor with an air foil bearing at high speeds to avoid a high air friction loss. Stray losses, such as winding copper loss, eddy current loss and the electromagnetic loss of other alloys, increase slightly with the increase in rotating speed, and their proportion in the total loss is low. At the high rotating speed of 80,000 rpm, it is about 15%.
In our future work, we will create a targeted loss reduction design for a high-speed air compressor motor for fuel cell vehicles based on the above methods and results. Since the stator core loss accounts for the largest proportion, we can take measures to reduce it: increase the stator slot sectional area, increase the stator slot filling factor, etc. The air friction loss of the motor accounts for about one quarter to one third of the loss and changes greatly with the increase in the speed. Great attention must thus be paid to it at high speeds. The air friction loss is mainly caused by the bearings and seals, and the following measures can be taken to reduce it: use high-efficiency shafts, use high-efficiency lubrication systems and lubricants and use advanced sealing technology, etc. Other losses account for a small proportion and do not change significantly with speed. If conditions permit, relevant measures can be taken to reduce these losses. In order to improve the efficiency of loss reduction and save costs, we should give priority to reducing the components of the loss with the highest proportions and with obvious changes with increases in speed.
6. Conclusions
In this work, the air friction loss, stator core loss, winding loss and permanent magnet eddy current loss of a foil bearing air compressor with a rated speed of 80,000 rpm are modeled and calculated using an empirical formula and a three-dimensional transient magnetic field finite element model. The accuracy of the analysis and calculation method are verified using torque test experiments at different speeds. Using this method, the distributions of the various losses of an air compressor motor at different speeds are obtained. The following conclusions are obtained:
- The air friction loss was solved for different rotating cylinder and disk surfaces of the rotor using analytical method. The distribution of the air friction loss of the rotor was determined, and the magnitude of the total air friction loss was estimated. As the rotation speed increases, the overall loss shows an upward trend, and the air friction loss accounts for about 29% of the total loss.
- The winding ends of the motor are long and asymmetrically distributed, so to fully consider the three-dimensional structure of the motor and more accurately calculate loss, a whole machine model was established. The results for the model matched the experimental results well, indicating that the model has a good accuracy.
- The motor efficiency increases with the increase in the rotation speed, but the absolute value of loss also increases with the increase in the rotation speed. Stator core loss and air friction loss are the main sources of loss, accounting for 55.64% and 29% of the total motor loss, respectively. The electromagnetic loss of the winding, eddy current and other alloys accounts for a relatively small proportion, which is 15% in total.
In subsequent designs for loss reduction and heat dissipation, specific and targeted solutions can be proposed for those losses that accounts for a large proportion of the total and that change with increases in the speed according to the methods and conclusions proposed in this paper. The stator core loss can be reduced by increasing the stator slot sectional area and the stator slot filling factor, etc. The air friction loss can be reduced by using high-efficiency shafts, using high-efficiency lubrication systems and lubricants and using advanced sealing technology, etc. The conclusions obtained in this paper can effectively guide the motor loss calculation and motor heat dissipation design of a high-speed air compressor with an air foil bearing.
Author Contributions
Conceptualization, B.Y.; Data curation, H.L.; Formal analysis, B.Y.; Funding acquisition, Y.C.; Investigation, F.W. and Y.C.; Methodology, B.Y., Z.Z. and Y.C.; Project administration, Z.Z.; Resources, H.L.; Software, B.Y.; Supervision, Z.Z.; Validation, B.Y.; Visualization, H.L.; Writing—original draft, F.W.; Writing—review & editing, F.W. All authors have read and agreed to the published version of the manuscript.
Funding
This research was funded by the National Key R&D Program of China (2019YFB1504600).
Data Availability Statement
Not applicable.
Conflicts of Interest
The authors declare no conflict of interest.
References
- Zhigang, S.; Baolian, Y. Developing Trend and Present Status of Hydrogen Energy and Fuel Cell Development. Bull. Chin. Acad. Sci. 2019, 34, 469–477. [Google Scholar]
- Penglong, B.; Daobiao, Z.H.; Sichuan, X.; Yu, W. Development status and trend of air compressor in fuel cells vehicle. Chin. J. Power Sources 2016, 8, 1731–1734. [Google Scholar]
- Hongqin, L. Design and Research of High Speed Centrifugal Compressor for Hydrogen Fuel Cell Vehicle. Ph.D. Thesis, Zhejiang University, Hangzhou, China, 2019. [Google Scholar]
- Dong, H.; Kai, Z.; Yanyi, Z.; Xiaobing, W.; Xiang, J.; Renguang, W. Brief Introduction of Technology of Air Compressor for Fuel Cell Vehicles. Automob. Parts 2019, 5. [Google Scholar] [CrossRef]
- Yi, Z. Development status and Trend Analysis of Air Compressor for Fuel Cell Vehicle. Intern. Combust. Engine Parts 2019, 2. [Google Scholar]
- Carlson, E.J.; Kopf, P.; Sinha, J.; Sriramulu, S.; Yang, Y. Cost Analysis of PEM Fuel Cell Systems for Transportation: September 30, 2005; National Renewable Energy Lab. (NREL): Golden, CO, USA, 2005. [Google Scholar]
- Ahluwalia, R.K.; Wang, X.; Kwon, J.; Rousseau, A.; Kalinoski, J.; James, B.; Marcinkoski, J. Performance and cost of automotive fuel cell systems with ultra-low platinum loadings. J. Power Sources 2011, 196, 4619–4630. [Google Scholar] [CrossRef]
- Wan, Y.; Guan, J.; Xu, S. Improved Empirical Parameters Design Method for Centrifugal Compressor in PEM Fuel Cell Vehicle Application. Interntional J. Hydrog. Energy 2017, 42, 5590–5605. [Google Scholar] [CrossRef]
- Venturi, M.; Sang, J.; Knoop, A.; Hornburg, G. Air Supply System for Automotive Fuel Cell Application; SAE Technical Paper SAE 2012 World Congress & Exhibition; Society of Automotive Engineers (SAE): Warrendale, PA, USA, 2012. [Google Scholar]
- Ahluwalia, R.K.; Wang, X. Fuel Cell Systems for Transportation: Status and Trends. J. Power Sources 2008, 177, 167–176. [Google Scholar] [CrossRef]
- Zhao, D.; Daniel, K.; Blunier, B.; Zwyssig, C.; Dou, M.; Miraoui, A. Design and Control of an Ultra High Speed Turbo Compressor for the Air Management of Fuel Cell Systems. In IEEE Transportation Electrification Conference and Expo (ITEC); IEEE: Dearborn, MI, USA, 2012. [Google Scholar]
- Zhao, D.; Blunier, B.; Gao, F.; Dou, M.; Miraoui, A. Control of an Ultra High Speed Centrifugal Compressor for the Air Management of Fuel Cell Systems. IEEE Trans Ind. Appl. 2014, 50, 2225–2234. [Google Scholar] [CrossRef]
- Soong, W.L.; Kliman, G.B.; Johnson, R.N.; White, R.A.; Miller, J.E. Novel high-speed induction motor for a commercial centrifugal compressor. IEEE Trans. Ind. Appl. 2000, 36, 706–713. [Google Scholar] [CrossRef]
- Jang, S.M.; Cho, H.W.; Choi, J.Y.; Park, J.H.; Choi, S.K. Development of high-speed brushless DC motor for turbo-compressor. 2005 Int. Conf. Electr. Mach. Syst. 2005, 2, 877–882. [Google Scholar]
- Baek, C.H.; Shin, H.S.; Choi, J.Y. Iron loss analysis of a concentrated winding type interior permanent magnet synchronous motor with single and dual layer magnet shape. Machines 2021, 9, 74. [Google Scholar] [CrossRef]
- Yang, C.; Zhang, Y.; Qiu, H. Influence of output voltage harmonic of inverter on loss and temperature field of permanent magnet synchronous motor. IEEE Trans. Magn. 2019, 55, 1–5. [Google Scholar] [CrossRef]
- Zhang, Y.; Duan, X.; Guo, Y. Research on loss separation of permanent magnet synchronous motor applied in engineering. Small Spec. Electr. Mach. 2016, 44, 46–49. [Google Scholar]
- Guangwei, L.; Xingang, Z.; Fengge, Z.; Xin, Z.; Wenping, C. Iron Loss and Air Friction Loss for High Speed Permanent Magnet Clow Pole Machines. Trans. China Electrotech. Soc. 2015, 30, 148–154. [Google Scholar]
- Aglen, O. Loss Calculation and Thermal Analysis of a High-Speed Generator. In Proceedings of the IEEE International Electric Machines and Drives Conference, Madison, WI, USA, 1–4 June 2003; pp. 1117–1123. [Google Scholar]
- Junqiang, X.; Fengxiang, W.; Dianhai, Z.; Xiaoguang, K. Research on Rotor Air Friction Loss of High-speed Permanet Magnet Machines. Proc. CSEE 2010, 27, 14–19. [Google Scholar]
- Bilgen, E.; Boulos, R. Functional Dependence of Torque Coefficient of Coaxial Cylinders on Gap Width and Reynolds Numbers. J. Fluids Eng. 1973, 95, 122–126. [Google Scholar] [CrossRef]
- Daily, J.W.; Nece, R.E. Chamber Dimension Effects on Induced Flow and Frictional Resistance of Enclosed Rotating Disks. J. Basic Eng. 1960, 82, 217. [Google Scholar] [CrossRef]
- Chapman, S.J. Electric Machinery Fundamentals; Tsinghua University Press: Beijing, China, 2013. [Google Scholar]
- Bertotti, G. General Properties of Power Losses in Soft Ferromagnetic Materials. IEEE Trans. Magn. 1988, 24, 621–630. [Google Scholar] [CrossRef]
- Bo, Z.; Hongliang, Z. Application of Ansoft 12 in Engineering Electromagnetic Field; China Water & Power Press: Beijing, China, 2010. [Google Scholar]
- Ye, H. Design and Analysis of a 100 kW, 50,000 r/min High Speed Permanent Magnet Synchronous Machine. Ph.D. Thesis, Shenyang University of Technology, Shenyang, China, 2017. [Google Scholar]
Figure 1.
Zoning method of end face wind friction loss calculation. (a) Schematic diagram of rotating end face. (b) Approximate fluid region division of closed rotating disk.
Figure 1.
Zoning method of end face wind friction loss calculation. (a) Schematic diagram of rotating end face. (b) Approximate fluid region division of closed rotating disk.
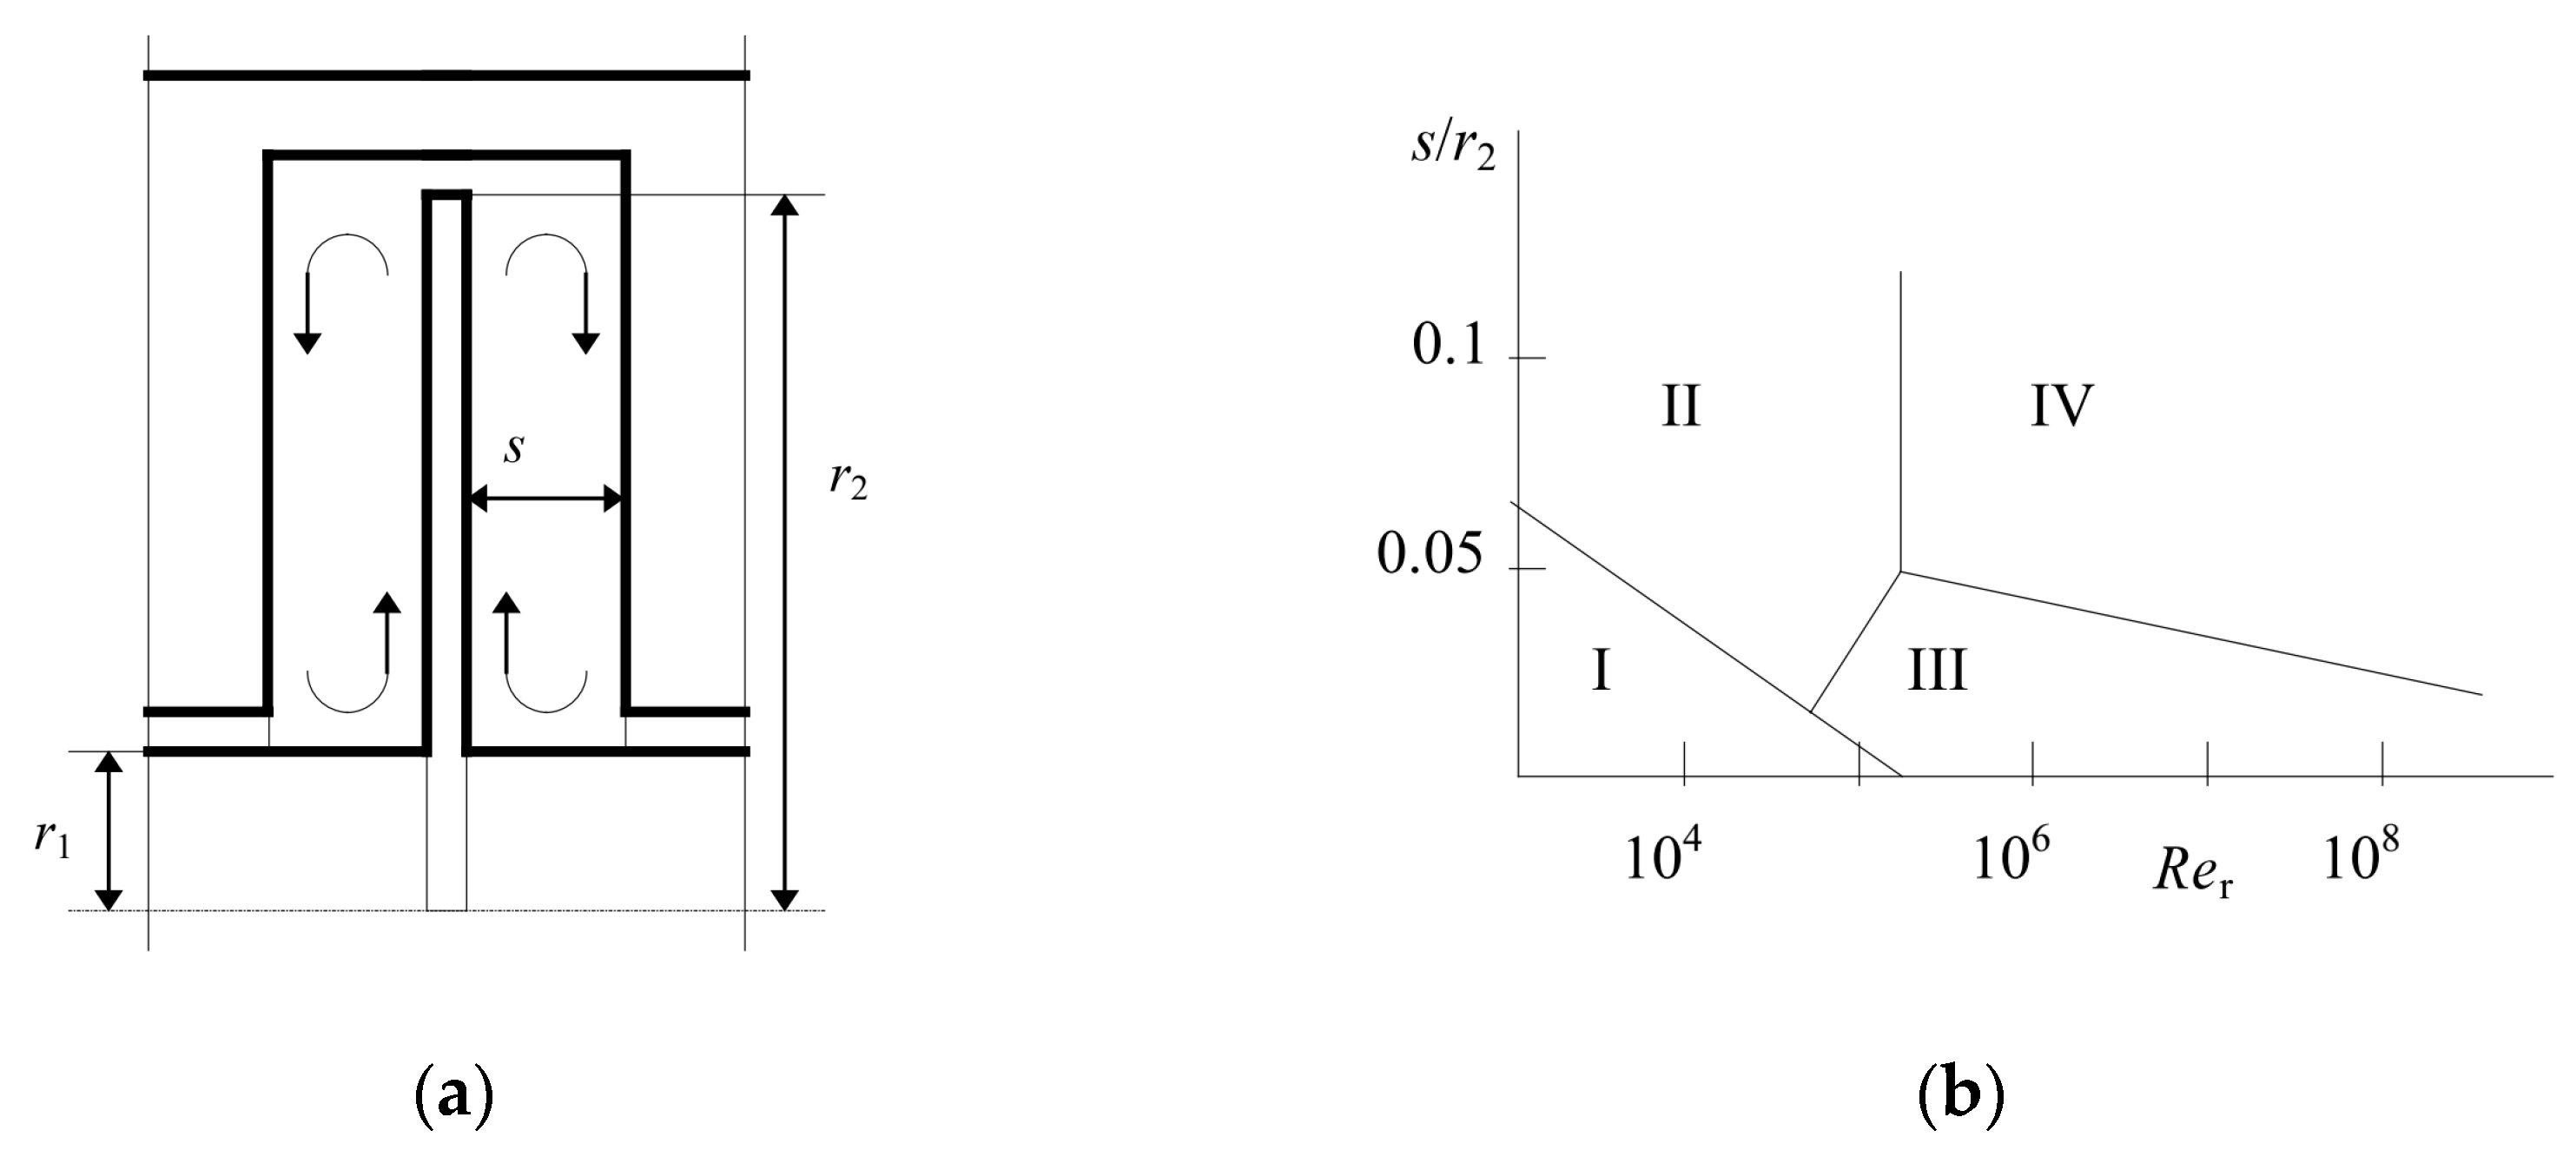
Figure 2.
Simplified model sectional view of air compressor.
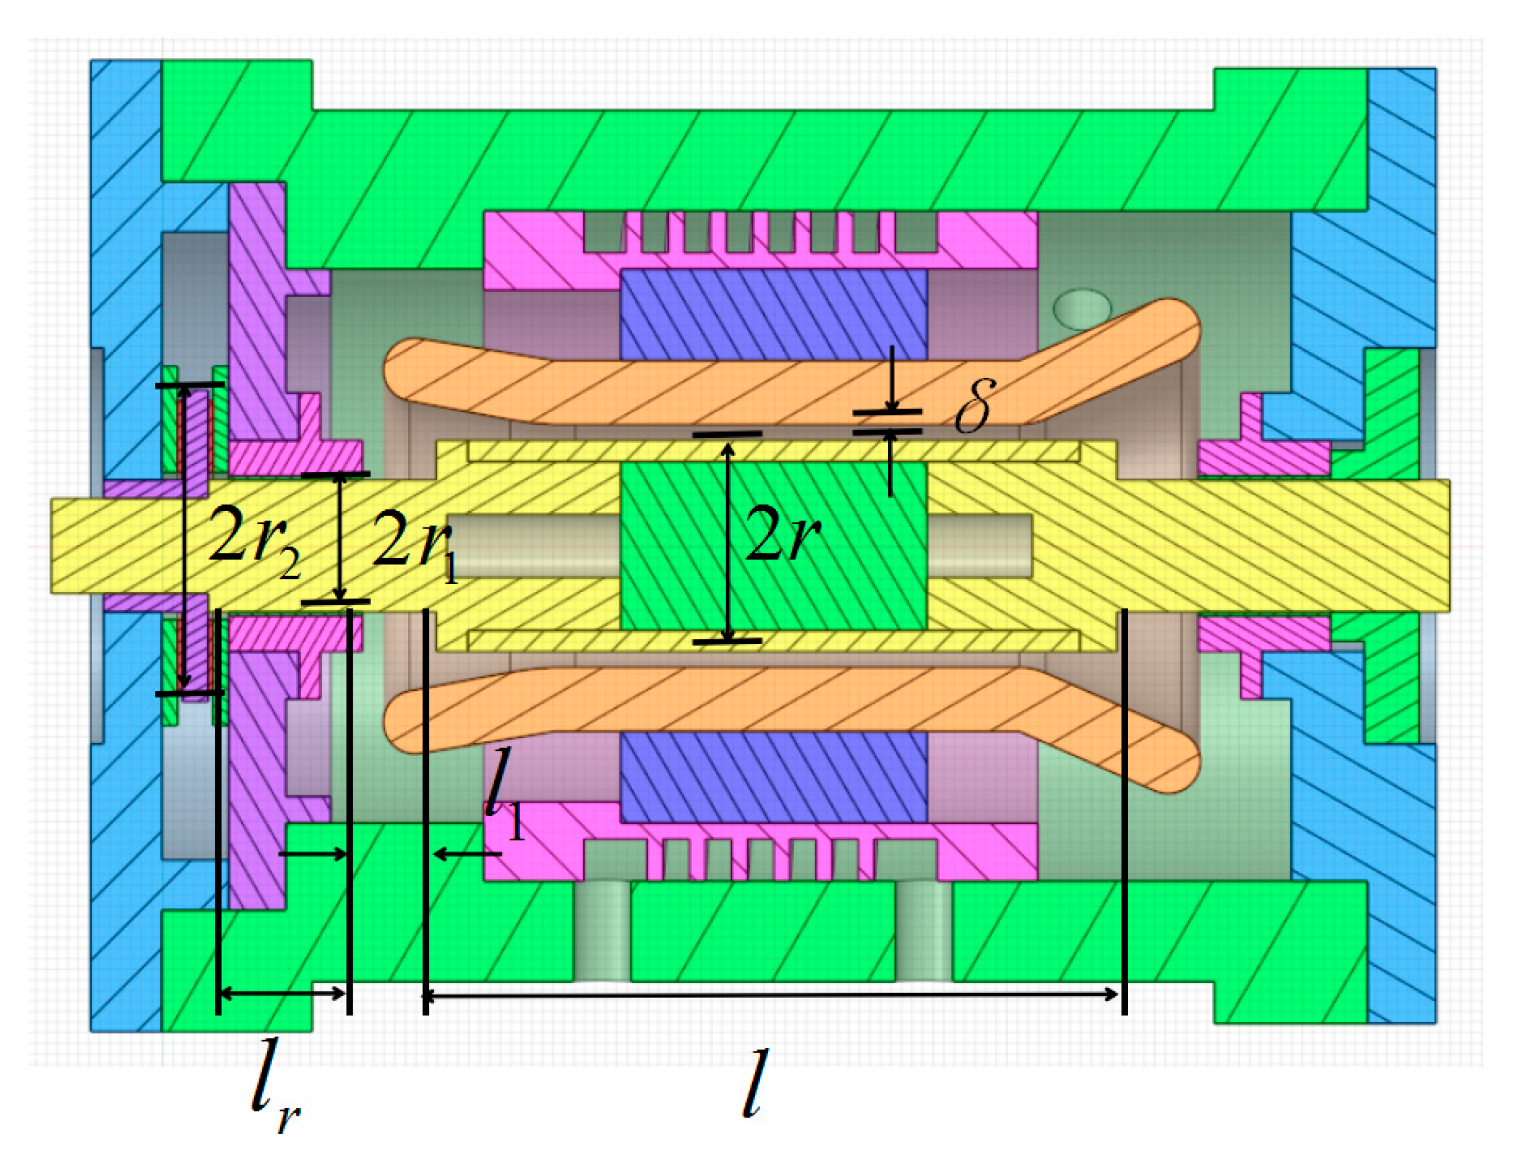
Figure 3.
Structural diagram of 3D complete machine.

Figure 4.
B-P curves of silicon steel B27AV1400 at different frequencies.

Figure 5.
Experimental device diagram of air compressor motor.
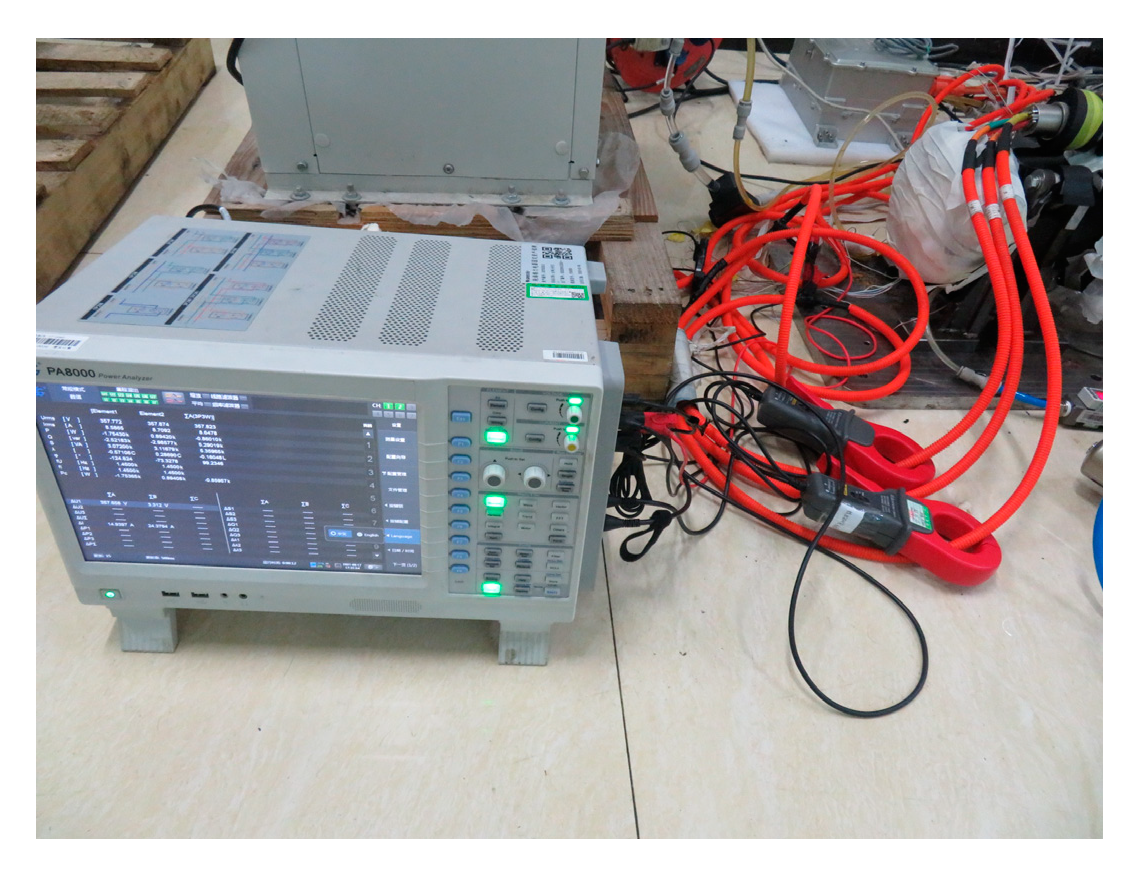
Figure 6.
Photo of motor DC resistance test.
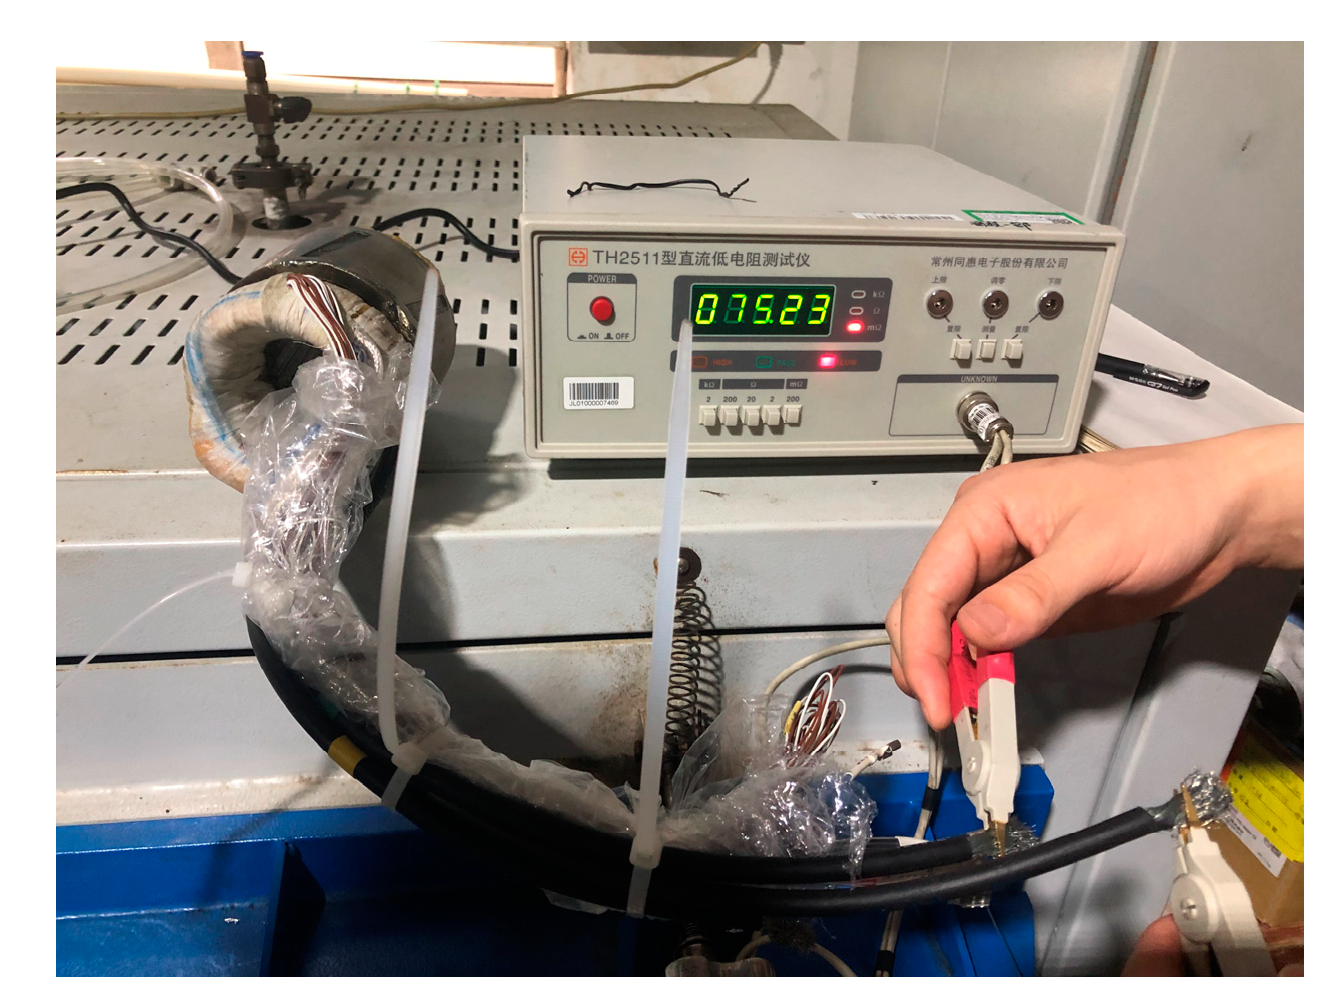
Figure 7.
Comparison diagram of experimental test torque and simulation calculation torque.

Figure 8.
Relationship between air friction loss and revolution of air compressor rotor. (a) Relationship between air friction loss and revolutions of each part. (b) Relationship between air friction loss and revolutions.
Figure 8.
Relationship between air friction loss and revolution of air compressor rotor. (a) Relationship between air friction loss and revolutions of each part. (b) Relationship between air friction loss and revolutions.
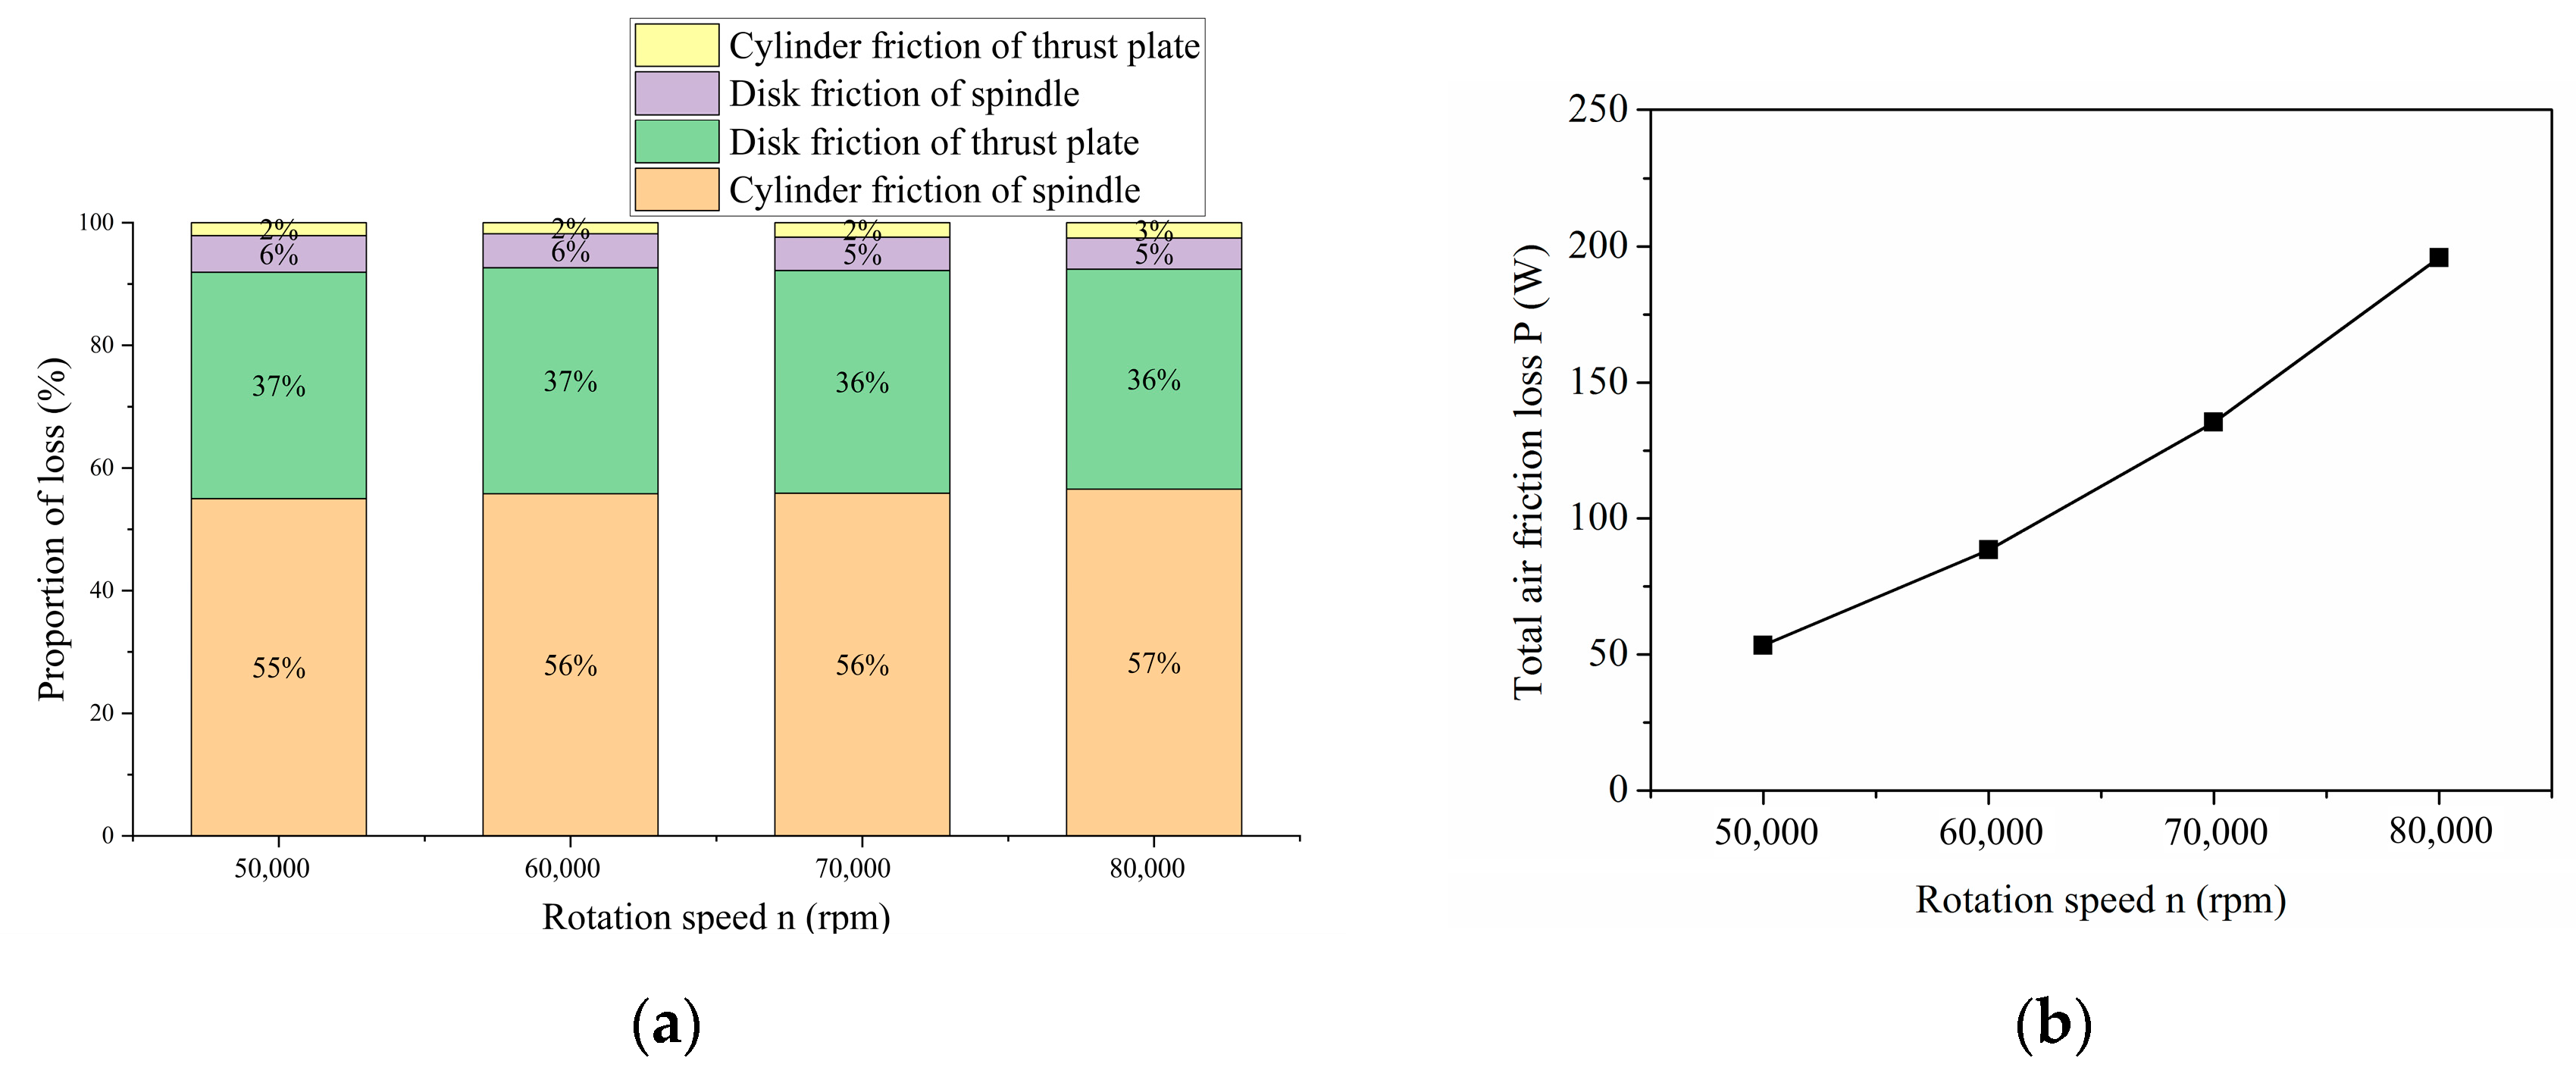
Figure 9.
Comparison diagram between calculated wind friction loss and measured total loss by loss separation.
Figure 9.
Comparison diagram between calculated wind friction loss and measured total loss by loss separation.
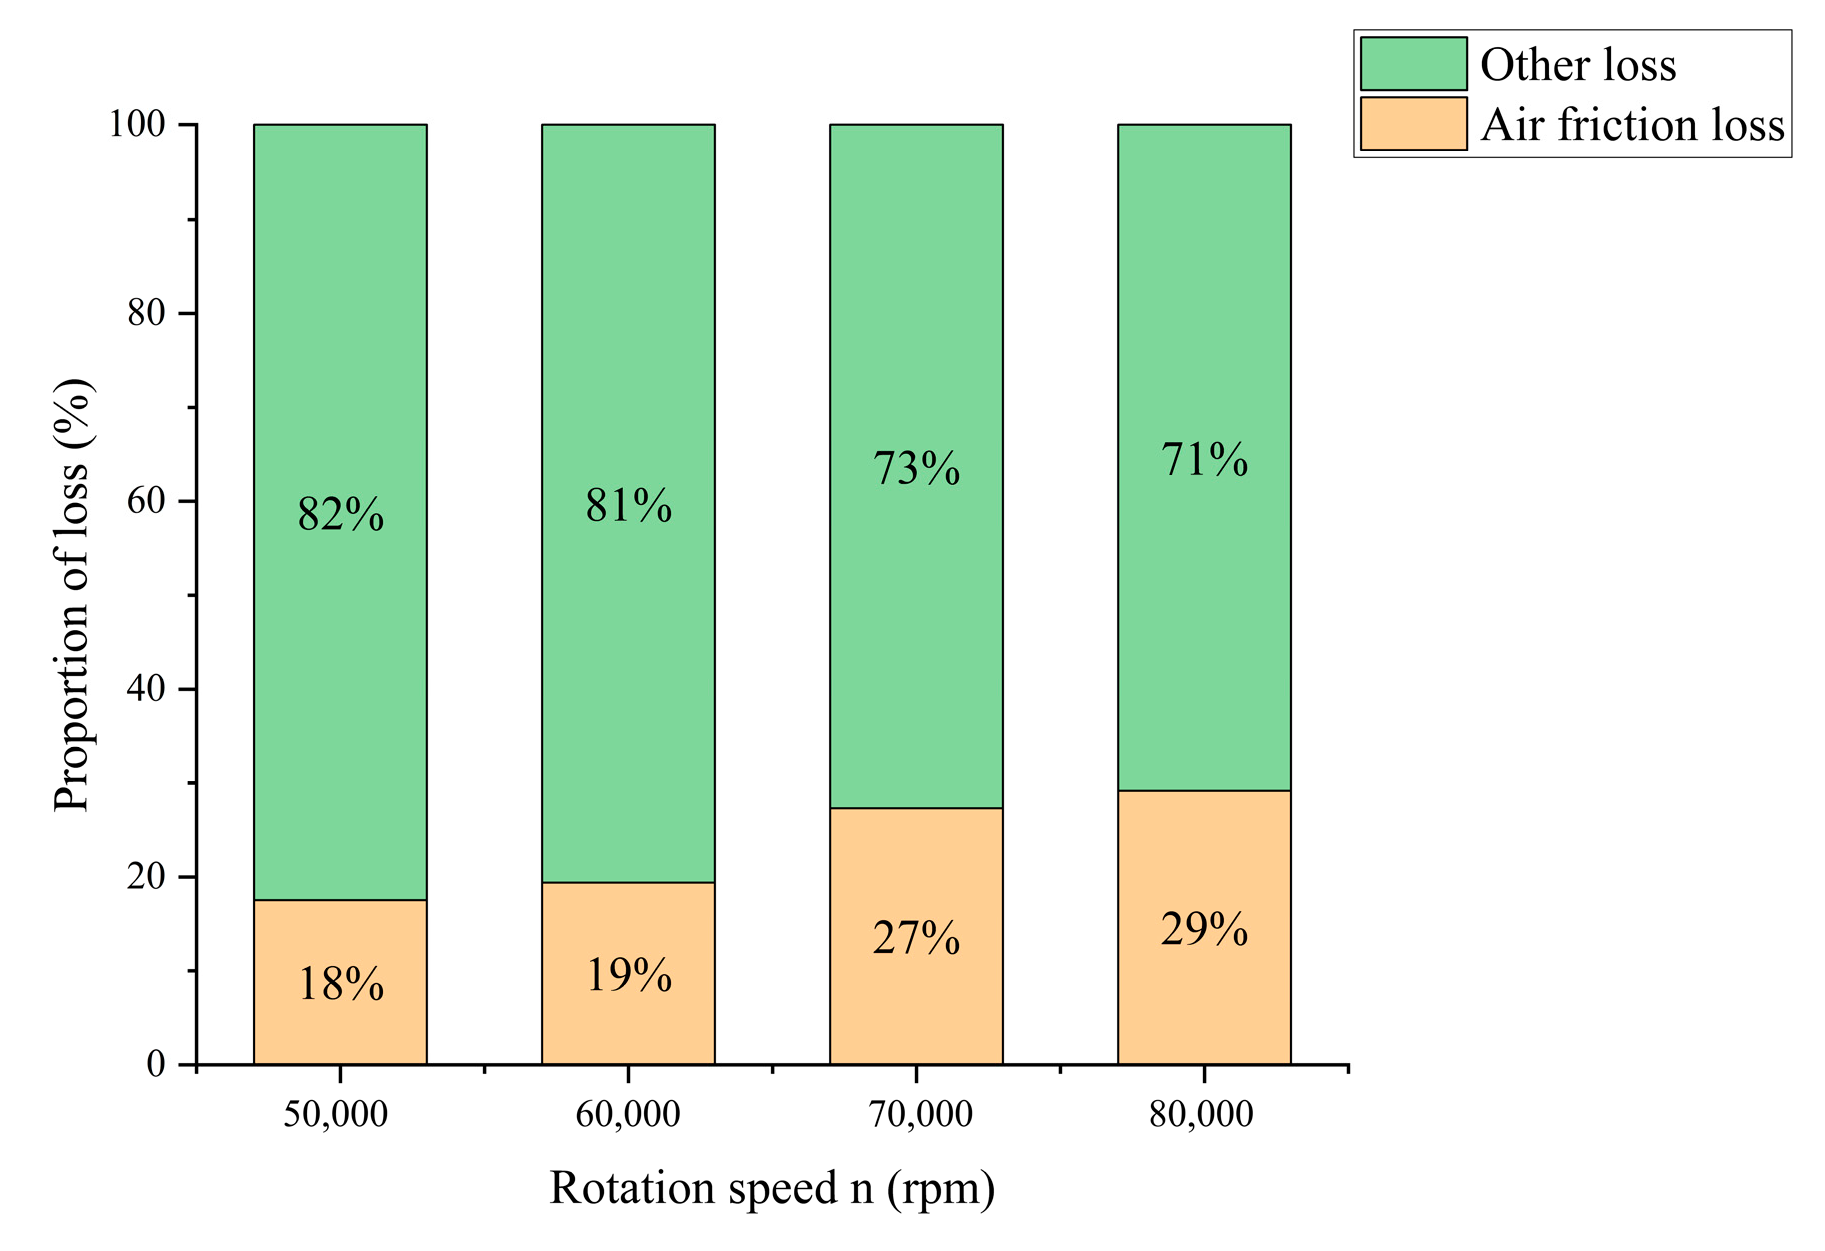
Figure 10.
Grid independence verification. (a) Comparison of loss changes of various components under different grid numbers. (b) Torque variation under different grid numbers.
Figure 10.
Grid independence verification. (a) Comparison of loss changes of various components under different grid numbers. (b) Torque variation under different grid numbers.
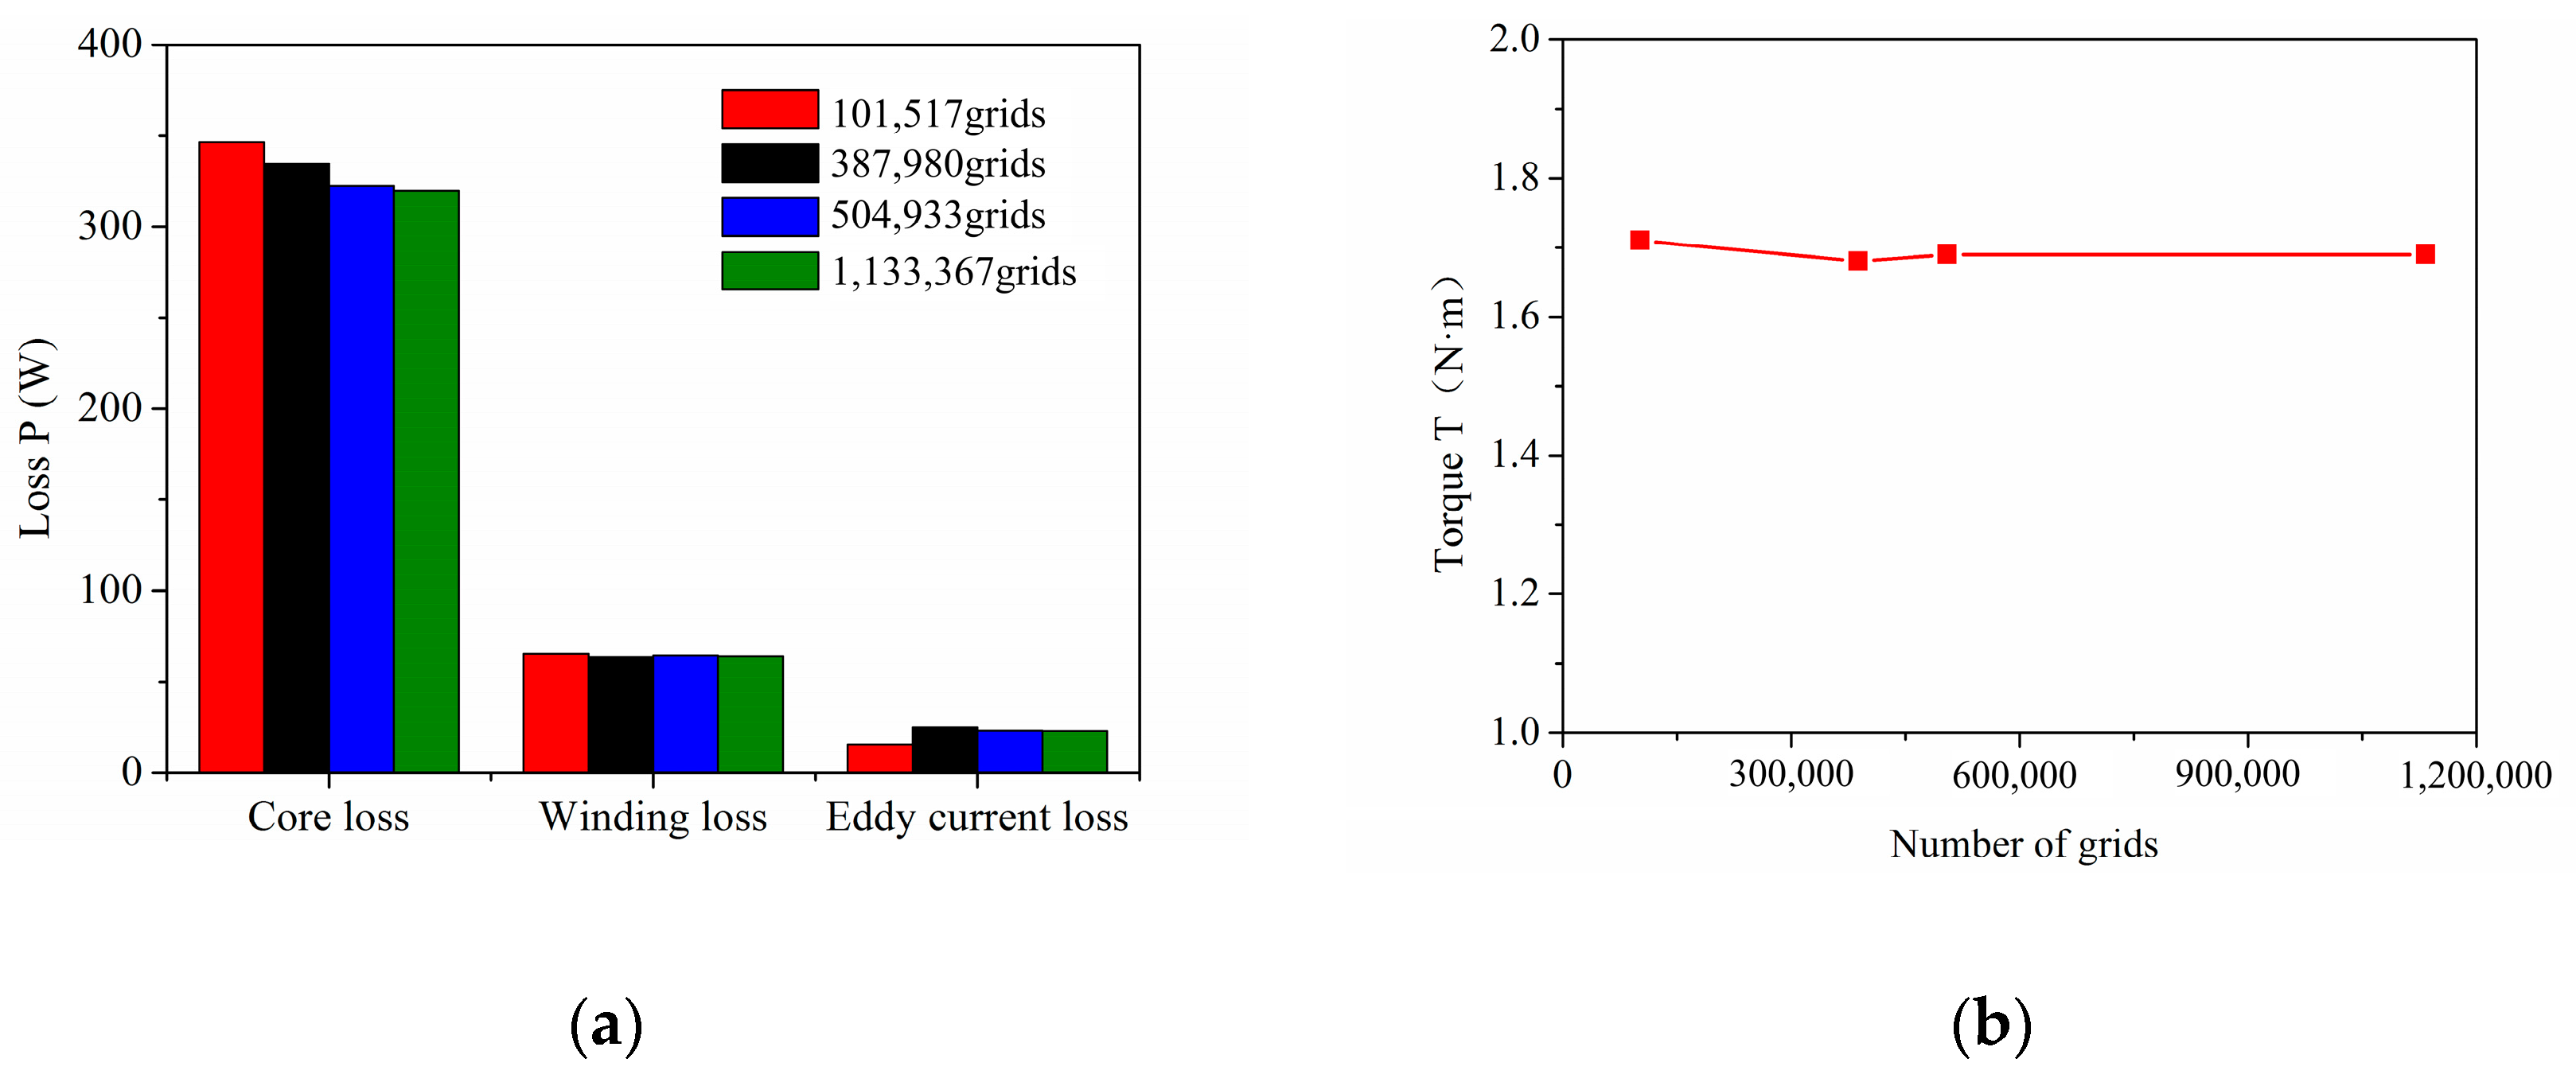
Figure 11.
Magnetic induction distribution at 80,000 rpm. (a) Nephogram of magnetic induction. (b) Loss curve.
Figure 11.
Magnetic induction distribution at 80,000 rpm. (a) Nephogram of magnetic induction. (b) Loss curve.
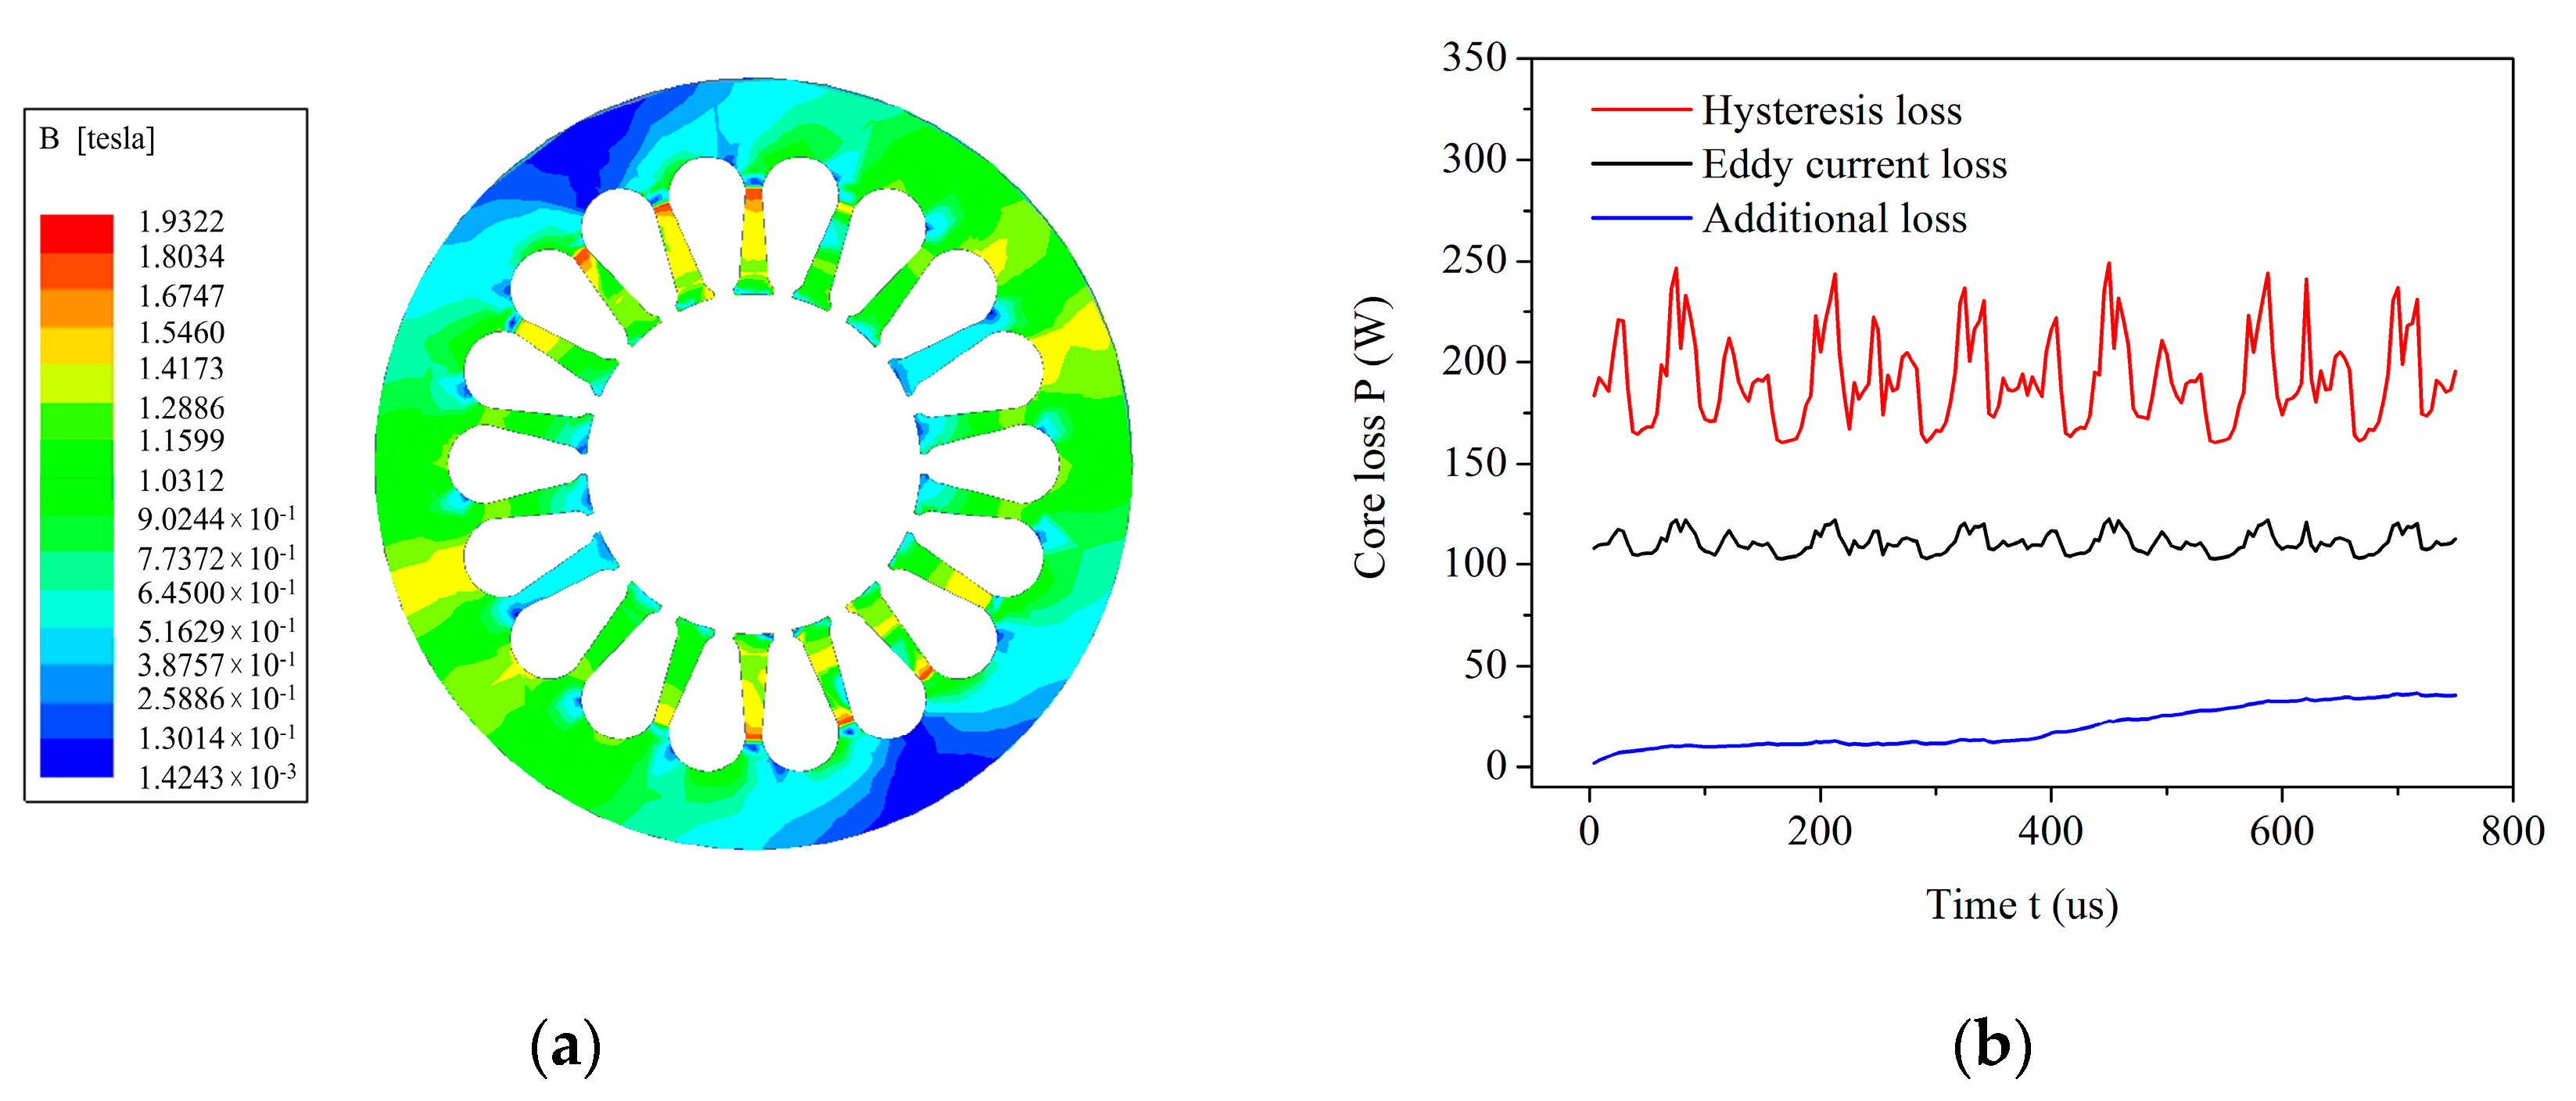
Figure 12.
Overall loss distribution of motor at 80,000 rpm.
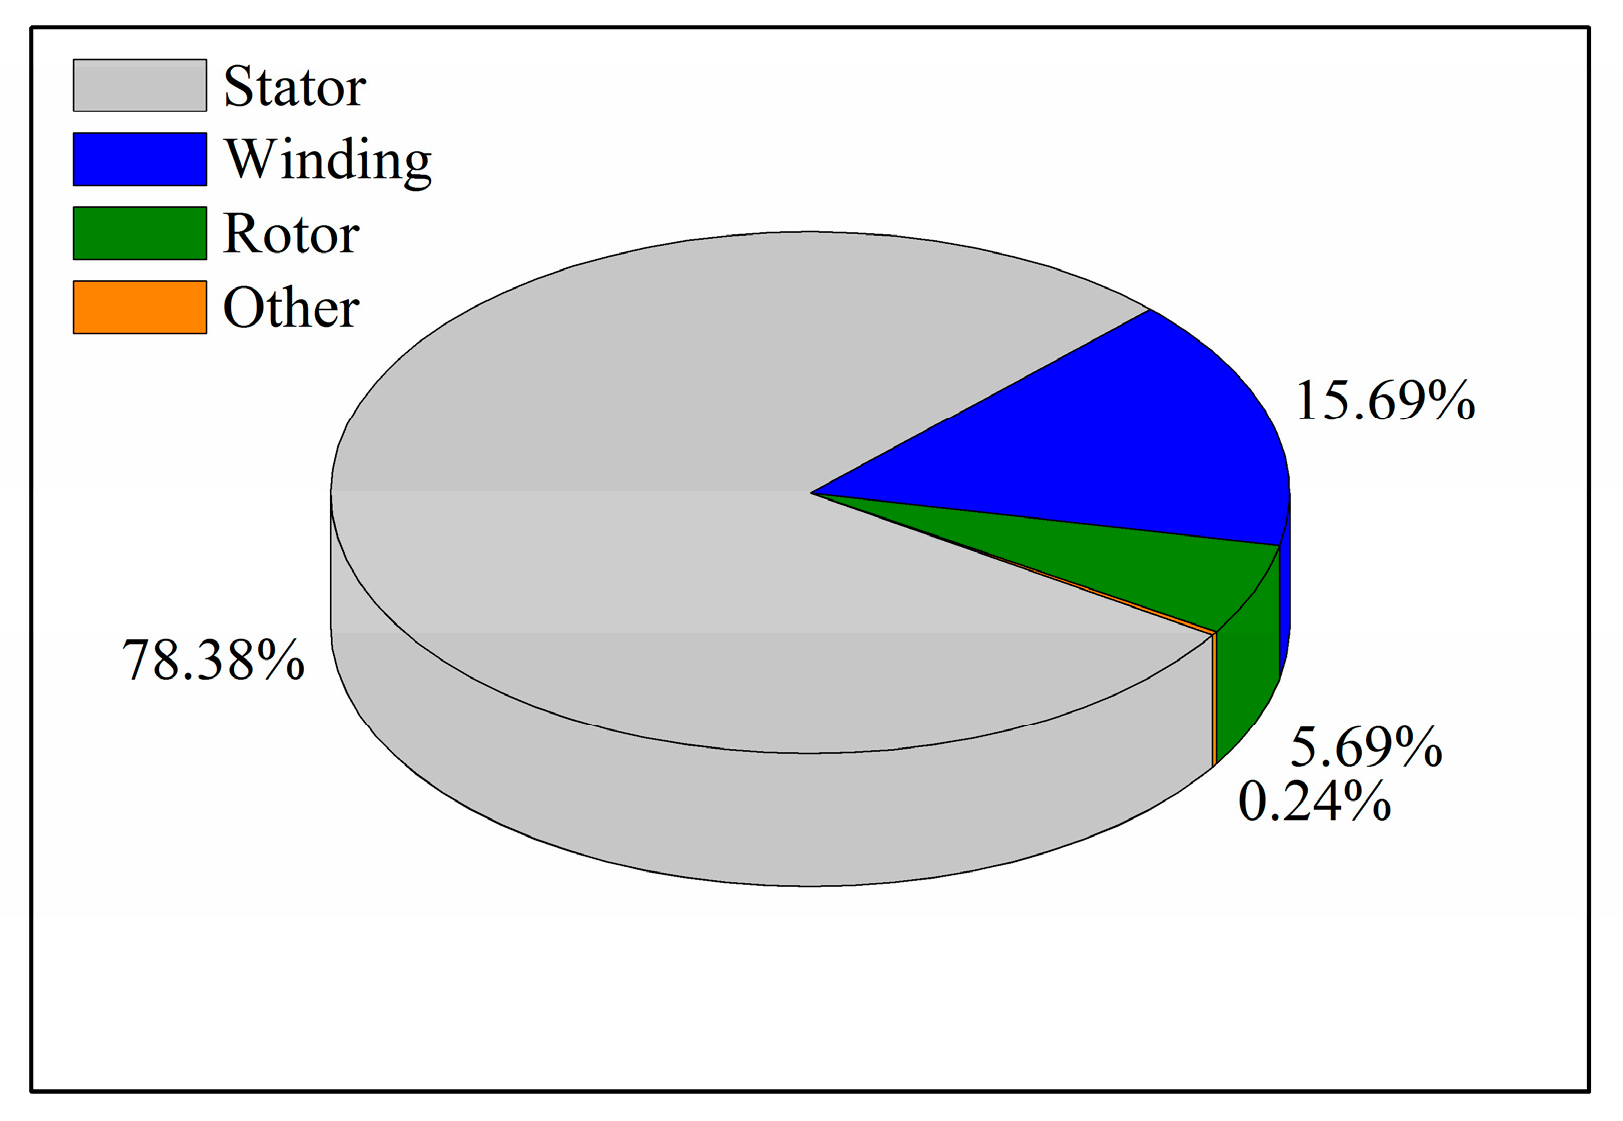
Figure 13.
Motor simulation results under different revolutions. (a) Relationship between electromagnetic loss and Revolution. (b) Relationship between torque and Revolution.
Figure 13.
Motor simulation results under different revolutions. (a) Relationship between electromagnetic loss and Revolution. (b) Relationship between torque and Revolution.

Table 1.
Calculation parameters.
| Physical Quantity | Numerical Value |
|---|---|
| Outer diameter of spindle r (mm) | 20 |
| Inner diameter of spindle r1 (mm) | 12.5 |
| Outer diameter of thrust bearing r2 (mm) | 29 |
| Air gap of spindle δ (mm) | 3 |
| Air gap of air bearing δ1 (mm) | 0.03 |
| Length of spindle outer diameter l (mm) | 119 |
| Length of spindle inner diameter l1 (mm) | 15 |
| Radial length of bearing lr (mm) | 25 |
| Thickness of thrust disc lt (mm) | 5 |
| Density of air ρ (kg/m3) | 1.205 |
| Dynamic viscosity of air μ (kg/(m·s)) | 18.1 × 10⁻⁶ |
Table 2.
Main geometric parameters of motor.
| Parameter | Numerical Value |
|---|---|
| Number of grooves | 18 |
| Number of poles | 2 |
| Outer radius of stator | 50 mm |
| Radius of rotor core | 16 mm |
| Length of stator and rotor core | 58 mm |
Table 3.
Calculation results of iron loss coefficient of silicon steel sheet B27AV1400.
| Loss Coefficient | Numerical Value |
|---|---|
| kh | 80.85 |
| kc | 0.24 |
| ke | 6.47 |
Table 4.
Test results of air compressor motor.
| Revolutions/rpm | p1/kW | T/N·m | η/% |
|---|---|---|---|
| 50,000 | 3.20 | 0.61 | 93.11 |
| 60,000 | 5.58 | 0.88 | 94.38 |
| 70,000 | 8.69 | 1.19 | 95.12 |
| 80,000 | 13.00 | 1.55 | 95.62 |
Table 5.
Simulation results of electromagnetic losses of motor components at 80,000 rpm.
| Components | Loss | Numerical Value/W |
|---|---|---|
| Basic loss | Iron loss of stator | 322.6 |
| Copper loss of winding | 64.6 | |
| Eddy current loss of rotor | 23.4 | |
| Eddy current loss of other alloys | Bearing | 9.4 × 10⁻⁶ |
| Rotating shaft Diffuser Cooling waterways Shell | 6 × 10⁻³ 8.3 × 10⁻⁴ 6.6 × 10⁻³ 0.33 | |
| Sum | 410.93 |
Disclaimer/Publisher’s Note: The statements, opinions and data contained in all publications are solely those of the individual author(s) and contributor(s) and not of MDPI and/or the editor(s). MDPI and/or the editor(s) disclaim responsibility for any injury to people or property resulting from any ideas, methods, instructions or products referred to in the content. |
© 2023 by the authors. Licensee MDPI, Basel, Switzerland. This article is an open access article distributed under the terms and conditions of the Creative Commons Attribution (CC BY) license (https://creativecommons.org/licenses/by/4.0/).
Share and Cite
MDPI and ACS Style
Yu, B.; Wang, F.; Liu, H.; Zhang, Z.; Chen, Y. Research on Motor Rotor Loss of High-Speed Air Compressor in the Application of Hydrogen Fuel Cell Vehicle. Processes 2023, 11, 475. https://doi.org/10.3390/pr11020475
AMA Style
Yu B, Wang F, Liu H, Zhang Z, Chen Y. Research on Motor Rotor Loss of High-Speed Air Compressor in the Application of Hydrogen Fuel Cell Vehicle. Processes. 2023; 11(2):475. https://doi.org/10.3390/pr11020475
Chicago/Turabian StyleYu, Bo, Fei Wang, Hua Liu, Zhiping Zhang, and Yuhui Chen. 2023. "Research on Motor Rotor Loss of High-Speed Air Compressor in the Application of Hydrogen Fuel Cell Vehicle" Processes 11, no. 2: 475. https://doi.org/10.3390/pr11020475
Note that from the first issue of 2016, this journal uses article numbers instead of page numbers. See further details here.