Article

Thermal Treatment and High-Intensity Ultrasound Processing to Evaluate the Chemical Profile and Antioxidant Activity of Amazon Fig Juices

by
Josias M. dos A. Cruz
1,
Andrezza S. Ramos
1,
Renilto F. Corrêa
2,
Edgar A. Sanches
3,
Pedro H. Campelo
4,
Valdely F. Kinupp
5 and
Jaqueline de A. Bezerra
1,*
1
Analytical Center of the Federal Institute of Education, Science and Technology of Amazonas (IFAM), Campus Manaus Centro, Manaus 69020-120, AM, Brazil
2
Translational Surgery and Animal Experimentation Central Bioterium Laboratory, State University of Amazonas (UEA), Manaus 69050-010, AM, Brazil
3
Laboratory of Nanostructured Polymers (NANOPOL), Federal University of Amazonas (UFAM), Manaus 69067-005, AM, Brazil
4
Department of Food Technology, Federal University of Viçosa (UFV), Viçosa 36570-900, MG, Brazil
5
Institute of Education, Science and Technology of Amazonas, Campus Manaus Zona Leste, Manaus 69083-000, AM, Brazil
*
Author to whom correspondence should be addressed.
Processes 2023, 11(2), 408; https://doi.org/10.3390/pr11020408
Submission received: 1 January 2023 / Revised: 17 January 2023 / Accepted: 28 January 2023 / Published: 30 January 2023

Abstract

:
The present paper evaluated the influence of heat treatment (HT) and high-intensity ultrasound (HIUS) on the chemical profile of the Amazon fig (Ficus subapiculata, Moraceae) juices. Antioxidant activity, quantification of carotenoids, total phenolic compounds (TPC), pH, titratable acidity, soluble solids, color and chemical profile (NMR) were evaluated. Treatments did not change the pH (3.4–3.5), titratable acidity (0.044–0.048%) and soluble solids (2.3–2.4 °Brix). The highest antioxidant activity (DPPH, ABTS) and TPC were presented by the HT-treated juice, which was equivalent to 1235 ± 11 µM TE, 1440 ± 13 µM TE and 312 ± 5 mg GAE mL−1, respectively. The treatments influenced the color luminosity according to the L* and a* parameters, while the b* parameter showed no significant change. The L* parameter was elevated in all treated samples compared to the control sample. Analyzing the parameter a* f, it was verified that the sample with thermal treatment (HT) was different from the control sample, but presented similarity with the samples of the HIUS processes. The 1H NMR spectra of the juices showed similar chemical profiles in all treatments. The compounds α-glucose, β-glucose, fructose, citric, malic, quinic, and p-hydroxybenzoic acids were identified. The HT treatment presented higher efficiency to extract the antioxidant compounds from fig juices. The HIUS treatments with constant energy density also improved the tolerance of the antioxidant compounds, especially in conditions of higher potency and reduced time. Future studies will be devoted to carry out microbiological analysis and evaluate the stability of treated juices.

1. Introduction

A growing demand for foods containing beneficial properties to human health has been observed. In this context, alternative foods such as Unconventional Food Plants (UFP) stand out, which are plant species not commonly consumed, but also consumed as food in some regions. About 3000 species of UFP are estimated in Brazil, showing a significant potential to be investigated in terms of their chemical and nutritional composition [1].
Several Amazonian fruits considered as UFP present significant potential as non-alcoholic beverages, as reported previously on the study of “buxixu” juices (Clidemia hirta (L.) D. Don and Clidemia japurensis DC.) and “vinagreira” tea (Hibiscus acetosella Welw. ex Hiern), which were evaluated according to the stability of the encapsulated bioactive compounds and antioxidant capacity [2,3].
A variety of species from the Moraceae family, such as the Amazonian minifig (Ficus subapiculata Miq. Miq.), are considered as UFP [1]. Species from the Ficus genus present fruits known as figs, whose chemical composition is formed by terpenoids, organic acids, coumarins and flavonoids. The presence of phenolic compounds in this genus contributes to improve its antioxidant properties [4].
The rich chemistry of the species from the Ficus genus has been encouraging studies on the development of products from its fruits. Ficus subapiculata (Miq.) Miq., for example, produces fruits known as “minifigo-amazônico” and “minifigo-da-campirana”. Their organoleptic properties allows their consumption in natura, as well as the preparation of juices and jellies [1]. However, its chemical composition and nutraceutical potential are still unknown. The preparation of juice is an alternative to facilitate the consumption of fruit species such as UFP. In the food industry, there are already modern alternatives to enhance the extraction of bioactive substances, such as the use of high-power ultrasound [5]. The ultrasound technology can be used to modify the structure of beverages made from vegetables, increasing the bioaccessibility of nutrients and bioactive compounds [6]. The use of heat treatment in food products is other common method in the food industry processes, mainly for microorganism inactivation. However, high temperatures can degrade compounds of interest. In this context, the ultrasound technology represents an economically viable alternative to the decontamination of microorganisms, as well as to extract bioactive compounds from food products [7,8,9], besides being a green, economically viable technology [5]. For this reason, the present work aimed to compare the results obtained between extraction assisted by high intensity ultrasound (HIUS) and extraction using a conventional technique by heat treatment (HT) in relation to the data of variation in the chemical composition and physical-physical parameters. chemicals, as well as the results of the antioxidant potential of the Amazonian minifig juice samples.

2. Materials and Methods

2.1. Fruits Collecting and Juices Preparation

Fruits were previously identified and collected at the Sítio PANC, Manaus, AM, Brazil, in April 2020 (SisGen N° A92360E) and frozen until the juice preparation. Fruits were transported to the IFAM-CMC Analytical Center, where they were washed in running water. Ripe and preserved fruits were selected and refrigerated until further analysis. Juices were prepared from the mixture of the fruits with potable water [1:3 (fruit:water w/w)] and submitted to the Heat Treatment and Ultrasound Processing.

2.2. Heat Treatment and Ultrasound Processing

Juices were submitted to the HT and HIUS treatments according to the parameters presented in Table 1. Considering the HT treatment, 50 mL of juice was submitted to a water bath for 10 min on a heating bath (SSD-10L, SolidSteel) (Piracicaba, Brazil). For the HIUS treatment, 50 mL of juice was homogenized on a VibraCell VCX 750 (Sonics & Materials, Inc., Newtown, CT, USA) equipment using a 25 mm diameter probe, 20 kHz and 750 W [10]. For the ultrasonic treatment, the applied power and time were linearly altered (Table 1), so that the energy density (ED) was kept constant at 2.9 kJ·cm−3, which can be calculated according to Equation (1), where NAP is the nominal applied power (W), t is time (s) and V is sample volume (cm−3).
E D   ( J · c m 3 ) = N A P × t V

2.3. Soluble Solids, pH, and Titratable Acidity

The soluble solids content (expressed in °Brix) was determined on a digital refractometer (HI 96801, Hanna Instruments, Barueri, SP, Brazil) at room temperature using 5 drops of juices. The pH values were determined on a digital device (AK90, Asko, São Leopoldo, RS, Brazil) previously calibrated and operated according to the manufacturer’s guidelines. Tritable acidity was determined by titration with NaOH (0.1 M) under constant stirring and expressed as % citric acid per 100 mL of juice [11].

2.4. Color Parameters

Color analysis was performed by reading the L* (luminosity), a* (red-green) and b* (yellow-blue) coordinates on a DeltaVista (DeltaColor) spectrophotometer (São Leopoldo, Brazil) using the CIELAB scale [12]. To determine the total color difference (ΔE*), the mean values of luminosity (L*) and chromaticity coordinates a* and b* were used (Equation (2)), where the subscript “0” refers to the color reading of the control juice. The larger the value of ΔE*, the larger the color change in relation to the control sample [13].
Δ E = ( L * L 0 * ) 2 + ( a * a 0 * ) 2 + ( b * b 0 * ) 2

2.5. Antioxidant Capacity (DPPH and ABTS·+)

The treated juices were evaluated according to their scavenging capacity based on the DPPH· and ABTS·+ radicals on an Epoch 2 microplate reader (BioTek, Winooski, VT, USA). In both tests, a Trolox calibration curve was plotted at concentrations of 100, 500, 1000, 1500 and 2000 μM. Results were expressed in micromolar of Trolox equivalents (μM TE).
For the DPPH· assay, 10 µL of juice was added to 390 µL of DPPH solution (100 µM) and incubated in the dark for 30 min. The absorbance reading at 515 nm [14]. The Trolox standard curve for this assay was y = −0.0004x + 0.9376 (R2 = 0.9986).
For the ABTS·+ assay, the juices were added to the radical solution (Abs of 0.700) in a 1:100 ratio and incubated in the dark for 6 min. The absorbance reading at 734 nm [15]. The Trolox standard curve for this assay was y = −0.0003x + 0.6857 (R2 = 0.9994).

2.6. Total Phenolic Content (TPC)

The methodology described in literature was used for the quantification of total phenolic compounds (TPC) [16]. A volume of 20 µL of juice was added to the reaction mixture (1:1) of the Folin Ciocalteu reagent and sodium bicarbonate (6 %) and maintained in the dark for 90 min for analysis on an Epoch 2 microplate reader (BioTek, Winooski, VT, USA) at 725 nm. A standard curve of gallic acid (62.5 to 1000 µg·mL−1) was obtained [y = −0.003x + 0.0263 (R2 = 0.9992)]. Results were expressed in milligrams of gallic acid equivalents per gram of sample (mg GAE g−1).

2.7. Carotenoids Content

The quantification of carotenoids consisted of a mixture of juice, water, and hexane in the proportion of 1:5:6 (v/v/v). The mixture was vortexed for 1 min and then centrifuged for 1 min. The supernatant was analyzed on a Epoch 2 microplate reader (BioTek, Winooski, VT, USA) at 450 nm. Hexane and β-carotene were used as control [17].

2.8. Chemical Profile

The chemical profiles of the juices were obtained by NMR and HPLC-DAD. Solutions of 500 µL of each juice with 50 µL TMSP-d4 at 0.6 mM were analyzed on a Bruker® Avance IIIHD Nuclear Magnetic Resonance Spectrometer (NMR) (New York, NY, USA) (11.74 T, BBFO Plus SmartProbe™). The software TopSpin 4.0.8 was used for data processing [18].
Qualitative and quantitative analyzes were performed by HPLC-DAD using a Shimadzu Prominence LC-20AVP system (Shimadzu Corporation Co., Ltd., Kyoto, Japan) equipped with a C-18 column (250 × 4.6 mm) and a photodiode model SPDM20AVP (PAD). The mobile phase was composed of solvent A (ultrapure water) and solvent B (methanol). The flow rate was 1.0 mL/min, the column temperature was 30 °C, and the sample injection volume was 10 μL [19].

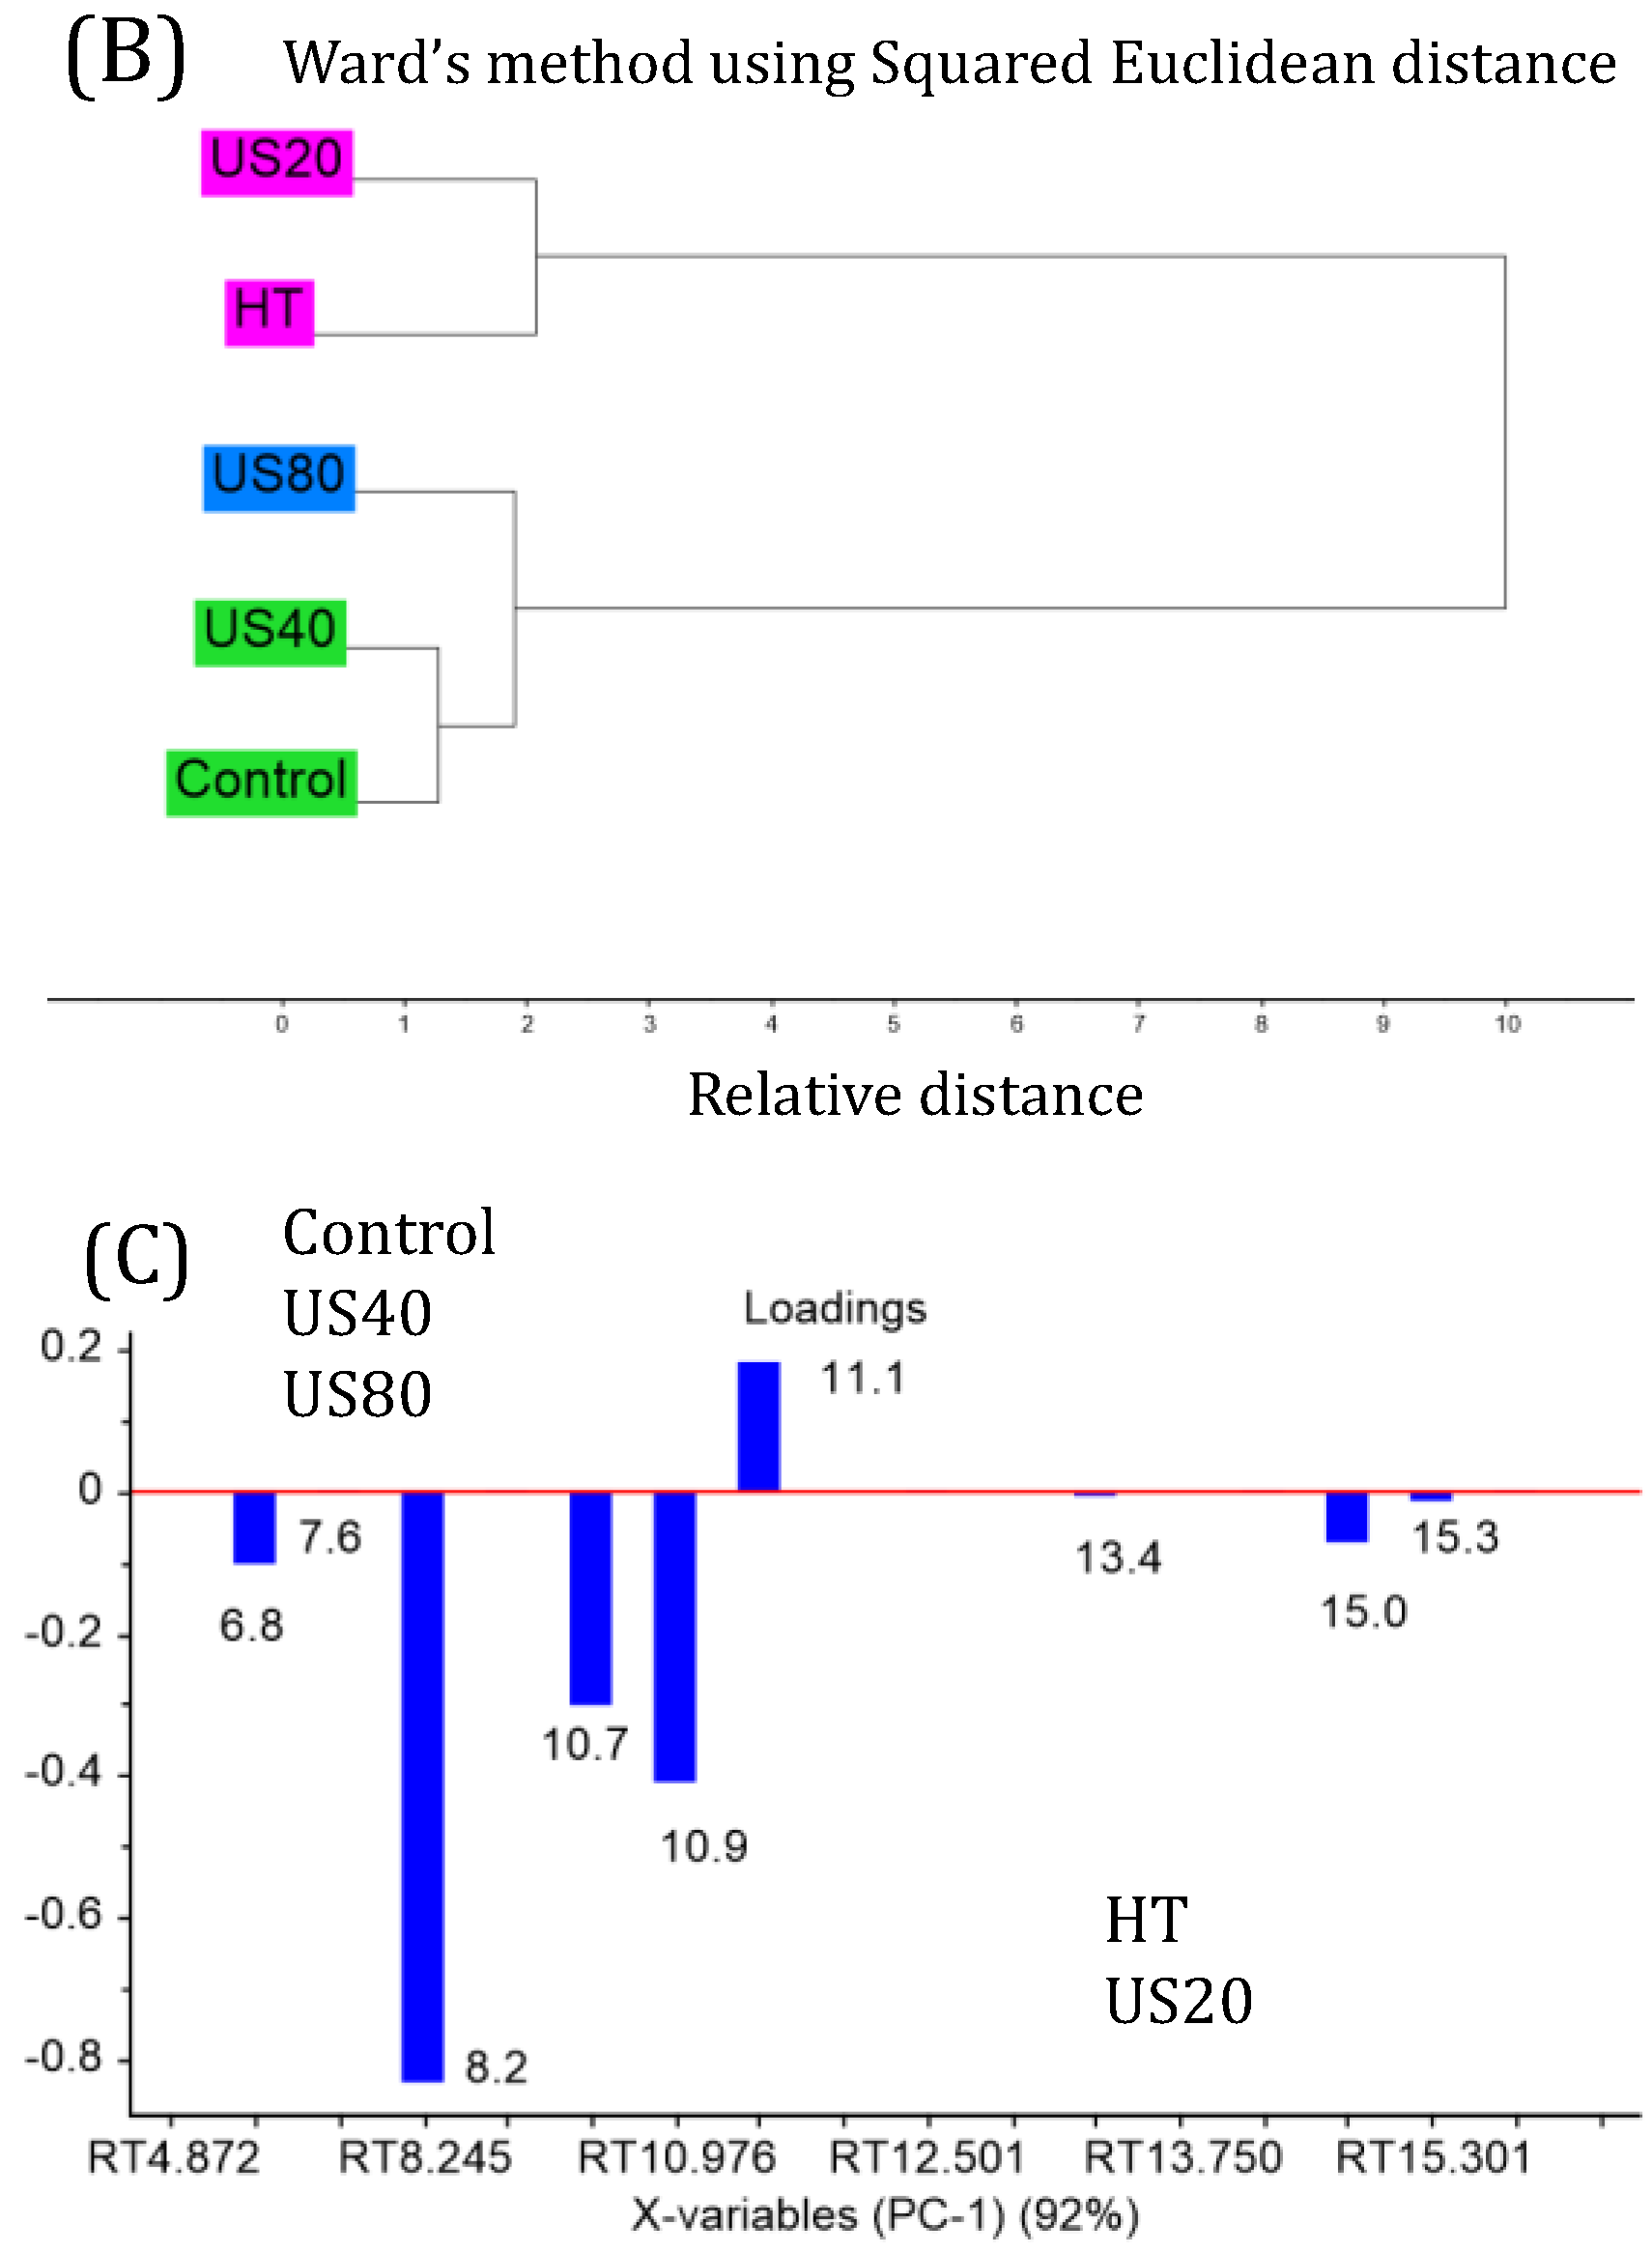
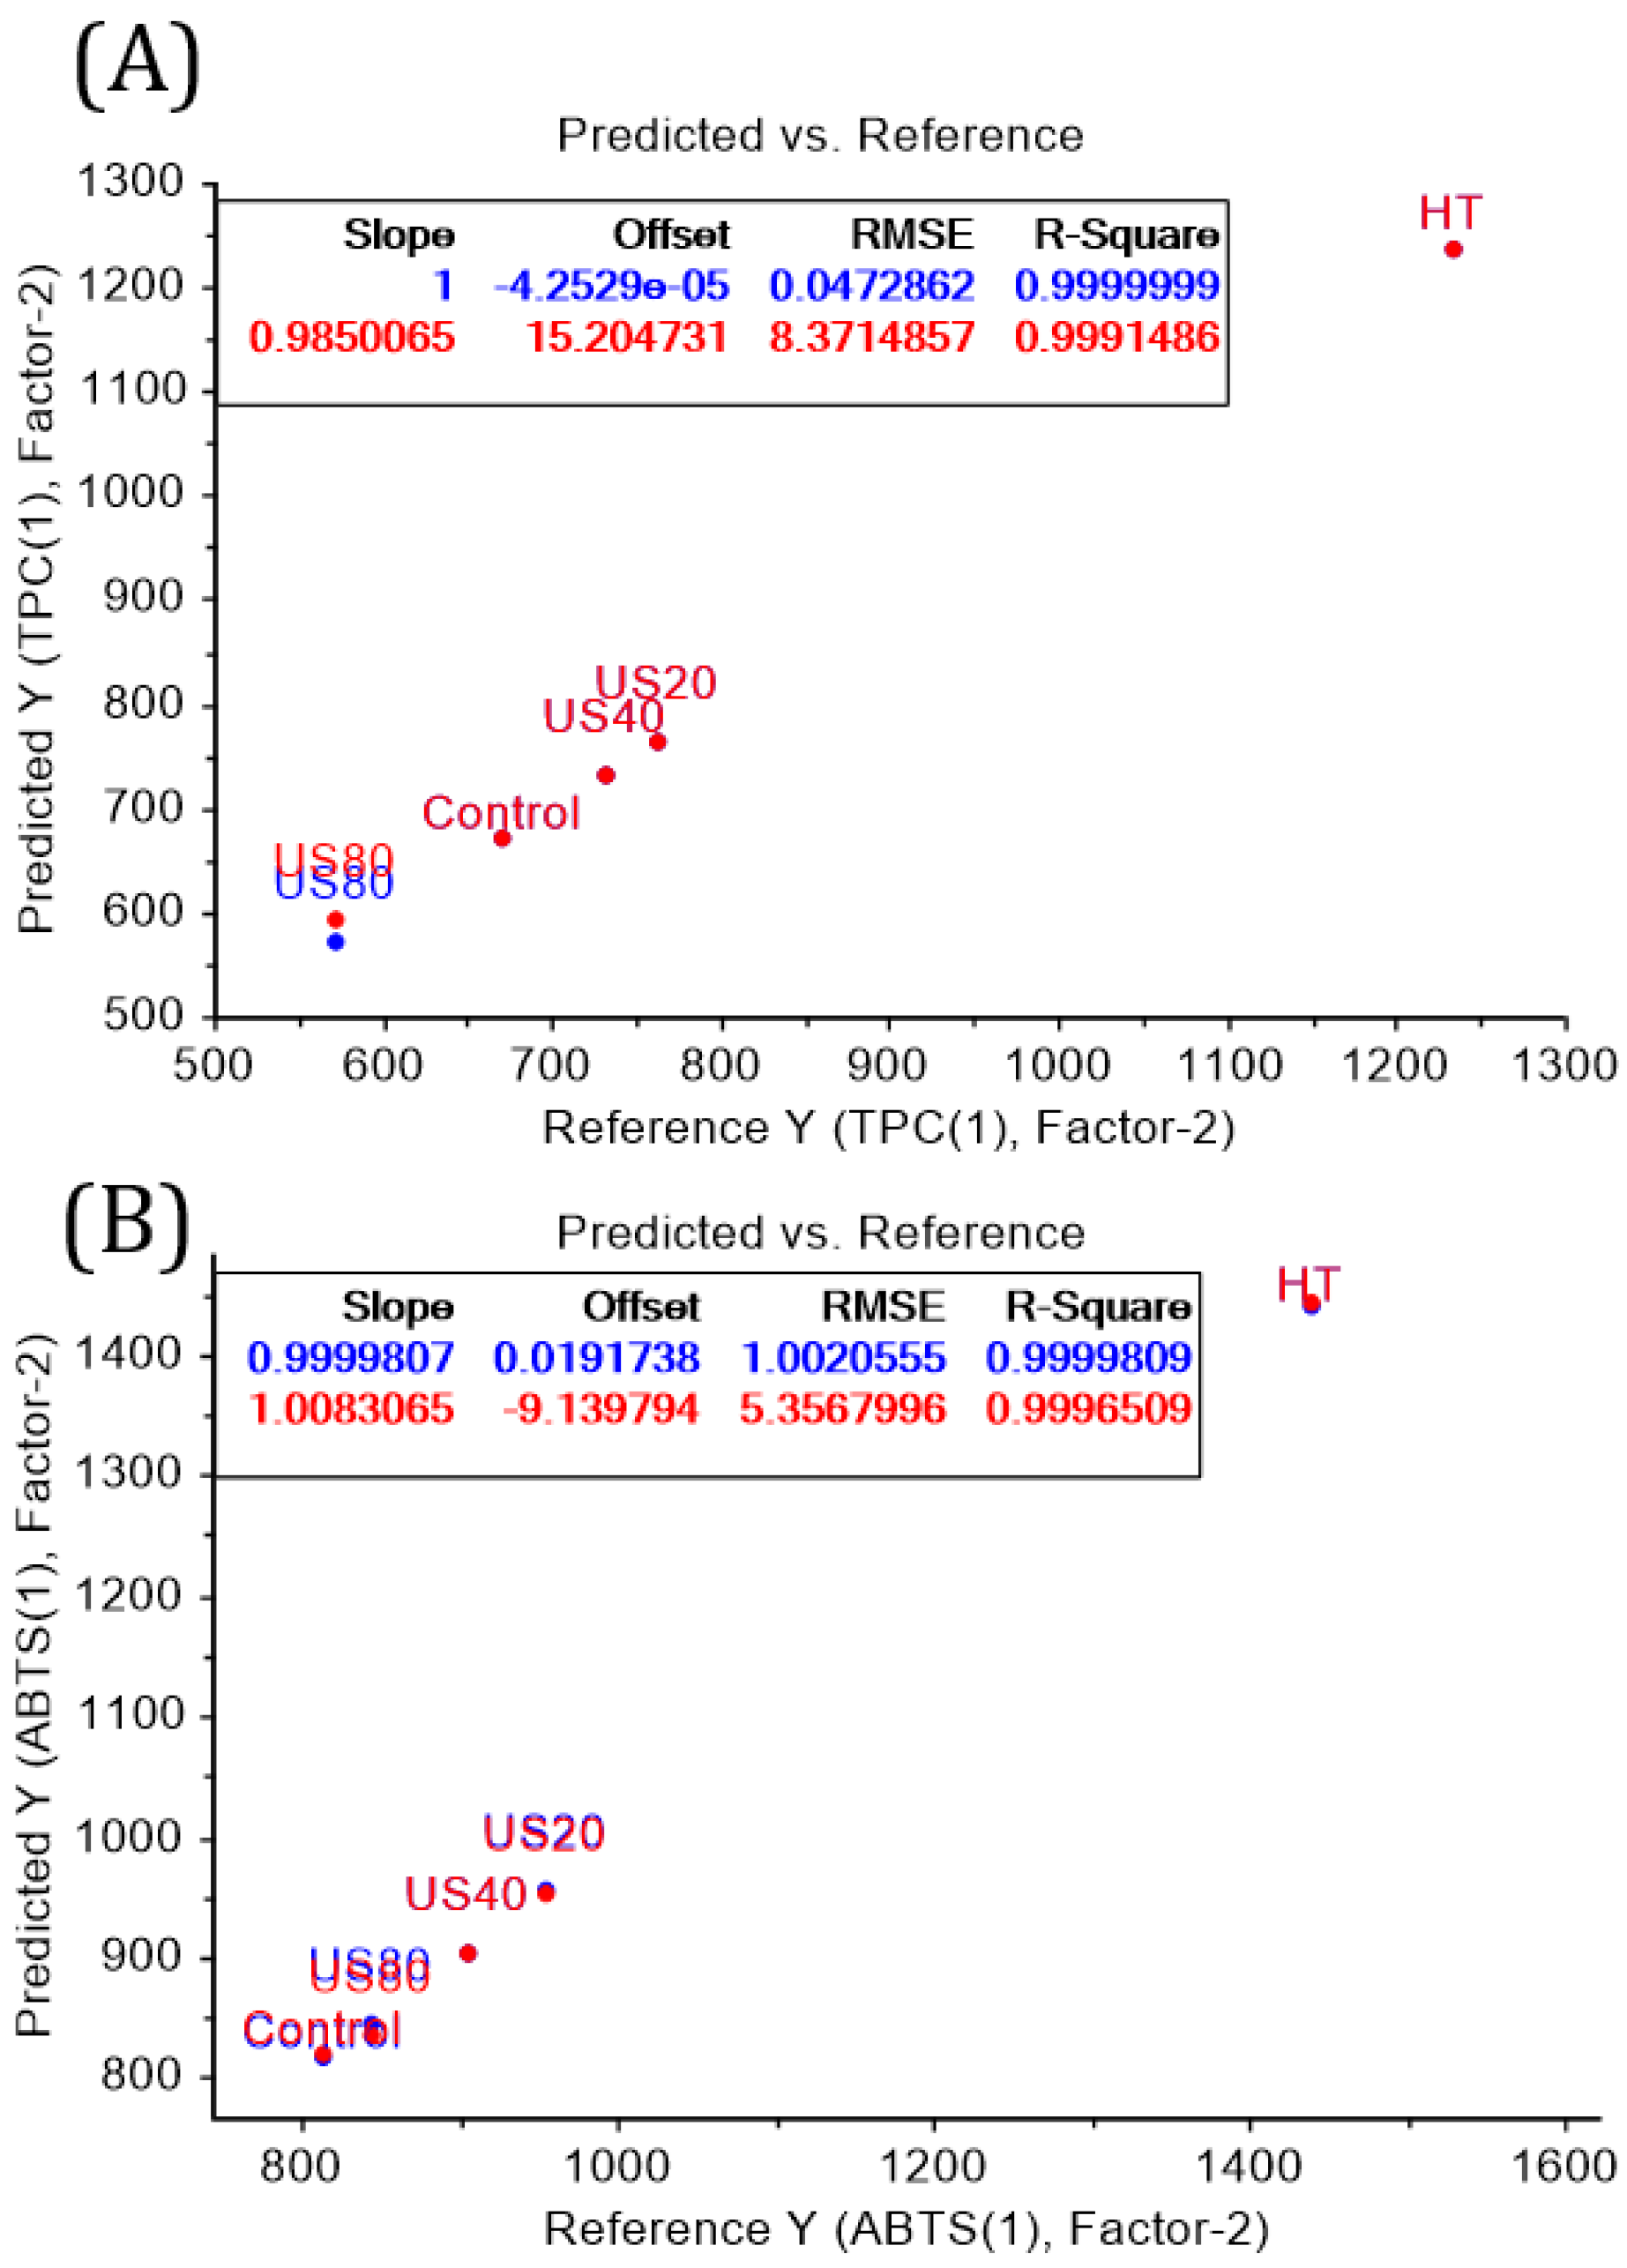
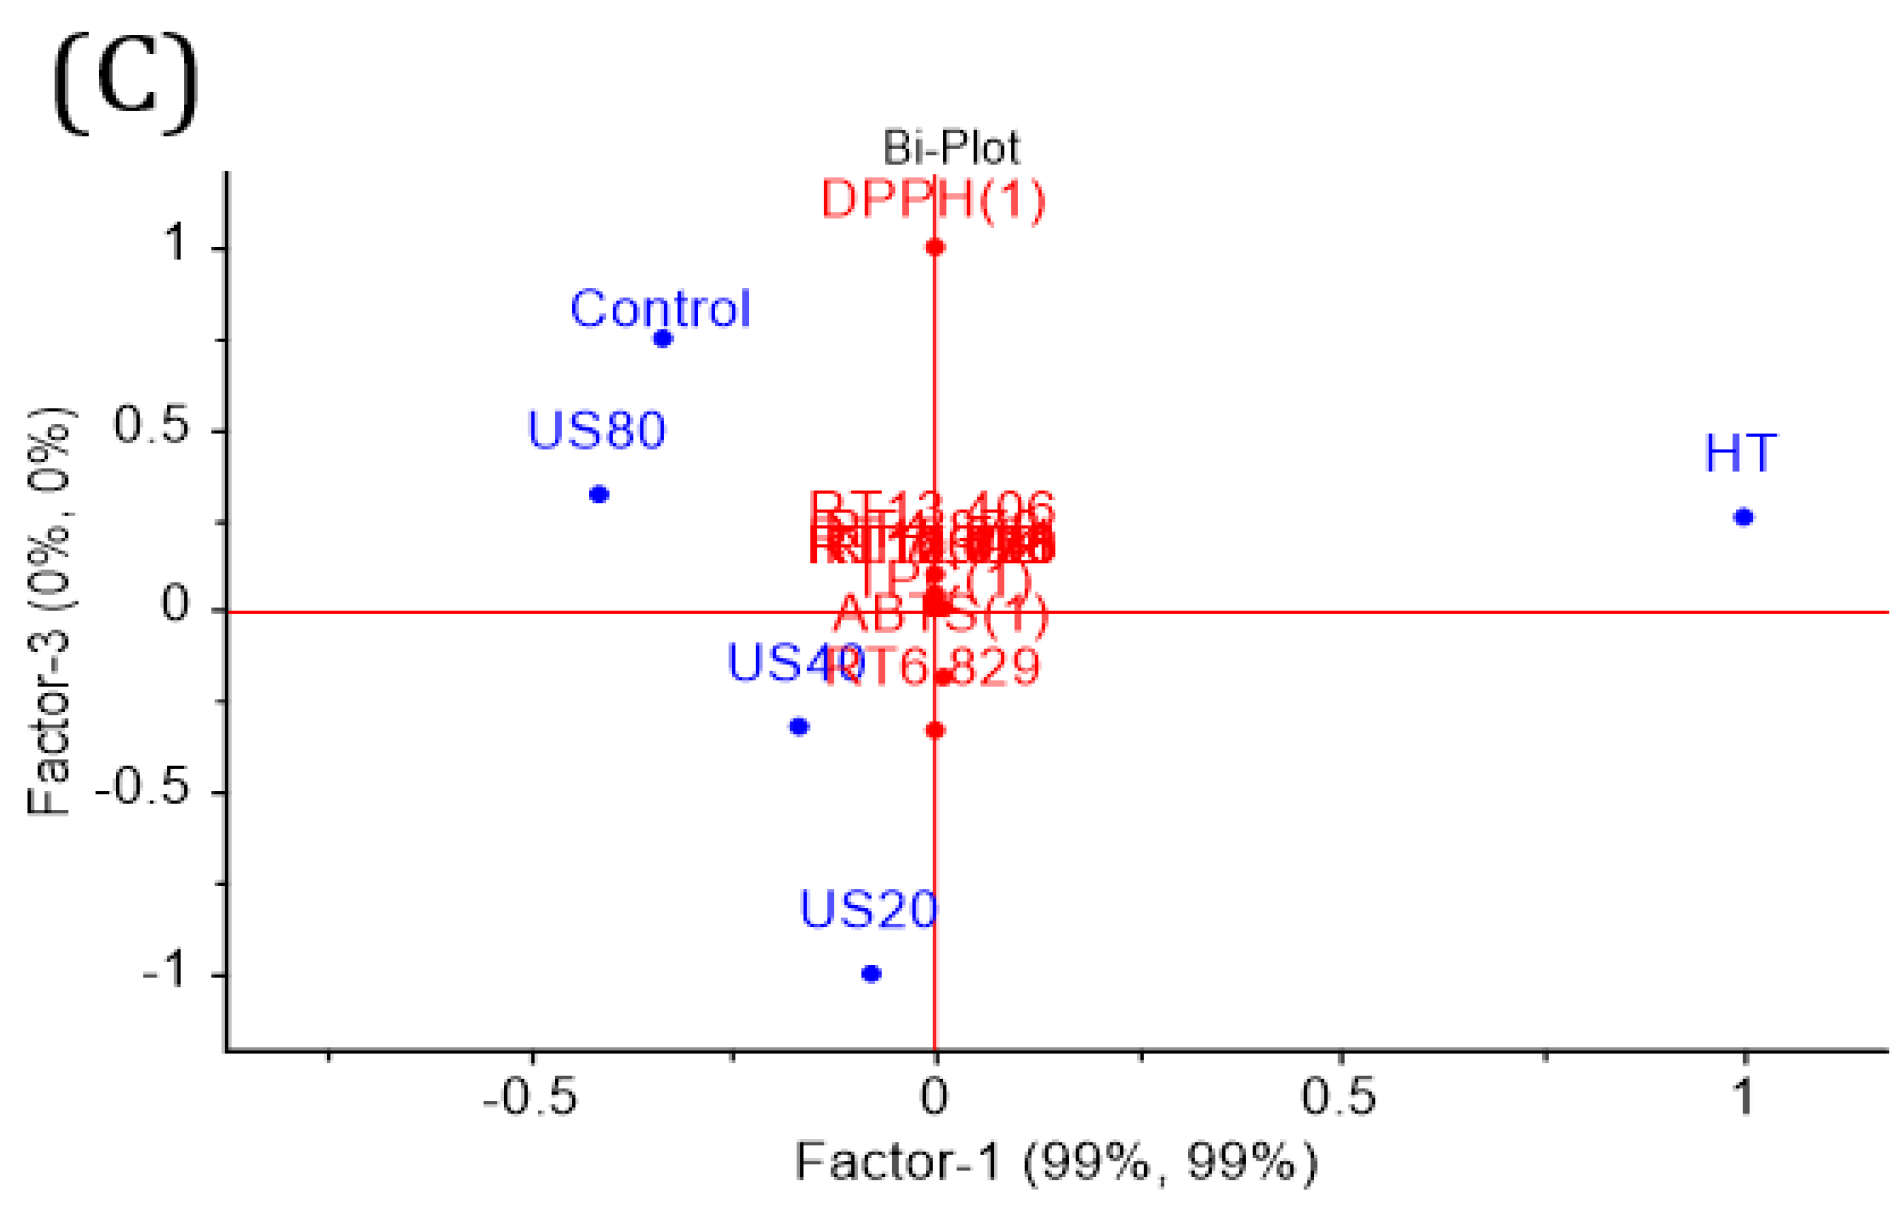
2.9. Principal Components Analysis (PCA) and Partial Least Squares-Discriminant Analysis (PLS-DA)

PCA was performed to evaluate the influences of the HT and HIUS treatment on the extraction process and on the physicochemical properties, bioactive compounds, and antioxidant activity of Amazon fig juice samples [18]. Moreover, PCA and PLS-DA were used to verify insights into the separations among the juice in the different treatments and polyphenols extracted that may indicate differences among the samples sets and to verify which chemical composition influences more significantly. Hierarchical cluster analysis (HCA) was performed using the polyphenols identified in each treatment and was generated through Ward’s algorithm and Euclidean distance analysis, with the aim of identifying clustering patterns that help in choosing the best method to intensify the extraction of polyphenols.. The data process was performed with the software The Unscrumbler, version 10.5.1 (CAMO SA, Oslo, Norway).

2.10. Statistical Analysis

Quantitative data were presented as means ± SD of at least triplicate experiments. Analysis of variance (ANOVA one-way) was performed on the data obtained using Microsoft Excel, version 2019 (Microsoft, Seatle, WA, USA) software. The significant statistical level was set to p-value < 0.05 (two-tailed F and t tests).

3. Results and Discussion

3.1. Physicochemical Characterization

The parameters pH, titratable acidity (TA) and soluble solids (SS) presented no significant difference in all treatments when compared to the control sample (Table 2). Sonication also maintained these characteristics unaltered in noni fruits (Morinda citrifolia L.), where lower values of soluble solids (1.3 °Brix), pH of 3.9 and titratable acidity of 0.17% were identified [20]. For the minifig juices, the pH values were marginally lower than that of the apple juices (approximately 4.00), while the titratable acidity was found around 0.20%. In addition, the minifig juices presented low levels of soluble solids (approximately 2.40 °Brix) when compared to the apple juices (approximately 12 °Brix) [9]. The juices showed higher acidity when compared to F. carica fruits (pH = 3.9 to 5.1) and lower °Brix (5.9 to 11.5) [21,22].
However, the treatments influenced the color parameters L* (lightness/darkness) and a* (redness/greenness) (Table 2), while the parameters b* (yellowness/blueness), C* (chroma) and h* (hue) showed no statistically significant change, that is, the treatments under the evaluated conditions preserved these characteristics. The L* parameter was increased in all treatments when compared to the control sample, indicating that the treated juices became clearer. Only HT presented the a* parameter statistically different from the control sample, showing a reduction in this parameter from 10.7 to 9.4, indicating a small loss of the red color. The altered parameters were enough to generate differences in total color (ΔE) between the heat treatment (ΔE = 2.6) and ultrasonic treatments; however, the ultrasonic treatments caused the greatest change (ΔE = 4.0 to 4.9). However, among them there was no significant difference. The effect of the HIUS treatment also caused color change in the melon juices [23] and kiwi [24], which may be related to the oxidation reaction (depending on the treatment time) and/or variation in the concentration of compounds due to sonication.

3.2. Antioxidant Capacity, Phenolic and Carotenoids Contents

Table 3 presents the results of the antioxidant activity and the content of the phenolic compounds and carotenoids. The HT, US20 and US40 treatments were effective in increasing the antioxidant properties of the juices when compared to the control sample. Although the heat treatments may be related to the loss of nutritional properties due to the application of temperature, the highest antioxidant capacity was presented by the juices treated with HT, followed by the ultrasonic treatments (in the order US20, US40 and US80). Regarding the content of the phenolic compounds, only HT and US20 showed statistically higher values than that of the control. Although US40 had a reduction in half the time of US20, the application of twice the power caused a significant increase in the final temperature of the process, resembling HT, but even so its values for the antioxidant potential were lower.
The application of HIUS acts on the extraction of compounds through the phenomenon of acoustic cavitation that is generated in a liquid medium. The cavitational microbubbles implode and their energy promotes the fragmentation and detexture of the plant structures, making them susceptible to solvent penetration, and thereby extracting target compounds such as phenolics [5]. The applied power can increase or decrease the occurrence of this phenomenon, but the time of treatment must also be considered. The intensity of cavitation can increase the temperature [25] (as observed in this experiment) (Table 1).
Among the three treatments with HIUS, there was a decrease in the antioxidant activity as the extraction time was reduced and the applied power was increased. When the US80 treatment was performed, the highest potency and the shorter time, the antioxidant capacity and the content of phenolic compounds were similar or lower than that of the control. This result indicates that HIUS can improve the antioxidant activity of the minifig juices under specific conditions, but the reduction in sonication time could not be overcome by the increase in power. Differently from these results, in the evaluation of the pulps of Eugenia calycin [25] the authors observed that sonication with high power for a short time was better for the extraction of phenolic compounds; however, these authors used energy densities of 2 kJ/g (100 W) and 5 kJ/g (475 W), which were much higher than those used in the present study, being a possible justification for this difference, as well as the characteristics inherent to the plant matrix.
The assays showed excellent Pearson correlations: ABTS and DPPH (0.982); ABTS and CFT (0.988); DPPH and CFT (0.970). The juices showed similar antioxidant activity and phenolic compounds to those of the aqueous infusion of the fruits of F. palmata, hydroalcoholic extract of the fruits of F. carica and methanolic extract of the fruits of F. deltoidea [22,26,27]. Carotenoid content was not detected in the evaluated juices.

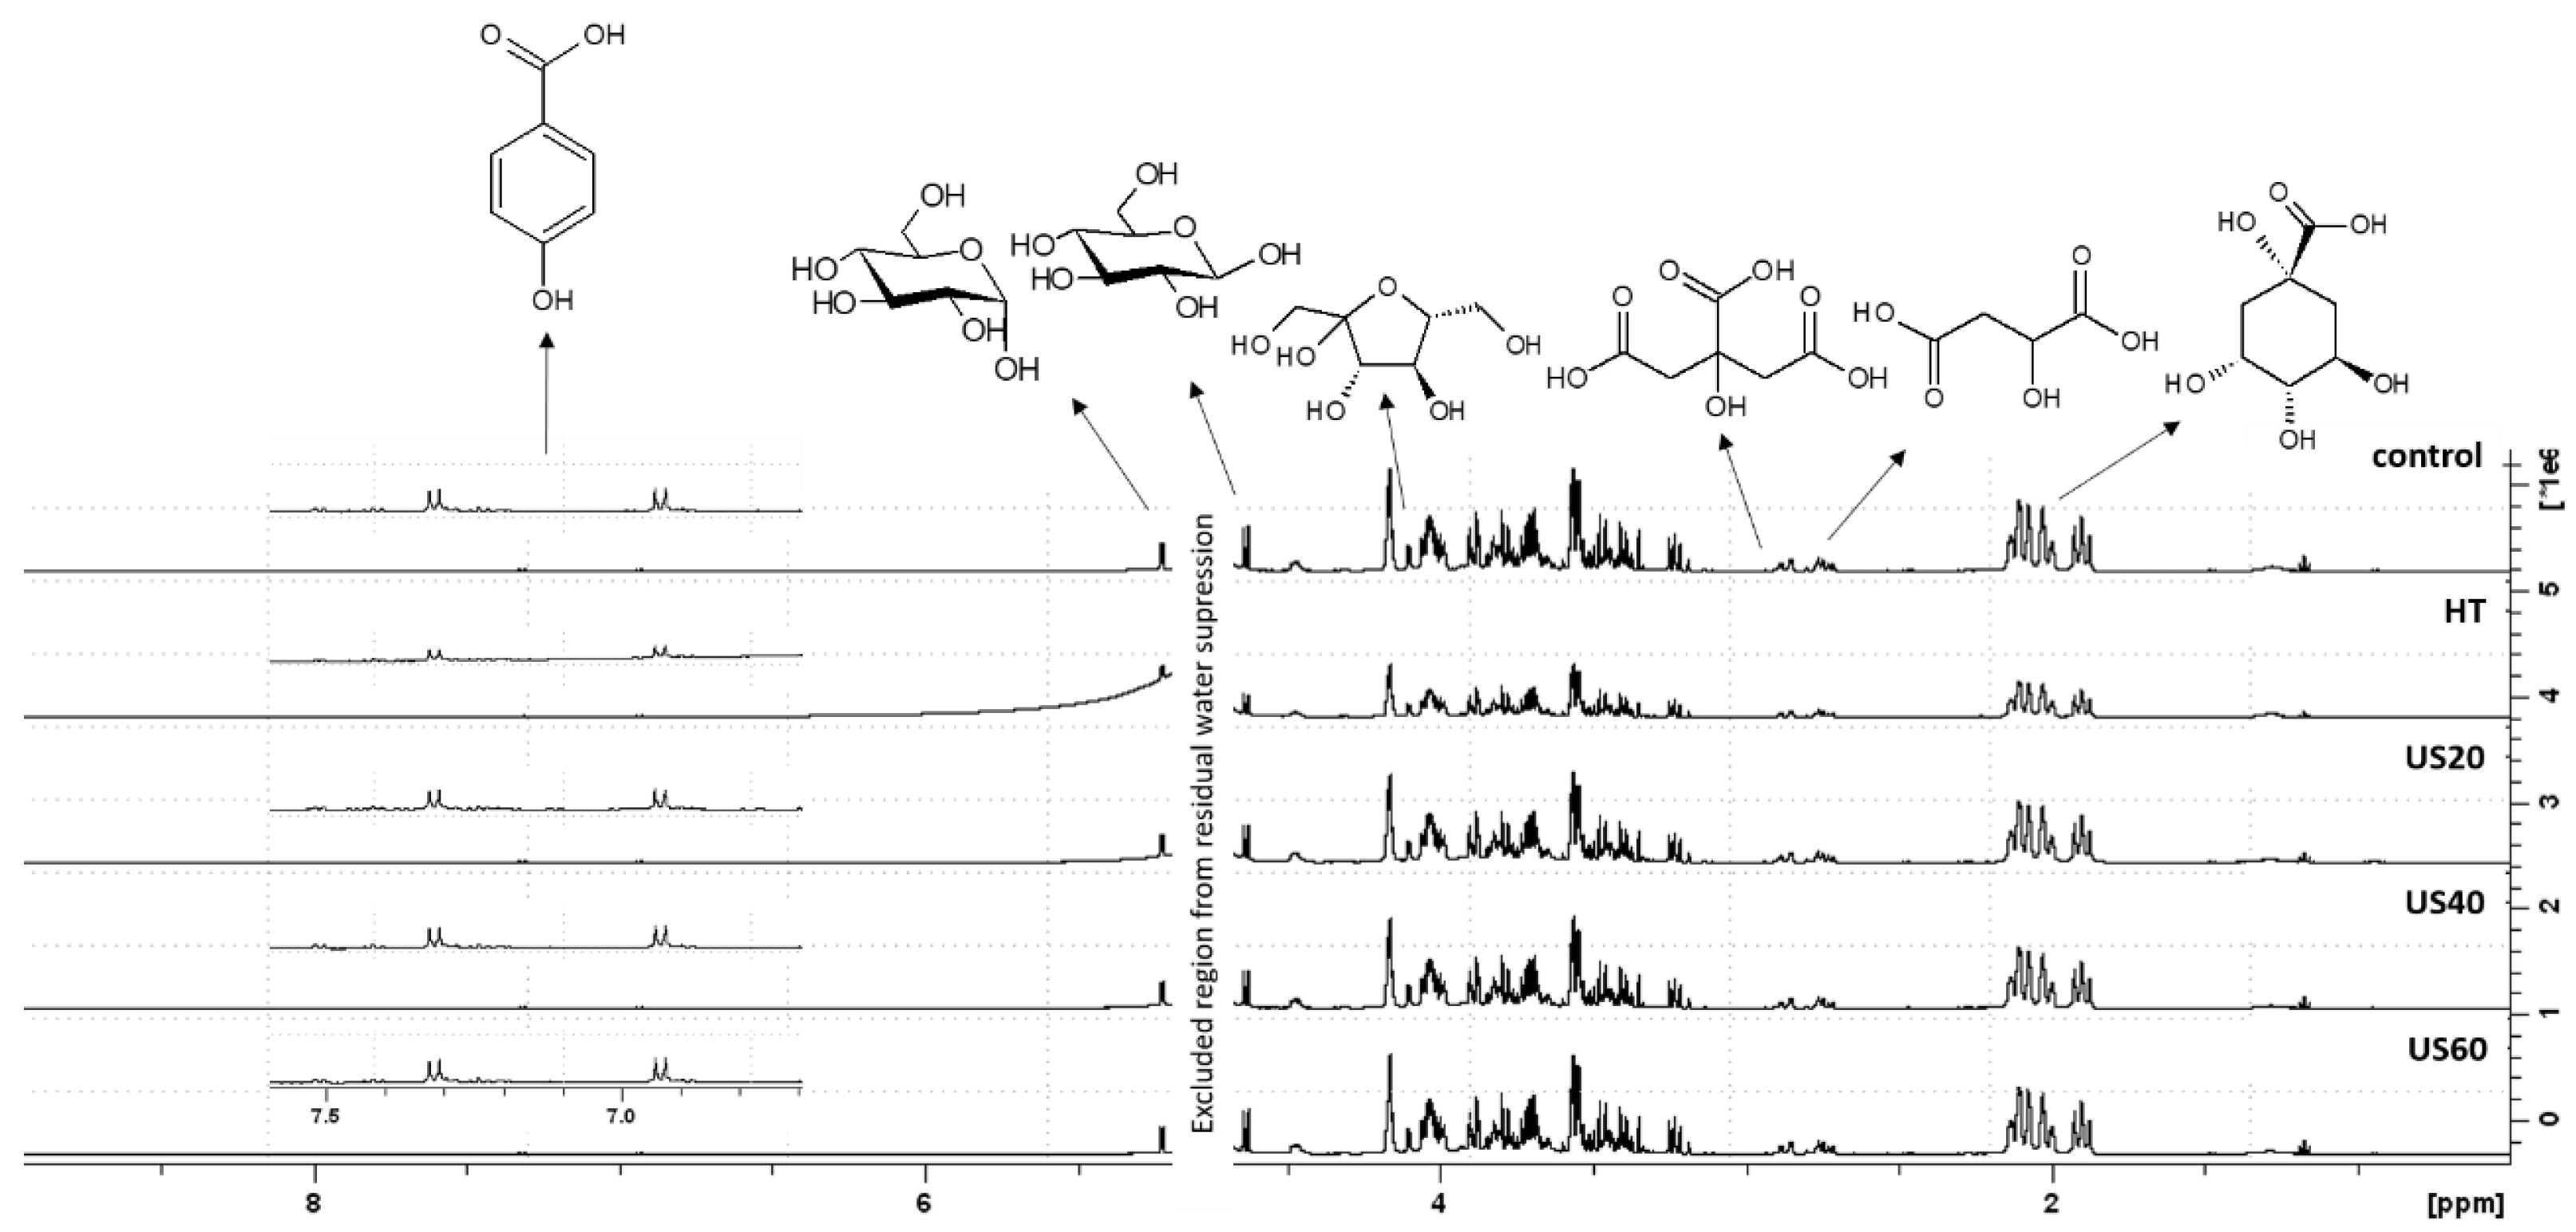
3.3. 1H NMR and HPLC-DAD Analysis

The 1H NMR spectra (Figure 1) of the juices showed similar chemical profiles regardless of the applied treatments. The characteristic signs of the compounds α-glucose [δH 5.22 ppm (d, J = 3.8 Hz)], β-glucose [δH 4.63 ppm (d, J = 8.0 Hz)], fructose [δH 4.10 (J = 3.7 Hz)], citric acid [δH 2.91 and δH 2.78 ppm (d, J = 15.5 Hz), malic acid [2.87 (dd, J = 16.2:4.3) and 2.75 (dd, J = 16.2:7.5), quinic acid [δH 4.16 (m), δH 3.58–3.54 (m), δH 2.15–1.86 (m)], and p-hydroxybenzoic acid derivative [δH 7.32 and δH 6.93 (d, J = 8.6 Hz)] were observed. The substances identified in the juices of the Amazonian minifig were previously reported in other Ficus species [28,29]. Observing the signals of the major compounds, it is noted that in the HT sample that underwent heating only, without the aid of ultrasound, the signals decreased a little. In a study to monitor the quality of orange juice, it was found that heat-treated samples lost their turbidity and had their ascorbic acid content reduced by 7% [30], while high-intensity ultrasound processing enhanced the bioactive compounds on melon juice [23].
Minor bioactives were identified and quantified by HPLC-DAD, such as gallic acid and its derivatives, protocatechuic acid, cyanidins, p-hydroxybenzoic acid, p-coumaric acid, and syringic acid, trans-ferulic and caffeic acid, epicatechin derivatives, vitexin and rutinoside. As shown in Figure 2, the two PCA components (PC1 and PC2) explained 100% of the total data variance, indicating strong interrelation between treatments and antioxidant properties of the juice samples. The loading plot showed that PC1 explained 92% of the total variation, whereas PC2 explained only 8% of the total variability, that is, the most important variables for chemical composition of HT and US20 (score plot on left in Figure 2A) are based on gallic acid derivatives, cinnamic acid derivatives, caffeic syringic acid, catechin derivatives (Figure 2C). ANOVA proved that the polyphenol concentrations were statistically discriminable from between all group concentrations (p-value < 0.05). However, the samples were grouped into two main groups or clusters (Figure 2B). The HCA result shows that the HT and US20 samples were chemically similar. US20 was the sample that was exposed for the longest time to ultrasound treatment with a lower power. The use of ultrasound did not enhance the extraction of vitexin, caffeic and trans-ferulic acid, but enhanced the extraction of cyanidin 3-O-glucoside and p-hydroxybenzoic acid In a study using the extraction technique to monitor the quality of noni juice using US, it was found that the TPC and TFC in US-treated juice were 2.67% and 22.06% higher than those of untreated juice [31].
An additional supervised chemometric analysis was performed using the PLS classification method. This technique identifies the latent variables (signal intensity of each analyte) that allow the greatest discrimination between two separate groups of samples based on their spectra (X matrix) and according to their maximum covariance with an established target class in the Y matrix [32], given that the Y matrix (results obtained in the antioxidant tests) responses must be considered for the construction of the components. That is, it is necessary to create a model with an expected result and then verify whether the data set will behave as expected, such as, for example, waiting for samples with better antioxidant activity to group according to the different classes of bioactive compound. or depending on the amounts of bioactive. In contrast, PCA is an unsupervised method, as it does not use the response to build new components; that is, PCA reveals adequate separations between groups only when the variability within the group is sufficiently lower than that between groups. Therefore, the supervised method is used when we expect a result that can be predicted, such as the PLS-DA that guides a transformation informed by the variability between groups to reveal a better grouping. In this way, it is possible to predict which bioactives have greater weight or importance for each sample group.
The PLS analyzes (Figure 3) revealed that the HT sample was completely ungrouped from the others due to the results of antioxidant activity (DPPH, ABTS and TPC), however, it approached the US20 sample when the comparison was made according to the chemical composition (Figure 2C), which was evidenced in the statistical analysis by ANOVA, where the overwritten letters indicate statistical similarity of the results (Table 4). Analyzing the PLS, it is observed that the sample HT was totally separated from the other group when we compared the ABTS and TPC assay. The gallic acid derivatives have greater weight in the ABTS antioxidant assays and gallic acid, protocatechuic acid, p-hydroxybenzoic acid and epicatechin had more weight in the grouping samples with better TPC response. The thermostability of bioactive compounds was evaluated in a work done by Mehaya [33], it was verified that the gallic acid content can increase during temperature variation, however, when reaching extreme temperatures, its concentration decreases. On the other hand, molecules such as caffeic acid can decrease at elevated temperatures, while flavonoids have the disadvantage of being thermolabile compounds [34]. This suggests the importance of extraction processes for these molecules to obtain the best response in these assays. It was observed that in the model created with data from the antioxidant assays as a function of the concentrations of bioactive molecules quantified in each of the samples, the model did not serve for the DPPH assay, but served for the ABTS and TPC assays (Figure 3), which isolated the HT sample from the others. The HT method for the extraction of bioactive polyphenols in Amazon fig juice was efficient for extracting p-hydroxybenzoic and syringic acid (Figure 3C).

4. Conclusions

The chemical and antioxidant characteristics of Amazon fig juices obtained by heat treatment (HT) or high-intensity ultrasound (HIUS) were evaluated herein. The juices showed chemical similarity in the major compounds identified by NMR, such as α-glucose, β-glucose, fructose, citric acid, malic and p-hydroxy-benzoic acids.
The treatments improved the extraction of bioactive compounds and their antioxidant properties in foods. Regarding the physicochemical parameters such as pH, titratable acidity and soluble solids, no significant differences were observed between treatments in relation to the control, except for color (marginal changes). This suggests that both treatments maintained the physicochemical characteristics of the juices, making it feasible to also assess whether their sensory characteristics are affected or maintained.
Although the treatments maintained the physicochemical parameters, they caused significant changes in the antioxidant activity, as well as in the content of phenolic compounds in the juices. The HT, US20 and US40 treatments showed best results compared to the control sample. Among them, the highest results were in HT, followed by US20. For the juices obtained with HIUS, the best results were those that used low power and longer time, on the other hand, the total phenol contents decreased with increasing power and reducing time. This reveals that at constant energy density under the evaluated conditions, the increase in time was a more important factor for the extraction of bioactive compounds than the increase in power.
HIUS was efficient to improve the antioxidant capacity of the minifig juices; however, under the conditions of this study, it was HT that presented the best values after treatment and greater efficiency for the extraction of bioactive compounds. Therefore, new experimental designs can be carried out to obtain extraction conditions that make HIUS a favorable alternative in relation to heat treatment for the minifig juices. As prospects for future studies, we should consider the microbiological analyzes, which may be used to evaluate and compare the effect of pasteurization and HIUS on the reduction in microorganisms in the juices and the evaluation of the juice stability.

Author Contributions

J.M.d.A.C.: methodology, formal analysis, investigation, writing—original draft; R.F.C.: conceptualization, writing—original draft; A.S.R.: methodology, formal analysis, investigation, writing—review and editing; V.F.K.: resources; E.A.S.: writing—review and editing; P.H.C.: writing: review and editing; J.d.A.B.: conceptualization, formal analysis; funding acquisition; project administration; methodology; writing—review and editing. All authors have read and agreed to the published version of the manuscript.

Funding

This research was funded by FAPEAM (Fundação de Amparo à Pesquisa do Estado do Amazonas, grant number 062.01076/2018-UNIVERSAL AMAZONAS, PAIC IFAM-CMC 2020–2021), PADCIT-IFAM (PVZ-172-2020), Coordenação de Aperfeiçoamento de Pessoal de Nível Superior—CAPES (Grant, Process number 88887.711027/2022-00) and CNPq (Conselho Nacional de Desenvolvimento Científico e Tecnológico, grant number 311522/2020-3).

Data Availability Statement

Data sharing not applicable.

Acknowledgments

The authors thank FAPEAM (Fundação de Amparo à Pesquisa do Estado do Amazonas, grant number 062.01076/2018-UNIVERSAL AMAZONAS, PAIC IFAM-CMC 2020–2021), PADCIT-IFAM (PVZ-172-2020), Coordenação de Aperfeiçoamento de Pessoal de Nível Superior—CAPES (Grant, Process number 88887.711027/2022-00), CNPq (Conselho Nacional de Desenvolvimento Científico e Tecnológico, grant number 311522/2020-3), Postgraduate Program in Chemistry at the Federal University of Amazonas (PPGQ-UFAM), Analytical Center IFAM-CMC, Nuclear Magnetic Resonance Laboratory (NMRLab) of the Analytical Center of UFAM for the financial support, fellowships and infrastructure.

Conflicts of Interest

The authors declare no conflict of interest.

References

  1. Kinupp, V.F.; Lorenzi, H. Plantas Alimentícias Não Convencionais (PANC) No Brasil: Guia de Identificação, Aspectos Nutricionais e Receitas Ilustradas; Instituto Plantarum De Estudos Da Flora: São Paulo, Brazil, 2014. [Google Scholar]
  2. Mar, J.M.; da Silva, L.S.; Lira, A.C.; Kinupp, V.F.; Yoshida, M.I.; Moreira, W.P.; Bruginski, E.; Campos, F.R.; Machado, M.B.; de Souza, T.P.; et al. Bioactive Compounds-Rich Powders: Influence of Different Carriers and Drying Techniques on the Chemical Stability of the Hibiscus Acetosella Extract. Powder Technol. 2020, 360, 383–391. [Google Scholar] [CrossRef]
  3. Mar, J.M.; Silva, L.S.; Rabelo, M.D.; Muniz, M.P.; Nunomura, S.M.; Correa, R.F.; Kinupp, V.F.; Campelo, P.H.; Bezerra, J.D.; Sanches, E.A. Encapsulation of Amazonian Blueberry Juices: Evaluation of Bioactive Compounds and Stability. Lwt 2020, 124, 109152. [Google Scholar] [CrossRef]
  4. Cruz, J.M.d.A.; Corrêa, R.F.; Lamarão, C.V.; Kinupp, V.F.; Sanches, E.A.; Campelo, P.H.; Bezerra, J.d.A. Ficus spp. Fruits: Bioactive Compounds and Chemical, Biological and Pharmacological Properties. Food Res. Int. 2022, 152, 110928. [Google Scholar] [CrossRef] [PubMed]
  5. Chemat, F.; Rombaut, N.; Sicaire, A.-G.; Meullemiestre, A.; Fabiano-Tixier, A.-S.; Abert-Vian, M. Ultrasound Assisted Extraction of Food and Natural Products. Mechanisms, Techniques, Combinations, Protocols and Applications. A Review. Ultrason. Sonochem. 2017, 34, 540–560. [Google Scholar] [CrossRef] [PubMed]
  6. Rojas, M.L.; Kubo, M.T.; Miano, A.C.; Augusto, P.E. Ultrasound Processing to Enhance the Functionality of Plant-Based Beverages and Proteins. Curr. Opin. Food Sci. 2022, 48, 100939. [Google Scholar] [CrossRef]
  7. Illera, A.E.; Sanz, M.T.; Benito-Román, O.; Varona, S.; Beltrán, S.; Melgosa, R.; Solaesa, A.G. Effect of Thermosonication Batch Treatment on Enzyme Inactivation Kinetics and Other Quality Parameters of Cloudy Apple Juice. Innov. Food Sci. Emerg. Technol. 2018, 47, 71–80. [Google Scholar] [CrossRef] [Green Version]
  8. Dias, D.d.R.C.; Barros, Z.M.P.; de Carvalho, C.B.O.; Honorato, F.A.; Guerra, N.B.; Azoubel, P.M. Effect of Sonication on Soursop Juice Quality. Lwt 2015, 62, 883–889. [Google Scholar] [CrossRef] [Green Version]
  9. Abid, M.; Jabbar, S.; Wu, T.; Hashim, M.M.; Hu, B.; Lei, S.; Zhang, X.; Zeng, X. Effect of Ultrasound on Different Quality Parameters of Apple Juice. Ultrason. Sonochem. 2013, 20, 1182–1187. [Google Scholar] [CrossRef]
  10. de Souza Carvalho, L.M.; Lemos, M.C.M.; Sanches, E.A.; da Silva, L.S.; de Araújo Bezerra, J.; Aguiar, J.P.L.; das Chagas do Amaral Souza, F.; Alves Filho, E.G.; Campelo, P.H. Improvement of the Bioaccessibility of Bioactive Compounds from Amazon Fruits Treated Using High Energy Ultrasound. Ultrason. Sonochem. 2020, 67, 105148. [Google Scholar] [CrossRef]
  11. Instituto Adolfo Lutz. 1a Edição Digital, 4th ed.; Instituto Adolfo Lutz: São Paulo, Brazil, 2008.
  12. de Castro, D.R.G.; Mar, J.M.; da Silva, L.S.; da Silva, K.A.; Sanches, E.A.; de Araújo Bezerra, J.; Rodrigues, S.; Fernandes, F.A.N.; Campelo, P.H. Dielectric Barrier Atmospheric Cold Plasma Applied on Camu-Camu Juice Processing: Effect of the Excitation Frequency. Food Res. Int. 2020, 131, 109044. [Google Scholar] [CrossRef]
  13. Pereira, G.A.; Silva, E.K.; Peixoto Araujo, N.M.; Arruda, H.S.; Meireles, M.A.A.; Pastore, G.M. Obtaining a Novel Mucilage from Mutamba Seeds Exploring Different High-Intensity Ultrasound Process Conditions. Ultrason. Sonochem. 2019, 55, 332–340. [Google Scholar] [CrossRef]
  14. Molyneux, P. The Use of the Stable Free Radical Diphenylpicryl-Hydrazyl (DPPH) for Estimating Anti-Oxidant Activity. Songklanakarin J. Sci. Technol. 2004, 26, 211–219. [Google Scholar]
  15. Re, R.; Pellegrini, N.; Proteggente, A.; Ananth, P.; Yng, M.; Rice-Evans, C. Antioxidant Activity Applying an Improved ABTS Radical Cation Decolorization Assay. Free Radic. Biol. Med. 1999, 26, 1231–1237. [Google Scholar] [CrossRef] [PubMed]
  16. Velioglu, Y.S.; Mazza, G.; Gao, L.; Oomah, B.D. Antioxidant Activity and Total Phenolics in Selected Fruits, Vegetables, and Grain Products. J. Agric. Food Chem. 1998, 46, 4113–4117. [Google Scholar] [CrossRef]
  17. Fernandes, F.A.N.; Santos, V.O.; Rodrigues, S. Effects of Glow Plasma Technology on Some Bioactive Compounds of Acerola Juice. Food Res. Int. 2019, 115, 16–22. [Google Scholar] [CrossRef]
  18. Ramos, A.S.; Mar, J.M.; Laiane, S.; Acho, L.D.R.; Janaína, B.; Silva, P.; Lima, E.S.; Campelo, P.H.; Sanches, E.A.; Bezerra, J.A.; et al. Pedra-Ume Caá Fruit: An Amazon Cherry Rich in Phenolic Compounds with Antiglycant and Antioxidant Properties. Food Res. Int. 2019, 123, 674–683. [Google Scholar] [CrossRef]
  19. Ramos, A.S.; Souza, R.O.S.; Paula, A.; Boleti, D.A.; Bruginski, E.R.D.; Lima, E.S.; Campos, F.R.; Machado, M.B. Chemical Characterization and Antioxidant Capacity of the Araçá-Pera (Psidium acutangulum): An Exotic Amazon Fruit. Food Res. Int. J. 2015, 75, 315–327. [Google Scholar] [CrossRef]
  20. Choo, Y.X.; Teh, L.K.; Tan, C.X. Effects of Sonication and Thermal Pasteurization on the Nutritional, Antioxidant, and Microbial Properties of Noni Juice. Molecules 2022, 28, 313. [Google Scholar] [CrossRef]
  21. Ferraz, R.A.; Leonel, S.; Souza, J.M.A.; Modesto, J.H.; Ferreira, R.B.; de Souza Silva, M. Agronomical and Quality Differences of Four Fig Cultivars Grown in Brazil. Semin. Agrar. 2021, 42, 619–634. [Google Scholar] [CrossRef]
  22. Gençdağ, E.; Görgüç, A.; Okuroğlu, F.; Yılmaz, F.M. The Effects of Power—Ultrasound, Peroxyacetic Acid and Sodium Chloride Washing Treatments on the Physical and Chemical Quality Characteristics of Dried Figs. J. Food Process. Preserv. 2021, 45, e15009. [Google Scholar] [CrossRef]
  23. Rodríguez-Rico, D.; Sáenz-Esqueda, M.D.L.Á.; Meza-Velázquez, J.A.; Martínez-García, J.J.; Quezada-Rivera, J.J.; Umaña, M.M.; Minjares-Fuentes, R. High-Intensity Ultrasound Processing Enhances the Bioactive Compounds, Antioxidant Capacity and Microbiological Quality of Melon (Cucumis melo) Juice. Foods 2022, 11, 2648. [Google Scholar] [CrossRef] [PubMed]
  24. Wang, J.; Wang, J.; Vanga, S.K.; Raghavan, V. High-Intensity Ultrasound Processing of Kiwifruit Juice: Effects on the Microstructure, Pectin, Carbohydrates and Rheological Properties. Food Chem. 2020, 313, 126121. [Google Scholar] [CrossRef] [PubMed]
  25. Peixoto Araujo, N.M.; Silva, E.K.; Arruda, H.S.; Rodrigues de Morais, D.; Angela, A.; Meireles, M.; Pereira, G.A.; Pastore, G.M. Recovering Phenolic Compounds from Eugenia Calycina Cambess Employing High-Intensity Ultrasound Treatments: A Comparison among Its Leaves, Fruit Pulp, and Seed as Promising Sources of Bioactive Compounds. Sep. Purif. Technol. 2021, 272, 118920. [Google Scholar] [CrossRef]
  26. Mohd Dom, N.S.; Yahaya, N.; Adam, Z.; Nik Mohd, N.M.A.; Hamid, M. Antiglycation and Antioxidant Properties of Ficus Deltoidea Varieties. Evid. Based Complement. Altern. Med. 2020, 2020, 6374632. [Google Scholar] [CrossRef] [PubMed]
  27. Tewari, D.; Zengin, G.; Ak, G.; Sinan, K.I.; Cziáky, Z.; Mishra, S.T.; Jekő, J. Phenolic Profiling, Antioxidants, Multivariate, and Enzyme Inhibitory Properties of Wild Himalayan Fig (Ficus palmata Forssk.): A Potential Candidate for Designing Innovative Nutraceuticals and Related Products. Anal. Lett. 2021, 54, 1439–1456. [Google Scholar] [CrossRef]
  28. Debib, A.; Dueñas, M.; Boumediene, M.; Mothana, R.A.; Latifa, A.; Tir-Touil, M.A. Synergetic Hepatoprotective Effect of Phenolic Fractions Obtained from Ficus Carica Dried Fruit and Extra Virgin Olive Oil on CCL 4-Induced Oxidative Stress and Hepatotoxicity in Rats. J. Food Biochem. 2016, 40, 507–516. [Google Scholar] [CrossRef]
  29. Palmeira, L.; Pereira, C.; Dias, M.I.; Abreu, R.M.V.; Corrêa, R.C.G.; Pires, T.C.S.P.; Alves, M.J.; Barros, L.; Ferreira, I.C.F.R. Nutritional, Chemical and Bioactive Profiles of Different Parts of a Portuguese Common Fig (Ficus carica L.) Variety. Food Res. Int. 2019, 126, 108572. [Google Scholar] [CrossRef] [Green Version]
  30. Gomes, A.; Costa, A.L.R.; Rodrigues, P.D.; de Castro, R.J.S.; Silva, E.K. Sonoprocessing of Freshly Squeezed Orange Juice: Ascorbic Acid Content, Pectin Methylesterase Activity, Rheological Properties and Cloud Stability. Food Control 2022, 131, 108391. [Google Scholar] [CrossRef]
  31. Wang, S.; Liu, Z.; Zhao, S.; Zhang, L.; Li, C.; Liu, S. Effect of Combined Ultrasonic and Enzymatic Extraction Technique on the Quality of Noni (Morinda citrifolia L.) Juice. Ultrason. Sonochem. 2023, 92, 106231. [Google Scholar] [CrossRef]
  32. Esbensen, K.H.; Swarbrick, B. Multivariate Data Analysis: An Introduction to Multivariate Analysis, Process Analytical Technology and Quality by Design; 6a; Camo Software AS: Oslo, Norway, 2018; ISBN 978-8269110401. [Google Scholar]
  33. Mehaya, F.M.; Mohammad, A.A. Thermostability of Bioactive Compounds during Roasting Process of Coffee Beans. Heliyon 2020, 6, e05508. [Google Scholar] [CrossRef]
  34. Carlos, A.L.E.; Priego-Capote, F.; De Castro, M.D.L. Comparative Study of the Effect of Sample Pretreatment and Extraction on the Determination of Flavonoids from Lemon (Citrus limon). PLoS ONE 2016, 11, e0148056. [Google Scholar] [CrossRef]
Figure 1. 1H NMR spectrum (H2O:D2O, 500 MHz) of the treated juices submitted and amplification of the aromatic region (6.7 to 7.6 ppm).
Processes 11 00408 g001
Figure 2. (A) Principal Component Analysis (Mean centered; Algorithm used: SVD Validation method: Cross validation: Full with 5 segments); (B) Cluster analysis: Method: Ward’s method; Distance: Squared Euclidean distance; Matrix Size: 5 samples, 31 variables. (C) Loadings (retention time (RT) of molecules with higher importance in each group).
Processes 11 00408 g002aProcesses 11 00408 g002b
Figure 3. Partial Least Squares (Mean centered) of Amazon fig juice. (A) and (B) represents the model response as a function of TPC and ABTS; (C) is the result of loadings (chemical composition and antioxidant result) and score (sample group) Bi-plot. Algorithm used: Kernel; Validation method: Cross validation. Full with 5 segments. Number of calibration samples used: 5; total number of factors: 3; factors suggested by model: 2; optimal number of factors: 2.
Processes 11 00408 g003aProcesses 11 00408 g003b
Table 1. HT and HIUS treatment parameters.
TreatmentPower (W)Time (min)Initial Temperature (°C)Final Temperature (°C)
HT1021.27 ± 0.0677.87 ± 0.21
US2015016.625.33 ± 0.5864.67 ± 0.58
US403008.325.67 ± 0.5872.33 ± 0.58
US806004.125.67 ± 0.5862.33 ± 0.58
HT = Heat Treatment; US = Ultrasound Treatment.
Table 2. Physical chemical characterization of juices.
TreatmentControlHTUS20US40US80
pH3.46 ± 0.05 a3.50 ± 0.05 a3.44 ± 0.05 a3.47 ± 0.05 a3.47 ± 0.05 a
TA (%)0.044 ± 0.001 a0.044 ± 0.001 a0.046 ± 0.001 a0.048 ± 0.001 a0.046 ± 0.001 a
SS (°Brix)2.34 ± 0.05 a2.35 ± 0.05 a2.35 ± 0.05 a2.40 ± 0.05 a2.37 ± 0.04 a
L*11.9 ± 0.5 d14.2 ± 0.3 c15.6 ± 0.4 b16.8 ± 0.2 a16.4 ± 0.2 ab
a*10.7 ± 0.6 a9.4 ± 0.3 b10.0 ± 0.3 ab10.0 ± 0.3 ab10.1 ± 0.5 ab
b*8.3 ± 0.1 a8.8 ± 0.1 a9.4 ± 0.7 a8.6 ± 0.7 a9.0 ± 0.2 a
C*13.6 ± 0.4 a12.9 ± 0.2 a13.7 ± 0.6 a13.2 ± 0.4 a13.5 ± 0.2 a
h*38.0 ± 2.0 a43.2 ± 1.2 a43.1 ± 1.8 a40.7 ± 2.8 a41.7 ± 2.0 a
ΔE2.6 ± 0.1 b4.0 ± 0.4 a4.9 ± 0.6 a4.6 ± 0.4 a
L = lightness of color; a and b represent chromaticity axes; C = chroma; h = hue. TA = titratable acidity; SS = soluble solids. Means that do not share the same letter are significantly different.
Table 3. Antioxidant activity by DPPH· and ABTS·+ methods (µM TE), TPC (mg EAG mL−1) and TCC.
TreatmentDPPHABTSTPCTCC
Control672 ± 6 d814 ± 6 d207 ± 1 cND
HT1235 ± 11 a1440 ± 13 a312 ± 5 aND
US20762 ± 11 b956 ± 10 b215 ± 1 bND
US40732 ± 8 c904 ± 4 c212 ± 1 bcND
US80572 ± 7 e844 ± 10 d209 ± 2 bcND
TPC = Total phenolic compounds; TCC = Total carotenoid content. Means that do not share a same letter are significantly different. ND = Not detected.
Table 4. Phenolic compound quantified and tentatively identified in Amazon fig juices.
RT (min)Compoundλ (nm)ControlHTUS20US40US80R2%RSD
mg/mL
6.82Gallic acid derivative271NDNDNDNDNDNDND
7.69Gallic acid2710.10 ± 0.02 b0.26 ± 0.10 a0.10 ± 0.04 b0.06 ± 0.01 bc0.10 ± 0.01 b0.99819.9
8.24Not Indentified323NDND/↑NDNDNDNDND
10.19Protocatechuic acid2930.07 ± 0.00 c0.10 ± 0.07 a0.07 ± 0.01 c0.04 ± 0.00 d0.08 ± 0.00 b0.99819.85
10.79Not Indentified323NDNDND/↑NDNDNDND
10.97Not Indentified319NDND/↑NDNDNDNDND
11.17Not Indentified324ND/↑NDND/↑NDNDNDND
11.73Cyanidin 3-O-glucoside5270.26 ± 0.01 c0.27 ± 0.00 b0.24 ± 0.01 d0.16 ± 0.00 e0.35 ± 0.01 a0.99818.8
12.50p-hydroxybenzoic acid324<LOQ0.19 ± 0.04 a0.02 ± 0.01 c0.01 ± 0.00 c0.04 ± 0.01 b0.99717.7
12.67Cyanidin5190.03 ± 0.01 a0.02 ± 0.00 b0.02 ± 0.00 b0.01 ± 0.00 c0.02 ± 0.00 b0.99616.9
13.14Delphinidin526<LOQ<LOQ<LOQ<LOQ<LOQ0.98819.5
13.40Syringic acid2671.44 ± 0.46 b2.22 ± 0.19 a0.89 ± 0.04 c0.58 ± 0.04 d1.98 ± 0.14 b0.98818.4
13.75Caffeic acid3240.08 ± 0.01 a0.06 ± 0.01 ab0.05 ± 0.01 ab0.03 ± 0.00 c0.06 ± 0.01 ab0.99219.8
14.01Epicatechin2900.18 ± 0.04 b0.23 ± 0.04 a0.16 ± 0.02 bc0.10 ± 0.01 d0.18 ± 0.03 b0.98718.1
15.01Epicatechin derivative297<LOQ<LOQ<LOQ<LOQ<LOQ
15.95Flavonol derivative344<LOQ<LOQ<LOQ<LOQ<LOQ
15.30Catechin derivative297<LOQ<LOQ<LOQ<LOQ<LOQ
16.43p-coumaric acid3090.04 ± 0.02 b0.08 ± 0.04 a0.00 ± 0.00 d0.00 ± 0.00 d0.03 ± 0.02 c0.99517.8
17.12trans-ferulic acid3220.039 ± 0.02 a0.04 ± 0.02 a0.02 ± 0.00 bc0.01 ± 0.00 d0.03 ± 0.01 ab0.99816.9
17.71Vitexin3380.10 ± 0.04 b0.11 ± 0.04 a0.04 ± 0.00 cd0.04 ± 0.00 cd0.08 ± 0.04 c0.99917.4
ANOVA*******
RT = retention time; R2 = R-squared is a measure for linearity; %RSD = Relative Standard Deviation; <LOQ = below limit of quantification; ND = not determined. Mean values followed by different letter were significantly different at p ≤ 0.05 (Least significant difference test). * Indicates highly significant difference at p-value ≤ 0.05. Symbol ↑ indicates higher area.
Disclaimer/Publisher’s Note: The statements, opinions and data contained in all publications are solely those of the individual author(s) and contributor(s) and not of MDPI and/or the editor(s). MDPI and/or the editor(s) disclaim responsibility for any injury to people or property resulting from any ideas, methods, instructions or products referred to in the content.

