
Differential Development Mechanisms of Pore Types under the Sequence Stratigraphic Constraints of the Wufeng–Longmaxi Formation Shale from the Upper Yangtze Platform
 , , ,
, , ,
Abstract
:1. Introduction
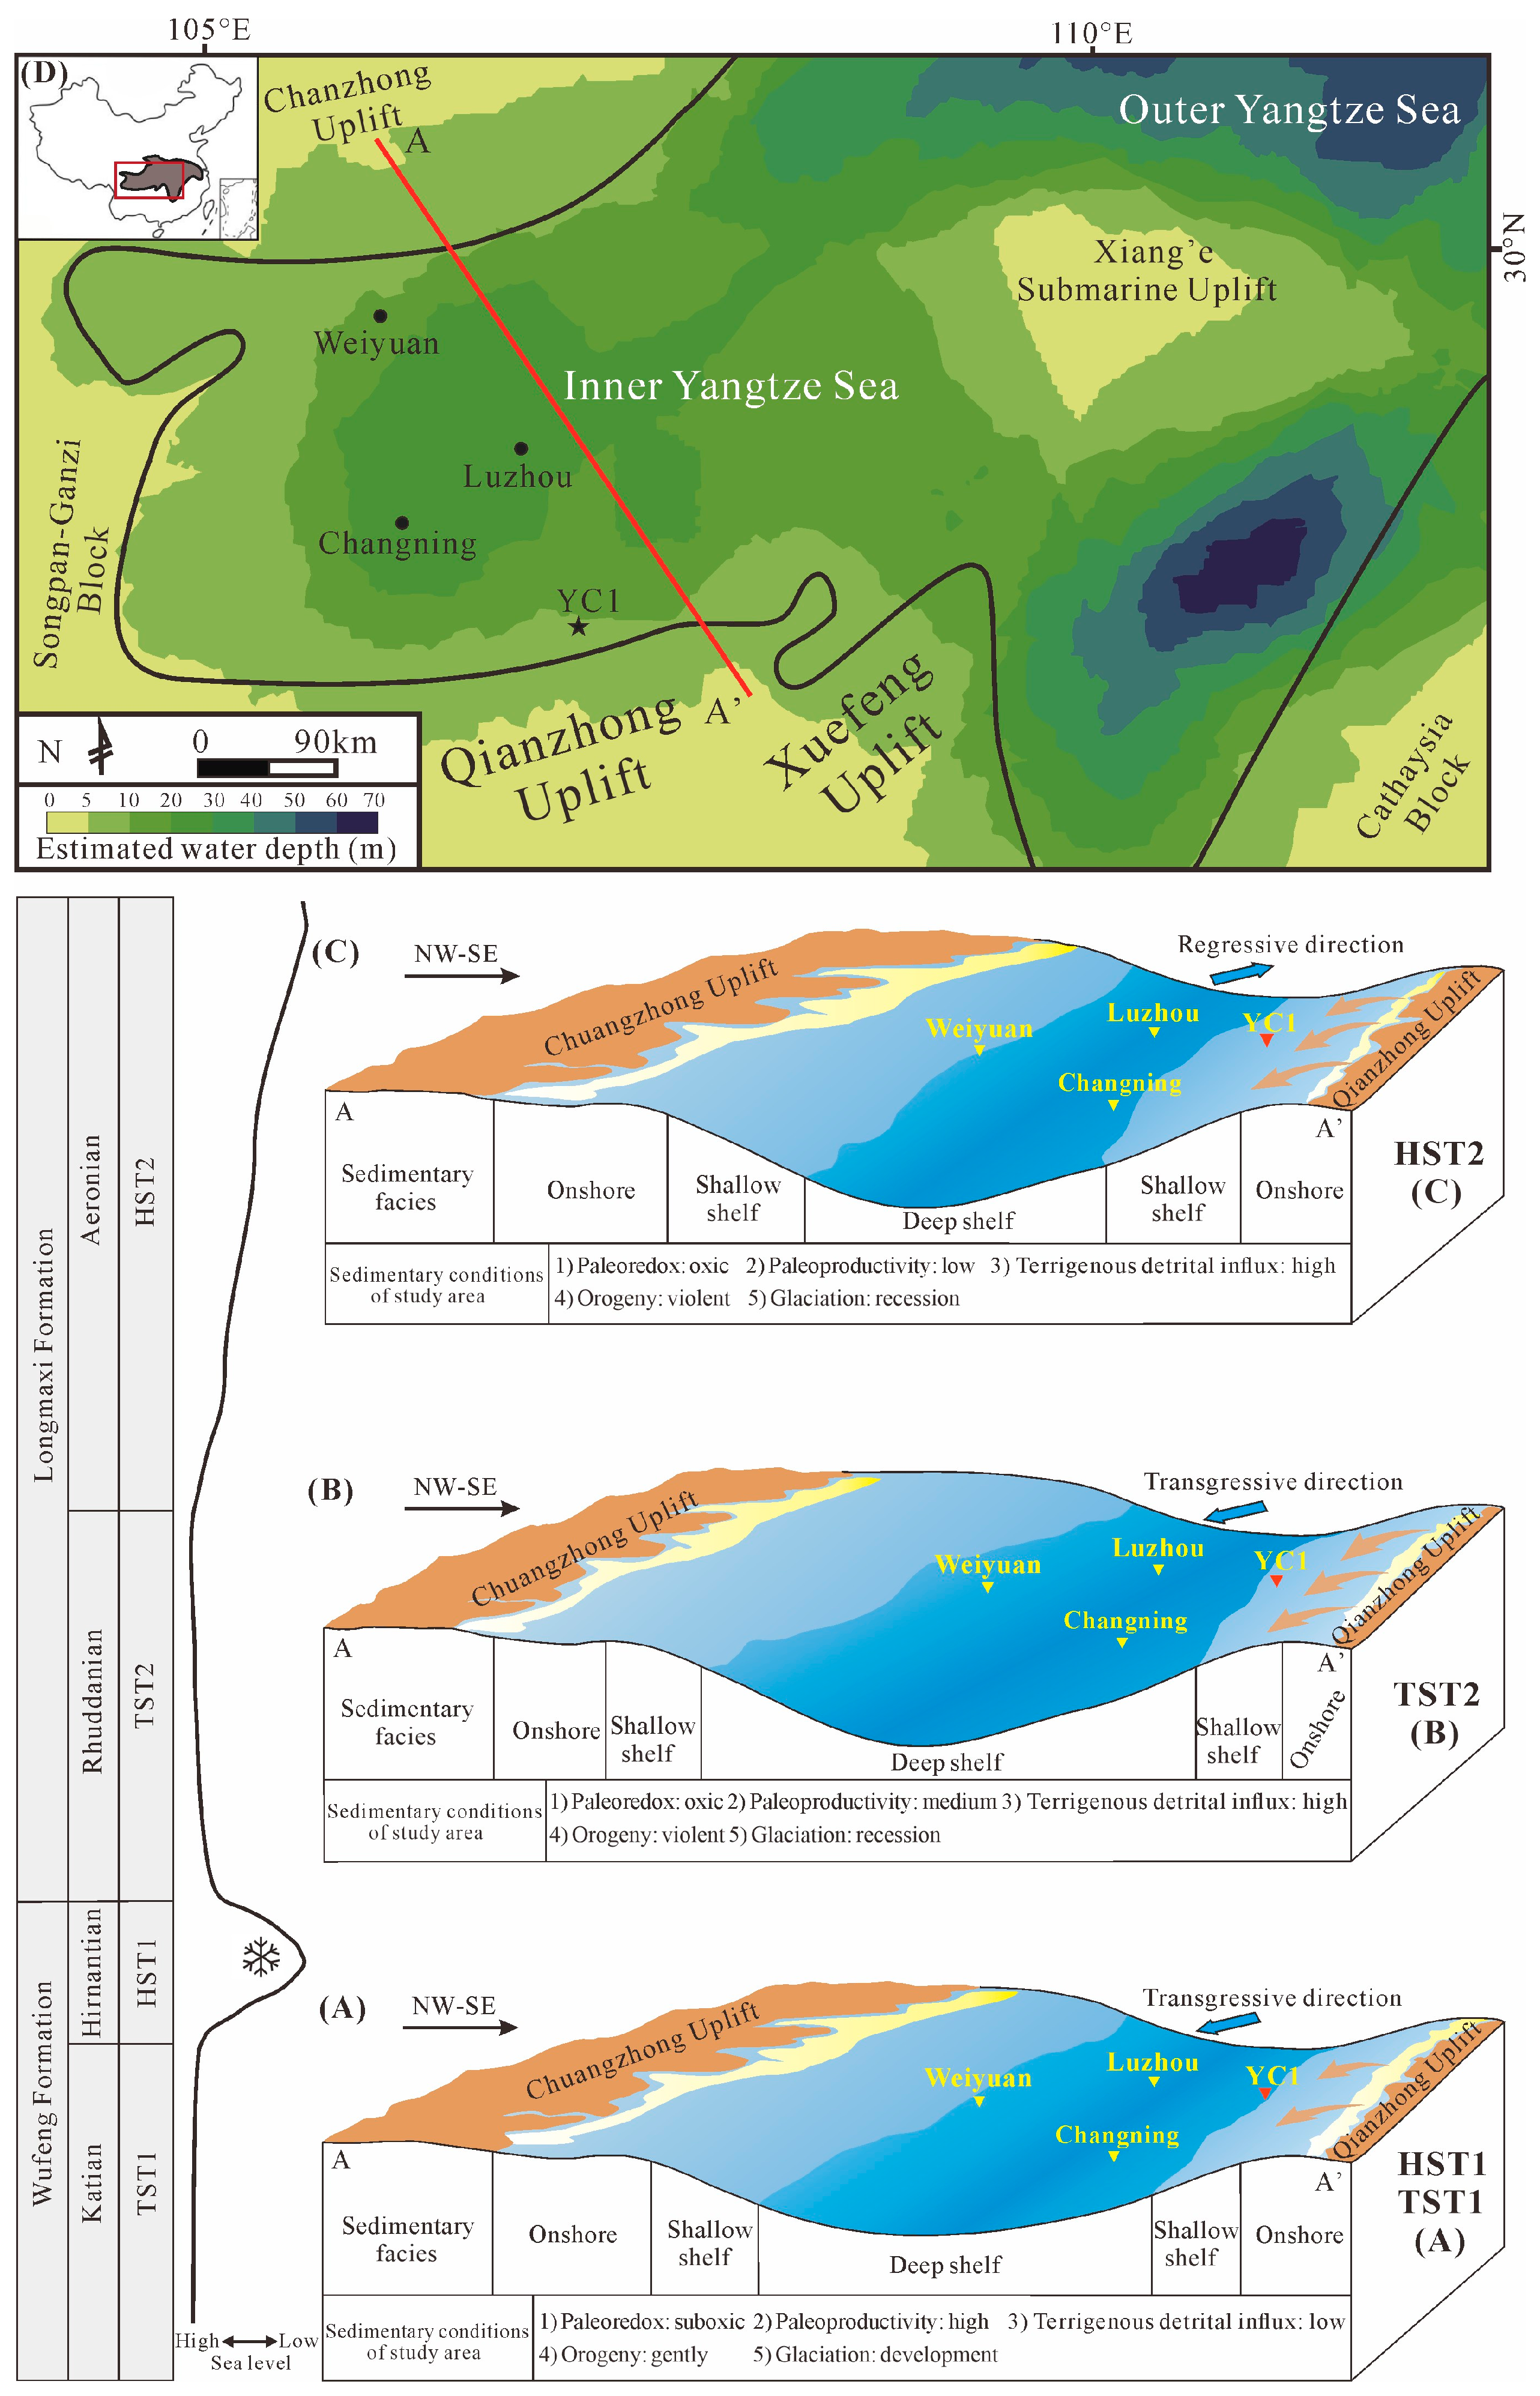
2. Geological Setting
3. Experimental Methods and Data Processing
3.1. Sampling and Methodology
3.2. Processing FE-SEM Image Data
3.3. Data Processing of Major and Trace Elements and Its Geological Significance
4. Results
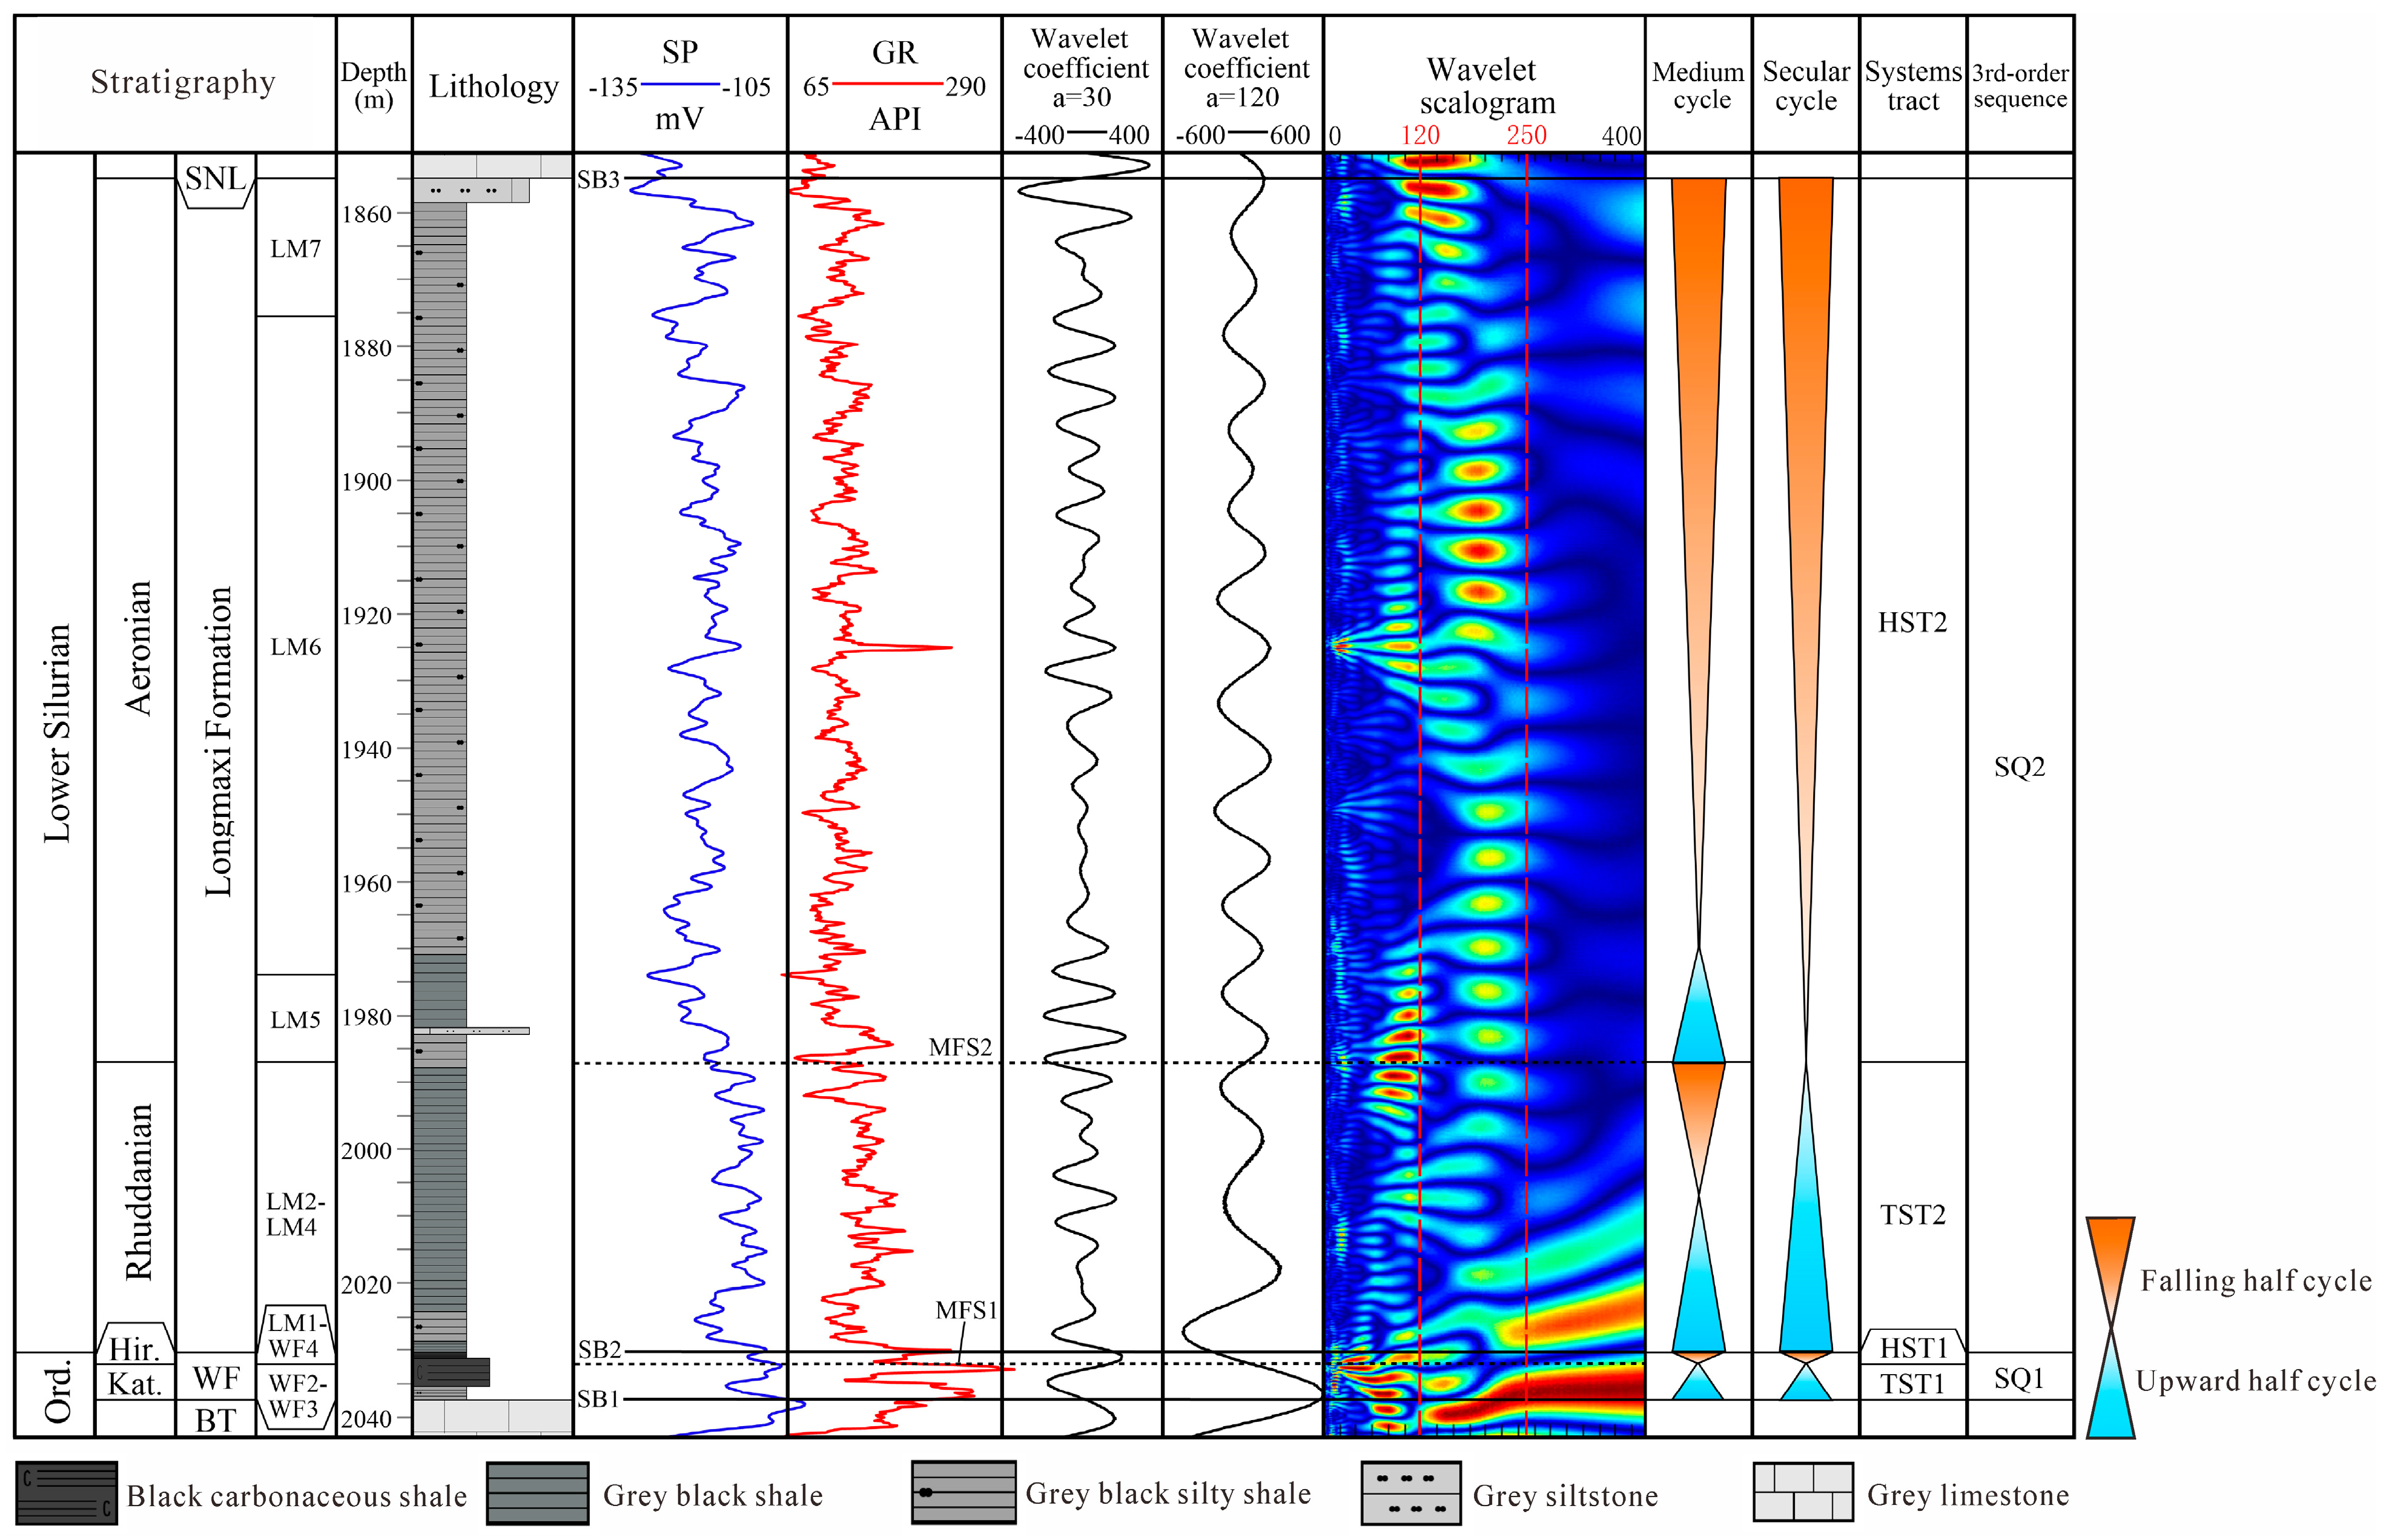
4.1. Sequence Stratigraphic Division Based on Wavelet Analysis
4.2. TOC and Mineralogical Composition
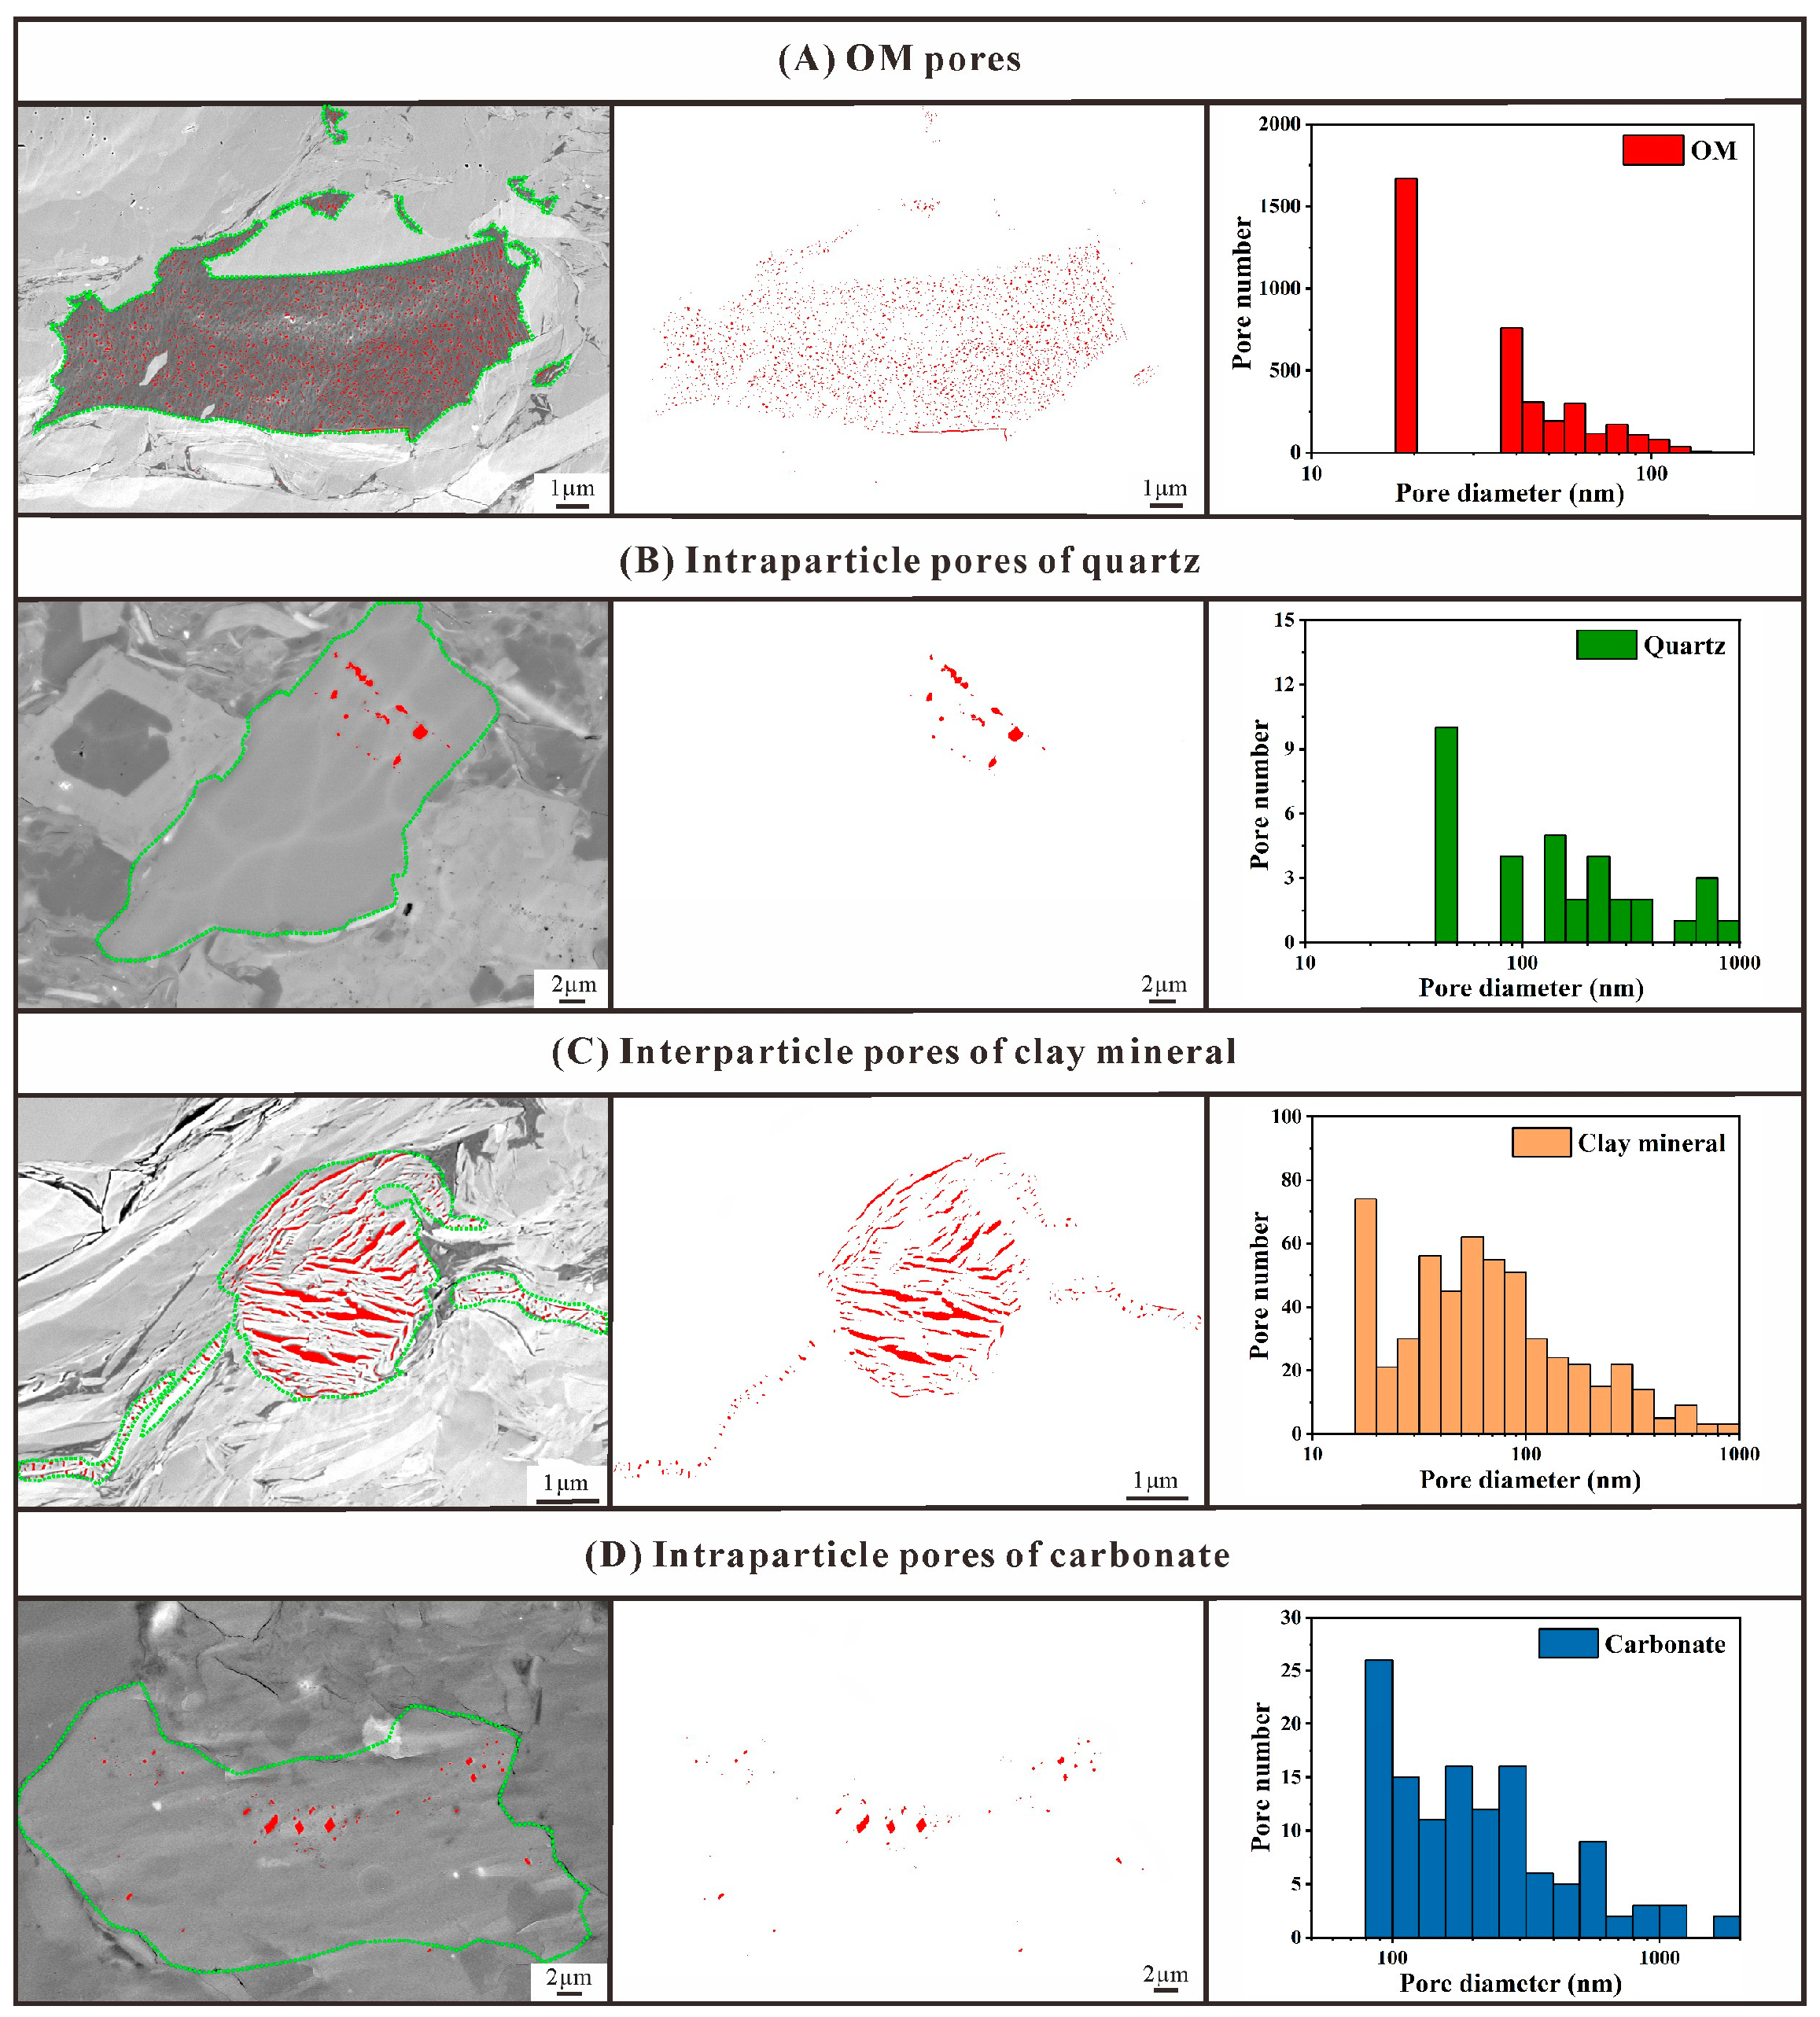
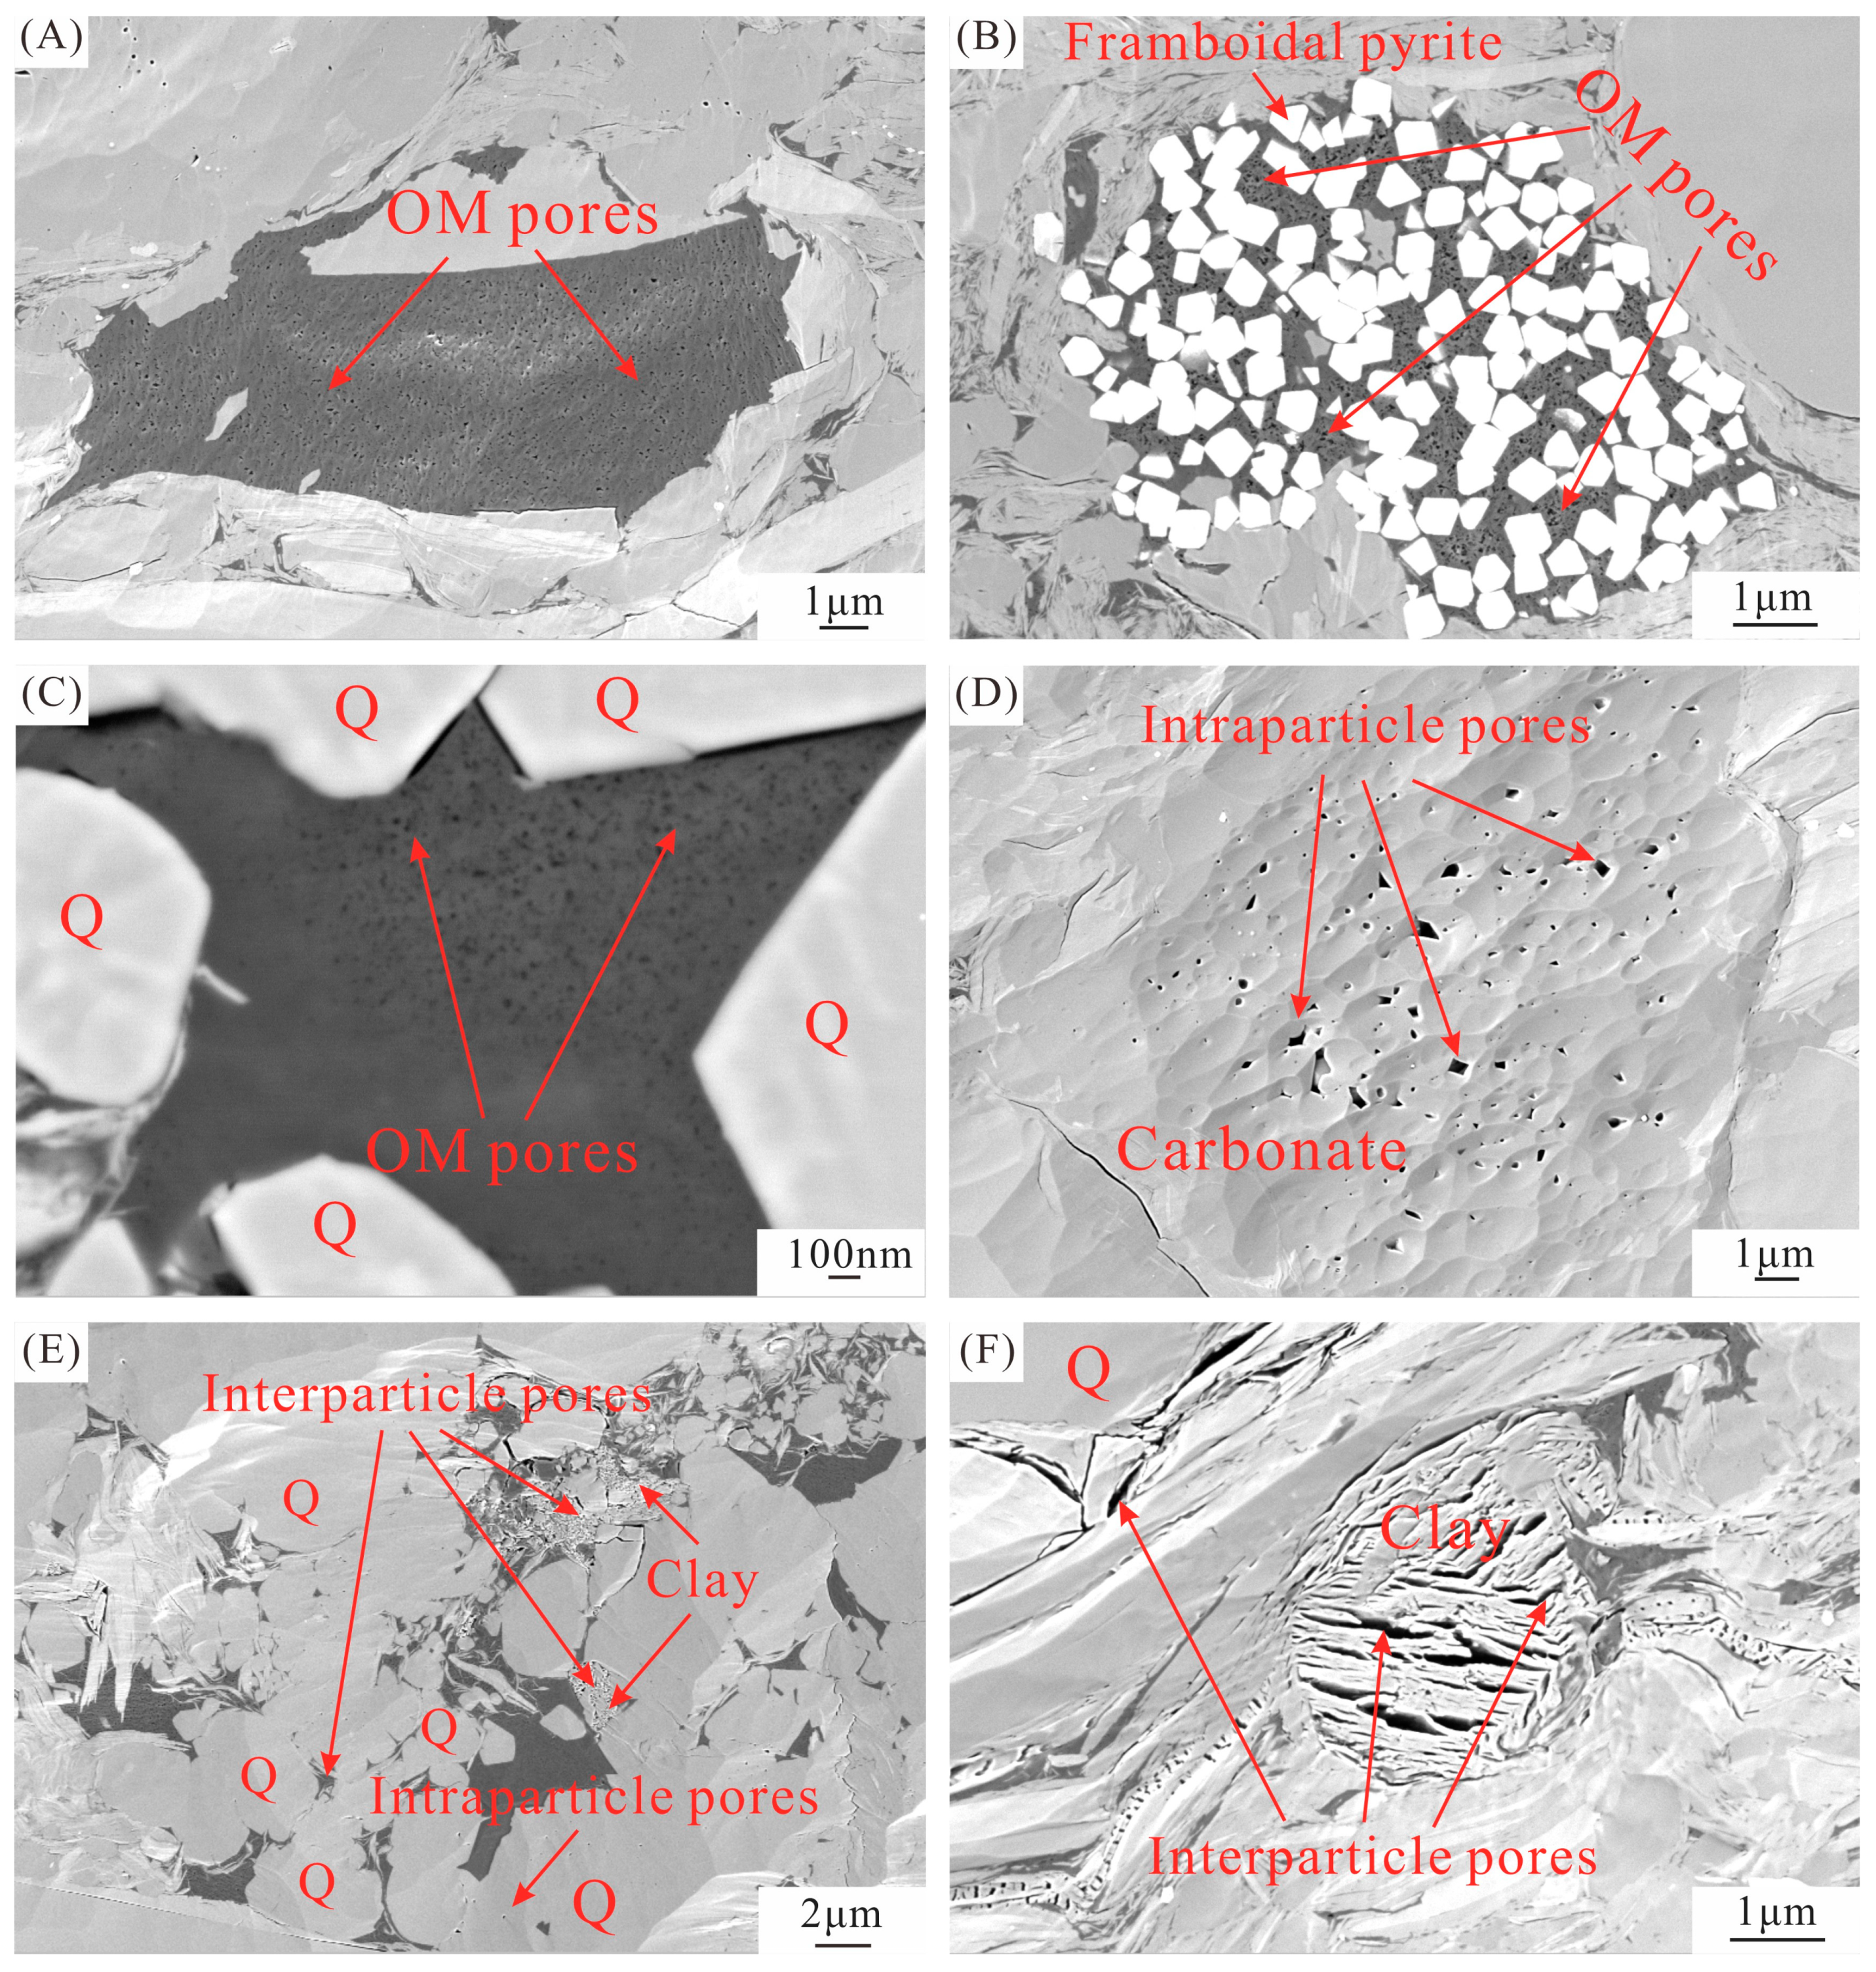
4.3. Pore Types
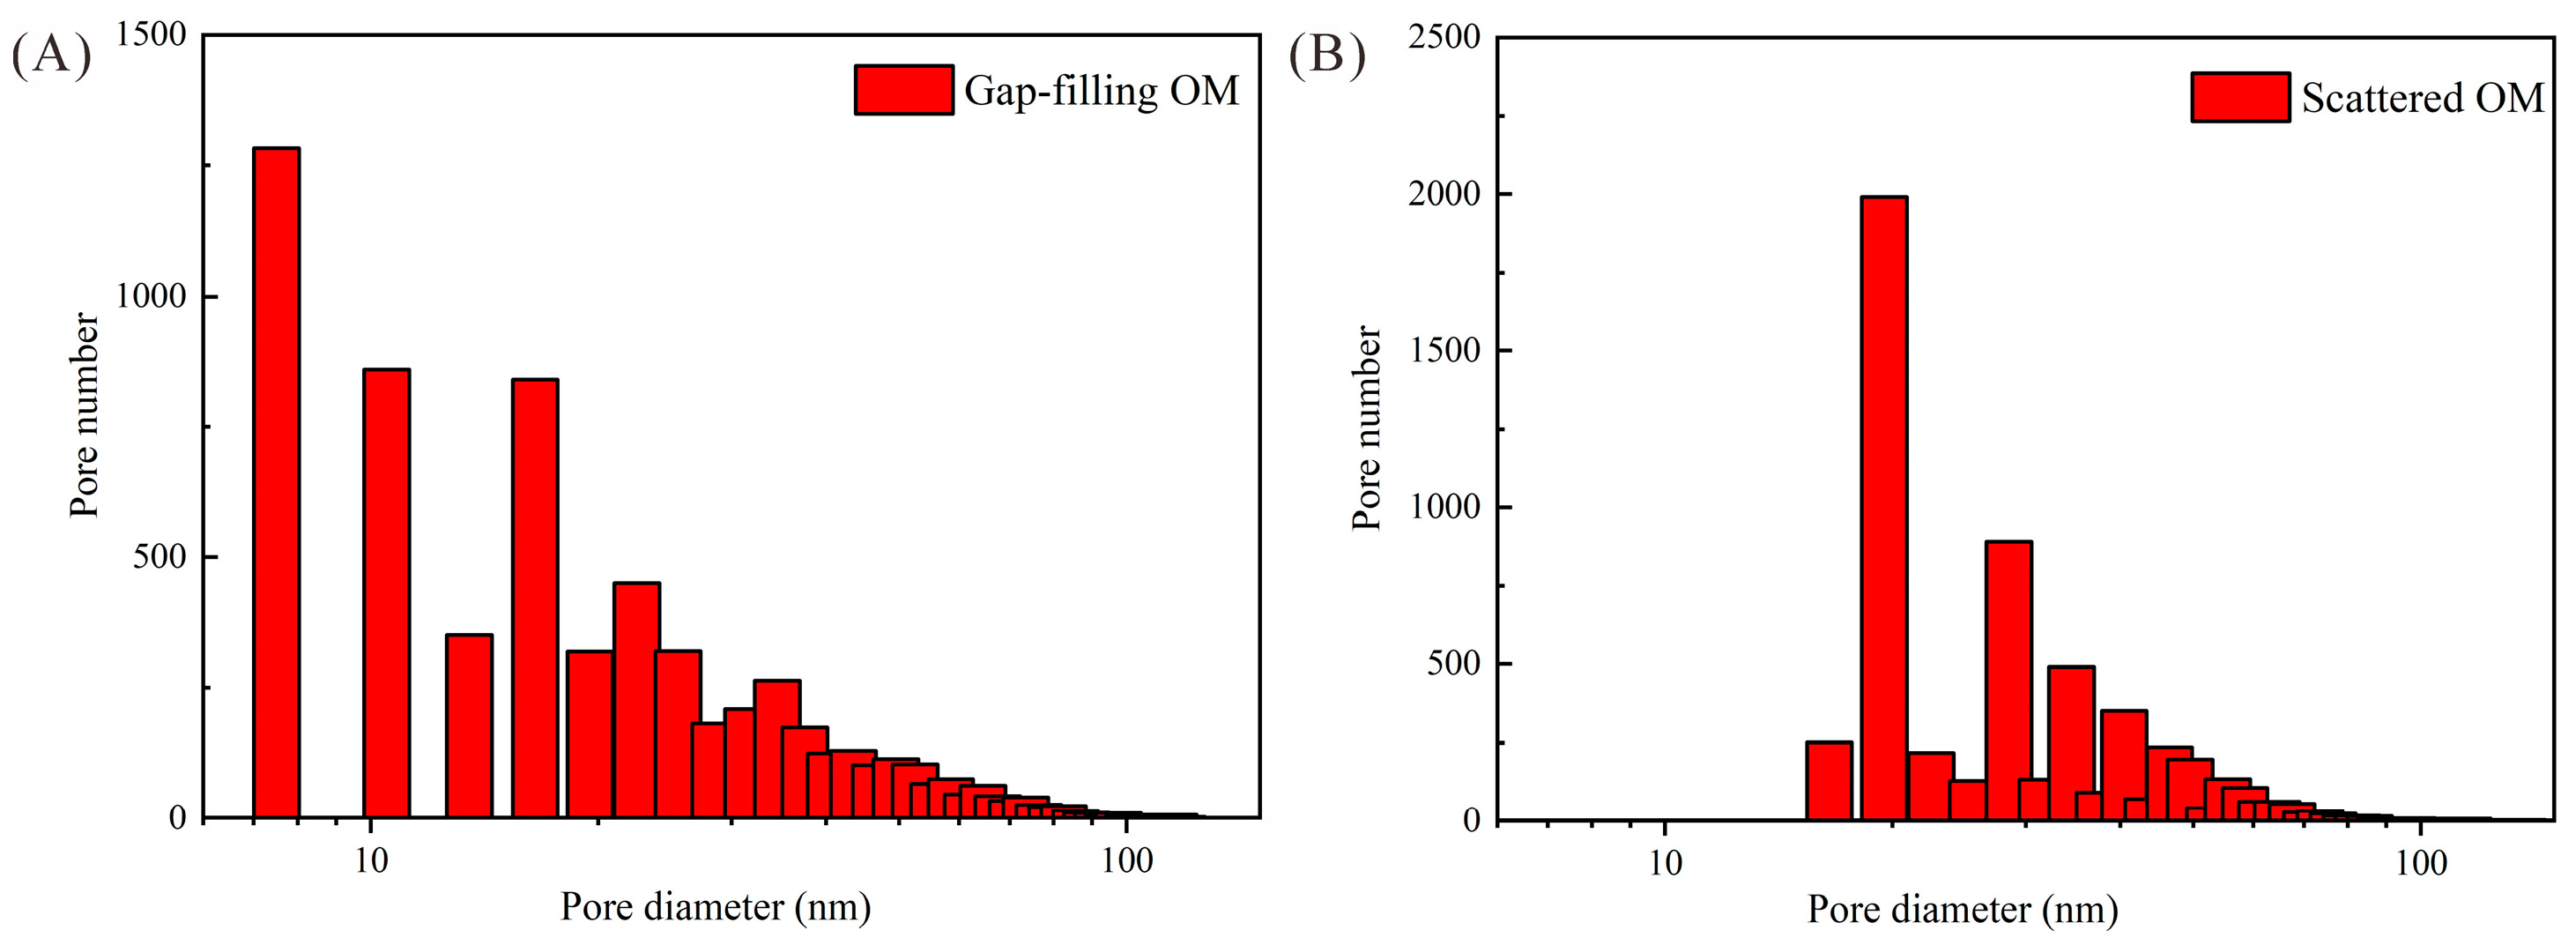
4.3.1. OM Pores
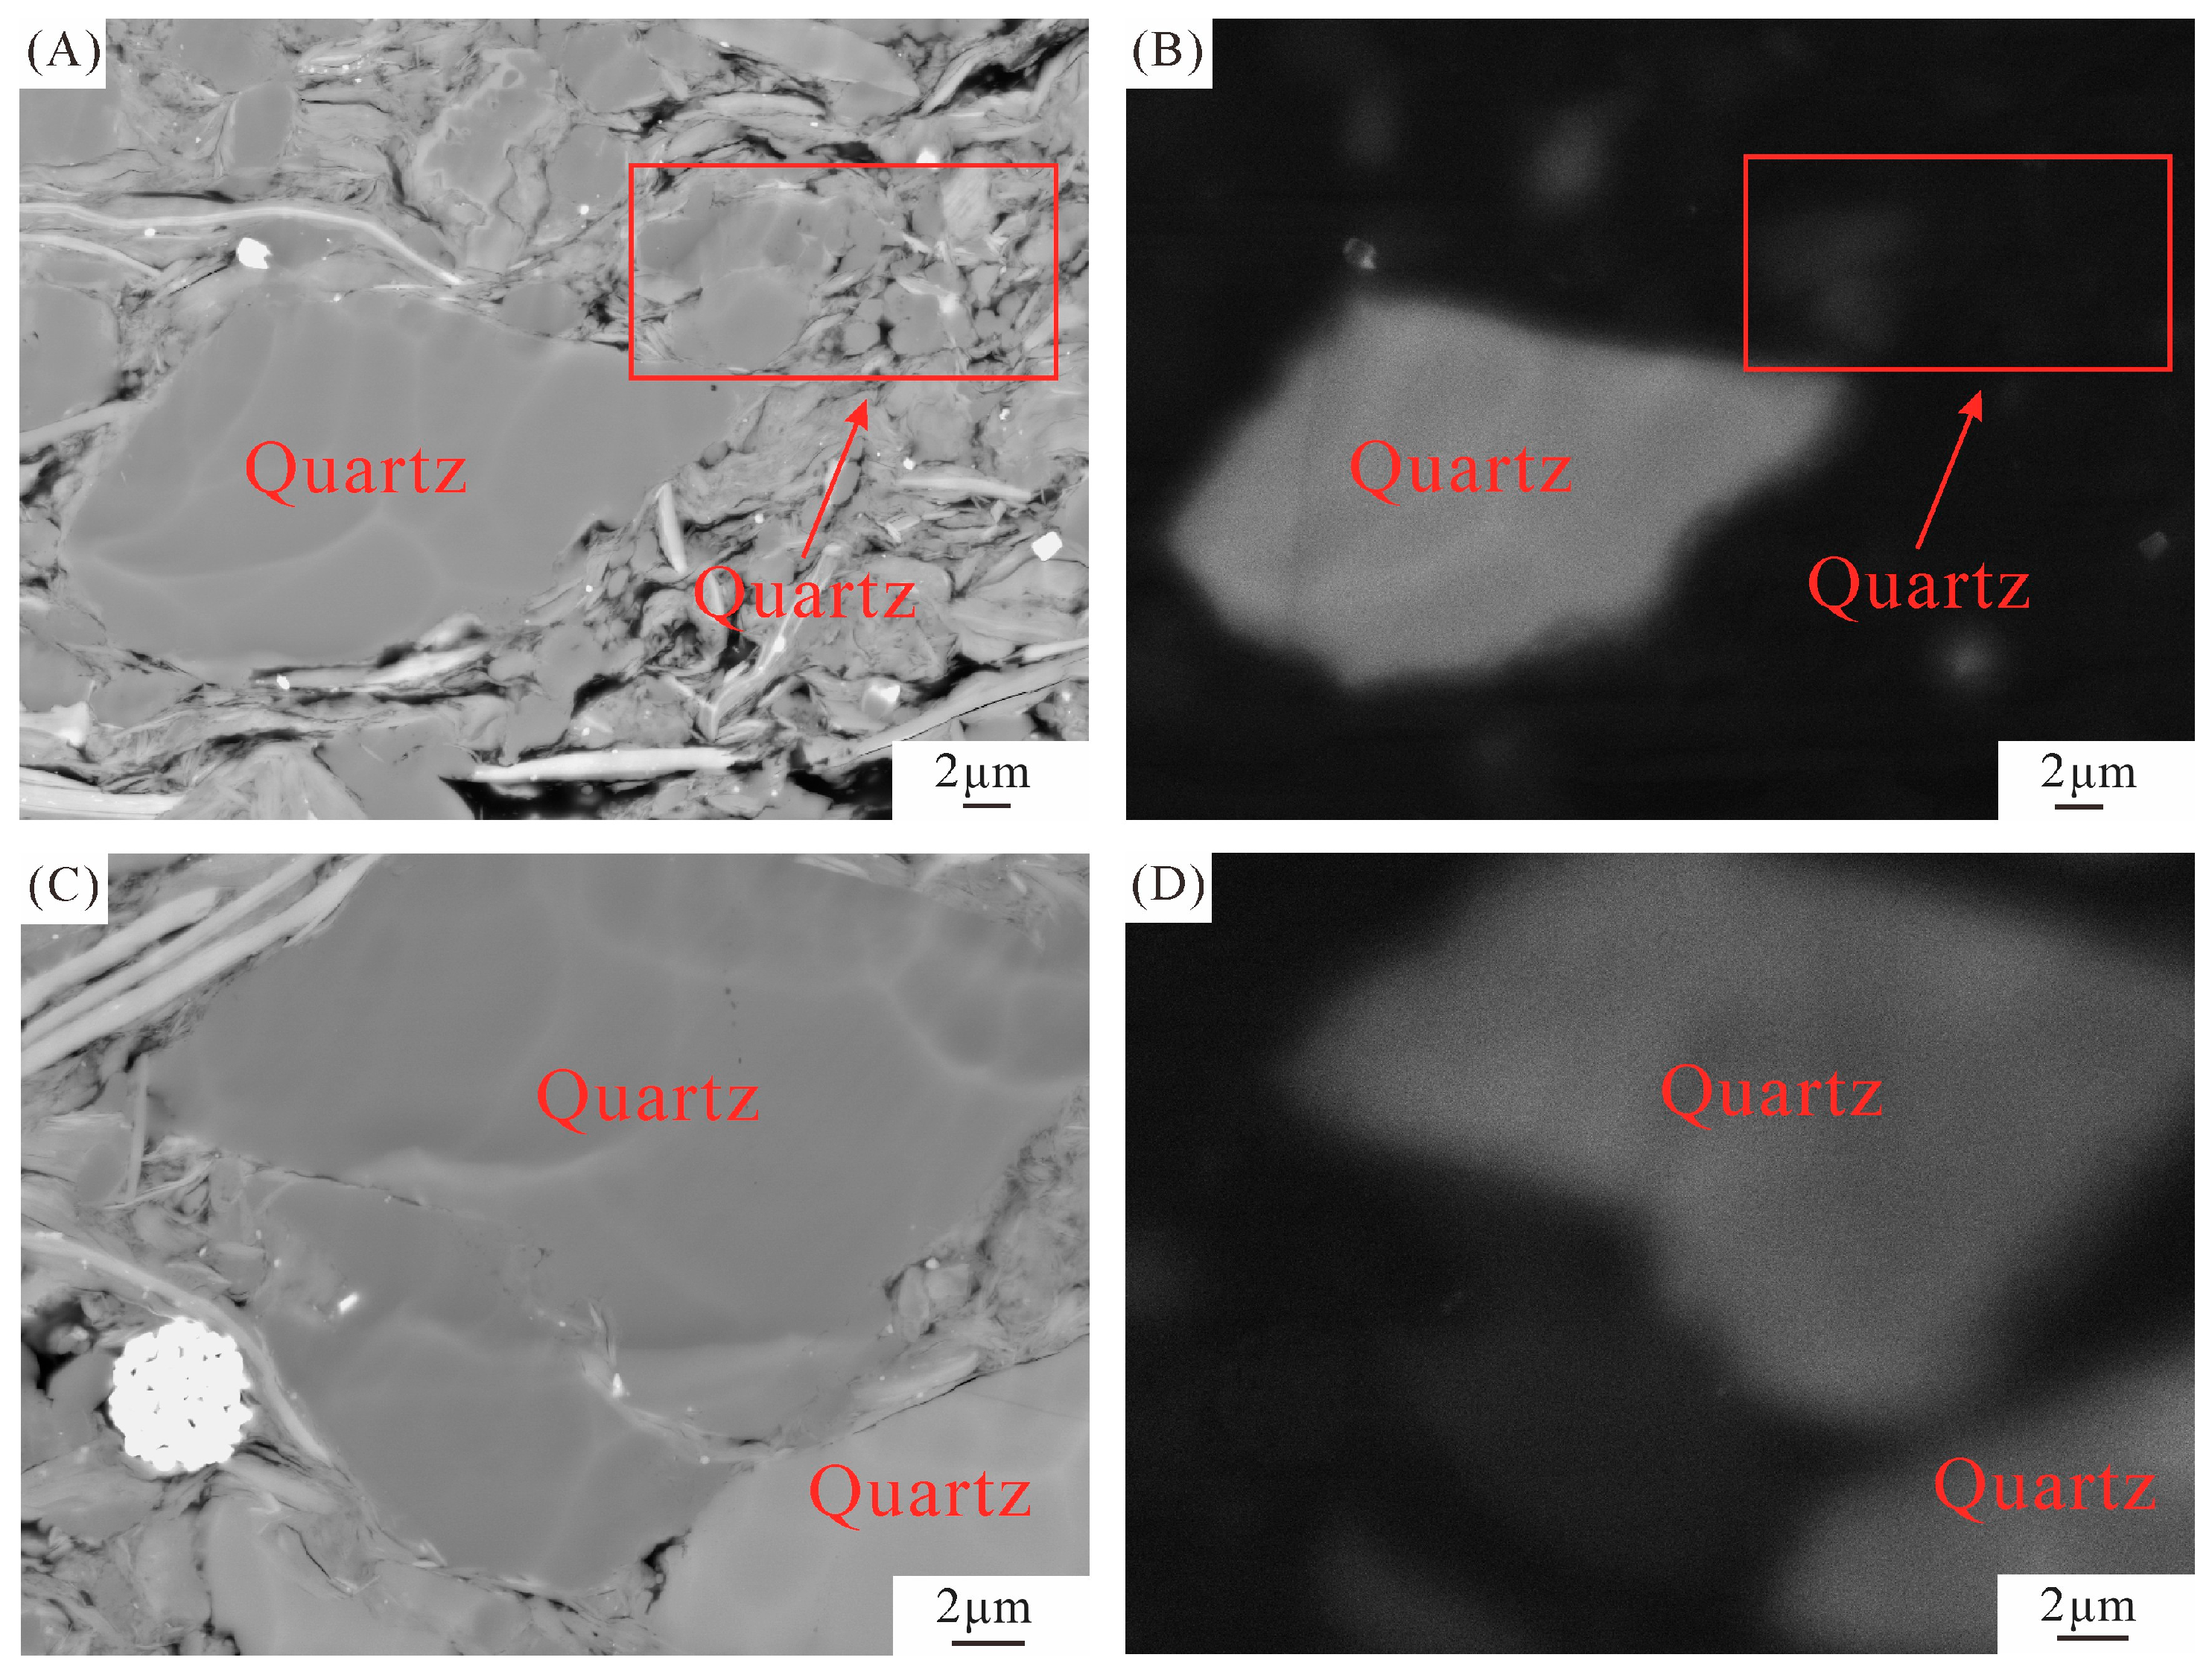
4.3.2. Inorganic Pores
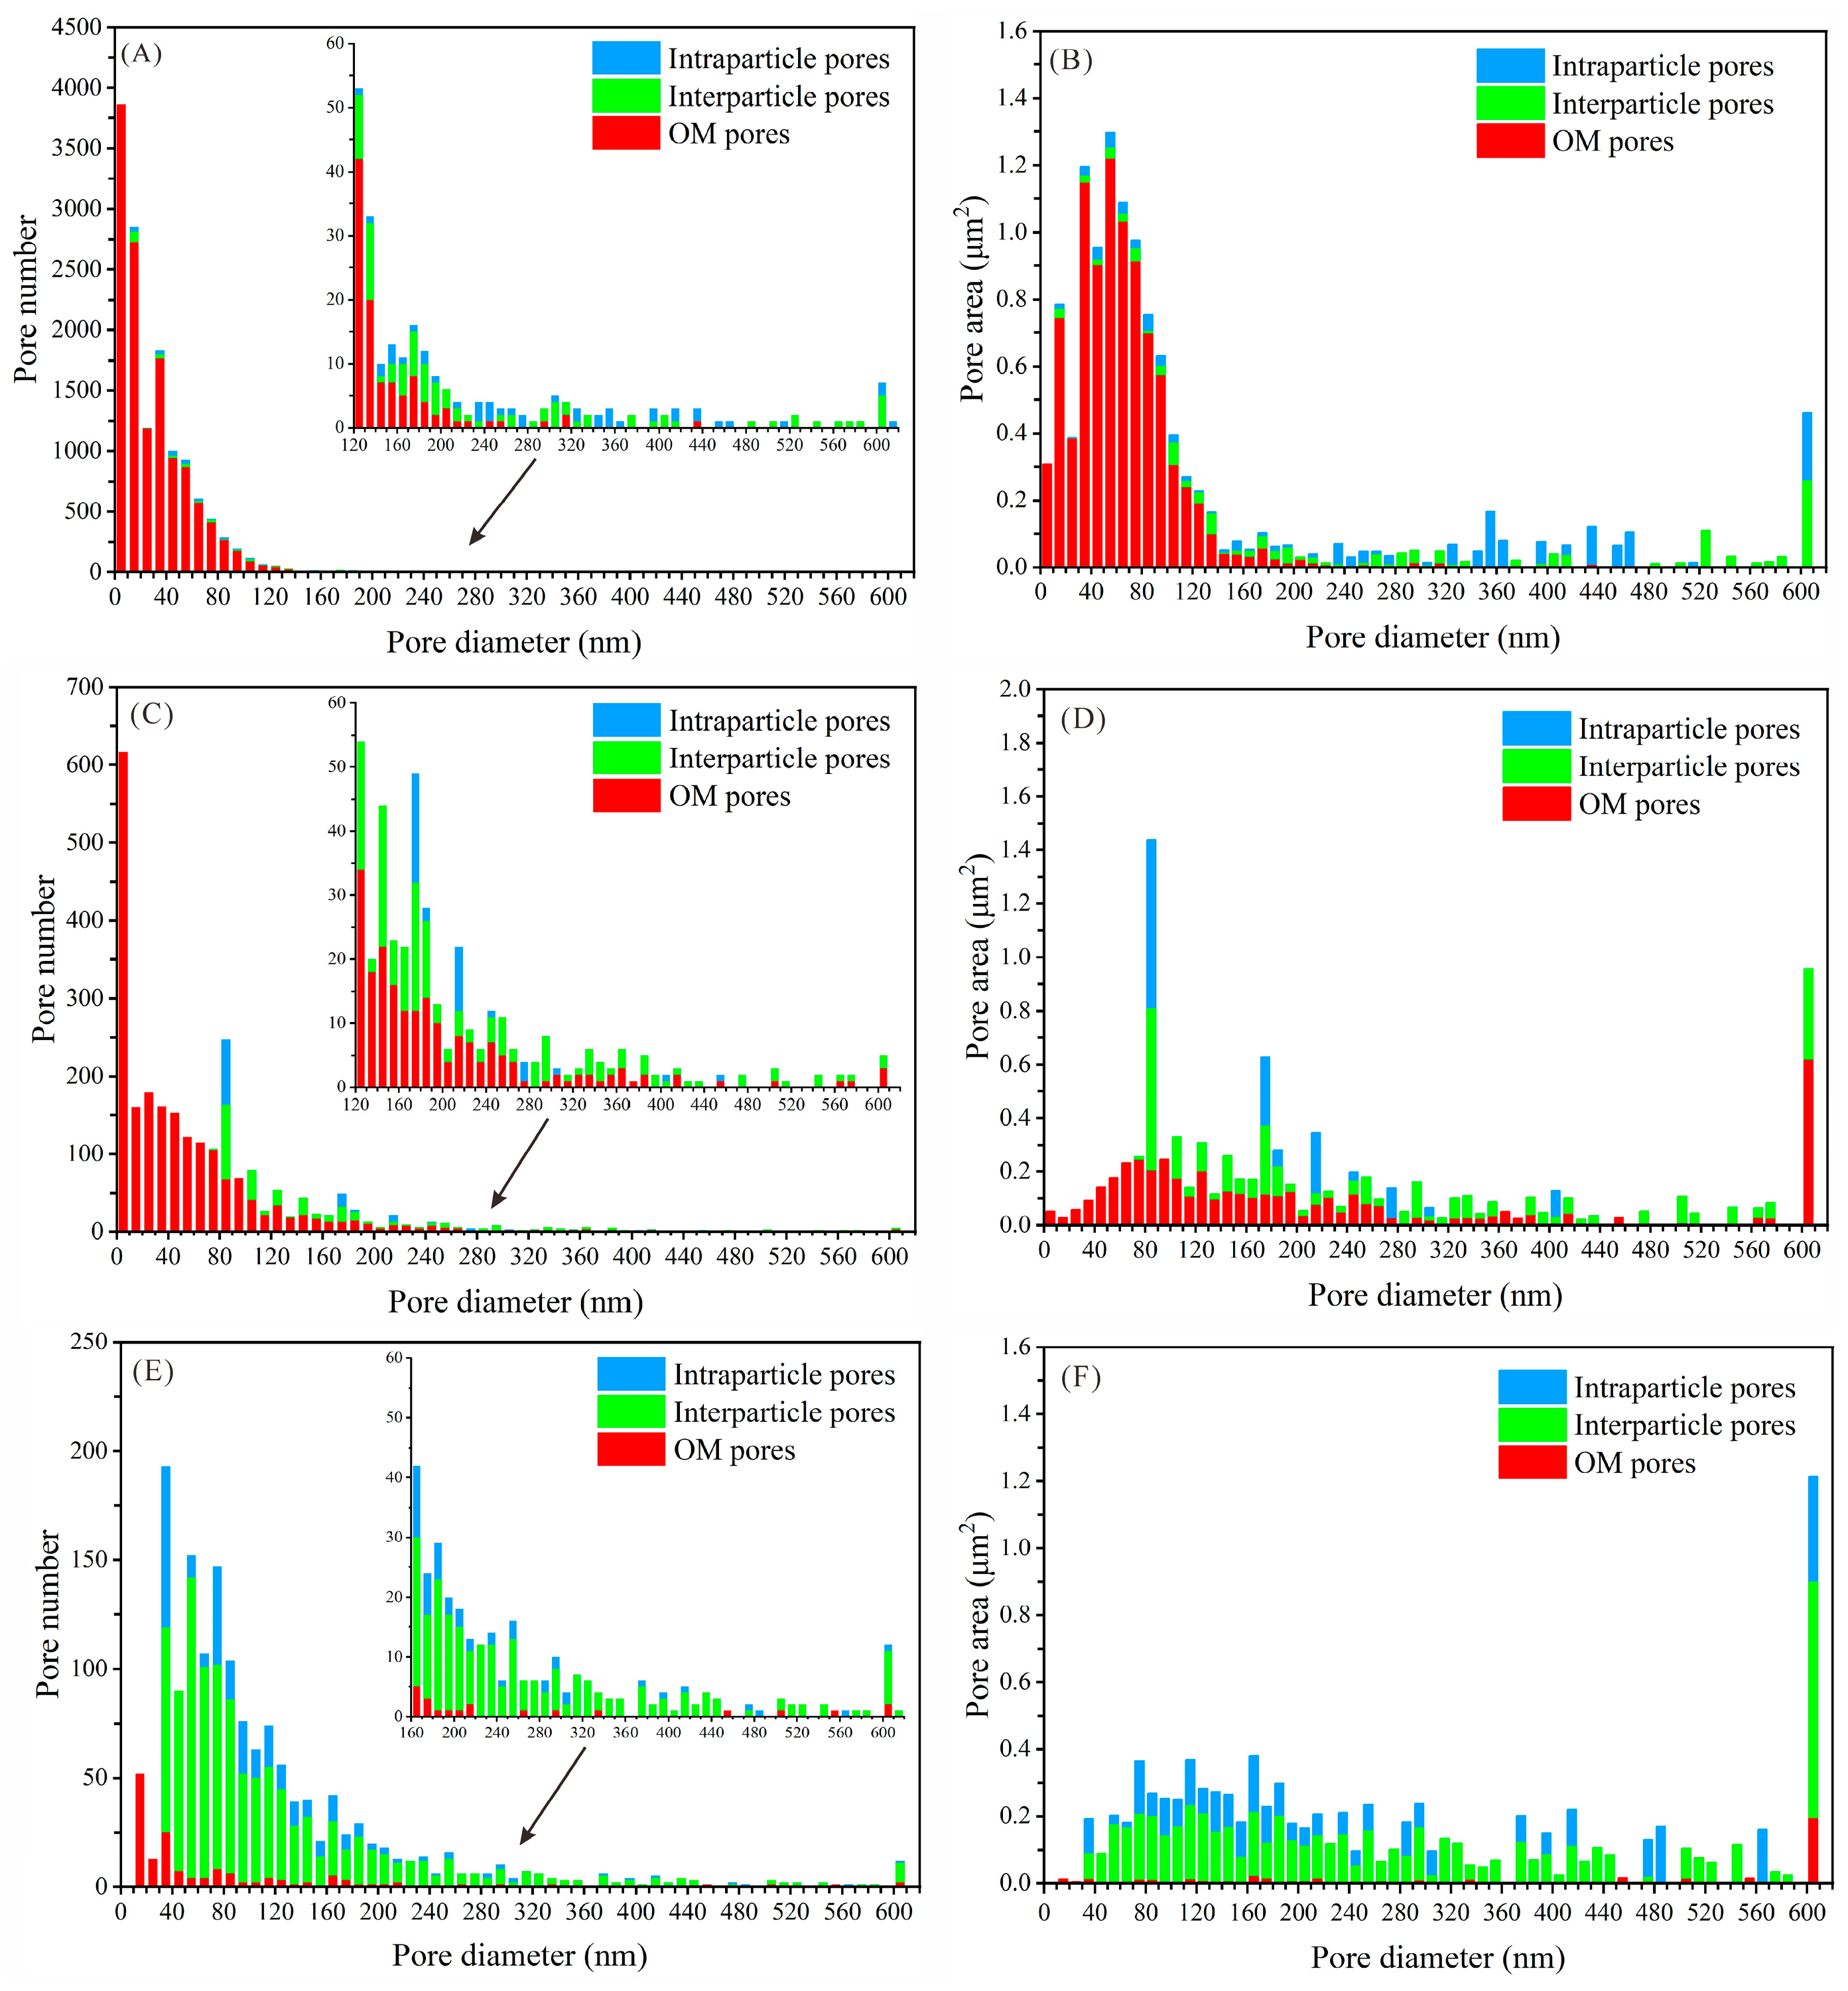
4.4. Characteristics of Pore Types under Sequence Stratigraphic Constraints
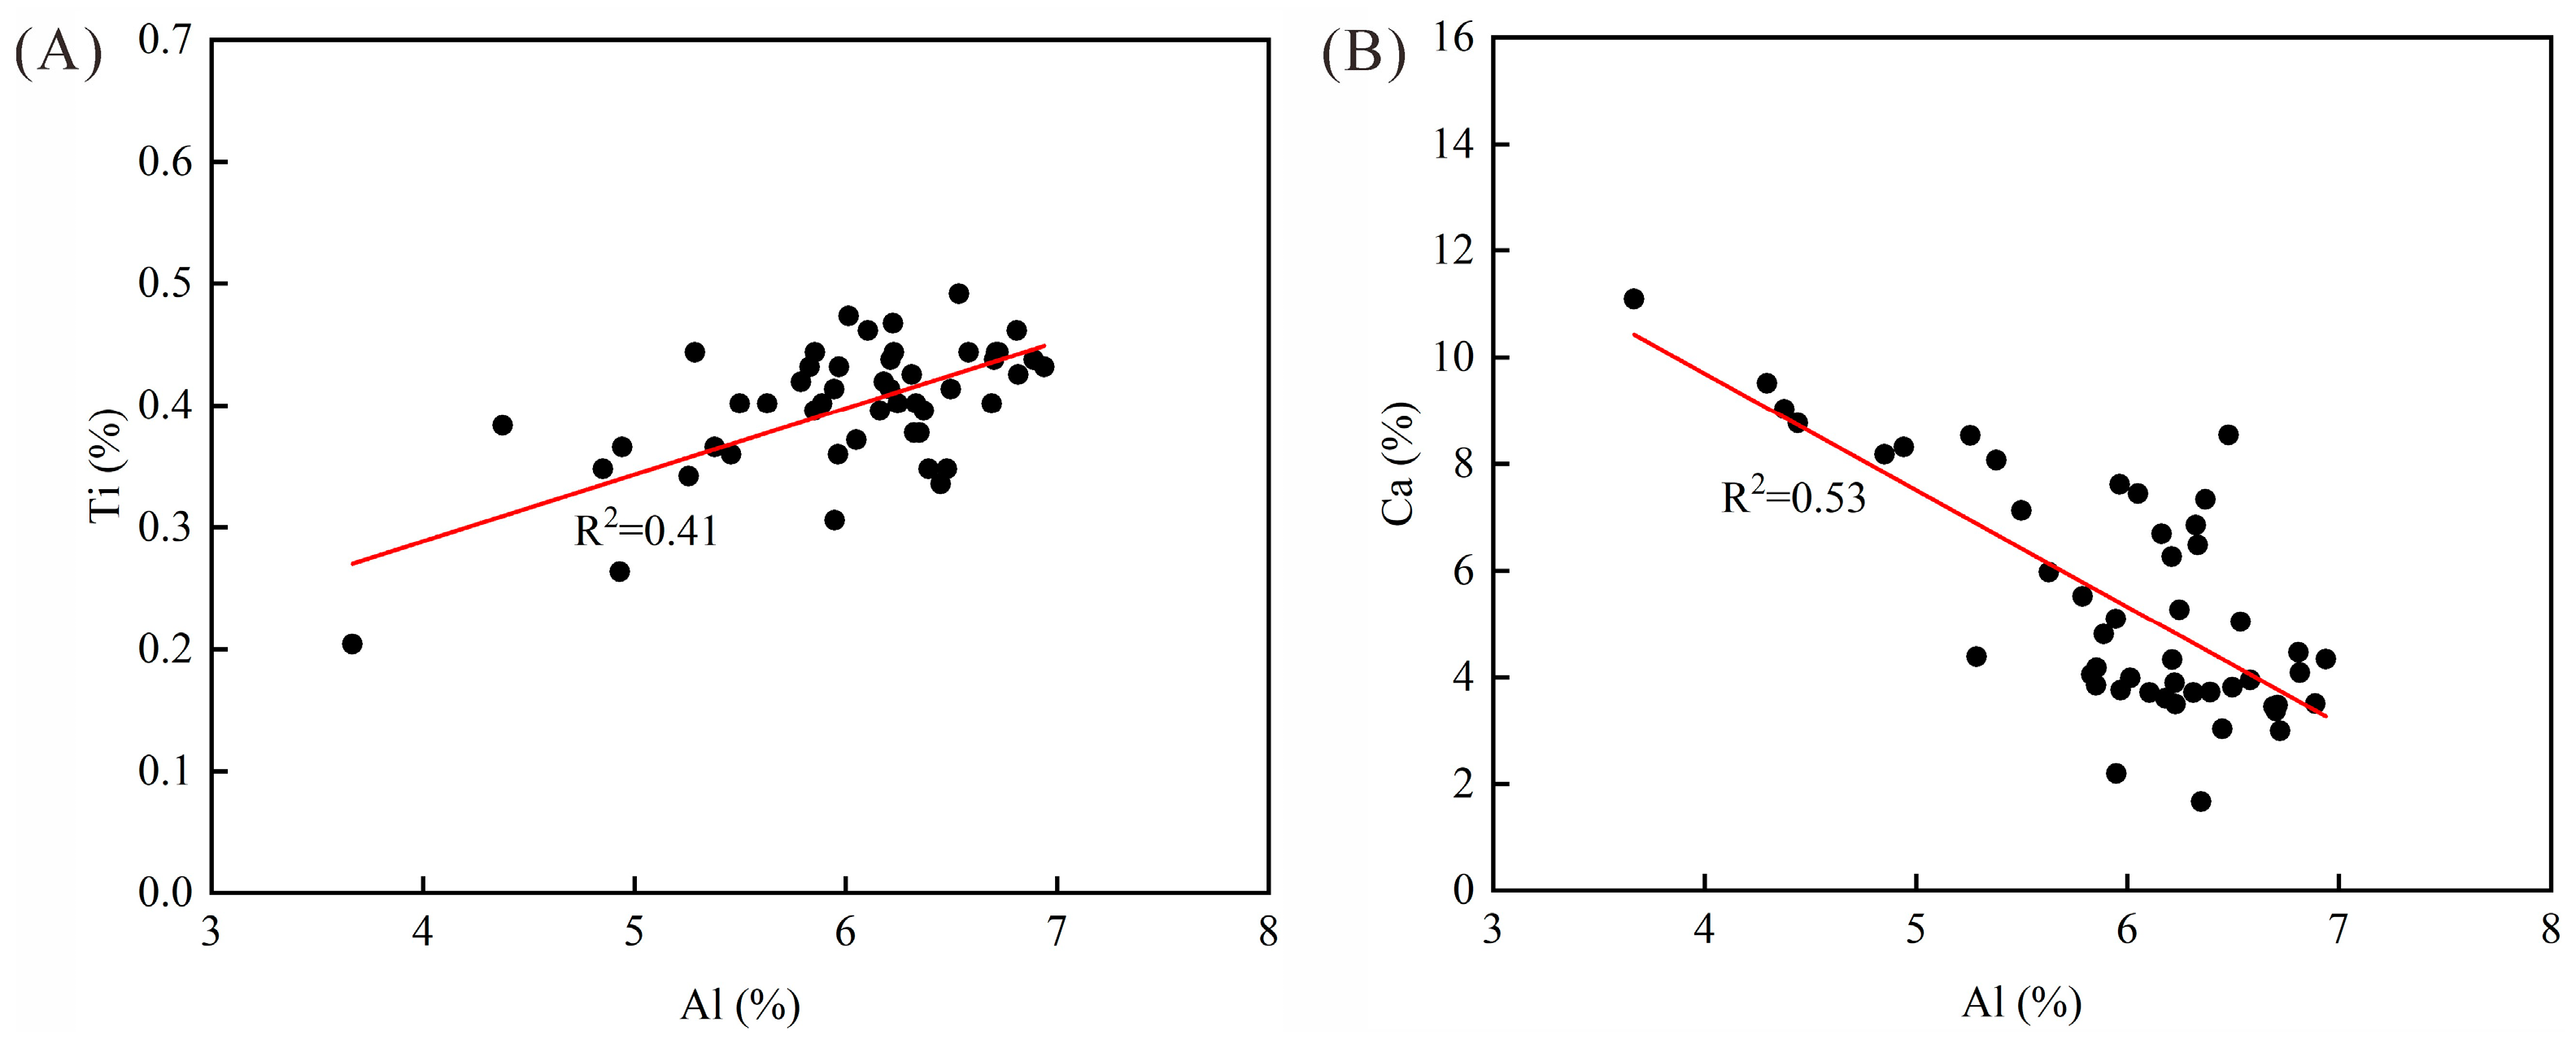
4.5. Major and Trace Elements
5. Discussion
5.1. Influence of the Depositional Environment on Organic Matter Accumulation and Mineralogical Composition
5.1.1. Influence of the Depositional Environment on Organic Matter Accumulation
5.1.2. Influence of the Depositional Environment on Mineralogical Composition
5.2. Relationship between Pore Types and Porosity
5.3. Formation and Evolution of Shale Pores in Different System Tracts
6. Conclusions
Author Contributions
Funding
Data Availability Statement
Acknowledgments
Conflicts of Interest
References
- Sohail, G.M.; Yasin, Q.; Radewan, A.E.; Emad, M.Z. Estimating hardness and Young’s modulus of shale using drill cuttings: Implications for hydraulic fracturing in shale gas reservoir development. Gas Sci. Eng. 2023, 118, 205116. [Google Scholar] [CrossRef]
- Malozyomov, B.V.; Martyushev, N.V.; Kukartsev, V.V.; Tynchenko, V.S.; Bukhtoyarov, V.V.; Wu, X.; Tyncheko, Y.A.; Kukartsev, V.A. Overview of Methods for Enhanced Oil Recovery from Conventional and Unconventional Reservoirs. Energies 2023, 16, 4907. [Google Scholar] [CrossRef]
- Fishman, N.S.; Hackley, P.C.; Lowers, H.A.; Hill, R.J.; Egenhoff, S.O.; Eberl, D.D.; Blum, A.E. The nature of porosity in organic-rich mudstones of the Upper Jurassic Kimmeridge Clay Formation, North Sea, offshore United Kingdom. Int. J. Coal Geol. 2012, 103, 32–50. [Google Scholar] [CrossRef]
- Milliken, K.L.; Rudnicki, M.; Awwiller, D.N.; Zhang, T. Organic matter-hosted pore system, Marcellus Formation (Devonian), Pennsylvania. AAPG Bull. 2013, 97, 177–200. [Google Scholar] [CrossRef]
- Ko, L.T.; Loucks, R.G.; Zhang, T.; Ruppel, S.C.; Shao, D. Pore and pore network evolution of Upper Cretaceous Boquillas (Eagle Ford-equivalent) mudrocks: Results from gold tube pyrolysis experiments. AAPG Bull. 2016, 100, 1693–1722. [Google Scholar] [CrossRef]
- Wang, P.F.; Jiang, Z.X.; Ji, W.M.; Zhang, C.; Yuan, Y.; Chen, L.; Yin, L.S. Heterogeneity of intergranular, intraparticle and organic pores in Longmaxi shale in Sichuan Basin, South China: Evidence from SEM digital images and fractal and multifractal geometries. Mar. Pet. Geol. 2016, 72, 122–138. [Google Scholar] [CrossRef]
- Nie, H.; Sun, C.; Liu, G.; Du, W.; He, Z. Dissolution pore types of the Wufeng Formation and the Longmaxi Formation in the Sichuan Basin, south China: Implications for shale gas enrichment. Mar. Pet. Geol. 2019, 101, 243–251. [Google Scholar] [CrossRef]
- Xiong, S.; Gao, Z.; Wei, W.; Wang, Y. Differential effects of pore structure of mineral and maceral components on the methane adsorption capacity evolution of the lower jurassic Da’anzhai member of the Ziliujing Formation lacustrine shale, Sichuan Basin, China. Mar. Pet. Geol. 2023, 147, 106017. [Google Scholar] [CrossRef]
- Loucks, R.G.; Reed, R.M.; Ruppel, S.C.; Jarvie, D.M. Morphology, Genesis, and Distribution of Nanometer-Scale Pores in Siliceous Mudstones of the Mississippian Barnett Shale. J. Sediment. Res. 2009, 79, 848–861. [Google Scholar] [CrossRef]
- Loucks, R.G.; Reed, R.M.; Ruppel, S.C.; Hammes, U. Spectrum of pore types and networks in mudrocks and a descriptive classification for matrix-related mudrock pores. AAPG Bull. 2012, 96, 1071–1098. [Google Scholar] [CrossRef]
- Xi, Z.; Tang, S.; Zhang, S.; Sun, K. Pore Structure Characteristics of Marine-Continental Transitional Shale: A Case Study in the Qinshui Basin, China. Energy Fuels 2017, 31, 7854–7866. [Google Scholar] [CrossRef]
- Li, Y.; Schieber, J.; Fan, T.; Wei, X. Pore characterization and shale facies analysis of the Ordovician-Silurian transition of northern Guizhou, South China: The controls of shale facies on pore distribution. Mar. Pet. Geol. 2018, 92, 697–718. [Google Scholar] [CrossRef]
- Wang, Q.; Wang, T.; Liu, W.; Zhang, J.; Feng, Q.; Lu, H.; Peng, P. Relationships among composition, porosity and permeability of Longmaxi Shale reservoir in the Weiyuan Block, Sichuan Basin, China. Mar. Pet. Geol. 2019, 102, 33–47. [Google Scholar] [CrossRef]
- Cao, T.; Xu, H.; Liu, G.; Deng, M.; Cao, Q.; Yu, Y. Factors influencing microstructure and porosity in shales of the Wufeng-Longmaxi formations in northwestern Guizhou, China. J. Pet. Sci. Eng. 2020, 191, 107181. [Google Scholar] [CrossRef]
- Xi, Z.; Tang, S.; Lash, G.G.; Ye, Y.; Lin, D.; Zhang, B. Depositional controlling factors on pore distribution and structure in the lower Silurian Longmaxi shales: Insight from geochemistry and petrology. Mar. Pet. Geol. 2021, 130, 105114. [Google Scholar] [CrossRef]
- Gao, P.; Xiao, X.M.; Hu, D.F.; Lash, G.G.; Liu, R.B.; Cai, Y.D.; Wang, Z.H.; Zhang, B.Y.; Yuan, T.; Liu, S.Y. Effect of silica diagenesis on porosity evolution of deep gas shale reservoir of the Lower Paleozoic Wufeng–Longmaxi formations, Sichuan Basin. Mar. Pet. Geol. 2022, 145, 105873. [Google Scholar] [CrossRef]
- Liu, J.; Zhu, Y.M.; Shang, F.H.; Feng, G.J.; Liu, Y.; Gao, B.; Li, S.K.; Kuang, F.F. Pore System Diversity and Control Factors of High-Overmature Shale-Taking the Lujiaping and Longmaxi Formation Shales as an Example. Energy Fuels 2023, 37, 9047–9065. [Google Scholar] [CrossRef]
- De Boer, J.H. The Structure and Properties of Porous Materials; Butterworth-Heinemann: London, UK, 1958. [Google Scholar]
- Liu, J.; Li, P.; Sun, Z.; Lu, Z.; Du, Z.; Liang, H.; Lu, D. A new method for analysis of dual pore size distributions in shale using nitrogen adsorption measurements. Fuel 2017, 210, 446–454. [Google Scholar] [CrossRef]
- Zhang, Q.; Liu, Y.; Wang, B.; Ruan, J.; Yan, N.; Chen, H.; Wang, Q.; Jia, G.; Wang, R.; Liu, H.; et al. Effects of pore-throat structures on the fluid mobility in chang 7 tight sandstone reservoirs of longdong area, Ordos Basin. Mar. Pet. Geol. 2022, 135, 105407. [Google Scholar] [CrossRef]
- Chen, Q.; Zhang, J.; Tang, X.; Li, W.; Li, Z. Relationship between pore type and pore size of marine shale: An example from the Sinian–Cambrian formation, upper Yangtze region, South China. Int. J. Coal Geol. 2016, 158, 13–28. [Google Scholar] [CrossRef]
- Liu, K.; Ostadhassan, M.; Gentzis, T.; Fowler, H. Image analysis of the pore structures: An intensive study for Middle Bakken. J. Nat. Gas Sci. Eng. 2019, 61, 32–45. [Google Scholar] [CrossRef]
- Chandra, D.; Vishal, V.; Debbarma, A.; Banerjee, S.; Pradhan, S.P.; Mishra, M.K. Role of Composition and Depth on Pore Attributes of Barakar Formation Gas Shales of Ib Valley, India, Using a Combination of Low-Pressure Sorption and Image Analysis. Energy Fuels 2020, 34, 8085–8098. [Google Scholar] [CrossRef]
- Hui, S.; Pang, X.; Chen, Z.; Hu, T.; Shi, K.; Di, G.; Li, M.; Mei, S.; Li, M. Quantifying the relative contribution and evolution of pore types to shale reservoir space: Constraints from over-mature marine shale in the Sichuan Basin, SW China. J. Asian Earth Sci. 2023, 249, 105625. [Google Scholar] [CrossRef]
- Chen, J.; Xiao, X. Evolution of nanoporosity in organic-rich shales during thermal maturation. Fuel 2014, 129, 173–181. [Google Scholar] [CrossRef]
- Jiang, F.; Chen, D.; Chen, J.; Li, Q.; Liu, Y.; Shao, X.; Hu, T.; Dai, J. Fractal Analysis of Shale Pore Structure of Continental Gas Shale Reservoir in the Ordos Basin, NW China. Energy Fuels 2016, 30, 4676–4689. [Google Scholar] [CrossRef]
- Teng, J.; Liu, B.; Mastalerz, M.; Schieber, J. Origin of organic matter and organic pores in the overmature Ordovician-Silurian Wufeng-Longmaxi Shale of the Sichuan Basin, China. Int. J. Coal Geol. 2022, 253, 103970. [Google Scholar] [CrossRef]
- Zhang, W.T.; Hu, W.X.; Borjigin, T.; Zhu, F. Pore characteristics of different organic matter in black shale: A case study of the Wufeng-Longmaxi Formation in the Southeast Sichuan Basin, China. Mar. Pet. Geol. 2020, 111, 33–43. [Google Scholar] [CrossRef]
- Hao, F.; Zou, H.; Lu, Y. Mechanisms of shale gas storage: Implications for shale gas exploration in China. AAPG Bull. 2013, 97, 1325–1346. [Google Scholar] [CrossRef]
- Dai, J.; Zou, C.; Liao, S.; Dong, D.; Ni, Y.; Huang, J.; Wu, W.; Gong, D.; Huang, S.; Hu, G. Geochemistry of the extremely high thermal maturity Longmaxi shale gas, southern Sichuan Basin. Org. Geochem. 2014, 74, 3–12. [Google Scholar] [CrossRef]
- Wu, J.G.; Yuan, Y.; Niu, S.Y.; Wei, X.F.; Yang, J.J. Multiscale characterization of pore structure and connectivity of Wufeng–Longmaxi shale in Sichuan Basin, China. Mar. Pet. Geol. 2020, 120, 104514. [Google Scholar] [CrossRef]
- Knapp, L.J.; Ardakani, O.H.; Uchida, S.; Nanjo, T.; Otomo, C.; Hattori, T. The influence of rigid matrix minerals on organic porosity and pore size in shale reservoirs: Upper Devonian Duvernay Formation, Alberta, Canada. Int. J. Coal Geol. 2020, 227, 103525. [Google Scholar] [CrossRef]
- Zhao, J.; Jin, Z.; Jin, Z.; Wen, X.; Geng, Y. Origin of authigenic quartz in organic-rich shales of the Wufeng and Longmaxi Formations in the Sichuan Basin, South China: Implications for pore evolution. J. Nat. Gas Sci. Eng. 2017, 38, 21–38. [Google Scholar] [CrossRef]
- Xi, Z.; Tang, S.; Zhang, S.; Yi, Y.; Dang, F.; Ye, Y. Characterization of quartz in the Wufeng Formation in northwest Hunan Province, south China and its implications for reservoir quality. J. Pet. Sci. Eng. 2019, 179, 979–996. [Google Scholar] [CrossRef]
- Xi, Z.; Tang, S.; Zhang, S.; Ye, Y. Factors Controlling Organic Matter Accumulation in the Wufeng-Longmaxi Formations in Northwestern Hunan Province: Insights from Major/Trace Elements and Shale Composition. Energy Fuels 2020, 34, 4139–4152. [Google Scholar] [CrossRef]
- Dong, T.; He, S.; Chen, M.F.; Hou, Y.G.; Guo, X.W.; Wei, C.; Han, Y.J.; Yang, R. Quartz types and origins in the paleozoic Wufeng-Longmaxi Formations, Eastern Sichuan Basin, China: Implications for porosity preservation in shale reservoirs. Mar. Pet. Geol. 2019, 106, 62–73. [Google Scholar] [CrossRef]
- Wang, Y.; Xu, S.; Hao, F.; Zhang, B.; Shu, Z.; Gou, Q.; Lu, Y.; Cong, F. Multiscale petrographic heterogeneity and their implications for the nanoporous system of the Wufeng–Longmaxi shales in Jiaoshiba area, Southeast China: Response to depositional-diagenetic process. GSA Bull. 2019, 132, 1704–1721. [Google Scholar] [CrossRef]
- Phaye, D.K.; Bhattacharya, B.; Chakrabarty, S. Heterogeneity characterization from sequence stratigraphic analysis of Paleocene-Early Eocene Cambay Shale formation in Jambusar-Broach area, Cambay Basin, India. Mar. Pet. Geol. 2021, 128, 104986. [Google Scholar] [CrossRef]
- Crombez, V.; Baudin, F.; Rohais, S.; Riquier, L.; Euzen, T.; Pauthier, S.; Ducros, M.; Caron, B.; Vaisblat, N. Basin scale distribution of organic matter in marine fine-grained sedimentary rocks: Insight from sequence stratigraphy and multi-proxies analysis in the Montney and Doig Formations. Mar. Pet. Geol. 2017, 83, 382–401. [Google Scholar] [CrossRef]
- Arthur, M.A.; Sageman, B.B. Marine black shales—Depositional mechanisms and environments of ancient-deposits. Annu. Rev. Earth Planet. Sci. 1994, 22, 499–551. [Google Scholar] [CrossRef]
- Chen, L.; Lu, Y.; Jiang, S.; Li, J.; Guo, T.; Luo, C. Heterogeneity of the Lower Silurian Longmaxi marine shale in the southeast Sichuan Basin of China. Mar. Pet. Geol. 2015, 65, 232–246. [Google Scholar] [CrossRef]
- Byun, U.H.; Lee, H.S.; Kwon, Y.K. Sequence stratigraphy in the middle Ordovician shale successions, mid-east Korea: Stratigraphic variations and preservation potential of organic matter within a sequence stratigraphic framework. J. Asian Earth Sci. 2018, 152, 116–131. [Google Scholar] [CrossRef]
- Dong, T.; Harris, N.B.; Ayranci, K. Relative sea-level cycles and organic matter accumulation in shales of the Middle and Upper Devonian Horn River Group, northeastern British Columbia, Canada: Insights into sediment flux, redox conditions, and bioproductivity. Geol. Soc. Am. Bull. 2018, 130, 859–880. [Google Scholar] [CrossRef]
- Kunzmann, M.; Schmid, S.; Blaikie, T.N.; Halverson, G.P. Facies analysis, sequence stratigraphy, and carbon isotope chemostratigraphy of a classic Zn-Pb host succession: The Proterozoic middle McArthur Group, McArthur Basin, Australia. Ore Geol. Rev. 2019, 106, 150–175. [Google Scholar] [CrossRef]
- Liu, B.; Schieber, J.; Mastalerz, M.; Teng, J. Organic matter content and type variation in the sequence stratigraphic context of the Upper Devonian New Albany Shale, Illinois Basin. Sediment. Geol. 2019, 383, 101–120. [Google Scholar] [CrossRef]
- Creaney, S.; Passey, Q.R. Recurring patterns of total organic carbon and source rock quality within a sequence stratigraphic framework. AAPG Bull. 1993, 77, 386–401. [Google Scholar]
- Xu, C.; Rong, J.Y.; Yue, L.; Boucot, A.J. Facies patterns and geography of the Yangtze region, South China, through the Ordovician and Silurian transition. Paleogeogr. Paleoclimatol. Paleoecol. 2004, 204, 353–372. [Google Scholar] [CrossRef]
- Nie, H.; Zhang, B.; Liu, G.; Yan, C.; Li, D.; Lu, Z.; Zhang, G. Geological factors contributing to high shale gas yield in the Wufeng-Longmaxi Fms of Sichuan Basin:A case study of Well JY6-2HF in Fuling shale gas field. Oil Gas Geol. 2020, 41, 463–473. [Google Scholar]
- Ma, Y.; Cai, X.; Zhao, P. China’s shale gas exploration and development: Understanding and practice. Petroleum Explor. Dev. 2018, 45, 589–603. [Google Scholar] [CrossRef]
- Ye, Y.P.; Tang, S.H.; Xi, Z.D.; Jiang, D.X.; Duan, Y. Quartz types in the Wufeng–Longmaxi Formations in southern China: Implications for porosity evolution and shale brittleness. Mar. Pet. Geol. 2022, 137, 105479. [Google Scholar] [CrossRef]
- Bosikov, I.I.I.; Martyushev, N.V.V.; Klyuev, R.V.V.; Tynchenko, V.S.S.; Kukartsev, V.A.A.; Eremeeva, S.V.V.; Karlina, A.I.I. Complex Assessment of X-ray Diffraction in Crystals with Face-Centered Silicon Carbide Lattice. Crystals 2023, 13, 528. [Google Scholar] [CrossRef]
- Li, J.; Tang, S.H.; Zhang, S.H.; Xi, Z.D.; Yang, N.; Yang, G.Q.; Li, L.; Li, Y.P. Paleo-environmental conditions of the Early Cambrian Niutitang Formation in the Fenggang area, the southwestern margin of the Yangtze Platform, southern China: Evidence from major elements, trace elements and other proxies. J. Asian Earth Sci. 2018, 159, 81–97. [Google Scholar] [CrossRef]
- Xi, Z.D.; Tang, S.H.; Lash, G.G.; Zhang, B.; Lin, D.L. Geochemical characteristics of organic carbon and pyrite sulfur in Ordovician–Silurian transition shales in the Yangtze Platform, South China: Implications for the depositional environment. Paleogeogr. Paleoclimatol. Paleoecol. 2021, 563, 110173. [Google Scholar] [CrossRef]
- Sun, W.; Zuo, Y.; Wu, Z.; Liu, H.; Xi, S.; Shui, Y.; Wang, J.; Liu, R.; Lin, J. Fractal analysis of pores and the pore structure of the Lower Cambrian Niutitang shale in northern Guizhou province: Investigations using NMR, SEM and image analyses. Mar. Pet. Geol. 2019, 99, 416–428. [Google Scholar] [CrossRef]
- Tribovillard, N.; Algeo, T.J.; Lyons, T.; Riboulleau, A. Trace metals as paleoredox and paleoproductivity proxies: An update. Chem. Geol. 2006, 232, 12–32. [Google Scholar] [CrossRef]
- Neubert, N.; Nagler, T.F.; Bottcher, M.E. Sulfidity controls molybdenum isotope fractionation into euxinic sediments: Evidence from the modern Black Sea. Geology 2008, 36, 775–778. [Google Scholar] [CrossRef]
- Mclennan, S.M. Relationships between the trace element composition of sedimentary rocks and upper continental crust. Geochem. Geophys. Geosyst. 2001, 2. [Google Scholar] [CrossRef]
- Scott, C.; Lyons, T.W. Contrasting molybdenum cycling and isotopic properties in euxinic versus non-euxinic sediments and sedimentary rocks: Refining the paleoproxies. Chem. Geol. 2012, 324, 19–27. [Google Scholar] [CrossRef]
- Algeo, T.J.; Maynard, J.B. Trace-element behavior and redox facies in core shales of Upper Pennsylvanian Kansas-type cyclothems. Chem. Geol. 2004, 206, 289–318. [Google Scholar] [CrossRef]
- Brumsack, H.J. The trace metal content of recent organic carbon-rich sediments: Implications for Cretaceous black shale formation. Paleogeogr. Paleoclimatol. Paleoecol. 2006, 232, 344–361. [Google Scholar] [CrossRef]
- Ross, D.; Bustin, R.M. Sediment geochemistry of the Lower Jurassic Gordondale Member, northeastern British Columbia. Bull. Can. Pet. Geol. 2006, 54, 337–365. [Google Scholar] [CrossRef]
- Zhao, J.H.; Jin, Z.J.; Jin, Z.K.; Hu, Q.H.; Hu, Z.Q.; Du, W.; Yan, C.N.; Geng, Y.K. Mineral types and organic matters of the Ordovician-Silurian Wufeng and Longmaxi Shale in the Sichuan Basin, China: Implications for pore systems, diagenetic pathways, and reservoir quality in fine-grained sedimentary rocks. Mar. Pet. Geol. 2017, 86, 655–674. [Google Scholar] [CrossRef]
- Niu, X.; Yan, D.T.; Zhuang, X.G.; Liu, Z.X.; Li, B.Q.; Wei, X.S.; Xu, H.W.; Li, D.W. Origin of quartz in the lower Cambrian Niutitang Formation in south Hubei Province, upper Yangtze platform. Mar. Pet. Geol. 2018, 96, 271–287. [Google Scholar] [CrossRef]
- Yuan, X.; Guo, Y.; Yu, J.; Shen, Y.; Shao, Y. Correlation and analysis of well-log sequence with Milankovitch cycles as rulers: A case study of coal-bearing strata of late Permian in western Guizhou. Int. J. Min. Sci. Technol. 2013, 23, 563–568. [Google Scholar] [CrossRef]
- Zhao, W.; Jiang, Z.; Qiu, L.; Chen, Y. Geological concept, method and application of sequence unit identification through wavelet analysis. Oil Gas Geol. 2010, 31, 436–441. [Google Scholar]
- Yu, J.; Li, Z. Wavelet Transform of Logging Data and Its Geological Significance. J. China Univ. Min. Technol. 2003, 32, 336–339. [Google Scholar]
- Deng, H. Discussion on problems of applying high resolution sequence stratigraphy. J. Palaeogeogr. 2009, 11, 471–480. [Google Scholar]
- Zhao, Z.; Chen, X.; Pan, M.; Wu, X.; Zheng, X.; Pan, W. Milankovitch Cycles in the Upper Ordovician Lianglitage Formation in the Tazhong-Bachu Area, Tarim Basin. Acta Geol. Sin. 2010, 84, 518–536. [Google Scholar]
- Yang, C.; Xiong, Y.; Zhang, J. A comprehensive re-understanding of the OM-hosted nanopores in the marine Wufeng-Longmaxi shale formation in South China by organic petrology, gas adsorption, and X-ray diffraction studies. Int. J. Coal Geol. 2020, 218, 103362. [Google Scholar] [CrossRef]
- Delle Piane, C.; Ansari, H.; Li, Z.; Mata, J.; Rickard, W.; Pini, R.; Dewhurst, D.N.; Sherwood, N. Influence of organic matter type on porosity development in the Wufeng–Longmaxi Shale: A combined microscopy, neutron scattering and physisorption approach. Int. J. Coal Geol. 2022, 249, 103880. [Google Scholar] [CrossRef]
- Li, X.; Jiang, Z.; Wang, P.; Song, Y.; Li, Z.; Tang, X.; Li, T.; Zhai, G.; Bao, S.; Xu, C.; et al. Porosity-preserving mechanisms of marine shale in Lower Cambrian of Sichuan Basin, South China. J. Nat. Gas Sci. Eng. 2018, 55, 191–205. [Google Scholar] [CrossRef]
- Li, J.; Tang, S.; Zhang, S.; Li, L.; Wei, J.; Xi, Z.; Sun, K. Characterization of unconventional reservoirs and continuous accumulations of natural gas in the Carboniferous-Permian strata, mid-eastern Qinshui basin, China. J. Nat. Gas Sci. Eng. 2018, 49, 298–316. [Google Scholar] [CrossRef]
- Lu, Y.B.; Jiang, S.; Lu, Y.C.; Xu, S.; Shu, Y.; Wang, Y.X. Productivity or preservation? The factors controlling the organic matter accumulation in the late Katian through Hirnantian Wufeng organic-rich shale, South China. Mar. Pet. Geol. 2019, 109, 22–35. [Google Scholar] [CrossRef]
- Deng, X.; Yang, K.; Liu, Y.; She, Z. Characteristics and tectonic evolution of Qianzhong Uplift. Earth Sci. Front. 2010, 17, 79–89. [Google Scholar]
- Huang, Z.; Li, Z.; Shi, W.; Yang, X.; Wang, X.; Young, S. Differential sedimentary mechanisms of Upper Ordovician-Lower Silurian shale in southern Sichuan Basin, China. Mar. Pet. Geol. 2023, 148, 106040. [Google Scholar] [CrossRef]
- Li, N.; Li, C.; Fan, J.; Algeo, T.J.; Yan, D.; Zhu, G.; Wu, S.; Tang, S.; Cheng, M.; Jin, C. Sulfate-controlled marine euxinia in the semi-restricted inner Yangtze Sea (South China) during the Ordovician-Silurian transition. Paleogeogr. Paleoclimatol. Paleoecol. 2019, 534, 109281. [Google Scholar] [CrossRef]
- Zhang, H.; Lin, B.; Bian, J.; Wu, J.; Yang, Q.; Yuan, L. Comparative study on organic-rich marine and continental shale: The case of Lower Paleozoic in south China and Carboniferous-Permian shale in North China. Coal Geol. Explor. 2018, 46, 88–95. [Google Scholar]
- Li, Y.F.; Zhang, T.W.; Ellis, G.S.; Shao, D.Y. Depositional environment and organic matter accumulation of Upper Ordovician-Lower Silurian marine shale in the Upper Yangtze Platform, South China. Paleogeogr. Paleoclimatol. Paleoecol. 2017, 466, 252–264. [Google Scholar] [CrossRef]
- Schieber, J.; Krinsley, D.; Riciputi, L. Diagenetic origin of quartz silt in mudstones and implications for silica cycling. Nature 2000, 406, 981–985. [Google Scholar] [CrossRef]
- Milliken, K.L.; Ergene, S.M.; Ozkan, A. Quartz types, authigenic and detrital, in the Upper Cretaceous Eagle Ford Formation, South Texas, USA. Sediment. Geol. 2016, 339, 273–288. [Google Scholar] [CrossRef]
- Adachi, M.; Yamamoto, K.; Sugisaki, R. Hydrothermal chert and associated siliceous rocks from the northern pacific—Their geological significance as indication of ocean ridge activity. Sediment. Geol. 1986, 47, 125–148. [Google Scholar] [CrossRef]
- Peltonen, C.; Marcussen, O.; Bjorlykke, K.; Jahren, J. Clay mineral diagenesis and quartz cementation in mudstones: The effects of smectite to illite reaction on rock properties. Mar. Pet. Geol. 2009, 26, 887–898. [Google Scholar] [CrossRef]
- Thyberg, B.; Jahren, J. Quartz cementation in mudstones: Sheet-like quartz cement from clay mineral reactions during burial. Petrol. Geosci. 2011, 17, 53–63. [Google Scholar] [CrossRef]
- Yang, X.R.; Yan, D.T.; Wei, X.S.; Zhang, L.W.; Zhang, B.; Xu, H.W.; Gong, Y.; He, J. Different formation mechanism of quartz in siliceous and argillaceous shales: A case study of Longmaxi Formation in South China. Mar. Pet. Geol. 2018, 94, 80–94. [Google Scholar]
- Ran, B.; Liu, S.G.; Jansa, L.; Sun, W.; Yang, D.; Ye, Y.H.; Wang, S.Y.; Luo, C.; Zhang, X.; Zhang, C.J. Origin of the Upper Ordovician-lower Silurian cherts of the Yangtze block, South China, and their palaeogeographic significance. J. Asian Earth Sci. 2015, 108, 1–17. [Google Scholar] [CrossRef]
- Mclennan, S.M.; Taylor, S.R.; Mcculloch, M.T.; Maynard, J.B. Geochemical and Nd-Sr isotopic composition of deep-sea turbidites: Crustal evolution and plate tectonic associations. Geochim. Cosmochim. Acta 1990, 54, 2015–2050. [Google Scholar] [CrossRef]
- Su, W.; Huff, W.D.; Ettensohn, F.R.; Liu, X.; Zhang, J.; Li, Z. K-bentonite, black-shale and flysch successions at the Ordovician-Silurian transition, South China: Possible sedimentary responses to the accretion of Cathaysia to the Yangtze Block and its implications for the evolution of Gondwana. Gondwana Res. 2009, 15, 111–130. [Google Scholar] [CrossRef]
- Ragueneau, O.; Treguer, P.; Leynaert, A.; Anderson, R.F.; Brzezinski, M.A.; Demaster, D.J.; Dugdale, R.C.; Dymond, J.; Fischer, G.; Francois, R.; et al. A review of the Si cycle in the modem ocean: Recent progress and missing gaps in the application of biogenic opal as a paleoproductivity proxy. Glob. Planet. Chang. 2000, 26, 317–365. [Google Scholar] [CrossRef]
- Mazzullo, S.J. Organogenic dolomitization in peritidal to deep-sea sediments. J. Sediment. Res. 2000, 70, 10–23. [Google Scholar] [CrossRef]
- Chukwuma, K.; Tsikos, H.; Wagner, N. Control of variability of primary grain assemblages on the stratigraphic differences in diagenetic processes and products in organic-rich sediments. Sediment. Geol. 2021, 422, 105966. [Google Scholar] [CrossRef]
- Macquaker, J.; Taylor, K.G.; Keller, M.; Polya, D. Compositional controls on early diagenetic pathways in fine-grained sedimentary rocks: Implications for predicting unconventional reservoir attributes of mudstones. AAPG Bull. 2014, 98, 587–603. [Google Scholar] [CrossRef]


| Sequence Stratigraphic Term | Deposition Cycles | Time Range (Ma) | Genetic Mechanism | |
|---|---|---|---|---|
| First-order megasequence | 200–400 | Stereotype sea level changes caused by the movement of tectonic plates | Global sea level changes caused by Pangaea formation and breakup | |
| Second-order supersequence | 10–40 | Global sea level changes caused by ocean ridge spreading system | ||
| Third-order sequence | long-term cycle | 1–10 | Global sea level changes caused by the variation in mid-ocean ridge and the oscillation of continental glacier + regional sea level changes influenced by intraplate tectonic subsidence and uplift | |
| Fourth-order subsequence sets or system tract | medium-term cycle | 0.4 | Glacier type sea-level changes caused by Milankovitch astronomical cycle Long eccentricity cycle | Long eccentricity cycle |
| Fifth-order subsequence | short-term cycle | 0.1 | Short eccentricity cycle | |
| Sixth-order cyclothem | 0.02–0.04 | Precession and obliquity cycle | ||
| Seventh-order alternating laminae | 0.002–0.005 | Change of glacier and geoid | ||
| Shale Components (wt %) | TST1 + HST1 | TST2 | HST2 | ||||||
|---|---|---|---|---|---|---|---|---|---|
| Min. | Max. | Ave. | Min. | Max. | Ave. | Min. | Max. | Ave. | |
| TOC | 2.04 | 9.24 | 4.7 | 0.5 | 1.98 | 0.89 | 0.05 | 0.73 | 0.2 |
| quartz | 23 | 53 | 34.5 | 22.4 | 38 | 34.08 | 20 | 31.5 | 27.86 |
| K-feldspar | 0 | 9 | 3.83 | 2.1 | 12 | 7.22 | 2.7 | 7.7 | 5.32 |
| albite | 4 | 14 | 7.83 | 4.9 | 20 | 13.58 | 9.6 | 14.3 | 11.09 |
| calcite | 11 | 53 | 36.5 | 13 | 26 | 17.52 | 17.2 | 46.8 | 24.76 |
| dolomite | 0 | 6 | 1.67 | 0 | 4 | 2.48 | 3.3 | 10.1 | 7.15 |
| pyrite | 0 | 1 | 0.33 | 0 | 2.1 | 0.62 | 0 | 2.4 | 0.57 |
| illite | 44 | 58 | 49 | 40 | 46 | 43.5 | 13 | 36 | 22.7 |
| mixed-layer illite-smectite | 28 | 40 | 33.83 | 38 | 41 | 39.75 | 46 | 65 | 55.3 |
| kaolinite | 0 | 0 | 0 | 0 | 0 | 0 | 4 | 7 | 5.4 |
| chlorite | 10 | 24 | 17.17 | 13 | 19 | 16.75 | 14 | 22 | 16.6 |
| clay minerals | 12 | 21 | 15.33 | 18 | 41.4 | 24.48 | 9.5 | 27.6 | 23.24 |
| carbonates | 16 | 53 | 38.17 | 13 | 26 | 20 | 26 | 51.6 | 31.91 |
Disclaimer/Publisher’s Note: The statements, opinions and data contained in all publications are solely those of the individual author(s) and contributor(s) and not of MDPI and/or the editor(s). MDPI and/or the editor(s) disclaim responsibility for any injury to people or property resulting from any ideas, methods, instructions or products referred to in the content. |
© 2023 by the authors. Licensee MDPI, Basel, Switzerland. This article is an open access article distributed under the terms and conditions of the Creative Commons Attribution (CC BY) license (https://creativecommons.org/licenses/by/4.0/).
Share and Cite
Wang, X.; Xi, Z.; Yan, Z.; Zhang, S.; Tang, S.; Lin, D. Differential Development Mechanisms of Pore Types under the Sequence Stratigraphic Constraints of the Wufeng–Longmaxi Formation Shale from the Upper Yangtze Platform. Processes 2023, 11, 3436. https://doi.org/10.3390/pr11123436
Wang X, Xi Z, Yan Z, Zhang S, Tang S, Lin D. Differential Development Mechanisms of Pore Types under the Sequence Stratigraphic Constraints of the Wufeng–Longmaxi Formation Shale from the Upper Yangtze Platform. Processes. 2023; 11(12):3436. https://doi.org/10.3390/pr11123436
Chicago/Turabian StyleWang, Xinlei, Zhaodong Xi, Zhifeng Yan, Songhang Zhang, Shuheng Tang, and Donglin Lin. 2023. "Differential Development Mechanisms of Pore Types under the Sequence Stratigraphic Constraints of the Wufeng–Longmaxi Formation Shale from the Upper Yangtze Platform" Processes 11, no. 12: 3436. https://doi.org/10.3390/pr11123436