

Modelling and Optimization of Methylene Blue Adsorption Process on Leonurus cardiaca L. Biomass Powder

Faculty of Industrial Chemistry and Environmental Engineering, Politehnica University Timisoara, Bd. V. Parvan No. 6, 300223 Timisoara, Romania
*
Authors to whom correspondence should be addressed.
Processes 2023, 11(12), 3385; https://doi.org/10.3390/pr11123385
Submission received: 15 November 2023
/
Revised: 2 December 2023
/
Accepted: 5 December 2023
/
Published: 6 December 2023
(This article belongs to the Special Issue Advances in Adsorption of Wastewater Pollutants)
Abstract
:The main objective of this study was to optimize the adsorption process of methylene blue on a natural, low-cost adsorbent, Leonurus cardiaca L. biomass powder, in order to maximize dye removal efficiency from aqueous solutions. For this purpose, the Taguchi method was used based on an L27 orthogonal array design considering six controllable factors at three levels. The percentage contribution of each factor was computed using analysis of variance (ANOVA). The optimal adsorption conditions were established. The experimental data from equilibrium and kinetic studies were modelled using specific equilibrium isotherms and kinetic models. Thermodynamic parameters were calculated in order to determine the main adsorption mechanism. The obtained results showed that the ionic strength is the factor that most influences dye adsorption (percentage contribution 72.33%), whereas the adsorbent dose had the least impact. The Sips isotherm and the general kinetic model most accurately characterized the process. The maximum adsorption capacity 103.21 (mg g−1) indicated by the Sips isotherm and the equilibrium time (40 min) were better compared to the values obtained for other bio-adsorbents used for methylene blue adsorption. The main mechanism involved in the adsorption is physisorption, while chemisorption only contributes marginally to the process.
1. Introduction
The widespread presence of harmful substances in the natural environment is frequently associated with the expansion of human populations and their activities. Global water quality degradation represents a highly contentious problem with significant and lasting impacts on ecosystems, including loss of life. Of notable concern are the dyes found in waste effluent, which can have serious consequences for a variety of living organisms. The pollution caused by dye products combines both danger to health and environmental unattractiveness [1,2,3,4,5].
Over the past decade, adsorption has emerged as a highly effective physico-chemical treatment method for eliminating dye pollutants. The adsorption technique is a simple process that uses a variety of cheap and abundant adsorbents and provides high yields of dye removal from water. Moreover, it prevents the formation of secondary contaminants; thus, this process has attracted the attention of a large number of researchers [1,5,6,7,8,9,10].
Types of environmentally friendly sorbents, such as organic waste materials derived from plant biomass as well as microbial biomass are increasingly being recognized as viable alternatives to commercial-activated carbon, which is the best-known adsorbent on the market. The use of nonliving biomass as bio-adsorbents is environmentally safe and has demonstrated effective removal of dyes from colored effluent. The ability of these adsorbents to remove dyes depends on the presence of alcohol, aldehyde, ketone, carboxylic, ether, and phenolic compounds in their structure, as these compounds have functional groups capable of bounding dye molecules [6,9,11,12,13,14,15,16].
In addition to the various cost-effective available bio-adsorbents, another significant advantage of using the adsorption process is its ease of optimization and modeling [17,18,19,20].
Modeling the data obtained in the process using adsorption isotherms and specific kinetic model are a fundamental aspect of the study of adsorption. These isotherms illustrate the correlation between the amount of solute adsorbed onto the adsorbent surface and the solute concentration in the solution. Researchers rely on various equations to model and depict adsorption isotherms, which provide key insights into the properties and behavior of adsorbent materials [21,22,23,24,25].
The use of adsorption kinetics models is essential in assessing the capabilities and nature of adsorbents, as well as exploring the mass transfer in the adsorption process. These models offer a comprehensive evaluation of the changes in sorption behavior over time, thereby providing critical insight into the degree and rate of surface coverage [10,13,26,27].
The establishment of the parameters of the adsorption isotherms and the kinetic models together with the determination of the specific thermodynamic parameters provides important information regarding the interaction mechanisms, surface properties, and the affinity degree of adsorbent. Ultimately, these parameters provide a vital basis for the development of efficient, cost-effective and environmentally friendly solutions for the removal of pollutants of various types [10,13,22,26,27].
The efficiency of the dye adsorption process is influenced by a series of parameters, such as the solution pH, contact time, temperature, adsorbent dose, dye initial concentration and ionic strength. In order to obtain a maximum efficiency of dye removal from water, these parameters should be optimized [28,29].
The utilization of statistical techniques through Design of Experiment (DOE) methods has been proven to be very useful for process optimization. DOE methods, such as Full factorial design, Fractional factorial design, Taguchi method, Response surface methodology and Box–Behnken design, can evaluate the individual contribution of controlling parameters to objective functions. The Taguchi technique is an effective optimization method that requires fewer experiments than other methods, leading to cost reduction, quality improvement, and reliable design solutions [17,18,19,20,30,31,32].
The aim of the work was to optimize and model the adsorption process of methylene blue on Leonurus cardiaca L. biomass powder, a natural, cheap and environmentally friendly material. Current scientific literature lacks any documented research or investigation into the effectiveness of this adsorbent material in removing methylene blue from aqueous solutions. The study represents an opportunity to explore this new approach and evaluate its potential as an effective strategy for the removal of this dye. To optimize the process and to establish the influence of each controllable factor on the process, the Taguchi method and one-way ANOVA analysis were used. Equilibrium, kinetic and thermodynamic studies were performed and the modeling of the experimental data was carried out using specific equilibrium isotherms and kinetic models.
2. Materials and Methods
The adsorbent material was obtained from the aerial parts of mature Leonurus cardiaca L. plants, which were purchased from StefMar (Ramnicu Valcea, Romania). The process, which did not involve a chemical or thermal treatment, is described in detail in a previously published study [33]. The point of zero charge (pHPZC) for the material was 6.58 [33].
For SEM analysis and color analysis, performed before and after the methylene blue dye adsorption process, an FEI Inspect S model microscope (FEI, Eindhoven, The Netherlands) and a Cary-Varian 300 Bio UV-VIS colorimeter (Varian Inc., Mulgrave, Australia) were used, respectively.
The batch system was used to study how various factors affect the efficiency of dye removal during the adsorption process, using the Taguchi approach with a standard orthogonal array L27 as the experimental design. The experiments were conducted in three independent replicates for each experiment at a constant mixing intensity. Merck’s analytical grade chemicals were utilized throughout the experimental procedures. Dilute solutions of HCl and NaOH (0.1 N) were utilized to regulate pH, while NaCl was used as a background electrolyte to study the influence of ionic strength. The Specord 200 PLUS UV-VIS spectrophotometer (Analytik Jena, Jena, Germany) was used to determine methylene blue concentration at a wavelength of 664 nm.
The methylene blue removal percentage, R(%), and the adsorption capacity at equilibrium, (qe), were calculated with equations presented in Table 1 [5,17].
To enhance the efficiency of the dye removal process, the Taguchi method was used. An experimental design utilizing an L27 orthogonal array (six factors at three levels) was employed to determine the optimal adsorption conditions. The percentage contribution of each factor to the dye removal efficiency was computed using analysis of variance (ANOVA) with a general linear model. Minitab 19 software (version 19.1.1, Minitab LLC, State College, PA, USA) was used to carry out the necessary mathematical computations.
In order to model the experimental data obtained in the adsorption process and to find out information regarding the interaction mechanisms, surface properties, and the affinity degree of adsorbent, several equilibrium isotherms and kinetic models were tested. The nonlinear equations of these adsorption isotherms [21,25,26] and kinetic models [22,27] used in data processing are illustrated in Table 2 and Table 3.
To determine the most suitable isotherm and kinetic models, values for determination coefficient (R2), adjusted determination coefficient (R2adj), sum of square error (SSE), chi-square (χ2), average relative error (ARE) and hybrid fractional error function (HYBRID) were calculated [22]. The applicability of these parameters was evaluated based on a higher R2 and R2adj value and lower values of SSE, χ2, ARE and HYBRID. The calculation equations for these error parameters are described in Table 4.
3. Results and Discussion
3.1. SEM and Color Analyzes for Adsorbent Material
SEM and color analyses for adsorbent material performed before and after adsorption indicate the retention of methylene blue dye on the surface of the adsorbent material. The SEM analysis of the adsorbent (Figure 1A) revealed a porous surface, with voids and cavities of various shapes and sizes. After adsorption, the adsorbent material has a smooth and homogeneous surface (Figure 1B), suggesting that the pores were filled with methylene blue molecules. This conclusion is supported by the color analysis in the CIEL*a*b* system (Figure 2). Before adsorption, the color of the adsorbent is described by the point (LCPB). After adsorption, the color of the adsorbent is described by the point (LCPB + MB), which is in the domain color where there is also the point that characterizes the color of the dye (MB).
3.2. Dye Adsorption Process Optimization Using Taguchi Methods
The optimal conditions for dye removal by adsorption were established using a Taguchi (L27) orthogonal array. Six factors at three levels were studied to evaluate their effect on dye removal efficiency (Table 6). The Taguchi approach was used to convert the experimental data into a signal-to-noise (S/N) ratio, which was analyzed to determine the quality of the experiment and the validity of the results. The terms “signal” and “noise” referred to the desirable value (mean) and undesirable value (standard deviation), respectively, for the output characteristic [20,28,29,30]. The highest adsorption efficiency was considered for evaluating the experimental outcomes; consequently, the “larger-the-better” option was selected to analyze the signal-to-noise ratio of the Taguchi method. The equation corresponding to this option is:
where n—number of repetitions under similar experimental conditions; and yi—experimental response [20,29].
Table 7 describes the L27 orthogonal array built with the controllable factors from Table 6 and results obtained in each of the experiments performed after each run. The S/N ratio response curves for the individual effects of dye adsorption parameters on the S/N ratio and dye removal efficiency are comparatively shown in Figure 3.
Analyzing the obtained data, we can observe the positive effect of increasing pH, contact time, adsorbent dose and temperature on the dye removal efficiency from water by adsorption. The initial concentration and the ionic strength have a negative influence on the process. The dye removal efficiency of methylene blue varies, depending on the values and the combination of controllable factors, from 21.14% to 85.67%.
Table 8 displays the interaction effects of different factors based on the S/N ratio and the factors’ significance ranks. The ionic strength is the controllable factor that had the most impact on the process, while the adsorbent dose had the lowest impact. Correlating the data from Table 6 with those from Table 8, the optimal conditions for the adsorption process can be established: pH = 10, contact time = 60 min, adsorbent dose = 5 (g L−1), initial dye concentration = 25 (mg L−1), temperature = 305 K and ionic strength = 0 (mol L−1).
Comparing the results with those reported in the scientific literature regarding the adsorption of methylene blue on similar bio-adsorbent materials, it is found that the controllable factor that had the most impact on the process differs depending on the adsorbent used. Thus, for the adsorbent material obtained from bilberry leaves, the factor with the greatest influence was the pH [12], while for the adsorbents obtained from dry bean pods husks and raspberry leaves, it was the adsorbent dose [17] and the contact time [34], respectively.
The order of controllable factor influence obtained with the Taguchi method was verified by ANOVA analysis, which also determined the percentage contribution of each factor (Figure 4). The results confirm the order of controllable factor impact obtained by the Taguchi approach. The ionic strength is the controllable factor that had the most impact on the process, while the adsorbent dose had the lowest impact.
The accuracy of the predictions indicated by the Taguchi optimization method was also verified. A strong correlation between the experimental and predicted values for dye removal efficiency was observed, with the coefficient of determination (R2) value being close to 1, indicating high prediction accuracy (Figure 5).
3.3. Equilibrium Isotherms
Equilibrium isotherms indicate the relationship between the concentration of solute in a solution and the amount of solute adsorbed onto the adsorbent material surface [21,22,23,24,25]. Some of the most-used isotherms to model the experimental data obtained in adsorption processes are Langmuir, Freundlich, Temkin, Redlich–Peterson and Sips. The fitted curves of these isotherms are shown in Figure 6 and their specific constant and error parameters are depicted in Table 9.
The information provided indicates that the Freundlich and Temkin isotherms are not suitable for characterizing the methylene blue retention process on Leonorus cardiaca biomass powder, having the lowest values for determination coefficient R2 (0.9424 and 0.9877, respectively), and adjusted determination coefficient R2adj (0.9381 and 0.9860, respectively). For the Langmuir and Redlich–Peterson isotherms, good values were obtained for the determination coefficient (0.9916 and 0.9915, respectively), and adjusted determination coefficient (0.9891 and 0.9972, respectively). The highest values for these parameters were obtained for the Sips isotherm (R2 = 0.9992, R2adj = 0.9973). In addition, the Sips isotherms have the lower values of SSE (6.99), χ2 (0.24), ARE (2.46) and HYBRID (2.82); therefore, this isotherm best describes the process.
The scientific literature reported that the Sips isotherm most accurately characterized the adsorption process of methylene blue on bilberry leaves [12], raspberry leaves [34], lemon peel [35], Canola residues [36], date stones-based activated carbon [37] and carbon nanotubes [38].
The maximum adsorption capacity 103.21 (mg g−1) indicated by the Sips isotherm is higher than maximum adsorption capacity of some other similar bio-adsorbents used for methylene blue adsorption such as: Ficcus Palmata leaves 6.89 (mg g−1) [39], Neem leaf powder 19.6 (mg g−1) [40], Ginkgo biloba leaves 48.07 (mg g−1) [41], Solanum tuberosum leaves 52.60 (mg g−1) [42], Salix babylonica leaves 60.9 (mg g−1) [13], carrot leaves 66.5 (mg g−1) [43], phoenix tree’s leaves 80.9 (mg g−1) [44], Acer tree leaves 97.07 (mg g−1) [45] and Elaeis guineensis leaves 103.0 (mg g−1) [10].
3.4. Adsorption Kinetic
To evaluate the mass transfer rate during the adsorption process, it is crucial to use adsorption kinetic models. These patterns provide valuable information on the extent and rate of surface coverage [10,13,26,27]. Several kinetic models, including pseudo-first order, pseudo-second order, Elovich, Avrami and general order, are commonly applied in modeling experimental data from adsorption processes. These kinetic models fitted curves are illustrated in Figure 7, and Table 10 displays their specific constant and error parameters.
Analyzing the data in Figure 7, it can be concluded that the adsorption equilibrium was reached after approximately 40 min. This equilibrium time is lower than that obtained for other similar adsorbent materials, such as Salix babylonica leaves 45 min [13], pineapple leaf 60 min [14], Platanus orientalis leaf 70 min [16], Ficcus Palmata leaves 80 min [39], Ginkgo biloba leaves 100 min [41], banana leaves 120 min [46], and phoenix tree leaves 150 min [44].
All kinetic models tested show good values for the determination coefficient, R2, (0.9919–0.9992) and adjusted determination coefficient, R2adj, (0.9858–0.9987). The highest values for these parameters and lower values of SSE (0.21), χ2 (0.01), ARE (0.70%) and HYBRID (0.17) were obtained for the general order model. In conclusion, this model best characterizes the process.
According to the scientific literature, in other previous studies, the general order kinetic model described the adsorption of the methylene blue dye on bilberry leaves [12], ultrasonic surface modified chitin [47], cassava bagasse [48], comminuted raw avocado seeds [49] and golden trumpet tree bark [50].
3.5. Thermodynamic Study
The thermodynamic parameters for methylene blue adsorption process on Leonurus cardiaca L. biomass powder are shown in Table 11. The standard Gibbs energy change (ΔG0) has a negative value and the standard enthalpy change (ΔH0) has a positive value; therefore, the dye adsorption process is spontaneous, favorable and exothermic. At the solid-liquid interface, an increased degree in randomness is highlighted by the positive value of the standard entropy change (ΔS0) [9,10].
The main mechanism involved in the adsorption is physisorption, with van der Waals forces having an important role in the process. This observation is indicated by the value of ΔH0 lower than 20 (kJ mol−1) [17,34,51]. The values for ΔG0 lower but close to −20 (kJ mol−1) may suggest that the involvement of chemisorption in the process is limited, physical adsorption playing the main role in the dye retaining [12,14,34].
4. Conclusions
In order to maximize the methylene blue removal efficiency from aqueous solutions using Leonurus cardiaca L. biomass powder, the Taguchi method was performed. SEM and color analyses for adsorbent material, before and after adsorption, indicate the retention of dye on the adsorbent surface. The dye removal efficiency of methylene blue varies, depending on the values and the combination of controllable factors, from 21.14% to 85.67%. The optimal conditions of the adsorption established using a Taguchi (L27) orthogonal array were pH = 10, contact time = 60 min, adsorbent dose = 5 (g L−1), initial dye concentration = 25 (mg L−1), temperature = 305 K and ionic strength = 0 (mol L−1). The ionic strength is the controllable factor that had the most impact on the process (72.33% contribution), while the adsorbent dose had the lowest impact. The accuracy of the predictions indicated by the Taguchi optimization method was very high. The Sips isotherm and general order kinetic model most accurately characterized the adsorption process. The main mechanism involved in the adsorption is physisorption, while chemisorption only contributes marginally to the process. The adsorption process is spontaneous, favorable and exothermic.
Author Contributions
Conceptualization, G.M., C.V. and S.P.; methodology, G.M. and M.D.; software, G.M. and C.V.; validation, G.M. and C.V.; formal analysis, G.M. and S.P.; investigation, G.M., S.P., M.D. and S.B.; resources, G.M. and M.D.; data curation, G.M.; writing—original draft preparation, G.M., S.P., C.V. and S.B.; writing—review and editing, G.M., C.V., S.P. and M.D.; visualization, G.M.; supervision, G.M. All authors have read and agreed to the published version of the manuscript.
Funding
This work was supported by a grant of the Romanian Ministry of Research, Innovation and Digitalization, project number PFE 26/30.12.2021, PERFORM-CDI@UPT100—The increasing of the performance of the Polytechnic University of Timisoara by strengthening the research, development and technological transfer capacity in the field of “Energy, Environment and Climate Change” at the beginning of the second century of its existence, within Program 1—Development of the national system of Research and Development, Subprogram 1.2—Institutional Performance Institutional Development Projects—Excellence Funding Projects in RDI, PNCDI III.
Data Availability Statement
All the experimental data obtained are presented, in the form of table and/or figure, in the article.
Conflicts of Interest
The authors declare no conflict of interest.
References
- Hamad, H.N.; Idrus, S. Recent Developments in the Application of Bio-Waste-Derived Adsorbents for the Removal of Methylene Blue from Wastewater: A Review. Polymers 2022, 14, 783. [Google Scholar] [CrossRef] [PubMed]
- Akhtar, N.; Syakir Ishak, M.I.; Bhawani, S.A.; Umar, K. Various Natural and Anthropogenic Factors Responsible for Water Quality Degradation: A Review. Water 2021, 13, 2660. [Google Scholar] [CrossRef]
- Beagan, A.; Alshammari, R.; Alotaibi, L.; Albarrak, H.; Alotaibi, K.; Alswieleh, A. High-Efficient Anionic Dyes Removal from Water by Cationic Polymer Brush Functionalized Magnetic Mesoporous Silica Nanoparticles. Processes 2022, 10, 1565. [Google Scholar] [CrossRef]
- Salzano de Luna, M.; Greco, F.; Pastore, R.; Mensitieri, G.; Filippone, G.; Aprea, P.; Mallamace, D.; Mallamace, F.; Chen, S.-H. Tailoring Chitosan/LTA Zeolite Hybrid Aerogels for Anionic and Cationic Dye Adsorption. Int. J. Mol. Sci. 2021, 22, 5535. [Google Scholar] [CrossRef] [PubMed]
- Valério Filho, A.; Xavaré Kulman, R.; Vaz Tholozan, L.; Felkl de Almeida, A.R.; Silveira da Rosa, G. Preparation and Characterization of Activated Carbon Obtained from Water Treatment Plant Sludge for Removal of Cationic Dye from Wastewater. Processes 2020, 8, 1549. [Google Scholar] [CrossRef]
- Alghamdi, W.M.; El Mannoubi, I. Investigation of Seeds and Peels of Citrullus colocynthis as Efficient Natural Adsorbent for Methylene Blue Dye. Processes 2021, 9, 1279. [Google Scholar] [CrossRef]
- Iwuozor, K.O.; Ighalo, J.O.; Ogunfowora, L.A.; Adeniyi, A.G.; Igwegbe, C.A. An empirical literature analysis of adsorbent performance for methylene blue uptake from aqueous media. J. Environ. Chem. Eng. 2021, 9, 105658. [Google Scholar] [CrossRef]
- Ge, M.; Xi, Z.; Zhu, C.; Liang, G.; Yang, Y.; Hu, G.; Jamal, L.; Jahangir Alam, S.M. Adsorption Process and Properties Analyses of a Pure Magadiite and a Modified Magadiite on Rhodamine-B from an Aqueous Solution. Processes 2019, 7, 565. [Google Scholar] [CrossRef]
- Shakoor, S.; Nasar, A. Removal of methylene blue dye from artificially contaminated water using citrus limetta peel waste as a very low cost adsorbent. J. Taiwan Inst. Chem. Eng. 2016, 66, 154–163. [Google Scholar] [CrossRef]
- Setiabudi, H.D.; Jusoh, R.; Suhaimi, S.F.R.M.; Masrur, S.F. Adsorption of methylene blue onto oil palm (Elaeis guineensis) leaves: Process optimization, isotherm, kinetics and thermodynamic studies. J. Taiwan Inst. Chem. Eng. 2016, 63, 363–370. [Google Scholar] [CrossRef]
- Mitrogiannis, D.; Markou, G.; Çelekli, A.; Bozkurt, H. Biosorption of methylene blue onto Arthrospira platensis biomass: Kinetic, equilibrium and thermodynamic studies. J. Environ. Chem. Eng. 2015, 3, 670–680. [Google Scholar] [CrossRef]
- Mosoarca, G.; Vancea, C.; Popa, S.; Dan, M.; Boran, S. The Use of Bilberry Leaves (Vaccinium myrtillus L.) as an Efficient Adsorbent for Cationic Dye Removal from Aqueous Solutions. Polymers 2022, 14, 978. [Google Scholar] [CrossRef] [PubMed]
- Khodabandehloo, A.; Rahbar-Kelishami, A.; Shayesteh, H. Methylene blue removal using Salix babylonica (Weeping willow) leaves powder as a low-cost biosorbent in batch mode: Kinetic, equilibrium, and thermodynamic studies. J. Mol. Liq. 2017, 244, 540–548. [Google Scholar] [CrossRef]
- Weng, C.H.; Lin, Y.T.; Tzeng, T.W. Removal of methylene blue from aqueous solution by adsorption onto pineapple leaf powder. J. Hazard. Mater. 2009, 170, 417–424. [Google Scholar] [CrossRef]
- Bulgariu, L.; Escudero, L.B.; Bello, O.S.; Iqbal, M.; Nisar, J.; Adegoke, K.A.; Alakhras, F.; Kornaros, M.; Anastopoulos, I. The utilization of leaf-based adsorbents for dyes removal: A review. J. Mol. Liq. 2019, 276, 728–747. [Google Scholar] [CrossRef]
- Peydayesh, M.; Rahbar-Kelishami, A. Adsorption of methylene blue onto Platanus orientalis leaf powder: Kinetic, equilibrium and thermodynamic studies. J. Ind. Eng. Chem. 2015, 21, 1014–1019. [Google Scholar] [CrossRef]
- Mosoarca, G.; Popa, S.; Vancea, C.; Boran, S. Optimization, Equilibrium and Kinetic Modeling of Methylene Blue Removal from Aqueous Solutions Using Dry Bean Pods Husks Powder. Materials 2021, 14, 5673. [Google Scholar] [CrossRef]
- Shojaei, S.; Shojaei, S.; Band, S.S.; Farizhandi, A.A.K.; Ghoroqi, M.; Mosavi, A. Application of Taguchi method and response surface methodology into the removal of malachite green and auramine-O by NaX nanozeolites. Sci. Rep. 2021, 11, 16054. [Google Scholar] [CrossRef]
- Korake, S.R.; Jadhao, P.D. Investigation of Taguchi optimization, equilibrium isotherms, and kinetic modeling for cadmium adsorption onto deposited silt. Heliyon 2020, 6, e05755. [Google Scholar] [CrossRef]
- Fernandez-Lopez, J.A.; Angosto, J.M.; Roca, M.J.; Doval Minarro, M. Taguchi design-based enhancement of heavy metals bioremoval by agroindustrial waste biomass from artichoke. Sci. Total Environ. 2019, 653, 55–63. [Google Scholar] [CrossRef]
- Foo, K.Y.; Hameed, B.H. Insights into the modeling of adsorption isotherm systems. J. Chem. Eng. 2010, 156, 2–10. [Google Scholar] [CrossRef]
- Piccin, J.S.; Cadaval, T.R.S.; de Pinto, L.A.A.; Dotto, G.L. Adsorption isotherms in liquid phase: Experimental, modeling, and interpretations. In Adsorption Processes for Water Treatment and Purification; Bonilla-Petriciolet, A., Mendoza-Castillo, D., Reynel-Avila, H., Eds.; Springer: Cham, Switzerland, 2017; pp. 19–51. [Google Scholar]
- Yadav, M.; Thakore, S.; Jadeja, R. Removal of organic dyes using Fucus vesiculosus seaweed bioadsorbent an ecofriendly approach: Equilibrium, kinetics and thermodynamic studies. J. Environ. Chem. Ecotoxicol. 2022, 4, 67–77. [Google Scholar] [CrossRef]
- Sobolčiak, P.; Popelka, A.; Tanvir, A.; Al-Maadeed, M.A.; Adham, S.; Krupa, I. Some Theoretical Aspects of Tertiary Treatment of Water/Oil Emulsions by Adsorption and Coalescence Mechanisms: A Review. Water 2021, 13, 652. [Google Scholar] [CrossRef]
- Al-Ghouti, M.A.; Da’ana, D.A. Guidelines for the use and interpretation of adsorption isotherm models: A review. J. Hazard. Mater. 2020, 393, 122383. [Google Scholar] [CrossRef] [PubMed]
- Dotto, G.L.; Salau, N.P.G.; Piccin, J.S.; Cadaval, T.R.S.; de Pinto, L.A.A. Adsorption kinetics in liquid phase: Modeling for discontinuous and continuous systems. In Adsorption Processes for Water Treatment and Purification; Bonilla-Petriciolet, A., Mendoza-Castillo, D., Reynel-Avila, H., Eds.; Springer: Cham, Switzerland, 2017; pp. 53–76. [Google Scholar]
- Wanga, J.; Guo, X. Adsorption kinetic models: Physical meanings, applications, and solving methods. J. Hazard. Mater. 2020, 390, 122156. [Google Scholar] [CrossRef] [PubMed]
- Googerdchian, F.; Moheb, A.; Emadi, R.; Asgari, M. Optimization of Pb(II) ions adsorption on nanohydroxyapatite adsorbents by applying Taguchi method. J. Hazard. Mater. 2018, 349, 186–194. [Google Scholar] [CrossRef] [PubMed]
- Zolgharnein, J.; Rastgordani, M. Optimization of simultaneous removal of binary mixture of indigo carmine and methyl orange dyes by cobalt hydroxide nano-particles through Taguchi method. J. Mol. Liq. 2018, 262, 405–414. [Google Scholar] [CrossRef]
- Razmi, B.; Ghasemi-Fasaei, R. Investigation of Taguchi optimization, equilibrium isotherms, and kinetic modeling for phosphorus adsorption onto natural zeolite of clinoptilolite type. Adsorp. Sci. Technol. 2018, 36, 1470–1483. [Google Scholar] [CrossRef]
- Ghorbani, F.; Kamari, S. Application of response surface methodology for optimization of methyl orange adsorption by Fe-grafting sugar beet bagasse. Adsorp. Sci. Technol. 2017, 35, 317–338. [Google Scholar] [CrossRef]
- Madan, S.S.; Wasewar, K.L. Optimization for benzeneacetic acid removal from aqueous solution using CaO2 nanoparticles based on Taguchi method. J. Appl. Res. Technol. 2017, 15, 332–339. [Google Scholar] [CrossRef]
- Mosoarca, G.; Vancea, C.; Popa, S.; Dan, M.; Boran, S. Crystal Violet Adsorption on Eco-Friendly Lignocellulosic Material Obtained from Motherwort (Leonurus cardiaca L.) Biomass. Polymers 2022, 14, 3825. [Google Scholar] [CrossRef]
- Mosoarca, G.; Popa, S.; Vancea, C.; Dan, M.; Boran, S. Removal of Methylene Blue from Aqueous Solutions Using a New Natural Lignocellulosic Adsorbent—Raspberry (Rubus idaeus) Leaves Powder. Polymers 2022, 14, 1966. [Google Scholar] [CrossRef] [PubMed]
- Vasanth Kumar, K.; Porkodi, K. Relation between some two- and three-parameter isotherm models for the sorption of methylene blue onto lemon peel. J. Hazard. Mater. 2006, 138, 633–635. [Google Scholar] [CrossRef] [PubMed]
- Balarak, D.; Jaafari, J.; Hassani, G.; Mahdavi, Y.; Tyagi, I.; Agarwal, S.; Gupta, V.K. The use of low-cost adsorbent (Canola residues) for the adsorption of methylene blue from aqueous solution: Isotherm, kinetic and thermodynamic studies. Colloids Interface Sci. Commun. 2015, 7, 16–19. [Google Scholar] [CrossRef]
- Ahmed, M.J.; Dhedan, S.K. Equilibrium isotherms and kinetics modeling of methylene blue adsorption on agricultural wastes-based activated carbons. Fluid Ph. Equilibria 2012, 317, 9–14. [Google Scholar] [CrossRef]
- Shahryari, Z.; Goharrizi, A.S.; Azadi, M. Experimental study of methylene blue adsorption from aqueous solutions onto carbon nano tubes. Int. J. Water Res. Environ. Eng. 2010, 2, 16–28. [Google Scholar]
- Fiaz, R.; Hafeez, M.; Mahmood, R. Ficcus palmata leaves as a low-cost biosorbent for methylene blue: Thermodynamic and kinetic studies. Water Environ. Res. 2019, 91, 689–699. [Google Scholar] [CrossRef]
- Bhattacharyya, K.G.; Sharma, A. Kinetics and thermodynamics of Methylene Blue adsorption on Neem (Azadirachta indica) leaf powder. Dyes Pigm. 2005, 65, 51–59. [Google Scholar] [CrossRef]
- Singh, R.; Singh, T.S.; Odiyo, J.O.; Smith, J.A.; Edokpayi, J.N. Evaluation of methylene blue sorption onto low-cost biosorbents: Equilibrium, kinetics, and thermodynamics. J. Chem. 2020, 2020, 8318049. [Google Scholar] [CrossRef]
- Gupta, N.; Kushwaha, A.K.; Chattopadhyaya, M.C. Application of potato (Solanum tuberosum) plant wastes for the removal of methylene blue and malachite green dye from aqueous solution. Arab. J. Chem. 2016, 9, S707–S716. [Google Scholar] [CrossRef]
- Kushwaha, A.K.; Gupta, N.; Chattopadhyaya, M.C. Removal of cationic methylene blue and malachite green dyes from aqueous solution by waste materials of Daucus carota. J. Saudi Chem. Soc. 2014, 18, 200–207. [Google Scholar] [CrossRef]
- Han, R.; Zou, W.; Yu, W.; Cheng, S.; Wang, Y.; Shi, J. Biosorption of methylene blue from aqueous solution by fallen phoenix tree’s leaves. J. Hazard. Mater. 2007, 141, 156–162. [Google Scholar] [CrossRef]
- Zolgharnein, J.; Bagtash, M. Hybrid central composite design optimization for removal of Methylene blue by Acer tree leaves: Characterization of adsorption. Desalin. Water Treat. 2015, 54, 2601–2610. [Google Scholar] [CrossRef]
- Krishni, R.R.; Foo, K.Y.; Hameed, B.H. Adsorptive removal of methylene blue using the natural adsorbent-banana leaves. Desalin. Water Treat. 2014, 52, 6104–6112. [Google Scholar] [CrossRef]
- Dotto, G.L.; Santos, J.M.N.; Rodrigues, I.L.; Rosa, R.; Pavan, F.A.; Lima, E.C. Adsorption of Methylene Blue by ultrasonic surface modified chitin. J. Colloid Interface Sci. 2015, 446, 133–140. [Google Scholar] [CrossRef] [PubMed]
- Diehl, M.; Silva, L.F.O.; Schnorr, C.; Netto, M.S.; Bruckmann, F.S.; Dotto, G.L. Cassava bagasse as an alternative biosorbent to uptake methylene blue environmental pollutant from water. Environ. Sci. Pollut. Res. 2023, 30, 51920–51931. [Google Scholar] [CrossRef] [PubMed]
- Schadeck Netto, M.; da Silva, N.F.; Mallmann, E.S.; Dotto, G.L.; Foletto, E.L. Effect of Salinity on the Adsorption Behavior of Methylene Blue onto Comminuted Raw Avocado Residue: CCD-RSM Design. Water Air Soil Pollut. 2019, 230, 187. [Google Scholar] [CrossRef]
- Hernandes, P.T.; Oliveira, M.L.S.; Georgin, J.; Franco, D.S.P.; Allasia, D.; Dotto, G.L. Adsorptive decontamination of wastewater containing methylene blue dye using golden trumpet tree bark (Handroanthus albus). Environ. Sci. Pollut. Res. 2019, 26, 31924–31933. [Google Scholar] [CrossRef]
- Wakkel, M.; Khiari, B.; Zagrouba, F. Textile wastewater treatment by agro-industrial waste: Equilibrium modelling, thermodynamics and mass transfer mechanisms of cationic dyes adsorption onto low-cost lignocellulosic adsorbent. J. Taiwan Inst. Chem. Eng. 2019, 96, 439–452. [Google Scholar] [CrossRef]
Figure 1.
SEM images of adsorbent surface before (A) and after dye adsorption (B).

Figure 2.
CIEL*a*b* color parameters of: MB—methylene blue dye; LCBP—Leonorus cardiaca biomass powder before dye adsorption process; LCBP + MB—Leonorus cardiaca biomass powder after dye adsorption process.
Figure 2.
CIEL*a*b* color parameters of: MB—methylene blue dye; LCBP—Leonorus cardiaca biomass powder before dye adsorption process; LCBP + MB—Leonorus cardiaca biomass powder after dye adsorption process.

Figure 3.
The S/N ratio response curves for the individual effects of dye adsorption parameters on the dye removal efficiency and S/N ratio.
Figure 3.
The S/N ratio response curves for the individual effects of dye adsorption parameters on the dye removal efficiency and S/N ratio.

Figure 4.
ANOVA analysis results regarding the percentage contribution of each controllable factor on the process.
Figure 4.
ANOVA analysis results regarding the percentage contribution of each controllable factor on the process.
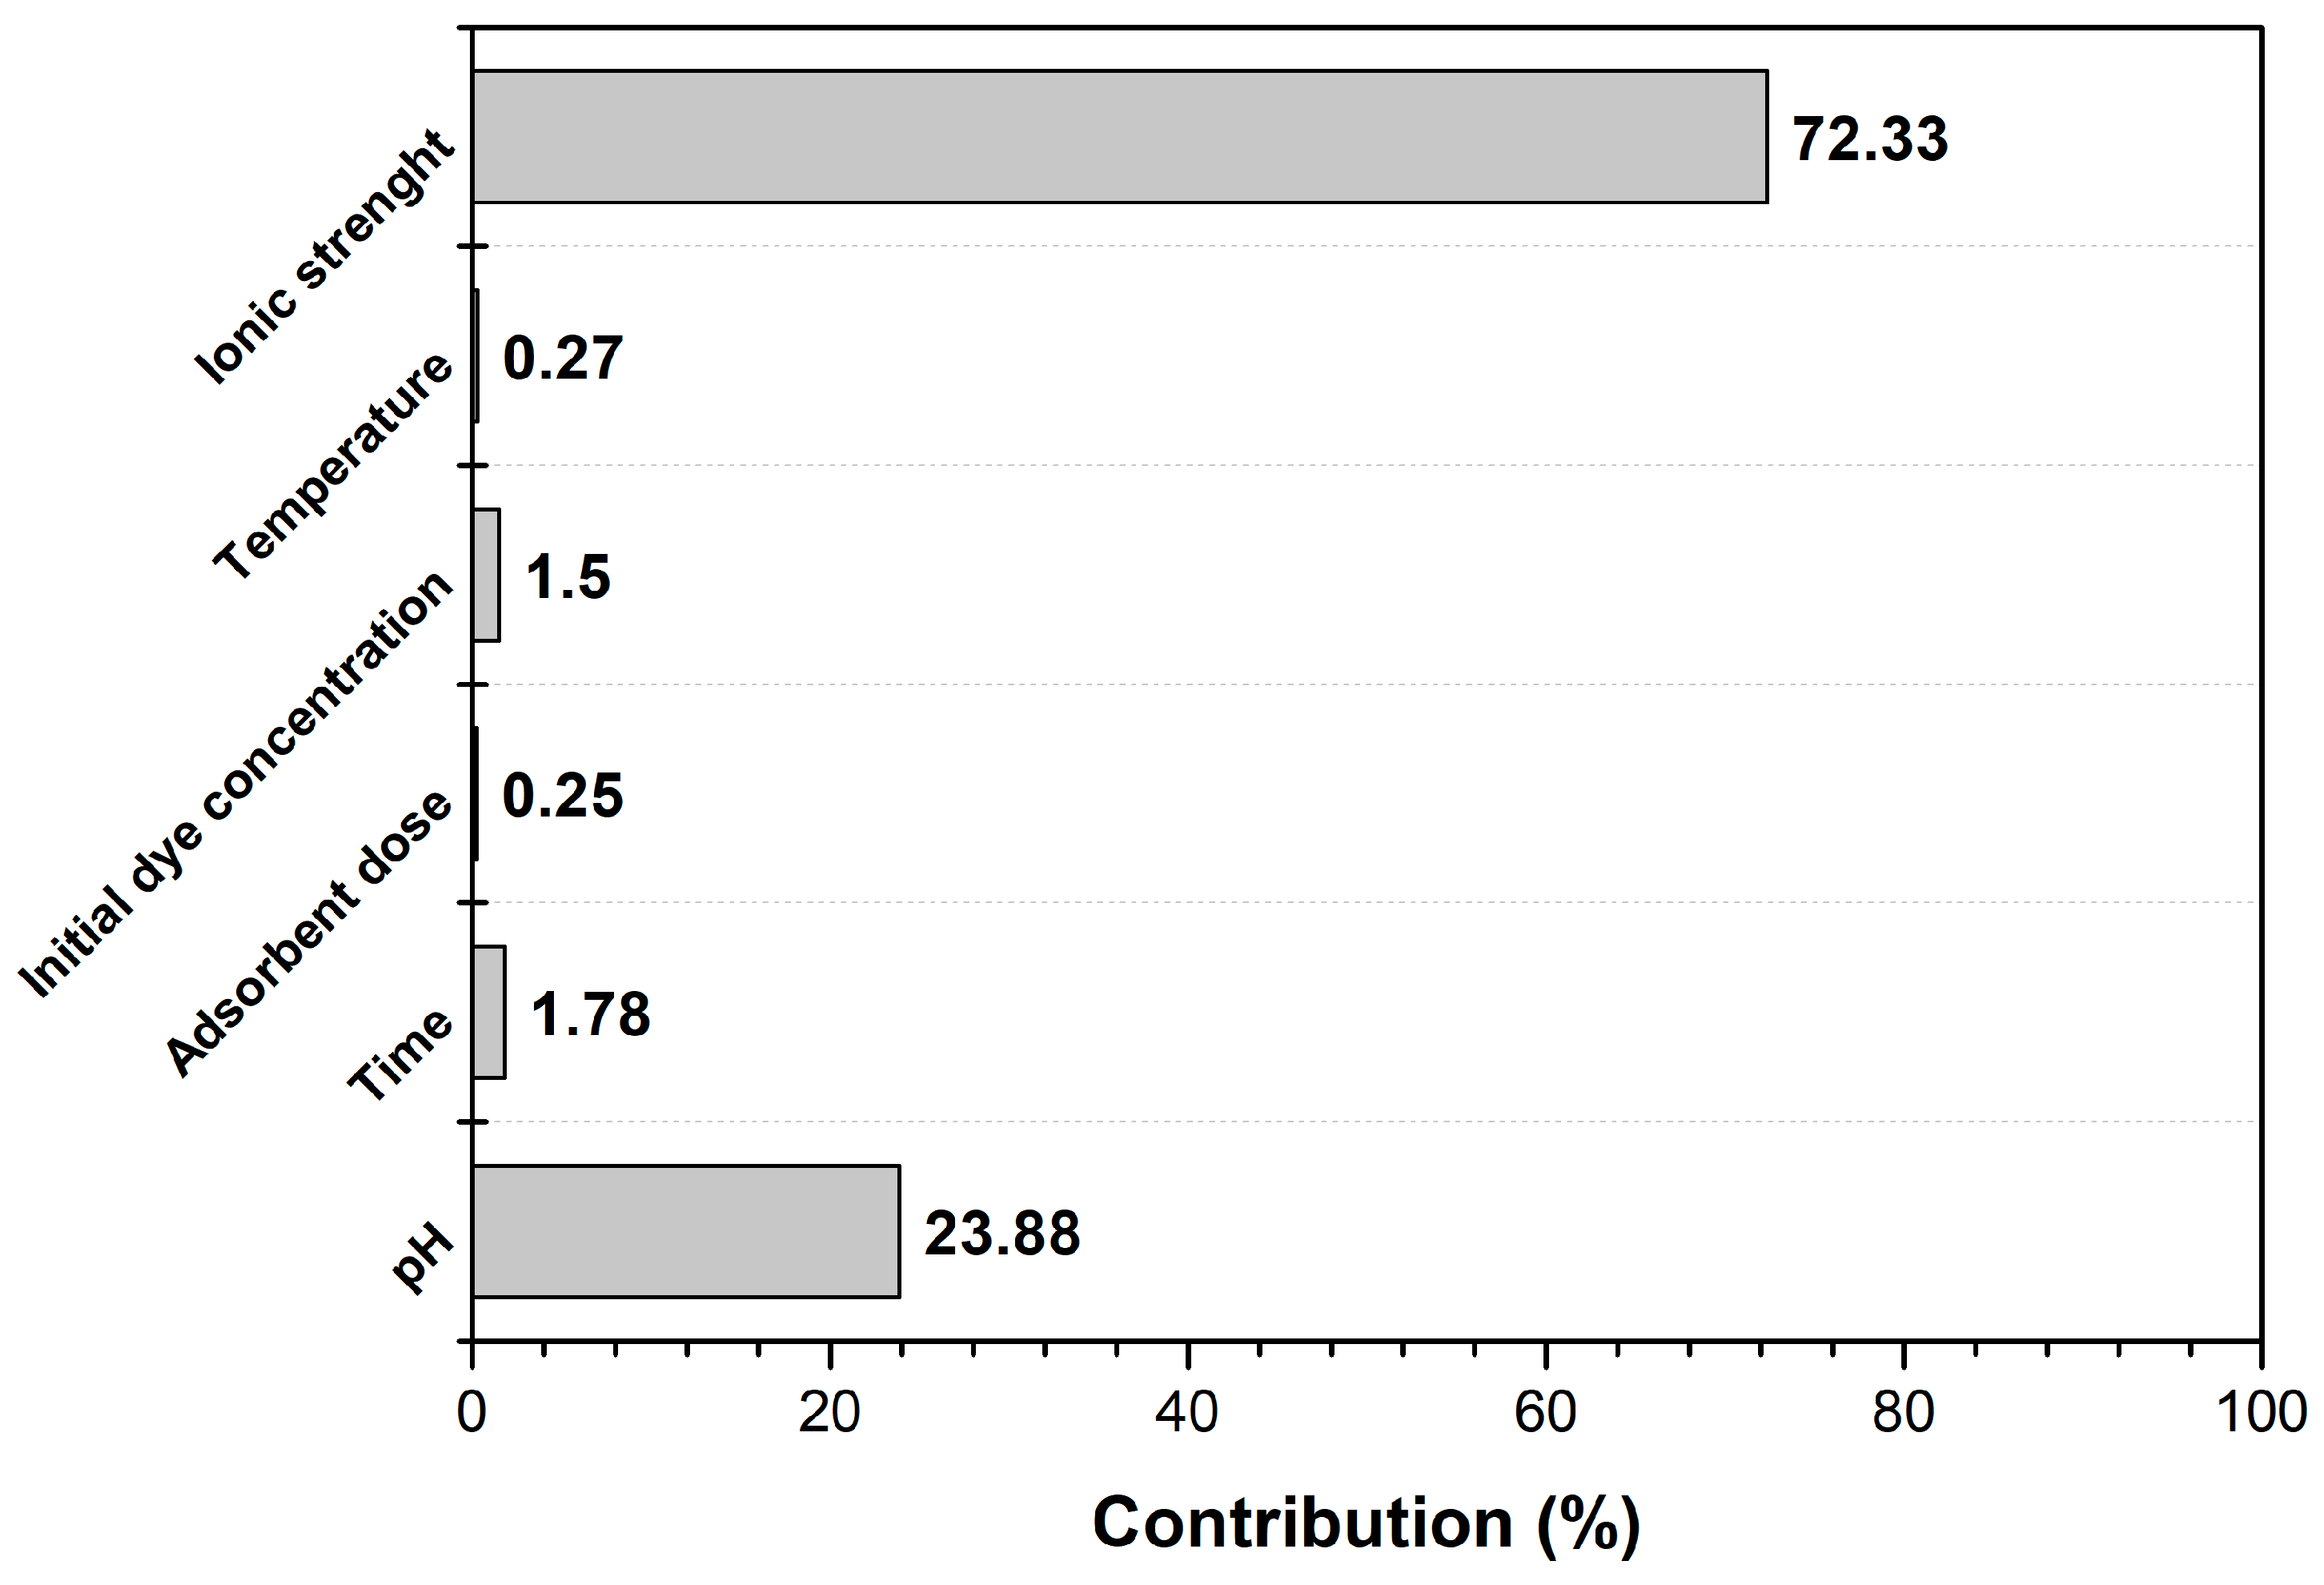
Figure 5.
Dye removal efficiency: experimental and predicted values correlation.
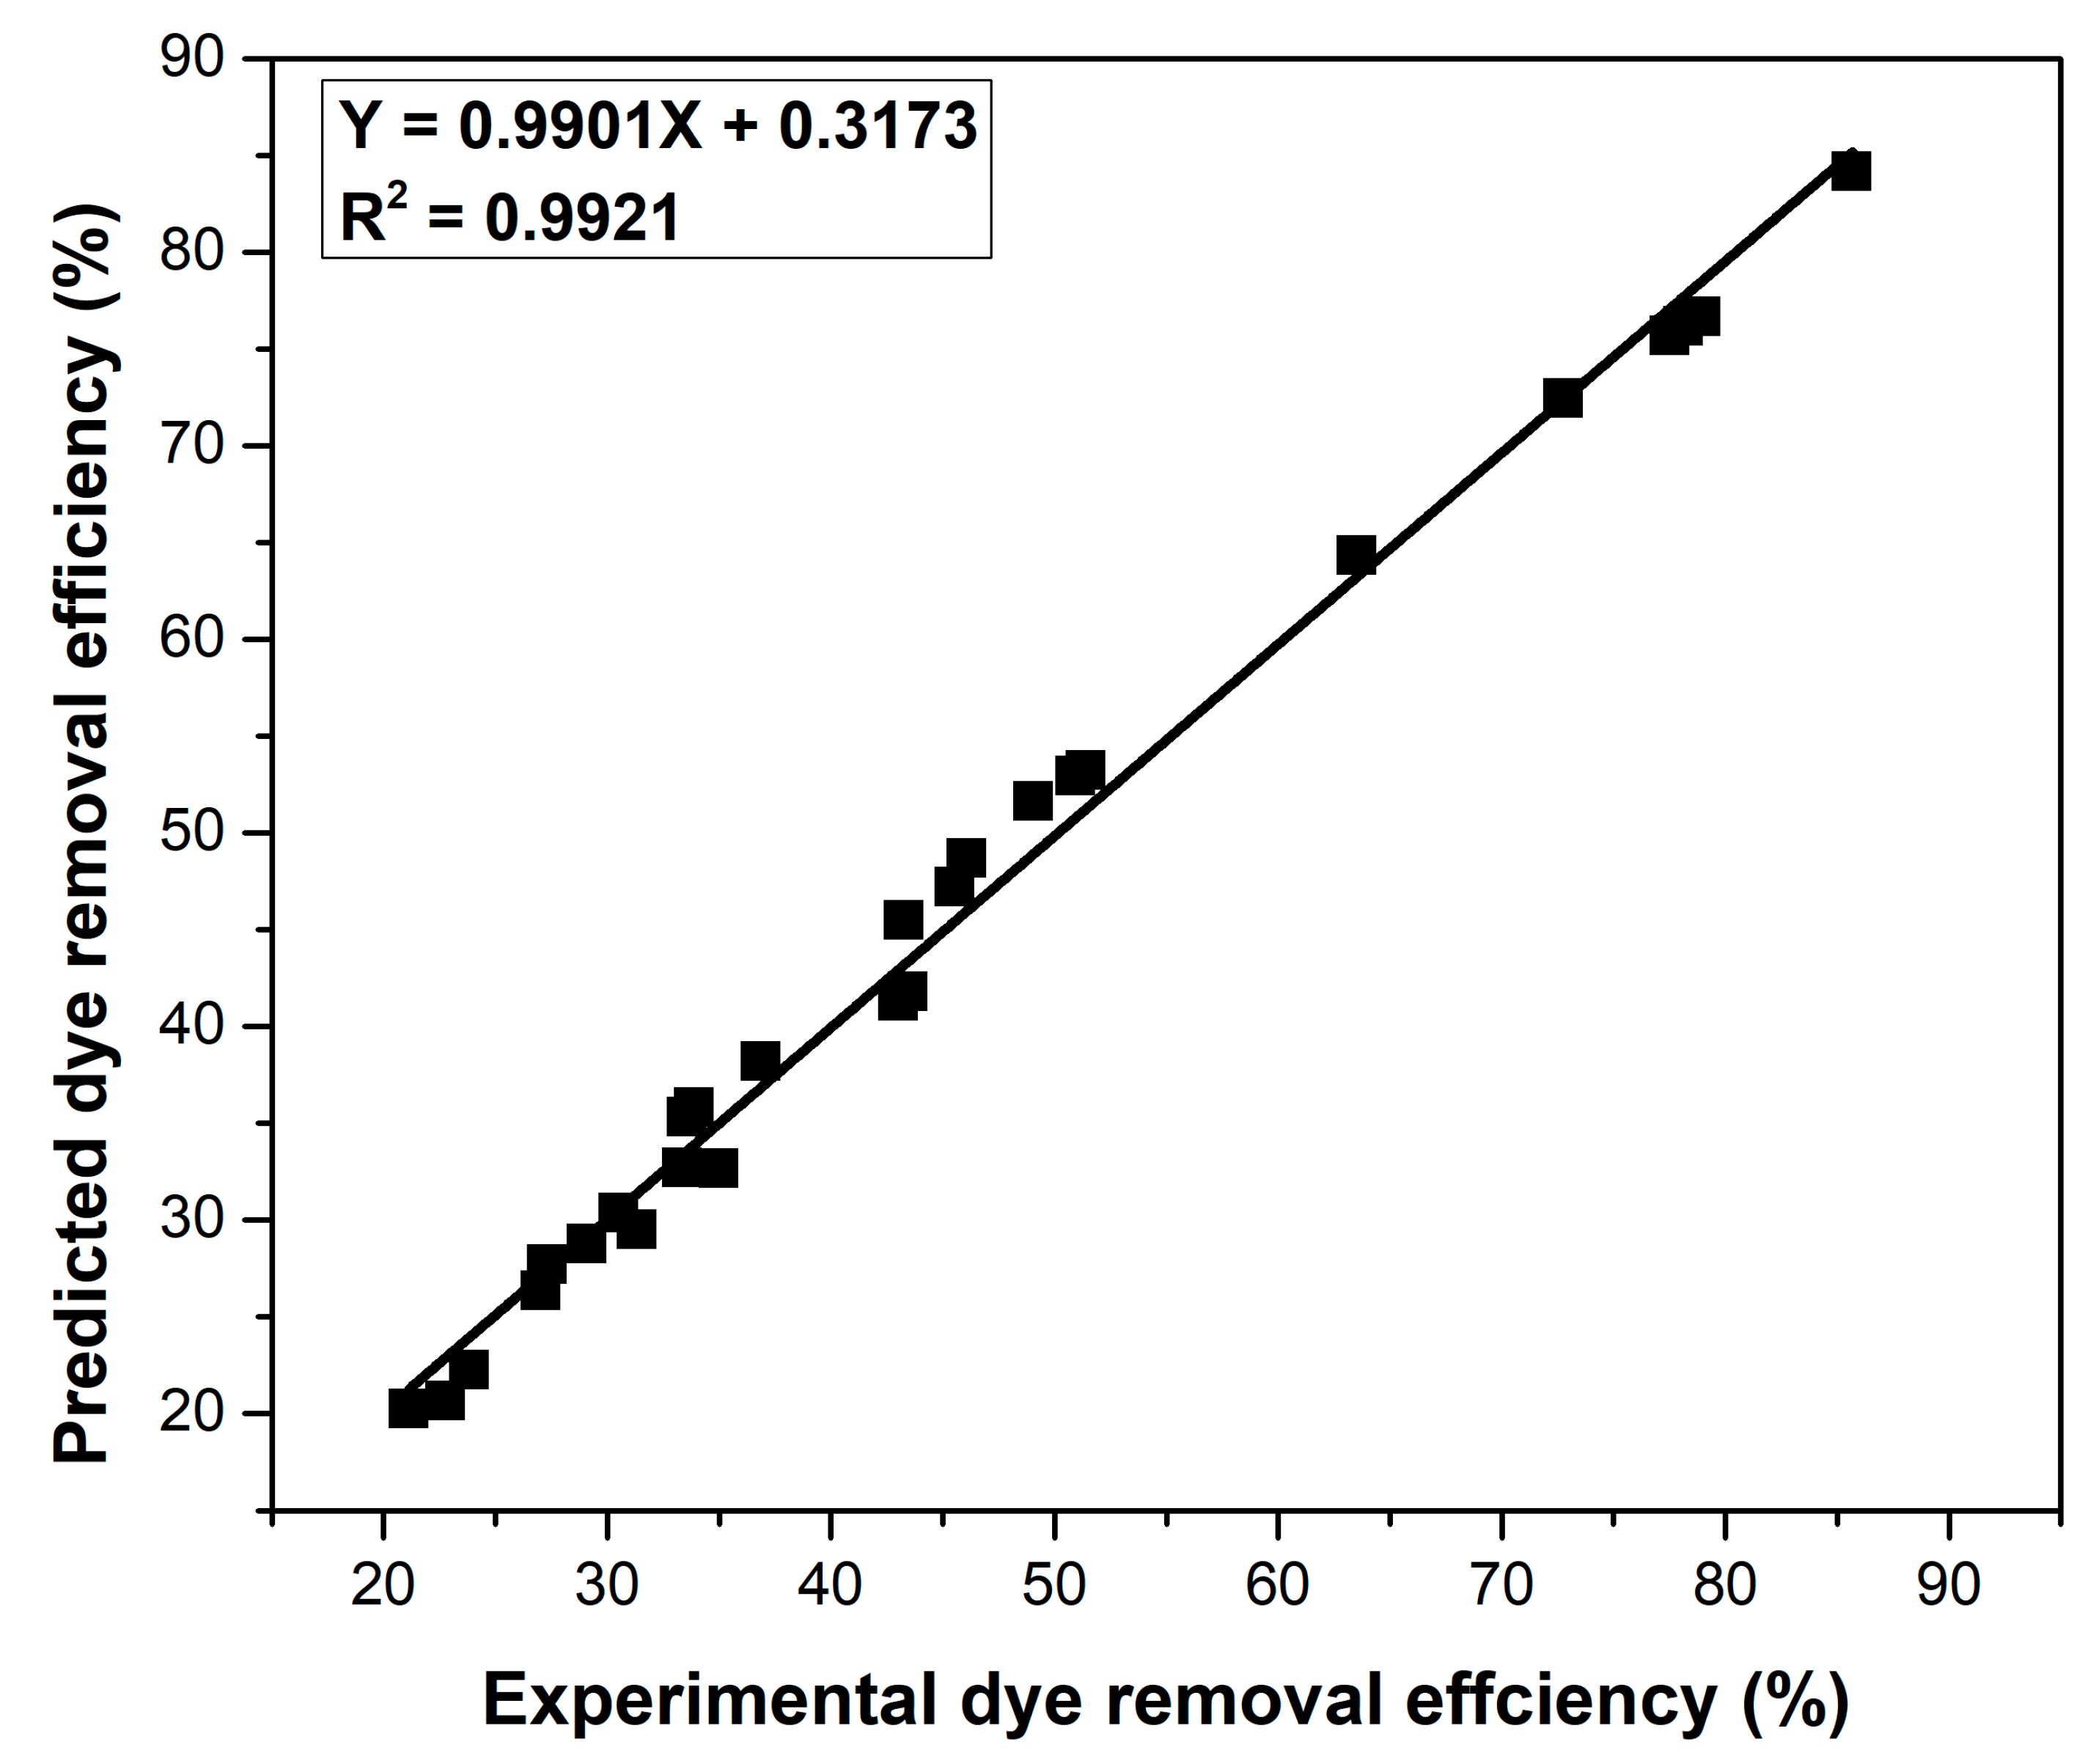
Figure 6.
The fitted curves for the equilibrium isotherms used to model the experimental data [Adsorption conditions: pH = 10, contact time = 60 min, adsorbent dose = 5 (g L−1), temperature = 305 K, ionic strength = 0 (mol L−1), initial dye concentration = 25–350 (mg L−1)].
Figure 6.
The fitted curves for the equilibrium isotherms used to model the experimental data [Adsorption conditions: pH = 10, contact time = 60 min, adsorbent dose = 5 (g L−1), temperature = 305 K, ionic strength = 0 (mol L−1), initial dye concentration = 25–350 (mg L−1)].

Figure 7.
The fitted curves for the kinetic models used to model the experimental data. [Adsorption conditions: pH = 10, initial dye concentration = 25 (mg L−1), adsorbent dose = 5 (g L−1), temperature = 305 K, ionic strength = 0 (mol L−1), contact time = 5–60 min].
Figure 7.
The fitted curves for the kinetic models used to model the experimental data. [Adsorption conditions: pH = 10, initial dye concentration = 25 (mg L−1), adsorbent dose = 5 (g L−1), temperature = 305 K, ionic strength = 0 (mol L−1), contact time = 5–60 min].


Table 1.
The calculation equations for dye removal percentage and adsorption capacity at equilibrium.
Table 1.
The calculation equations for dye removal percentage and adsorption capacity at equilibrium.
| Parameters | Equation |
|---|---|
| Dye removal percentage | |
| Adsorption capacity |
Table 2.
The nonlinear equations of the tested adsorption isotherms.
| Equilibrium Isotherm | Equation |
|---|---|
| Langmuir | |
| Freundlich | |
| Temkin | |
| Redlich–Peterson | |
| Sips |
qm, Qsat—maximum absorption capacities; KL, KF, KT, KS, KRP—Langmuir, Freundlich, Temkin, Sips, Redlich–Peterson isotherm constants; 1/nF—empirical constant indicating the intensity of adsorption; R—universal gas constant; T—absolute temperature; b—Temkin constant, which is related to the adsorption heat; aRP—Redlich–Peterson isotherm constant; βRP—Redlich–Peterson exponent (vary between 0 and 1); n—Sips isotherm exponent [21,25,26].
Table 3.
The nonlinear equations of the tested kinetic models.
| Kinetic Models | Equation |
|---|---|
| Pseudo-first-order | |
| Pseudo-second-order | |
| Elovich | |
| Avrami | |
| General order |
qt—dye amount adsorbed at time t; k1, k2, kAV, kn—rate constants of pseudo-first-order, pseudo-second-order, Avrami and general order models; qe, qn, qAV—theoretical values for the adsorption capacity; a—desorption constant of Elovich model; b—initial velocity; nAV—fractional exponent; n—general order exponent [22,27].
Table 4.
The calculation equations for determination coefficient (R2), adjusted determination coefficient (Radj2), sum of square error (SSE), chi-square (χ2), average relative error (ARE) and hybrid fractional error function (HYBRID).
Table 4.
The calculation equations for determination coefficient (R2), adjusted determination coefficient (Radj2), sum of square error (SSE), chi-square (χ2), average relative error (ARE) and hybrid fractional error function (HYBRID).
| Error Parameter | Equation |
|---|---|
| R2 | |
| R2adj | |
| SSE | |
| χ2 | |
| ARE | |
| HYBRID |
yi,exp—experimental value; yi,mod—modeled value; —mean values, n—total amount of information, np—model parameters number [22].
Table 5.
The calculation equations for thermodynamic parameters (ΔG0, ΔH0, ΔS0).
| Thermodynamic Parameters | Equation |
|---|---|
| Standard Gibbs free energy change | |
| Standard enthalpy change | |
| Standard entropy change |
R—universal gas constant; KL—Langmuir constant; T—absolute temperature [26].
Table 6.
The six three-level factors used to evaluate the effect on dye removal efficiency.
| Factor | Level 1 | Level 2 | Level 3 |
|---|---|---|---|
| pH | 2 | 6 | 10 |
| Time (min) | 5 | 30 | 60 |
| Adsorbent dose (g·L−1) | 1 | 3 | 5 |
| Initial dye concentration (mg·L−1) | 25 | 100 | 200 |
| Temperature (K) | 281 | 291 | 305 |
| Ionic strength (mol L−1) | 0 | 0.15 | 0.25 |
Table 7.
Controllable factors and their levels used in L27 orthogonal array.
| pH | Time (min) | Adsorbent Dose (g L−1) | Initial Dye Concentration (mg L−1) | Temperature (K) | Ionic Strength (mol L−1) | Dye Removal Efficiency (%) | S/N Ratio |
|---|---|---|---|---|---|---|---|
| 2 | 5 | 1 | 25 | 281 | 0.00 | 45.56 | 33.17 |
| 2 | 5 | 1 | 25 | 291 | 0.15 | 27.04 | 28.64 |
| 2 | 5 | 1 | 25 | 305 | 0.25 | 21.14 | 26.50 |
| 2 | 30 | 3 | 100 | 281 | 0.00 | 51.39 | 34.21 |
| 2 | 30 | 3 | 100 | 291 | 0.15 | 30.50 | 29.68 |
| 2 | 30 | 3 | 100 | 305 | 0.25 | 23.85 | 27.55 |
| 2 | 60 | 5 | 200 | 281 | 0.00 | 49.05 | 33.81 |
| 2 | 60 | 5 | 200 | 291 | 0.15 | 29.11 | 29.28 |
| 2 | 60 | 5 | 200 | 305 | 0.25 | 22.76 | 27.14 |
| 6 | 5 | 3 | 200 | 281 | 0.15 | 34.98 | 30.87 |
| 6 | 5 | 3 | 200 | 291 | 0.25 | 27.30 | 28.72 |
| 6 | 5 | 3 | 200 | 305 | 0.00 | 63.54 | 36.06 |
| 6 | 30 | 5 | 25 | 281 | 0.15 | 43.43 | 32.75 |
| 6 | 30 | 5 | 25 | 291 | 0.25 | 33.90 | 30.60 |
| 6 | 30 | 5 | 25 | 305 | 0.00 | 78.90 | 37.94 |
| 6 | 60 | 1 | 100 | 281 | 0.15 | 43.01 | 32.67 |
| 6 | 60 | 1 | 100 | 291 | 0.25 | 33.57 | 30.52 |
| 6 | 60 | 1 | 100 | 305 | 0.00 | 78.12 | 37.85 |
| 10 | 5 | 5 | 100 | 281 | 0.25 | 33.37 | 30.46 |
| 10 | 5 | 5 | 100 | 291 | 0.00 | 77.52 | 37.78 |
| 10 | 5 | 5 | 100 | 305 | 0.15 | 46.09 | 33.27 |
| 10 | 30 | 1 | 200 | 281 | 0.25 | 31.32 | 29.91 |
| 10 | 30 | 1 | 200 | 291 | 0.00 | 72.76 | 37.23 |
| 10 | 30 | 1 | 200 | 305 | 0.15 | 43.26 | 32.72 |
| 10 | 60 | 3 | 25 | 281 | 0.25 | 36.87 | 31.33 |
| 10 | 60 | 3 | 25 | 291 | 0.00 | 85.67 | 38.65 |
| 10 | 60 | 3 | 25 | 305 | 0.15 | 50.93 | 34.14 |
Table 8.
Response table for signal-to-noise ratios (the underlined values of S/N ratio indicate the optimum condition).
Table 8.
Response table for signal-to-noise ratios (the underlined values of S/N ratio indicate the optimum condition).
| Level | pH | Time | Adsorbent Dose | Initial Dye Concentration | Temperature | Ionic Strength |
|---|---|---|---|---|---|---|
| 1 | 30.00 | 31.72 | 32.14 | 32.64 | 32.14 | 36.31 |
| 2 | 33.11 | 32.52 | 32.36 | 32.67 | 32.35 | 31.56 |
| 3 | 33.95 | 32.82 | 32.56 | 31.75 | 32.58 | 29.20 |
| Delta | 3.95 | 1.10 | 0.43 | 0.92 | 0.44 | 7.11 |
| Rank | 2 | 3 | 6 | 4 | 5 | 1 |
Table 9.
The adsorption isotherm models specific constants and error parameters.
| Isotherm Model | Parameters | Value |
|---|---|---|
| Langmuir | KL (L mg−1) | 0.023 ± 0.003 |
| qmax (mg g−1) | 109.5 ± 5.24 | |
| R2 | 0.9916 | |
| Radj2 | 0.9891 | |
| SSE | 81.96 | |
| χ2 | 2.59 | |
| ARE (%) | 7.66 | |
| HYBRID | 37.06 | |
| Freundlich | Kf (mg g−1) | 9.37 ± 1.84 |
| 1/n | 0.44 ± 0.03 | |
| R2 | 0.9424 | |
| Radj2 | 0.9381 | |
| SSE | 513.45 | |
| χ2 | 13.86 | |
| ARE (%) | 15.40 | |
| HYBRID | 190.97 | |
| Temkin | KT (L mg−1) | 0.227 ± 0.029 |
| b (kJ g−1) | 100.96 ± 5.13 | |
| R2 | 0.9877 | |
| Radj2 | 0.9860 | |
| SSE | 106.02 | |
| χ2 | 2.54 | |
| ARE (%) | 8.36 | |
| HYBRID | 36.37 | |
| Redlich–Peterson | KRP (L g−1) | 2.59 ± 0.18 |
| aRP (L mg−1) | 0.024 ± 0.006 | |
| βRP | 0.93 ± 0.05 | |
| R2 | 0.9915 | |
| Radj2 | 0.9972 | |
| SSE | 82.45 | |
| χ2 | 2.62 | |
| ARE (%) | 7.72 | |
| HYBRID | 37.56 | |
| Sips | Qsat (mg g−1) | 103.2 ± 4.21 |
| KS (L mg−1) | 0.014 ± 0.003 | |
| n | 1.17 | |
| R2 | 0.9992 | |
| Radj2 | 0.9990 | |
| SSE | 6.99 | |
| χ2 | 0.24 | |
| ARE (%) | 2.46 | |
| HYBRID | 2.82 |
Table 10.
The kinetic models specific constants and error parameters.
| Kinetic Model | Parameters | Value |
|---|---|---|
| Pseudo-first order | k1 (min−1) | 0.461 ± 0.041 |
| qe,calc (mg g−1) | 18.67 ± 0.32 | |
| R2 | 0.9919 | |
| Radj2 | 0.9858 | |
| SSE | 2.46 | |
| χ2 | 0.13 | |
| ARE (%) | 13.44 | |
| HYBRID | 1.90 | |
| Pseudo-second order | k2 (min−1) | 0.065 ± 0.007 |
| qe,calc (g mg−1 min−1) | 19.31 ± 0.16 | |
| R2 | 0.9979 | |
| Radj2 | 0.9973 | |
| SSE | 0.62 | |
| χ2 | 0.03 | |
| ARE (%) | 12.43 | |
| HYBRID | 0.52 | |
| Elovich | a (g mg−1) | 0.641 ± 0.052 |
| b (mg g−1 min−1) | 9407 ± 374 | |
| R2 | 0.9932 | |
| Radj2 | 0.9914 | |
| SSE | 2.28 | |
| χ2 | 0.83 | |
| ARE (%) | 13.01 | |
| HYBRID | 11.94 | |
| Avrami | kAV (min−1) | 0.819 ± 0.078 |
| qAV (mg g−1) | 18.67 ± 0.25 | |
| nAV | 0.56 ± 0.07 | |
| R2 | 0.9919 | |
| Radj2 | 0.9893 | |
| SSE | 2.46 | |
| χ2 | 0.13 | |
| ARE (%) | 2.33 | |
| HYBRID | 1.89 | |
| General order | kN (min−1 (g mg−1)n–1) | 0.065 ± 0.012 |
| qn (mg g−1) | 19.31 ± 0.18 | |
| n | 2.01 ± 0.16 | |
| R2 | 0.9992 | |
| Radj2 | 0.9987 | |
| SSE | 0.21 | |
| χ2 | 0.01 | |
| ARE (%) | 0.70 | |
| HYBRID | 0.17 |
Table 11.
The thermodynamic parameters used to assess the dye adsorption process.
| ΔG0 (kJ mol−1) | ΔH0 (kJ mol−1) | ΔS0 (J mol−1 K−1) | ||
|---|---|---|---|---|
| 281 K | 291 K | 305 K | ||
| −20.05 | −20.85 | −21.97 | 0.29 | 9.62 |
Disclaimer/Publisher’s Note: The statements, opinions and data contained in all publications are solely those of the individual author(s) and contributor(s) and not of MDPI and/or the editor(s). MDPI and/or the editor(s) disclaim responsibility for any injury to people or property resulting from any ideas, methods, instructions or products referred to in the content. |
© 2023 by the authors. Licensee MDPI, Basel, Switzerland. This article is an open access article distributed under the terms and conditions of the Creative Commons Attribution (CC BY) license (https://creativecommons.org/licenses/by/4.0/).
Share and Cite
MDPI and ACS Style
Mosoarca, G.; Popa, S.; Vancea, C.; Dan, M.; Boran, S. Modelling and Optimization of Methylene Blue Adsorption Process on Leonurus cardiaca L. Biomass Powder. Processes 2023, 11, 3385. https://doi.org/10.3390/pr11123385
AMA Style
Mosoarca G, Popa S, Vancea C, Dan M, Boran S. Modelling and Optimization of Methylene Blue Adsorption Process on Leonurus cardiaca L. Biomass Powder. Processes. 2023; 11(12):3385. https://doi.org/10.3390/pr11123385
Chicago/Turabian StyleMosoarca, Giannin, Simona Popa, Cosmin Vancea, Mircea Dan, and Sorina Boran. 2023. "Modelling and Optimization of Methylene Blue Adsorption Process on Leonurus cardiaca L. Biomass Powder" Processes 11, no. 12: 3385. https://doi.org/10.3390/pr11123385
Note that from the first issue of 2016, this journal uses article numbers instead of page numbers. See further details here.