
Pore Fluid Movability in Fractured Shale Oil Reservoir Based on Nuclear Magnetic Resonance

1
Research Institute of Petroleum Exploration and Development, PetroChina, Beijing 100083, China
2
CNOOC Research Institute Ltd., Beijing 100028, China
*
Author to whom correspondence should be addressed.
Processes 2023, 11(12), 3365; https://doi.org/10.3390/pr11123365
Submission received: 19 October 2023
/
Revised: 28 November 2023
/
Accepted: 29 November 2023
/
Published: 4 December 2023
(This article belongs to the Special Issue Advanced Fracturing Technology for Oil and Gas Reservoir Stimulation)
Abstract
:Gulong shale oil is found in a typical continental shale oil reservoir, which is different from marine shale oil reservoirs. The Gulong shale oil reservoir is a pure shale-type oil reservoir with abundantly developed nanoscale pores, making it extremely difficult to unlock fluids. Pressure drive does not easily achieve fluid unlock conditions; thus, it is necessary to utilize imbibition to unlock nanoscale pore fluids. In this study, experiments were conducted on oil displacement by high-speed centrifugal pressure and imbibition under different conditions, respectively, and simulations were used to evaluate the effects of pressure differential drive and imbibition efficiency on the utilization of crude oil following fracturing. Combined with the mixed wettability of the reservoir, the imbibition efficiency was analyzed, and the imbibition efficiency at different soaking stages was evaluated. When the fracturing pressure was higher than the matrix pore pressure, the imbibition efficiency was the most obvious, which was 27.9%. Spontaneous imbibition depending solely on capillary force had poor efficiency, at 16.8%. When the fracturing pressure was lower than the matrix pore pressure, the imbibition efficiency was the lowest, at only 1.3%. It is proposed that strengthening fracture pressure and promoting pressurized imbibition are the keys to improving shale oil development.
1. Introduction
Unconventional resources, including tight oil/gas reservoirs and shale oil/gas reservoirs, have become important energy sources worldwide. Due to the abundant presence of nanoscale pores, these reservoirs have ultra-low permeabilities, which make their effective development challenging. How to effectively utilize nanoscale pore fluids is critical to shale reservoir development [1]. Compared to conventional reservoirs, the factors that lead to poor movability of shale oil include (1) shale reservoirs being relatively tight, with a complex pore–throat microstructure, low porosity and ultra-low permeability characteristics; (2) shale oil having high viscosity and large molecular size; and (3) some oil molecules being adsorbed on the surface of organic matter or minerals [2]. The adsorbed and free shale oil stored in shale is potentially movable and recoverable, while the dissolved shale oil that is miscible with organic matter is almost immobile and difficult to extract. However, under current technological conditions, free oil is the most easily recovered part [3]. Theoretically, the free oil content is the maximum recoverable amount of shale oil. Shale oil with strong movability is often dominated by the free phase, which does not flow easily when the content of the adsorbed phase is high, indicating that the occurrence state of shale oil is an important factor affecting its movability.
Due to the low porosity and especially the low permeability of shale, as well as the high density and viscosity of oil, subsurface flow does not readily occur. The key limitation restricting shale oil exploration and development is not the oil content in shale but the amount of recoverable section involved. The movability of shale oil is closely related to its occurrence characteristics (occurrence state, content, and proportion of different states) and storage space (pore and throat size, distribution, and connectivity), and is also influenced by reservoir fluid conditions (oil composition, temperature, and pressure) [4]. Theoretically speaking, shale oil movability includes at least two aspects: movable potential and movability. The saturation of movable fluid is a key parameter for evaluating the movability of shale reservoirs, and the utilization of nuclear magnetic resonance and centrifugal (displacement) testing methods is the main means of studying the saturation of movable fluid [5,6,7]. Combining nuclear magnetic resonance (NMR) with centrifugal experiments can reveal not only the movable fluid saturation of shale cores but also the movable fluid saturation controlled by different pore and throat properties in each core, making it possible to quantitatively analyze the distribution of the movable fluid in the reservoir and evaluate the fluid movability. After hydraulic fracturing in shale reservoirs, the fracturing fluid (water or other chemical agents) is prone to imbibition when it meets the matrix through the fracture area, and the residual oil in the fracture network is prone to imbibition with the fracturing fluid, especially during the process of sealing the well [8].
This study conducted high-speed centrifugation + NMR testing and imbibition + NMR testing, clarified the mechanism of pore fluid movability by imbibition under different pressure conditions, and clarified the influence of wettability on imbibition. This study used Gulong shale cores that had similar physical properties, high authenticity, and high comparability. Firstly, the mixed wettability of the core was evaluated and then imbibition and NMR tests were conducted under different conditions to quantitatively analyze the movability and recovery degree of different-sized pores. This work provides an experimental basis for controlling formation pressure in shale oil reservoirs and experimental data support for improving shale oil recovery.
2. Materials and Methods
2.1. High-Speed Centrifugation + NMR Test
According to the basic principle of NMR, the NMR signals of porous hydrogen-containing fluids are divided into three parts: surface relaxation, volume relaxation, and diffusion relaxation. Among them, the interaction between the surface relaxation fluid and pore surface is related, the molecular structure of the relaxation jade fluid is related to the volume, and diffusion relaxation is related to the magnetic field gradient inside the pores. The surface relaxation is dominant in light crude oil, and the lateral relaxation signal T2 satisfies Equation (1):
where T2 is the transverse relaxation signal quantity, r is the scale of the fluid-containing pores, Fs is the shape factor of the pores, and ρ2 is the lateral relaxation rate obtained from the pore surface.
The shape factor of the pore and lateral relaxation rate of the experimental rock sample are both fixed values, so the signal quantity of lateral relaxation is positively correlated with the pore radius. Based on the collected water-saturated core sample echo failure signal, a joint iterative inversion algorithm is used to obtain the sample’s T2 spectrum. The lateral relaxation time (T2) of nuclear magnetic resonance can reflect the chemical environment in which the hydrogen protons are located inside the sample, which is related to the binding force and degree of freedom of the hydrogen protons. The degree of hydrogen proton binding is closely related to the internal structure of the sample. In porous media, the larger the pore radius, the longer the relaxation time of the water present in the pores; The smaller the pore radius, the greater the degree of binding of the water present in the pores, and the shorter the relaxation time. That is, the position of the T2 spectrum peak is related to the size of the pore radius, and the area of the peak is related to the number of corresponding pores.
Through the T2 spectrum, information such as core porosity and pore size distribution can be obtained to describe the complex properties of core pores more accurately, and different types and components of fluids can be identified through secondary resonance fluid identification methods. By combining mercury intrusion data and the corresponding relationship with the relaxation time of the nuclear magnetic T2 spectrum, the pore throat radius of matrix-layered quartz core can be expressed (Equation (2)). Mercury in the non-wetting phase needs to enter smaller pores under external forces, and the pore throat radius r satisfies the Washburn equation with respect to the mercury inlet pressure pc, the contact angle θ of mercury on the surface, and the surface tension σ.
The frequency of pore throat distribution is set as the vertical axis and the radius of pore throat as the horizontal axis; the pore diameter distribution curve obtained by the mercury intrusion method is fitted, and the C value with the highest correlation coefficient is taken as the optimal value. This value is the conversion coefficient between the T2 value obtained and the pore throat radius. A Gulong shale core was selected to fit the distribution frequency of pores and throats measured using the nuclear magnetic method and the mercury intrusion method. The fitting of nuclear magnetic mercury intrusion in the shale core is shown in Figure 1. The relaxation time of NMR T2 is proportional to the pore size. The pore throat distribution map obtained from the mercury intrusion experiment was compared with the one-dimensional T2 spectrum. The results of the two methods for determining pore structure were similar and both had a bimodal structure. Therefore, the NMR and pore throat distribution curves were overlapped and compared, and it was found that the two peaks perfectly overlapped. Through statistical calculation, the conversion coefficient between the shale’s nuclear magnetic T2 value and pore throat radius was found to be 0.008 μm/ms.
By using centrifugal equipment and one-dimensional nuclear magnetic resonance technology (sampling frequency (KHz): 125; main frequency (KHz): 12; sampling points: 1024; 180° pulse width (μs): 13.04 (acquisition required); after center correction, we searched for the pulse width to obtain the required acquisition parameters), the threshold pressure gradient of different pore sizes was tested, and the available oil saturation under different pressures was compared. Firstly, we measured the hydrogen signal in the initial state of the rock; we saturated the rock with crude oil finally, we recorded the hydrogen signal in the saturated oil state of the core. Using 8 psi as the starting centrifugal force, the degree of crude oil recovery was recorded at 15 psi, 77 psi, 151 psi, 378 psi, and 570 psi, and the pore fluid movability was observed with NMR.
2.2. Imbibition + NMR Test
This study conducted three types of imbibition tests under different pressures, namely, lower than formation pressure, higher than formation pressure, and spontaneous imbibition. Corresponding to the imbibition effects at different development stages, self-imbibition tests were first conducted to calculate the relative wetting index to determine the mixed wettability of the shale core. Then, imbibition experiments were conducted under different pressures.
- (1)
- Experimental study on mixed wettability
Wettability is the preferential selectivity of a solid surface covered by a certain fluid phase. The wettability of rock reservoirs can be divided into water wetting, oil wetting, and neutral wetting according to the different fluids involved [9]. Oil exists in the pores of reservoir rocks, and the wettability of the pore surface varies due to its mineral composition, thereby affecting the occurrence and flow properties of oil in it. Wettability is a relative characteristic parameter that is different from porosity and permeability, which are only related to rock properties. Wettability is related not only to the rock itself but also to the fluid properties associated with it. It affects many physical parameters of rocks, such as capillary pressure, relative permeability, adsorbed/free oil volume, residual oil saturation, bound water saturation, and fluid distribution [10].
This study used the relative index method of indirect measurement of wettability to characterize the wettability of shale in the study area. In this paper, the relative index method, which indirectly measures wettability, is used to characterize wettability at the pore scale of shale cores. The signal volume of the sample after oil absorption and drying was measured at different self-imbibition test times, and then the self-imbibition fluid volume was converted from the fluid signal volume. Finally, according to the self-imbibition method in the wettability discrimination standard [11], the relative wettability index I was used to characterize the wettability of different samples to oil and water at the same time. V is the volume of fluid self-imbibed into the core; the subscript symbol w is for water, and o is for oil. The equation and discrimination criteria are as follows:
The oil phase wetting index is shown in Equation (4):
And based on the relative wettability index calculation method (Equation (5)) and the self-imbibition method in the wettability discrimination standard (Table 1), the wettability of the rock was determined.
- (2)
- Spontaneous imbibition + NMR test
Soak the sample in deuterium oxide, and use capillary force to spontaneously imbibe deuterium oxide into the pores to displace crude oil. Use nuclear magnetic resonance to monitor and record the process of sample signal changes to obtain the movability efficiency of crude oil under self-imbibition. Spontaneous imbibition relies solely on capillary force, and the amount of water and oil in the core sample depends entirely on its wettability.
- (3)
- Overpressure imbibition/underpressure imbibition + NMR test
The imbibition characteristics and pore movability characteristics of shale cores under reservoir conditions (reservoir pressure and temperature) were clarified considering the changing pressure difference in the relationship between fracture pressure and pore pressure during the soaking-backflow stage. For example, in the soaking stage, fracture pressure is higher than pore pressure. Therefore, overpressure imbibition can simulate the imbibition effect during the soaking stage, while in the later stage of backflow, fracture pressure is lower than pore pressure; underpressure imbibition can simulate the imbibition effect during the later stage of backflow. Schematic diagrams of the three imbibition methods are shown in Figure 2.
2.3. Experimental Samples
The experimental shale core samples were obtained from the Daqing Gulong shale reservoir (Table 2). The samples were de-oiled and dried. The diameter of each experimental shale core sample was about 2.5 cm, and the length was about 5 cm. Helium gas was used to measure the porosity and permeability of the cores, and cores with similar porosity and permeability were selected for the experiment to ensure comparability. Spontaneous oil imbibition and overpressure injection were used to fully saturate the core samples. After spontaneous imbibition, the sample was saturated with crude oil; then, it was placed under normal temperature and pressure conditions for 120 h. The overpressure and underpressure imbibition samples were saturated with oil and placed under high-pressure conditions.
3. Results and Discussion
3.1. Results of High-Speed Centrifugation + NMR Test
The NMR results under different centrifugal forces are shown in Figure 3. It can be observed that the T2 spectrum shows a bimodal distribution after saturation of crude oil and a series of centrifugation steps. Research results showed that the Gulong shale reservoir develops a certain number of bedding fractures, mostly on the sub-micron to micron scale [12]. The right peak in the bimodal structure represents a micro-scale bedding fracture, and, after multiple centrifugations, this peak disappears, indicating that the fluid in the bedding fracture is more easily unlocked under centrifugation compared with the fluid in the matrix pores. The degree of crude oil recovery was calculated based on the difference in the area under the curve at different centrifugal forces, and the degree of crude oil production with different pore sizes was determined based on the relaxation time.
The high-speed centrifugation and one-dimensional nuclear magnetic resonance experiments showed that the available oil saturation driven by elastic energy reached 18.1%, the displacement limit was a 15 nm pore crude oil, and the corresponding pressure gradient was 1.2 MPa/cm. The bedding fracture density of Gulong shale oil was 3 pieces/cm, and within the control range of parallel fractures, the threshold pressure gradient of 15 nm pore fluid was 0.2 MPa (Figure 4).
3.2. Wettability Test Results
The imbibition characteristics of different pores are shown in the Figure 5. The core exhibits a typical bimodal pattern under water-saturated conditions, with a higher peak on the left side, indicating the development of small matrix pores in the shale. The peak value on the right side is lower, but the relaxation time is longer, indicating a lower degree of development of bedding fractures and larger pores than the matrix pores.
Comparing the self-imbibition processes of different pores (Figure 5), it was found that the shale cores had a strong self-imbibition ability for oil, and the self-imbibed amount of matrix water and oil increased rapidly in a short period of time. Moreover, compared to bedding fractures, the higher self-imbibition liquid content of the matrix pore structure reflects not only the larger pore volume of the matrix but also its stronger self-imbibition ability.
The amount of water self-imbibed by the bedding fractures slowly increased with the self-imbibition time, and the growth rate was relatively low. The amount of self-imbibed oil in the matrix pores increased as the duration of self-imbibition increased, and the difference in crude oil permeability between the shale reservoir and the matrix was significant. As mentioned earlier, the T2 relaxation time is directly proportional to the pore size, while the large-scale structure of the Gulong shale reservoir is characterized by bedding fractures, which are formed by the interaction of a large amount of organic matter and clay minerals. The wettability of this part of the structure is lipophilic (as confirmed through the mixed wetting experiment). During the self-imbibition process, water cannot enter strongly oil-wet media, while oil can enter water-wet media [13]. This also reflects the presence of a bedding fracture structure in the shale reservoir, but the content is much smaller than that of the porous media.
Based on the calculation results of mixed wettability (Figure 6), it is shown that the overall rock exhibits intermediate wettability, with a relative wettability index between −0.1 and 0. The wettability of matrix pores and bedding fractures is different, with matrix pores being intermediate wet to weakly oil-wet, with a relative wettability index ranging from −0.1 to 0, and the bedding fracture being oil-wet to strongly oil-wet, with a relative wettability index ranging from −0.9 to −0.3. From the wettability results, it can be inferred that the shale core has poor permeability and that the wettability of the bedding fractures is not conducive to the entry of the water phase.
3.3. Characteristics of Spontaneous Imbibition and the Movability of Different Pore Fluids
Spontaneous imbibition and oil drainage is a universal method of water imbibition and oil drainage during the soaking process after fracturing. The oil drainage driven by capillary force causes the movability efficiency to increase with the decrease in pore size and forms an oil drainage method with “matrix pores as the main factor and bedding fractures as the auxiliary factor”. The one-dimensional nuclear magnetic resonance results indicate that under spontaneous imbibition conditions, both micropores and bedding fractures undergo significant development. In the early stage of imbibition, the development of micropores is relatively high, while in the later stage, the development of bedding fractures is relatively high.
A comparison of nuclear magnetic resonance signals before and after imbibition is shown in Figure 7, showing a clear bimodal distribution within the range of 0.01~1000 ms. The difference in bimodal hydrogen signals was small, with only a small amount of signal distribution over 1000 ms. Based on the morphological characteristics of the T2 spectrum and relaxation time, the internal pore structure of the rocks was divided into micropores and medium to large pores.
Based on the centrifuged samples mentioned earlier, we believe that the pores corresponding to a T2 relaxation time of less than 10 ms are micropores, and the pores corresponding to a T2 relaxation time of greater than 10 ms are macropores. By comparing the areas enclosed by T2-signal amplitudes before and after imbibition, we can calculate the recovery degree. The results show that the absolute movability efficiency of micropores was 12.1%, the movability efficiency of medium and large pores for crude oil was 27.5%, and the final movability efficiency of the sample was about 16.8%. The main source of oil drainage was the matrix micropores, but the movability of crude oil of large pores was stronger, and the relative oil drainage efficiency was higher. Based on the relationship between imbibition time and crude oil movability efficiency, it was found that the early movability efficiency of bedding fractures was high, while the later movability effect of bedding fractures was not significant.
3.4. Characteristics of Overpressure Imbibition/Underpressure Imbibition on the Movability of Different Pore Fluid
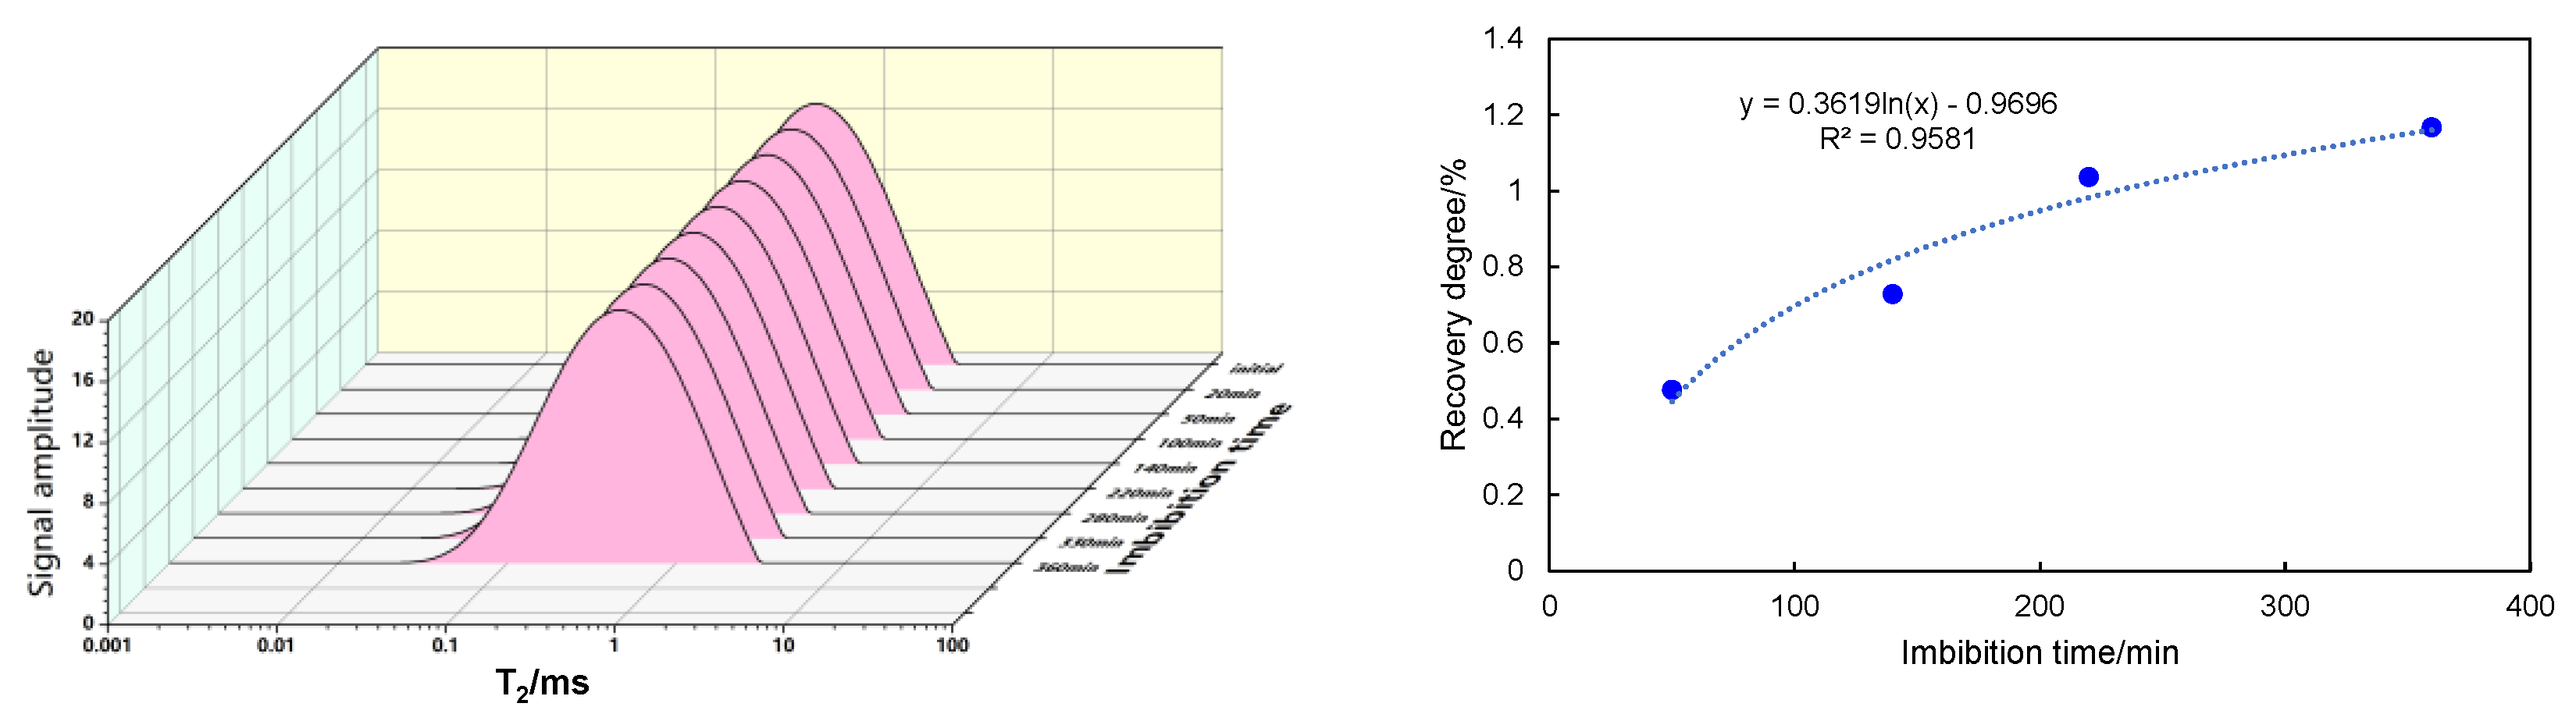
Under experimental conditions consisting of a pore pressure of 34 MPa (simulated formation pressure) and a temperature of 90 ℃ (simulated formation temperature), the environmental pressure for soaking the core in deuterium oxide was 40 MPa (simulated fracture pressure after fracturing). The experimental results show the movability of oil stored in the cores at different imbibition times and the degree of oil recovery at different imbibition times through the T2 spectrum of overpressure imbibition (Figure 8a) The oil-bearing pores of the cores were nanopores, and the content of bedding fractures was relatively small.
After 12 h of imbibition, a significant decrease in the signal intensity of the T2 spectrum was observed, corresponding to a recovery degree of 13.2%. From 10 h to 24 h of imbibition, a slow decrease in the signal intensity of the T2 spectrum was observed, and the upward trend of the recovery degree curve was relatively slow. When the imbibition time reached 24 h, core imbibition and oil recovery began to slow down, and the recovery curve gradually became flat. At that time, the recovery degree was 27.7%, and the recovery curve stabilized until an imbibition and oil recovery time of 50 h. The final imbibition and oil recovery degree was 27.9%. And by comparing the results of spontaneous imbibition experiments, it was found that the duration of overpressure imbibition was much longer than that of spontaneous imbibition. During the spontaneous imbibition process, the capillary pressure in the water-wet pores points towards the interior of the core. Under this capillary force, water can be spontaneously imbibed into the shale core. However, during the overpressure imbibition process, taking the same water-wet pores as an example, capillary force still points towards the interior of the core, while there is a pressure-difference-driven force outside the core, and the direction of the pressure difference also points towards the interior of the core. Therefore, there are two forces (capillary force and pressure-difference-driven force) at the pore interface, with the same direction, which promote the rapid contraction of crude oil inside the core, making it easier for water to enter the core. Therefore, we believe that in the process of overpressure imbibition, the pressure-difference-driven force and capillary force have a synergistic effect. However, the dominant contributor to this synergistic effect changes under different conditions. Studies have shown that when pressurized infiltration occurs in sandstone with high permeability, the pressure-difference-driven effect is significant, while the capillary force is small, so the pressure difference-driven effect dominates; by contrast, in shale cores with extremely low permeability, capillary force dominates, while pressure-difference-driven force is relatively small, and there is an optimal range of action [14].
In reservoir formations, there is pore pressure in the matrix pores, and the efficiency of underpressure imbibition is much lower than that of spontaneous imbibition. The movability efficiency of underpressured crude oil is only about 1/10 of that of overpressured crude oil (Figure 9). The decrease in movability efficiency is mainly due to the cancellation of capillary force by the pressure in the matrix pores, making it difficult for deuterium oxide to exchange crude oil.
Based on the above tests, oil displacement efficiency under centrifugal pressure is significantly lower than crude oil movability efficiency under imbibition, and it can be clearly observed that the formation energy has a significant impact on the oil and water replacement efficiency during the soaking process. The main flow medium of the Gulong shale core is oil-wet to strongly oil-wet bedding fracture, which restricts the imbibition effect. Therefore, after fracturing, the pressure in the fracture media should be significantly greater than the formation pressure, promoting the effective entry of the bedding fracture fluid into the reservoir and the replacement of the crude oil.
4. Conclusions
This study used a combination of multiple experimental methods to compare and analyze the movability of matrix pore fluids during the processes of soaking and backflow in shale oil reservoirs after fracturing. The impacts of fracturing pressure at different backflow stages on fluid movability were fully considered. The movability of fluids based on nuclear magnetic resonance was quantitatively analyzed, clarifying the main contribution of the wettability of bedding fractures to fluid flow capacity.
- (1)
- During the backflow stage, the matrix pore fluid is difficult to unlock under differential pressure drive, and under the action of high-speed centrifugal differential pressure, up to 18.1% of the fluid can be utilized; the main contribution is provided by microscale pores. The utilization of nanoscale pore fluids is almost impossible.
- (2)
- The mixed wetting of porous and fractured dual media indicated that fluid imbibition has different effects in different media. The experimental results indicated that the fractured media are oil-wet, while the porous media show neutral wetting. This is unfavorable for flow of shale cores with the main flow channels of foliated fractures but beneficial to the flow of crude oil that mainly exists in pores.
- (3)
- The fracturing pressure is crucial for the imbibition effect of matrix pores. When the fracture pressure is higher than matrix pore pressure, the imbibition efficiency is 27.9%; spontaneous imbibition efficiency when relying solely on capillary force is poor, at 16.8%; when the fracture pressure is lower than the matrix pore pressure, the imbibition efficiency is the lowest, at 1.3%.
- (4)
- During the process of shut-in well backflow, it is necessary to ensure that the fracturing pressure is sufficiently higher than the pore pressure, which not only maintains the fracture morphology but also efficiently utilizes the imbibition effect to drive a continuous oil/water displacement.
Author Contributions
Methodology, Y.L. and Z.C.; validation, D.J.; formal analysis, Y.H.; investigation, Y.P.; supervision, Z.L. All authors have read and agreed to the published version of the manuscript.
Funding
This work was supported by the Chinese National Natural Science Foundations (No. U22B2075 and No. 52204053) and the China Postdoctoral Science Foundation (No. 2023M743922). This work was also conducted at the state key laboratory of enhanced oil and gas recovery.
Data Availability Statement
Due to the privacy restrictions on the experimental data and procedures, and the fact that some of the other data remain unpublished, it is not convenient to provide the data. All authors guarantee the authenticity and reliability of the data in this paper.
Conflicts of Interest
Yishan Liu, Zhewei Chen, Dongqi Ji, Yingfeng Peng and Zhengdong Lei were employed by Research Institute of Petroleum Exploration and Development, PetroChina, and Yanan Hou was employed by the company CNOOC Research Institute Ltd.
References
- Lei, Z.; Li, J.; Chen, Z.; Dai, X.; Ji, D.; Wang, Y.; Liu, Y. Characterization of Multiphase Flow in Shale Oil Reservoirs Considering Multiscale Porous Media by High-Resolution Numerical Simulation. SPE J. 2023, 1–16. [Google Scholar] [CrossRef]
- Li, J.; Lu, S.; Zhang, J.; Zhang, P.; Xue, H. Quantitative evaluation models of adsorbed and free shale oil and its microscopic occurrence mechanism. Oil Gas Geol. 2019, 40, 583–592. [Google Scholar]
- Jiang, Q.; Shen, B.; Yang, Y.; Li, Z.; Ma, Y.; Qian, M. Kinetic analysis of hydrocarbon generation components in shales from the Bonan sub-Sag and its significance for hydrocarbon exploration. Pet. Geol. Exp. 2016, 38, 231–239. [Google Scholar]
- Yao, C.; Chen, H.; Onishi, T.; Datta-Gupta, A.; Mawalkar, S.; Mishra, S.; Pasumarti, A. Robust CO2 Plume Imaging Using Joint Tomographic Inversion of Distributed Pressure and Temperature Measurements. In Proceedings of the SPE Annual Technical Conference and Exhibition, Dubai, United Arab Emirates, 21–23 September 2021. [Google Scholar]
- Zhang, X.; Yang, S.; Zhang, Z. Optimization of injection-production parameters for CO2 /N2 composite gas huff and puff in fault-block reservoirs considering starting pressure gradient. Sci. Technol. Eng. 2021, 21, 14127–14132. [Google Scholar]
- Xu, G.; Zhou, X.; Shang, D.; Zhang, G. Determination method of pressure behind blanking plug considering starting pressure gradient and its field application. Pet. Geol. Oilfield Dev. Daqing 2022, 41, 80–85. [Google Scholar]
- Jia, R.; Shi, X.; Yu, W.; Yu, J. Simulated experimental research on starting pressure gradient of flow permeability reservoir in Nanpu Sag. Mud Logging Eng. 2021, 32, 119–123. [Google Scholar]
- Ren, J.; Lu, B.; Ren, S. Improved pressure depletion method measures the porosity and permeability of shale. Pet. Reserv. Eval. Dev. 2020, 10, 49–55. [Google Scholar]
- Zhao, Z. Contact angle and its application in surface chemistry research. Chem. Res. Appl. 2000, 4, 370–374. [Google Scholar]
- Liang, C.; Xiao, L.; Zhou, C.; Guo, L.; Hu, F.; Liao, G.; Song, X.; Ge, G. Nuclear magnetic resonance characterizes rock wettability: Preliminary experimental results. Chin. J. Geophys. 2019, 62, 4472–4481. [Google Scholar]
- SY/T 5153-2017; Test Method of Reservoir Rock Wettability. National Energy Administration: Beijing, China, 2017.
- He, W.; Cui, B.; Wang, F.; Wang, Y.; Zhang, J.; Zhao, H.; Wang, R.; Bai, Y.; Lin, X.; Zhao, Y.; et al. Study on reservoir spaces and oil states of the Cretaceous Qingshankou Formation in Gulong Sag, Songliao Basin. Geol. Rev. 2022, 68, 693–741. [Google Scholar]
- Sang, Q.; Zhang, S.; Li, Y.; Dong, M.; Bryant, S. Determination of organic and inorganic hydrocarbon saturations and effective porosities in shale using vacuum-imbibition method. Int. J. Coal Geol. 2018, 200, 123–134. [Google Scholar] [CrossRef]
- Tian, W.; Wu, K.; Gao, Y.; Chen, Z.; Gao, Y.; Li, J. A Critical Review of Enhanced Oil Recovery by Imbibition: Theory and Practice. Energy Fuels 2021, 35, 5643–5670. [Google Scholar] [CrossRef]
Figure 1.
Fitting diagram of shale NMR and mercury intrusion.

Figure 2.
Schematic diagrams of the three imbibition methods. (a) Spontaneous imbibition. (b) Overpressure imbibition. (c) Underpressure imbibition.
Figure 2.
Schematic diagrams of the three imbibition methods. (a) Spontaneous imbibition. (b) Overpressure imbibition. (c) Underpressure imbibition.
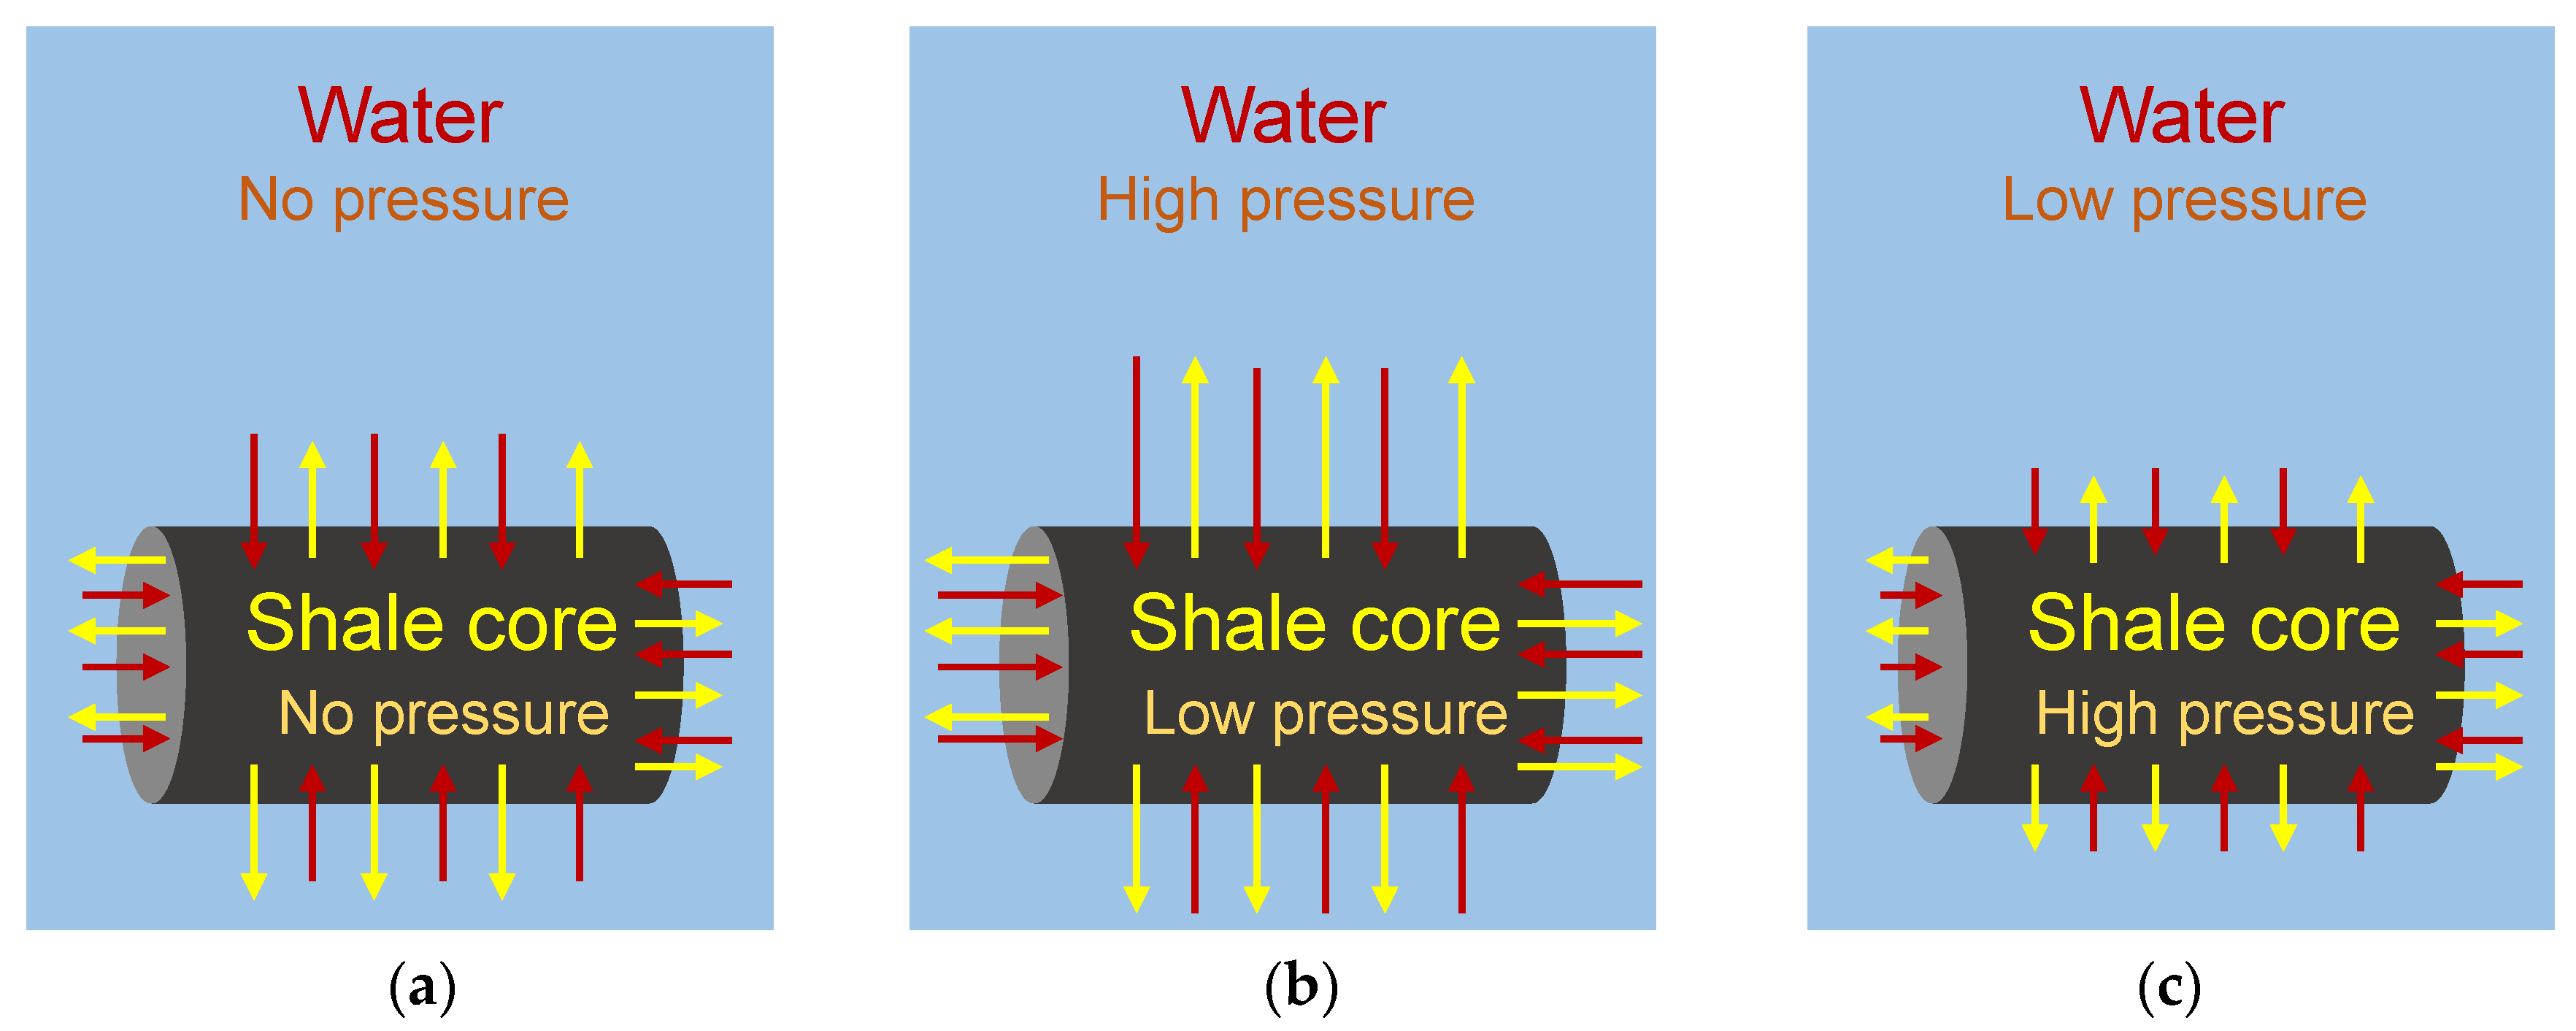
Figure 3.
T2 relaxation time measured using NMR under different centrifugal forces.
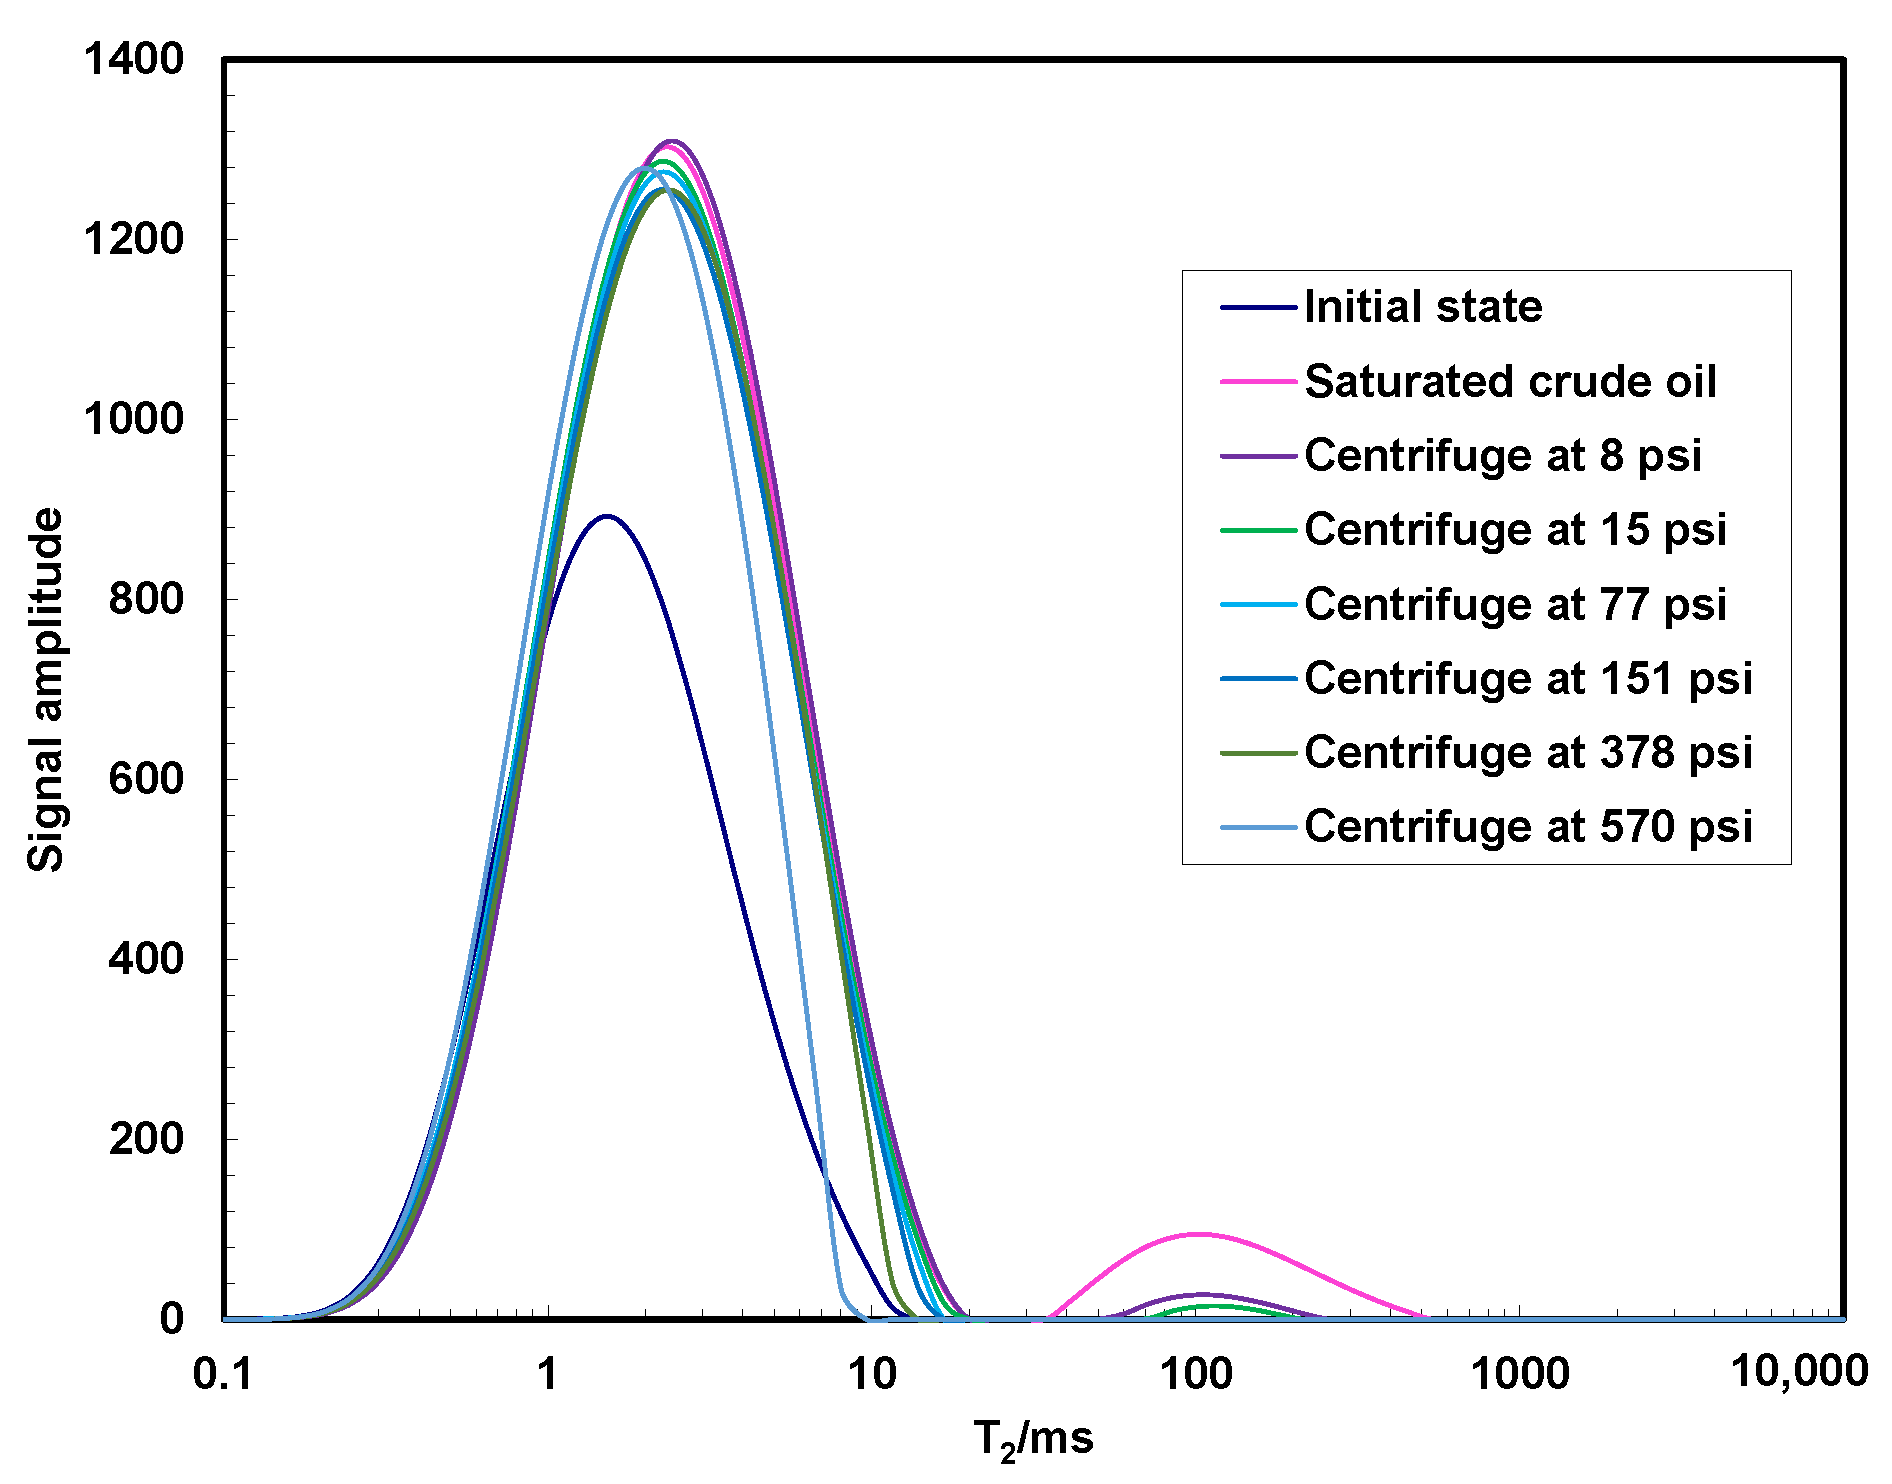
Figure 4.
Fluid movability and threshold pressure gradient of shale core.

Figure 5.
Shale water/oil self-imbibition characteristics. (a) Shale core self-imbibition of water. (b) Shale core self-imbibition of oil.
Figure 5.
Shale water/oil self-imbibition characteristics. (a) Shale core self-imbibition of water. (b) Shale core self-imbibition of oil.

Figure 6.
Shale core water/oil self-imbibition characteristics.

Figure 7.
The distribution characteristics of fluid before and after imbibition and the recovery degree of different pores. (a) Shale core spontaneous imbibition. (b) Development of different pores.
Figure 7.
The distribution characteristics of fluid before and after imbibition and the recovery degree of different pores. (a) Shale core spontaneous imbibition. (b) Development of different pores.
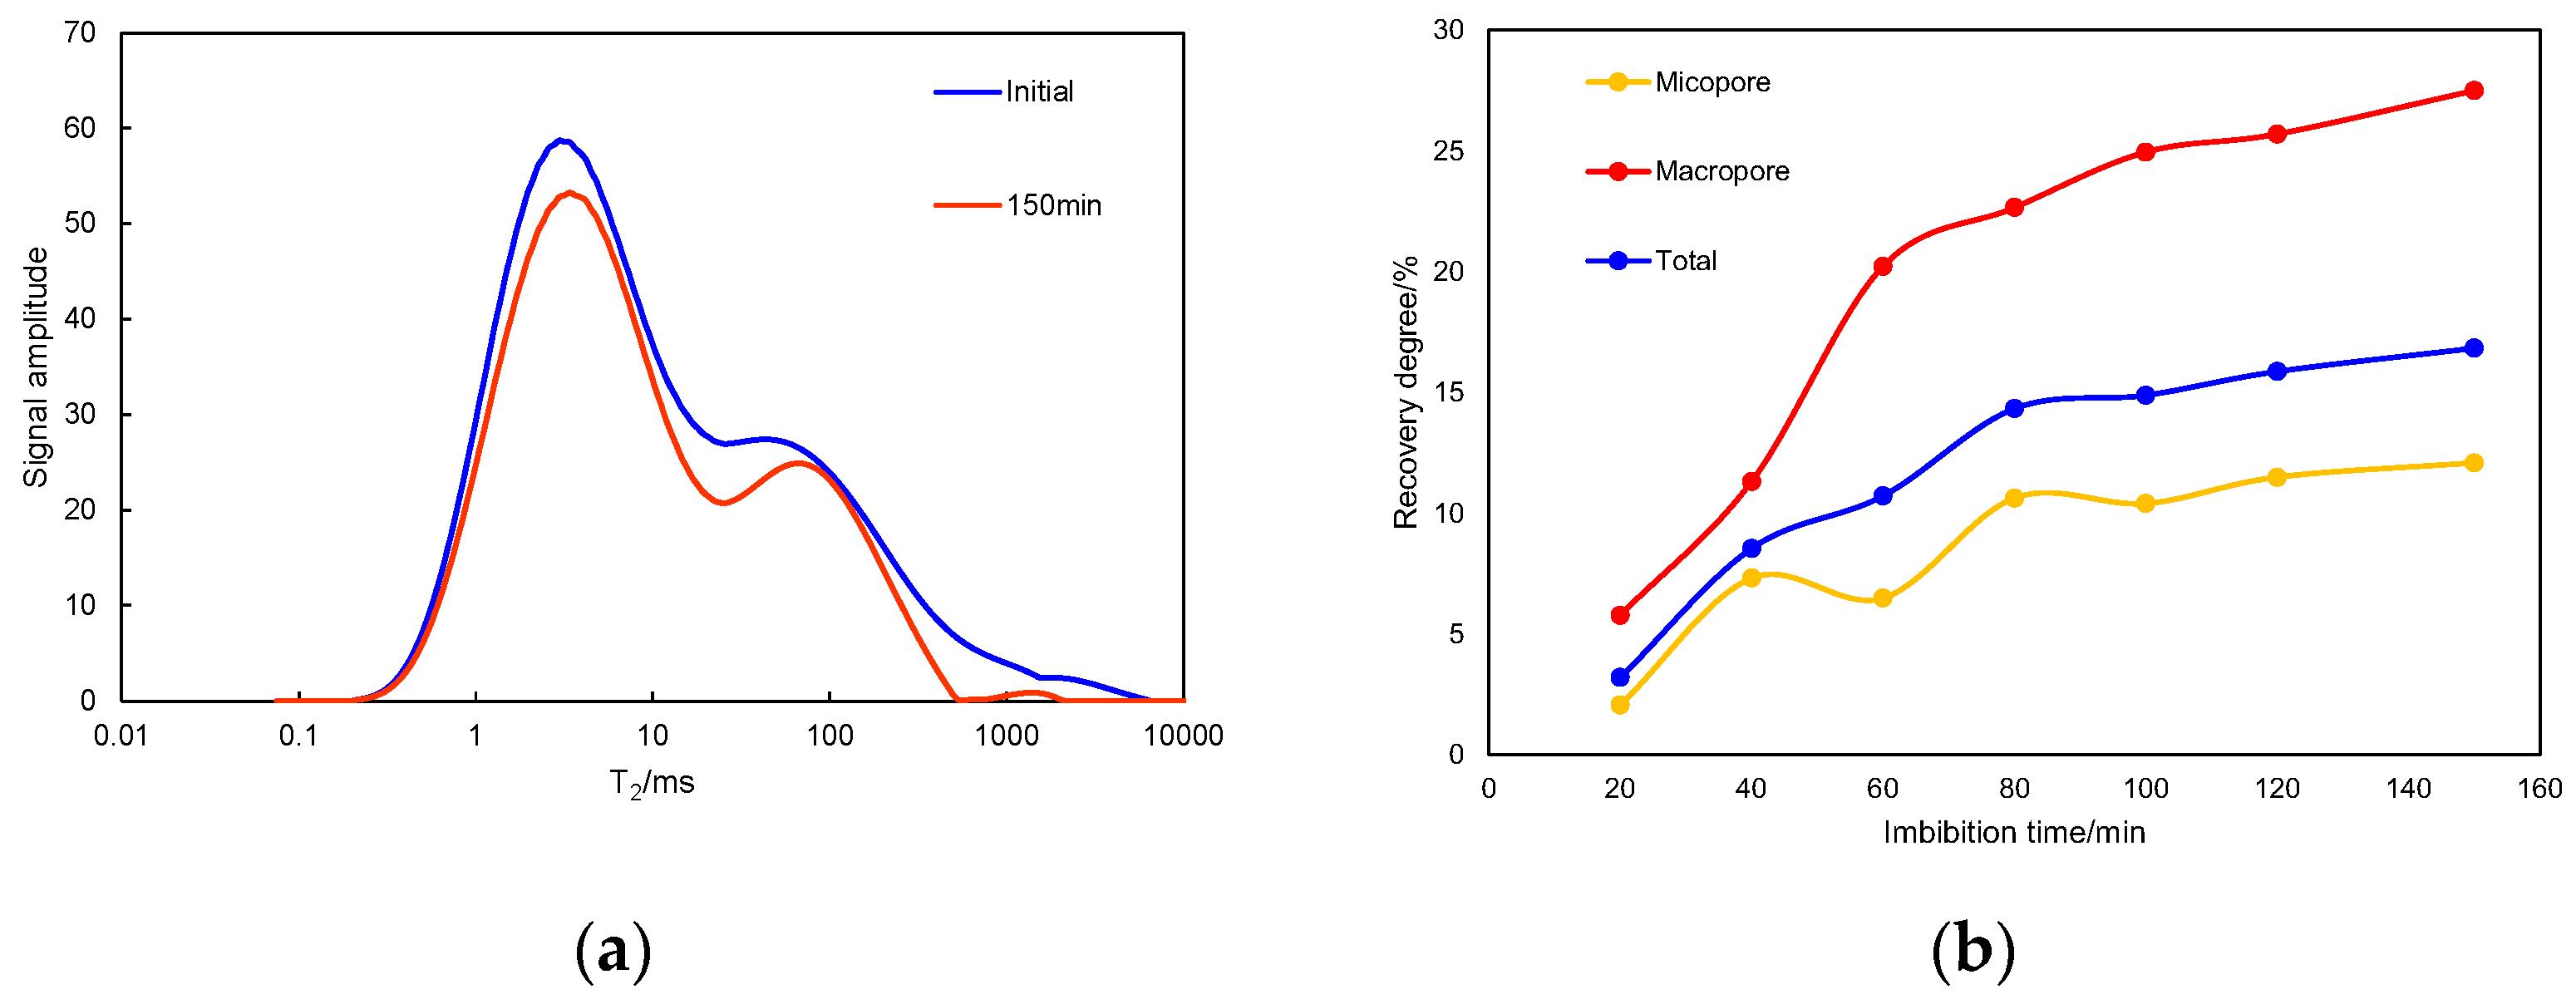
Figure 8.
Fluid movability and recovery degree with overpressure imbibition. (a) Shale core overpressure imbibition. (b) Recovery degree.
Figure 8.
Fluid movability and recovery degree with overpressure imbibition. (a) Shale core overpressure imbibition. (b) Recovery degree.
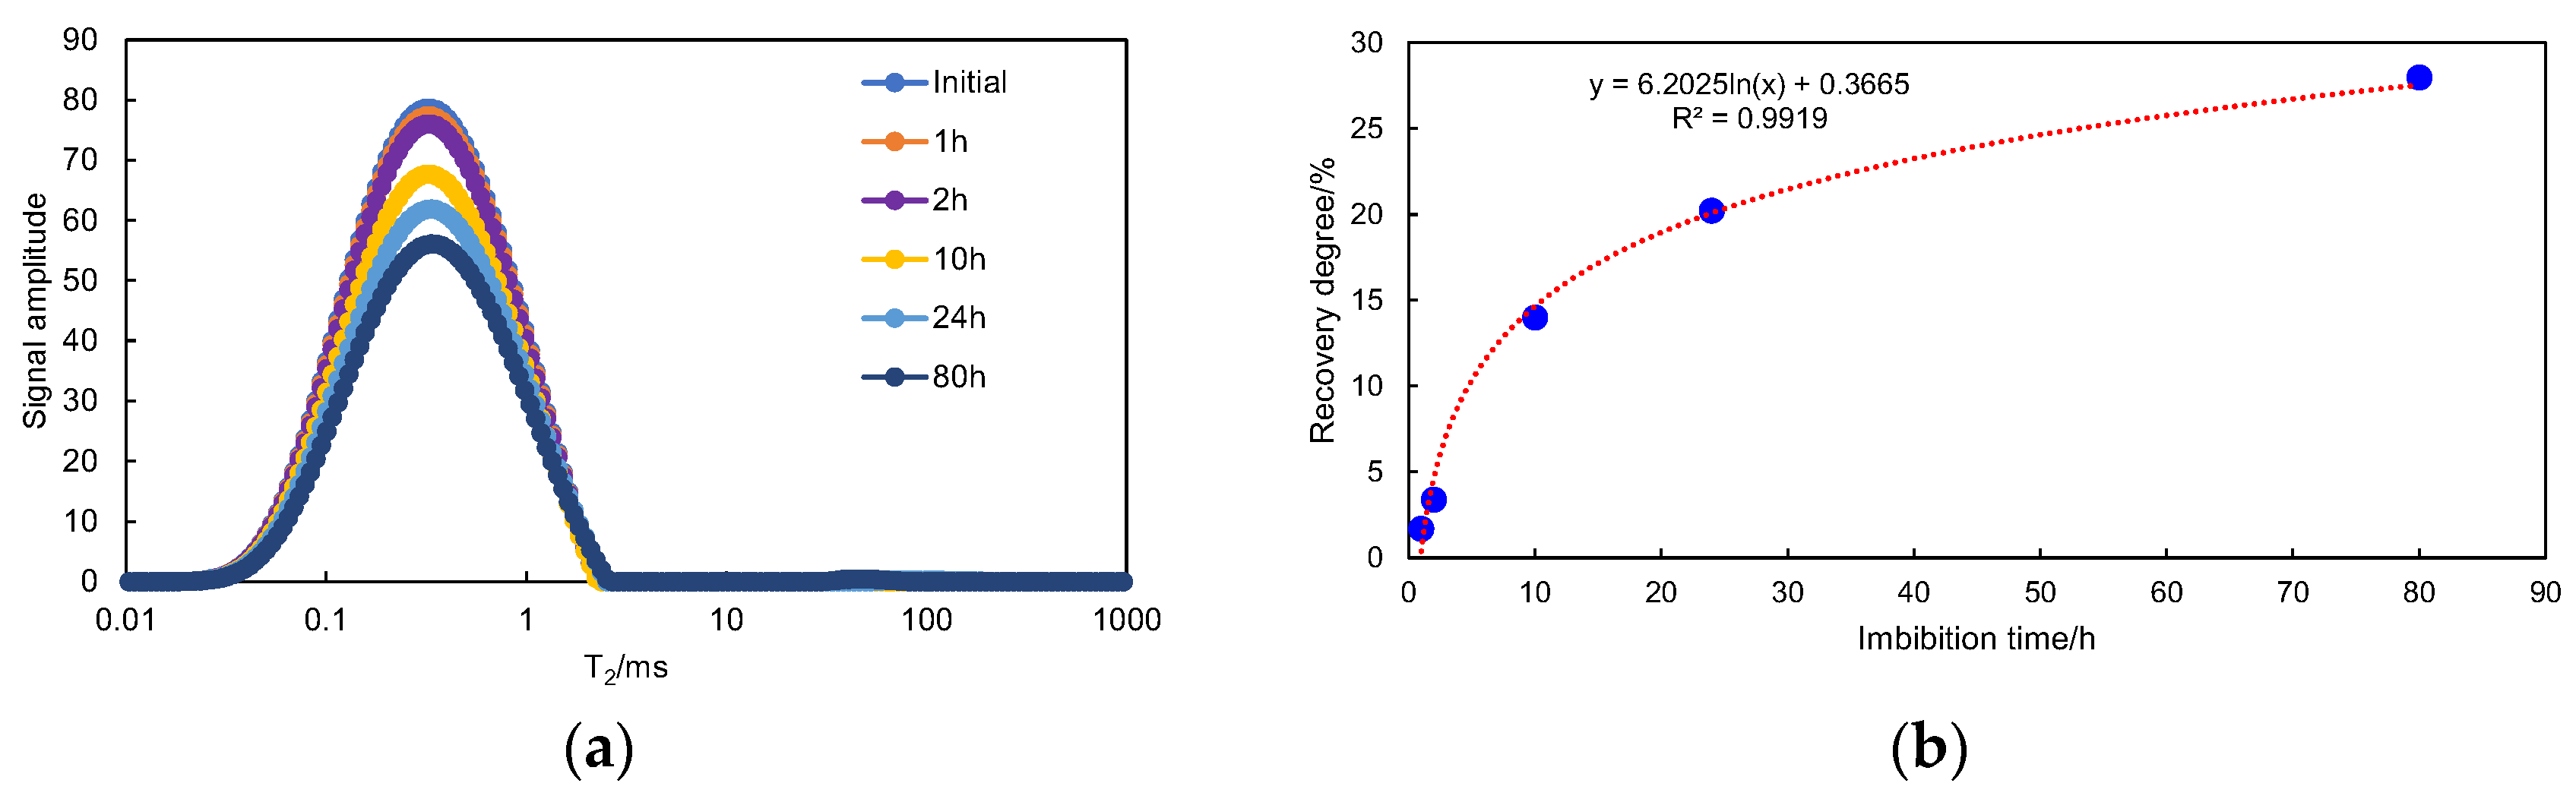
Figure 9.
Underpressure imbibition fluid movability and recovery degree.

Table 1.
Self-imbibition method of wettability discrimination standard.
| Relative Wettability Index I | −1.0 ≤ I < −0.7 | −0.7 ≤ I < −0.3 | −0.3 ≤ I< −0.1 | −0.1 ≤ I ≤ 0.1 | 0.1 < I ≤ 0.3 | 0.3 < I ≤ 0.7 | 0.7 < I ≤ 1.0 |
|---|---|---|---|---|---|---|---|
| Wettability | Strong oil wetting | Oil wetting | Weak oil wetting | Intermediate wetting | Weak water wetting | Water wetting | Strong water wetting |
Table 2.
Experimental core sample parameters.
| Experimental Samples | Diameter (mm) | Length (mm) | Volume (cm3) | Porosity (%) | Permeability (mD) | Photos of Shale Cores |
|---|---|---|---|---|---|---|
| High speed centrifugation + NMR | 25.12 | 49.44 | 24.50 | 7.93 | 3.66 × 10⁻³ |  |
| Spontaneous imbibition + NMR | 25.09 | 54.87 | 27.11 | 6.94 | 3.16 × 10⁻³ |  |
| Overpressure imbibition + NMR | 25.05 | 50.33 | 24.80 | 8.23 | 4.05 × 10⁻³ |  |
| Underpressure imbibition + NMR | 25.28 | 64.83 | 32.54 | 7.20 | 5.82 × 10⁻³ |  |
Disclaimer/Publisher’s Note: The statements, opinions and data contained in all publications are solely those of the individual author(s) and contributor(s) and not of MDPI and/or the editor(s). MDPI and/or the editor(s) disclaim responsibility for any injury to people or property resulting from any ideas, methods, instructions or products referred to in the content. |
© 2023 by the authors. Licensee MDPI, Basel, Switzerland. This article is an open access article distributed under the terms and conditions of the Creative Commons Attribution (CC BY) license (https://creativecommons.org/licenses/by/4.0/).
Share and Cite
MDPI and ACS Style
Liu, Y.; Chen, Z.; Ji, D.; Peng, Y.; Hou, Y.; Lei, Z. Pore Fluid Movability in Fractured Shale Oil Reservoir Based on Nuclear Magnetic Resonance. Processes 2023, 11, 3365. https://doi.org/10.3390/pr11123365
AMA Style
Liu Y, Chen Z, Ji D, Peng Y, Hou Y, Lei Z. Pore Fluid Movability in Fractured Shale Oil Reservoir Based on Nuclear Magnetic Resonance. Processes. 2023; 11(12):3365. https://doi.org/10.3390/pr11123365
Chicago/Turabian StyleLiu, Yishan, Zhewei Chen, Dongqi Ji, Yingfeng Peng, Yanan Hou, and Zhengdong Lei. 2023. "Pore Fluid Movability in Fractured Shale Oil Reservoir Based on Nuclear Magnetic Resonance" Processes 11, no. 12: 3365. https://doi.org/10.3390/pr11123365
Note that from the first issue of 2016, this journal uses article numbers instead of page numbers. See further details here.