Article

Decision Making in a Closed-Loop Supply Chain with a Waste Management Program: Manufacturers’ Take-Back Activity and Governmental Subsidies for Remanufacturing

Department of Artificial Intelligence and Software, Kangwon National University, 346 Joongang-ro, Samcheok-si 29513, Republic of Korea
*
Author to whom correspondence should be addressed.
Processes 2023, 11(11), 3132; https://doi.org/10.3390/pr11113132
Submission received: 26 July 2023 / Revised: 20 October 2023 / Accepted: 30 October 2023 / Published: 1 November 2023
(This article belongs to the Special Issue Low-Carbon Design and Manufacturing Processes)

Abstract

:
As awareness of climate change increases, diverse initiatives such as subsidies for remanufactured products and take-back programs for end-of-life products have been taken to conserve energies and materials. This paper explores how the subsidy program affects manufacturer’s take-back activity in a closed-loop supply chain and also analyzes how a coalition between a retailer and a remanufacturer affects the equilibrium decisions. Major findings of this paper reveal that (i) when a take-back program is implemented, the government imposes a high penalty on products that are not collected, thereby encouraging manufacturers to collect more used products, (ii) implementing a take-back program in conjunction with a subsidy program results in a greater reduction in environmentally negative impacts and an enhanced social welfare compared to implementing them separately, and (iii) a coalition between a retailer and a remanufacturer results in lowering the penalty imposed to a manufacturer, which leads to lowering the quantity of the collected and remanufactured products.

1. Introduction

The history of industrialization, which started from developed countries in Europe and spread to North America, South America, and Asia, shows that industries, especially manufacturing, play an important role as a growth engine in economic development. Even after the 1970s, when deindustrialization became common as the employment rate in the manufacturing industry fell in developed countries, economic development in developing countries still largely depended on industrialization. Economic growth following rapid industrialization has greatly improved quality of life but has also caused many socio-economic problems such as climate change, environmental destruction, and widening the gap between the rich and the poor. Climate change is particularly recognized as a major concern that threatens the life of mankind in the future. Climate change can act as a direct factor in the decline of productivity in a supply chain, such as a decrease in output and a decrease in the quality of labor and capital resulting from various natural disasters. In addition, if an abnormal climate affects the health of workers or the work environment, it can act as a factor which reduces labor productivity. If climate change limits the movement of human capital along the supply chain, it will damage a firm’s supply chain. The risk of asset damage or vulnerability to extreme weather raises the risk premium related to climate change, which may act as a factor in lowering capital productivity by boosting capital-raising costs. Changes in the behavior of firms along the supply chain to adapt to climate change and transition risk in the process of improving policies to mitigate climate change can also affect a firms’ productivity. In the process of reorganizing the supply chain to adapt to climate change, its efficiency can decrease due to a mismatch between capital and labor, which negatively affects the profitability of the supply chain. Moreover, if investment for innovation or efficiency improvement decreases due to high regulatory costs or if the productivity gap between firms widens due to the difference in their ability to respond to climate change, there is a possibility that it will act as downward pressure on productivity. As such, climate change caused by industrialization and economic growth has large negative effects on the productivity, profitability, and sustainability of a supply chain.
Greenhouse gas (GHG), including carbon dioxide, nitrogen dioxide, and methane, is regarded as a major cause of climate change. The electronics industry has a growing impact on GHG emissions [1]. Global GHG emissions from the electronics sector have increased by 1.4% globally and are projected to increase during the pandemic as the demand for personal digital devices such as desktops/laptops, smartphones, displays, and tablets rises. The global supply chain of the electronics industry is one of the top eight sectors, accounting for more than 50% of its global carbon footprint [2]. Taking this into account, the current production of all electronics generates nearly as much carbon emissions as all the airplanes in the world combined. However, at its core, there is a much bigger problem relating to how we produce all this “stuff”. Electronic products that use a lot of raw materials dramatically increase GHG emissions. Mining itself is energy intensive. About 10% of global energy consumption comes from mineral extraction. Processing raw materials and turning them into products is associated with higher emissions. 70% of global emissions are related to the use and handling of raw materials. The growing demand for digital devices and their faster product lifecycles are increasingly contributing to the demand for raw material extraction and boosting GHG emissions. Mining causes other types of environmental destruction, which consequently releases more GHG emissions. At present, illegal gold mining and deforestation in the Amazon is a typical example. The process of mining and smelting important minerals used in electronic products releases a variety of toxic substances (such as arsenic and fluorine) that can destroy the ecosystem. In short, to cut GHG emissions, we must use less raw materials, which means that we must use products as long as possible and reuse/recycle the materials we already have.
To mitigate the seriousness of climate change, the circular economy has attracted attention in many countries over the past few decades. Compared to the “take-make-consume-dispose” policy of the conventional economic model, the “made-to-be-made-again” policy of the circular economy model dramatically reduces the demand for materials [3]. The circular economy model rethinks the entire process of managing both resources and waste, redesigns products to be sustainable, drives innovative technologies, and ultimately leads to environmentally friendly practices. In other words, its approach focuses on the sustainable management of resources in which some parts of a product are reused, recovered, repaired, remanufactured, and recycled to create a closed-loop supply chain (CLSC) and to minimize the negative impact on the environment. While various programs are being devised to realize the circular economy, “take-back programs” are an initiative organized by supply chain participants to collect used products (or end-of-life products) from the market and reintroduce them to the original manufacturing cycle. A take-back program is an initiative undertaken by companies to retrieve products from consumers once they become old or non-functional. This effort aims to reduce the demand for new materials and prevent old products from ending up in landfills. There are several advantages to implementing a take-back program: (i) reduced production costs as materials are recycled instead of purchased anew, (ii) enhanced customer relationships, (iii) streamlined reverse logistics, and (iv) a positive environmental contribution. Patagonia’s take-back program recycles old cotton, hemp, or linen t-shirts, while supporting recycling chains for apparel waste [4]. Through collaboration with customers, the Xerox Green World Alliance initiative facilitates the collection, reuse, and recycling of millions of cartridges and toner containers each year [5]. For several years, Apple has taken responsibility for the short lifecycle of their consumer electronics via a comprehensive trade-in and recycling program. For any used products, Apple undertakes the recycling process for free and some models are remanufactured and sold again, thus reducing new purchases and offering affordable alternatives to new buyers. As a result, Apple’s older products will have their precious materials extracted and reused, reducing the need for more virgin raw materials to be extracted from the earth [6]. In the electronics sector, more and more giant manufacturers, such as Epson, Sony, Dell, HP, Lenovo, and Toshiba, are developing and operating their own take-back programs [7].
With waste management and recycling becoming a worldwide concern, governments in most countries have introduced a variety of subsidy policies and financial incentives to encourage waste take-back activities [8,9,10]. The California government subsidized recyclers while taxing manufacturers that release GHG [11]. The Liuyang government, Hunan Province, China, has provided a one-time subsidy to support 20% of the total investment in remanufacturing construction [9]. The Japanese government has enacted a national subsidy law that encourages enterprises in Japan to build a system for recycling batteries [12]. It is well known that subsidies, a form of financial incentive, have impacts both on various decisions in the CLSC of waste electrical and electronic equipment (WEEE) and on the socio-economic benefits of our society [13]. The amount collected from the waste stream of used products is affected by the collector’s efficiency in obtaining WEEE and their willingness to take-back, and this may determine the CLSC’s sustainability. In addition, consumers’ willingness to purchase remanufactured products affects the production plan of a third-party remanufacturer, which may affect subsidies for the remanufactured products. Hence, a government must understand how governmental subsidies affect the equilibrium decisions of the stakeholders in the CLSC and use an effective allocation strategy of governmental subsidies to promote the development of the industry. In this regard, the following research questions can be considered:
  • In a CLSC, when a government asks a manufacturer to implement a take-back program, what are the equilibrium behaviors and profits of supply chain participants, and how does the landfill of uncollected products affect the supply chain performance?
  • In a CLSC, when the government mandates a manufacturer to implement a take-back program and at the same time provides a subsidy program to a third-party remanufacturer, what are the equilibrium behaviors and profits of supply chain participants, and how does the landfill of uncollected products affect the supply chain performance?
  • Is it more beneficial to a CLSC if the government implements only a take-back program or a take-back program and a subsidy program simultaneously?
  • Multiple survey papers contribute to presenting the benefits of the coalition formation for horizontal supply chain collaboration [14,15,16,17,18,19,20]. How does the coalition of supply chain participants affect a governmental take-back program and subsidy program? Is coalition always better?
The objective of this study is to address the research questions using Stackelberg game theory. The subsequent sections of this paper are structured as follows: Section 2 offers a literature review, Section 3 elucidates the notations and assumptions, Section 4 and Section 5 present the primary findings and numerical experiments, and Section 6 concludes with a summary and potential avenues for future research.

2. Literature Review

This section discusses pertinent literature across three distinct research areas: CLSCs with a take-back activity, governmental subsidy programs, and coalition strategies for horizontal collaboration in supply chains.

2.1. CLSCs with a Take-Back Activity

A closed-loop supply chain (CLSC) consists of both a forward and a reverse supply chain. The forward supply chain manages the flow of products from suppliers to downstream consumers, whereas the reverse supply chain facilitates the movement of used (end-of-life) products from consumers back to upstream suppliers [21]. Take-back is one of the most important topics in the CLSC context; therefore, in recent years, numerous researchers have extensively investigated various take-back modes within the realm of reverse logistics. Savaskan et al. [22] considered a CLSC capable of collecting and recycling used products from consumers and found that retailer collection is the most efficient means of product take-back activity. Later, Savaskan and Van Wassenhove [23] extended the former model by considering two competing recyclers taking back used products. Atasu et al. [24] examined how collection cost structures influence optimal decisions regarding the reverse channel, building upon the research by Savaskan et al. [22]. Chen and Sheu [25] developed a differential game model, considering sales competition, recycling dynamics, and a regulatory-related profit function. Toyasaki et al. [26] studied two types of take-back schemes for WEEE recycling: monopolistic and competitive. They found that competitive take-back activities often achieve win-win situations: lower product prices, and higher recycler and manufacturer profits. Huang et al. [27] explored the impacts of recycling competition within the reverse channel of a proposed CLSC and demonstrated that dual-channel recycling yields superior results compared to single-channel recycling, benefiting both manufacturers and consumers. Pangburn and Stavrulaki [28] considered the effects of take-back costs on a manufacturer’s product durability and pricing decisions under both selling and leasing scenarios. They argued that take-back activities can lessen the durability gap that exists between selling and leasing by raising the seller’s durability choice. Hong et al. [29] explored Stackelberg game models to discuss the optimal decisions on advertising, take-back of used products, and pricing in both centralized and decentralized CLSCs. They showed that, among the proposed take-back schemes, it is best for the manufacturer to provide appropriate incentives to induce the retailer to engage in collecting. In the work of Dutta et al. [30], a recovery framework was proposed to acquire used products from consumers by employing buy-back offers at the retailer level. Dutta et al. [30] proved that their recovery framework considering the buy-back offer enhances the take-back and recovery process. Huang and Wang [31] explored three types of take-back models in a hybrid remanufacturing system, manufacturer’s take-back, distributor’s take-back, and third-party’s take-back, and showed that all the received profits of supply chain members from the take-back activities are even larger than those from non-take-back activities. Feng et al. [32] considered the cross-competitive take-back mode in a CLSC consisting of two manufacturers and found that cross-competitive take-back is even more beneficial to all supply chain members than monopolistic take-back. Pazoki and Samarghandi [33] and Chang et al. [34] investigated how take-back regulations imposed by the government encourage remanufacturing or eco-design. In both of these studies, the authors concluded that the manufacturer adopts eco-design for a low eco-design coefficient and practices remanufacturing for a high eco-design coefficient. Xu et al. [35] also dealt with the issue of product eco-design under take-back regulations. They found that the government should impose take-back regulations for manufacturers that do not perform eco-design and a combination of regulations including a take-back penalty and take-back subsidy for manufacturers that do perform eco-design.

2.2. Governmental Subsidy Programs in Supply Chains

A government subsidy is a type of financial assistance generally offered to promote designated economic and social policies [36]. Government subsidies can take the form of cash payments or the provision of intermediate goods and services at no cost or at nominal prices from governments to suppliers [37]. One primary impact of a subsidy is the raising of both demand and supply by the subsidy amount, consequently stimulating the activities of the economic agents in supply chains. Mitra and Webster [38] investigated the competition between a manufacturer and a remanufacturer with the effects of government subsidies and found that the introduction of production subsidies is beneficial to the remanufacturer, while a subsidy provided only to the remanufacturer creates a very unfavorable situation for manufacturers. Sheu [39] suggested the negotiation framework between producers and reverse-logistics suppliers under the government financial aid. They showed that financial intervention by the government is not always beneficial for the profits of supply chain members as well as overall social welfare. Xiong et al. [40] modeled a decentralized CLSC consisting of a component supplier and a product manufacturer and analyzed the interaction between these players and its impact on remanufacturing activities. They also showed that the government-subsidized remanufacturing in the integrated manufacturer is environmentally beneficial. Wang et al. [41] conducted a simulation analysis to examine the influence of subsidy policies on the growth of China’s recycling and remanufacturing industry. Under their simulation setting, they asserted that a combination of several subsidy policies can control the remanufacturing market and maintain its scale and stability. Liu et al. [13] developed a quality-based price competition model between formal reverse channels consisting of authorized recyclers and informal reverse channels consisting of unregulated recyclers in electronics supply chains. They revealed that the informal recycler consistently has a better acquisition price to capture a larger market share of WEEE than the formal recycler at the quality level of remanufacturing. He et al. [42] proposed five typical contracts to coordinate decentralized reverse channels with strategic recycling behavior of consumers. Through a comparative analysis, they found that a subsidy contract is more beneficial to the manufacturer, while a cost-pooling contract is better for the collector; however, both lead to lower transfer prices than the wholesale price contract for reverse channels. Han et al. [43] dealt with the conditions of how and when a firm should offer trade-old-for-remanufactured (TOR) programs and confirmed that high product remanufacturability and government subsidies strongly motivate firms to deliver timely TOR programs. Jena et al. [44] developed four CLSC models with different scenarios considering government subsidies and proposed that the government provide incentives to manufacturers to engage in remanufacturing activities through subsidies. He et al. [45] investigated a dual-channel CLSC in which a subsidy program is provided to consumers purchasing remanufactured products. Their paper revealed that manufacturers will sell new products or remanufactured products directly depending on the government subsidy level. According to the findings of Wang et al. [46], the government’s strategy of allocating subsidies should be based on the remanufacturing utilization rate. They addressed how the subsidy should be provided to recyclers and retailers (remanufacturer) if the remanufacturing utilization rate is low (high). Qiao and Su [8] assumed that the original equipment manufacturer (OEM) and an independent remanufacturer have different collection channels, and they compete with each other in the remanufacturing market. They pointed out that relying solely on increasing government subsidies is not necessarily an effective strategy for policymakers to mitigate environmental degradation and improve social surplus. Prior to shaping a government subsidy policy, understanding competitive markets and the environmental impacts of products is crucial. Zhang and Zhang [47] discussed the decisions of authorized remanufacturing supply chains affected by government subsidies under a cap-and-trade mechanism and proved that government subsidies have a positive effect by increasing the stability of the price adjustment speed of remanufactured and new products. Liu et al. [48] explored the impact of a manufacturer’s and retailer’s remanufacturing process of innovation on the CLSC from the perspective of government subsidies. One of their findings stated that government subsidies for the remanufacturing process of innovation do not necessarily heighten the profits of the manufacturer, the retailer, and the whole supply chain.

2.3. Coalition Strategies in Supply Chains

As coalition formation is a pragmatic strategy in many industries, many researchers on supply chain management have considered coalition formation as an efficient cooperation strategy. Ke et al. [49] studied whether supply chain coordination of the quantity and transportation discounts offered by the supplier and carrier can be beneficial. In this study, the authors claimed that cooperation could generate an allocable surplus that would incentivize all parties and all coalitions of parties to continue to cooperate. Mohebbi and Li [50] analyzed the problem of fair distribution of profits obtained through cooperation and the coalition formation to share suppliers’ capacities. Their simulation result showed that long-term cooperation within a suppliers’ network can increase the average individual profit of network members. Ma et al. [51] investigated the interactions between different parties in a CLSC and found that coalition strategies can lead to win-win outcomes and increase the profits of members that take part in the alliance. Jouida et al. [52] dealt with a coalition formation problem for cooperative replenishment with one supplier and multiple firms and confirmed that horizontal cooperation among firms is more advantageous in terms of maximizing profits compared to stand-alone situations. Alamdar et al. [53] conducted a comparison of different non-collaborative and collaborative approaches within a CLSC involving a manufacturer, a retailer, and a collector. Their findings revealed that the coalition between a manufacturer and a retailer benefits both consumers and the entire chain. The most effective model for used product collection involves the coalition between a manufacturer and a collector. Zheng et al. [54] considered a supply chain comprising one supplier and multiple retailers under a quantity discount contract in two scenarios, independent and joint procurement, and they concluded that retailers are inclined to establish a grand coalition when total profits can be fairly distributed among them. Tian et al. [55] analyzed recycling programs involving multiple producers. They argued that the structure of a recycling network relies on producers’ desire to form a coalition which recycles used products efficiently, minimizes total recycling costs, and maximizes social welfare. Kuo et al. [56] examined various coalition structures for multi-product assembly systems with a common component. They showed that, as a way to maximize profits and reduce supply chain inefficiencies, a common component supplier may form partial or large alliances with other suppliers. Asghari et al. [57] considered a single-stage green CLSC, where a manufacturer, a retailer and a collector reform their operations, products, and services to meet their environmental obligations. They revealed that forming the grand coalition yields better results than the contracts such as cost sharing, revenue sharing, and two-part tariffs in terms of achieving environmental goals and total profits. Zhong et al. [58] studied an effective coordination mechanism to consider the fairness concerns in the retailer-led low-carbon supply chain. They found that the leading retailer needs to implement suitable measures to mitigate manufacturers’ fairness concerns, thereby ensuring enhanced profits for member firms and the overall supply chain. Madzík et al. [59] presented the excellent bibliometric literature review of supply chain research from the early eighties to the COVID-19 era. Readers are encouraged to refer to the work by Madzík et al. [59] and references therein.

2.4. Research Gaps and Contributions

As seen above, many studies have addressed topics such as take-back activities, governmental subsidies, and coalition strategies in CLSCs. However, to the best of the author’s knowledge, most of these studies have not integrated these three topics comprehensively. Refs. [28,29,31,32,33,34,35] focused on take-back activities in CLSCs but did not consider coalition strategies. With increasing concerns about the sustainable operation of supply chains, devising the optimal coalition strategies is indeed a universally significant task for supply chain members. Refs. [38,39,40,42,43,46,47] discussed various subsidy programs for remanufacturing but did not include take-back programs for used products.
Electrolux, a global appliance manufacturer, partnered with the Swedish government to implement a comprehensive sustainability program. In this program, Electrolux establishes a take-back program where customers return their old appliances, such as refrigerators and washing machines, when purchasing new ones. These returned appliances are then disassembled and evaluated for remanufacturing potential. The Swedish government provides financial incentives and subsidies to Electrolux for remanufacturing these returned appliances. These incentives help cover the costs of refurbishment, including labor and materials. By combining the take-back program with government subsidies for remanufactured products, Electrolux promotes the return and recycling of old appliances, thus reducing electronic waste, extends the lifecycle of appliances by remanufacturing them, thus saving resources and energy, creates economic incentives for customers to participate in the circular economy by returning their old appliances, and aligns with government sustainability goals and regulations while reducing the environmental impact of appliance manufacturing and disposal. The case of Electrolux demonstrates how both take-back programs and subsidies for remanufactured products can work together to create a more sustainable supply chain while benefiting consumers and the environment. The main contribution of this study is to present optimal decision making in various combinations of take-back programs, subsidy programs, and coalition strategies of supply chain members. This study also aims to compare the performance of the supply chain among those combinations, providing operational insights to supply chain members and policymakers. This study contributes to fostering synchronized economic growth and environmental protection, leading to the attainment of sustainable supply chain development.

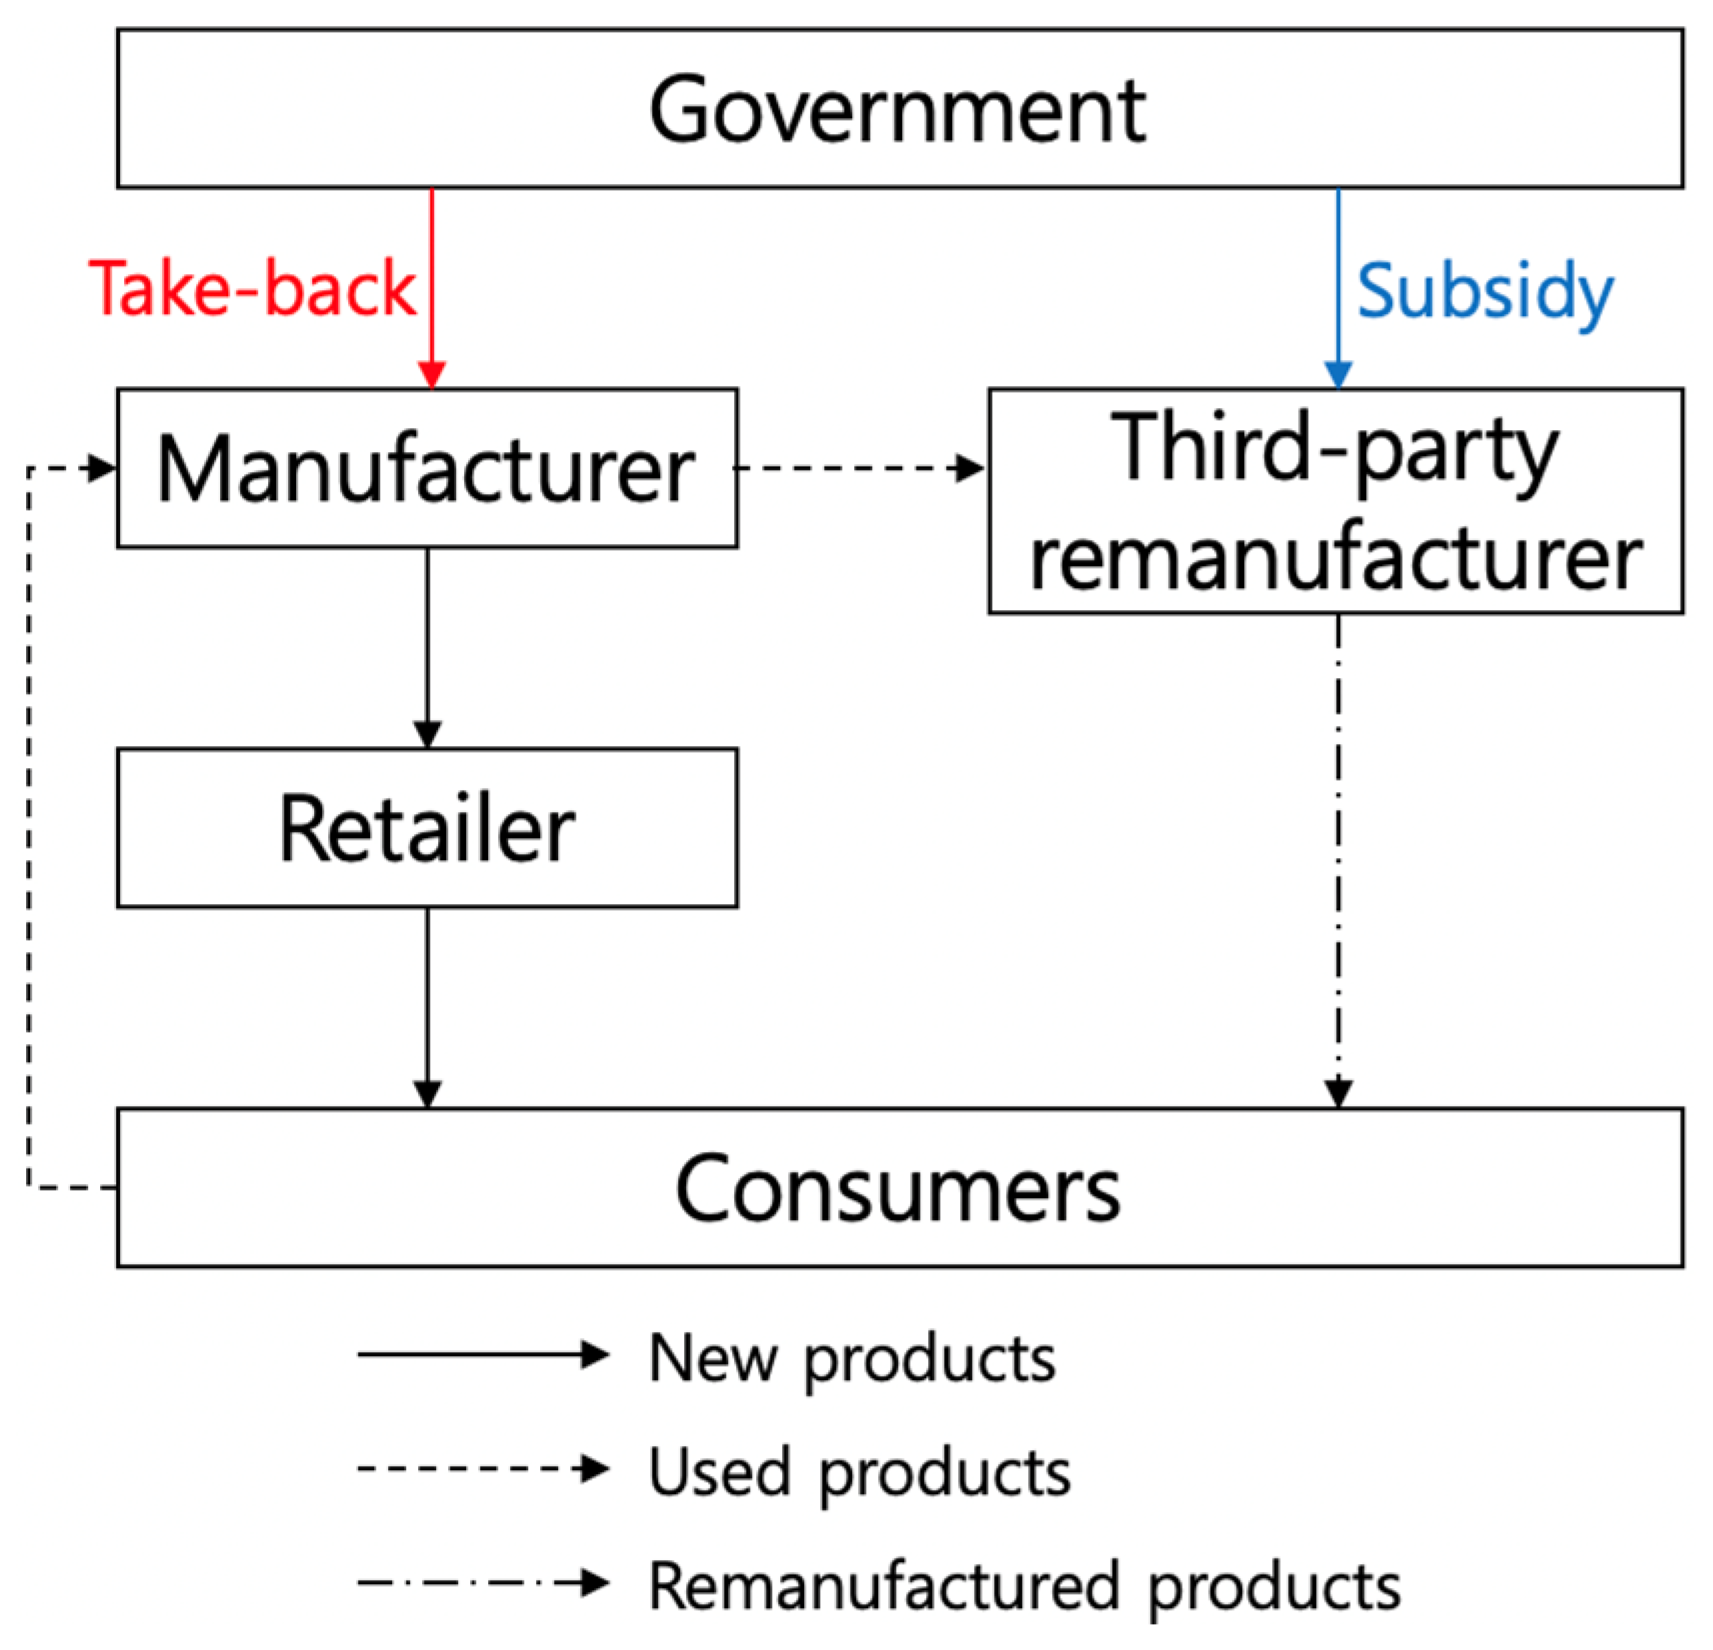
3. Problem Description

3.1. Notations

This paper uses the notations given in Table 1.

3.2. Assumptions

We consider a CLSC composed of an upstream manufacturer (denoted here as “He”), a downstream retailer (“It”), and a third-party remanufacturer (“She”). In the forward flow of this CLSC, the manufacturer produces new products and sells them to the retailer at the wholesale price of w . Consumers can purchase his (the manufacturer’s) new product at the retail price of p n only via the retailer’s sales channel. In the reverse flow of the CLSC, the manufacturer plays the role of a collector, collecting the used products that consumers have finished using and subsequently transferring them to the remanufacturer. While transferring the used products, the manufacturer charges the remanufacturer the third-party patent licensing fee f per unit of used product. After recycling/remanufacturing processes, the remanufacturer sells her product to consumers at the price of p r via the direct sales channel. To reduce the amount of waste generated in the CLSC and to encourage the manufacturer to collect more used goods, a government implements two waste management programs: (i) a take-back program for the manufacturer, and (ii) a subsidy program for the remanufacturer. Figure 1 presents the configuration of the CLSC considered in this study, in which the following assumptions are made:
Assumption 1.
Following previous studies (e.g., Debo et al. [60] and Ferguson and Toktay [61]), consumers have idiosyncratic valuations of new products with respect to their willingness-to-pay  ϕ , which follows a uniform distribution with an interval of  [ 0 ,   1 ] . This assumption is widely accepted to capture consumers’ heterogeneity. The utility for a customer to buy a new product is  u n = ϕ p n . While the remanufactured product is suitable for protecting the environment, consumers tend to recognize that the performance and quality of the remanufactured product are worse than those of the new product, which causes consumers to hesitate to purchase the remanufactured product. Therefore, it is reasonable to assume that for the remanufactured product, consumers value each unit at a discount  β  ( β  denotes the lower perceived quality of remanufactured products). For analytical simplicity, we assume that  0 < β 0.5 . The utility for a customer to buy a remanufactured product is u r = β ϕ p r . Consumers decide which product to purchase by comparing u n  and  u r , leading to the following inverse demand function of each product:
p n = 1 q n β q r   and   p r = β ( 1 q n q r ) .
For the detailed derivation of Equation (1), readers may refer to Ferguson and Toktay [61].
Assumption 2.
Under the take-back program, the manufacturer collects  q a  units of product and pays a consumer the acquisition price of p a  per unit of collected product. Following Ferguson and Toktay [61], Pazoki and Zaccour [62], and Pazoki and Samarghandi [33], we assume that the collected quantity is a linear function of the acquisition price: q a = α p a , or equivalently, p a = q a / α , where α 1  represents the acquisition efficiency (the higher the acquisition efficiency, the more products are collected). Accordingly, the total acquisition cost incurred by the manufacturer is expressed as q a 2 / α . The take-back program penalizes the manufacturer for each unit of uncollected product. The total penalty imposed by the government for uncollected products is assumed to be equal to k ( q n q a ) , where k  represents the take-back penalty per unit of uncollected product. Given that it is impossible for the manufacturer to collect all used products from consumers, the following is assumed: q n > q a . Under the subsidy program, the remanufacturer receives the subsidy s  from the government for each unit of remanufactured product sold to consumers.
Assumption 3.
We consider two possible models of government regulations: Models TO and TS. In Model TO, the government only implements the take-back program, while in Model TS, the government enforces the take-back and subsidy programs at the same time. In each model, we develop a Stackelberg game in which the government is the overall leader, the manufacturer is the first follower, and both the remanufacturer and retailer are second followers.
Assumption 4.
The CLSC considered here is based on a make-to-order system that produces new and remanufactured products according to consumer orders. Thus, we neglect any inventory and salvage costs. To focus on the effects of the government’s waste management programs, both the manufacturer’s and remanufacturer’s production costs are assumed to be constant and normalized to zero. Allowing non-zero production costs will not qualitatively change our results.
Under Assumptions 1–4, we develop the game theoretical models to determine the equilibrium behavior of each participant in the CLSC.

4. Equilibrium Analyses of Stackelberg Games

In this section, we present the equilibrium decisions of the players in each of the three Stackelberg games. All proofs in Section 4 are given Appendix A.

4.1. Model TO: Take-Back Program Only

In Model TO, the government only implements the take-back program, where they impose a monetary penalty for uncollected products on the manufacturer. The sequence of the three-stage Stackelberg game in Model TO is as follows. In the first stage of the game, the government declares the penalty k for each unit of uncollected product. In the second stage, the manufacturer decides on the wholesale price w , licensing fee f , and quantity of collected products q a . In the final stage of the game, the retailer determines the quantity of new product sales q n , while the remanufacturer simultaneously decides the quantity of remanufactured product sales q r . Let π m , π r , and π 3 denote the profit functions of the manufacturer, retailer, and remanufacturer, respectively. In addition, let S W be the social welfare that the government wants to maximize. Then, the profit and social welfare functions are expressed as follows:
π m = w q n + f q r q a 2 α k ( q n q a ) ,   π r = ( p n w ) q n ,   π 3 = ( p r f ) q r ,   and S W = π s c + C S + k ( q n q a ) E I .
In Equation (2), π s c is the overall supply chain profit, defined as π s c = π m + π r + π 3 . The second term C S represents consumer surplus (or economic surplus). C S is then expressed as C S = 1 q n 1 u n d ϕ + 1 q n q r 1 q n u r d ϕ = q n 2 + 2 β q n q r + β q n 2 / 2 . The term k ( q n q a ) represents the total penalty that the manufacturer should pay to the government. Let parameter λ be the cost coefficient of landfill-related environmental damage. Thus, the term E I refers to the total cost of the environmental impact (damage) from landfilling uncollected products; therefore, E I = λ ( q n q a ) . By applying backward induction to Equation (2), we can obtain the equilibrium decisions of the players in Model TO, as presented in Proposition 1.
Proposition 1.
The equilibrium decisions, profits, and social welfare in Model TO are determined as follows:
k T O = 2 λ ( 4     β ) 2   +   α ( 4     β )     12   +   9 β     β 2 4     3 β   +   2 α ( 4     β ) 2 ,   w T O = ( 4     β ) 2 α ( 4     β ) ( 1   +   λ )     2   +   β   +   4 λ 8     6 β   +   4 α ( 4     β ) 2 ,   f T O = β 2 ,   q n T O = 8     5 β     8 λ   +   2 α ( 4     β ) ( 2     β     2 λ ) 8     6 β   +   4 α ( 4     β ) 2 ,   q r T O = 2 α ( 4     β ) ( 1   +   λ )     2   +   β   +   4 λ 8     6 β   +   4 α ( 4     β ) 2 ,   q a T O = α 2 λ ( 4     β ) 2   +   α ( 4     β )     12   +   9 β     β 2 8     6 β   +   4 α ( 4     β ) 2 ,   p n T O = β ( 1     β )   +   4 λ ( 2     β )   +   2 α ( 4     β ) 6     2 β   +   λ ( 2     β ) 8     6 β   +   4 α ( 4     β ) 2 ,   p r T O = β 1     β   +   2 λ   +   α ( 4     β ) ( 5     β   +   λ ) 4     3 β   +   2 α ( 4     β ) 2 ,   π m T O = A 1     A 2 4 4     3 β   +   2 α ( 4     β ) 2 2 ,   π r T O = 8     5 β     8 λ   +   2 α ( 4     β ) ( 2     β     2 λ ) 2 4 4     3 β   +   2 α ( 4     β ) 2 2 ,   π 3 T O = β 2 α ( 4     β ) ( 1   +   λ )     2   +   β   +   4 λ 2 2 4 4     3 β   +   2 α ( 4     β ) 2 2 ,   and S W T O = A 3     A 4 32     24 β   +   16 α ( 4     β ) 2 ,
where the values of  A 1  to  A 4  are given in Appendix C.
We hereafter utilize the superscript l Γ = { T O ,   T S } to denote the equilibrium values in the three models. In Equation (3), to meet the assumptions k T O > 0 and q n T O > q a T O , the following condition should hold:
12 9 β + β 2 2 ( 4 β ) 2 + α ( 4 β ) = λ L T O < λ < λ U T O = 8 5 β + α 28 3 β ( 7 β ) 2 2 + α ( 4 β ) 2 .

4.2. Model TS: Both Take-Back and Subsidy Programs

In Model TS, the government implements the take-back and subsidy programs at the same time. The sequence of the three-stage Stackelberg game in Model TS is as follows. In the first stage of the game, the government announces the penalty k for each unit of uncollected product and the subsidy level s for each unit of remanufactured product. In the second stage, the manufacturer decides on the wholesale price w , licensing fee f , and quantity of collected products q a . In the last stage of the game, the retailer determines the quantity of new product sales q n , while the remanufacturer simultaneously decides the quantity of remanufactured product sales q r . The profit and social welfare functions in Model TS are then expressed as follows:
π m = w q n + f q r q a 2 α k ( q n q a ) ,   π r = ( p n w ) q n ,   π 3 = ( p r f + s ) q r ,   and   S W = π s c + C S s q r + k ( q n q a ) E I .
The term s q r in Equation (4) represents the government’s expenditure when subsidizing remanufactured products. By applying backward induction to Equation (4), we can find the equilibrium decisions of the players in Model TS, as presented below in Proposition 2.
Proposition 2.
The equilibrium decisions, profits, and social welfare in Model TS are determined as follows:
s T S = β 1     β   +   2 λ   +   2 α 4   +   λ ( 8     β ) 1     β   +   2 α ( 4     3 β ) ,   k T S = 2 λ 2     β   +   α ( 4     3 β )     3 ( 1     β ) 1     β   +   2 α ( 4     3 β ) ,   w T S = 2 λ   +   α ( 4     3 β ) ( 1   +   λ )   +   β ( 1     λ )     1 1     β   +   2 α ( 4     3 β ) ,   f T S = β 1     β   +   λ   +   α 8     3 β   +   λ ( 8     β ) 1     β   +   2 α ( 4     3 β ) ,   q n T S = 1     β     λ   +   α 2     3 β     λ ( 2   +   β ) 1     β   +   2 α ( 4     3 β ) ,   q r T S = 3 α   +   λ ( 1   +   5 α ) 1     β   +   2 α ( 4     3 β ) ,   q a T S = α 2 λ 2     β   +   α ( 4     3 β )     3 ( 1     β ) 1     β   +   2 α ( 4     3 β ) ,   p n T S = 6 α ( 1     β )   +   λ 1     β   +   2 α ( 1     2 β ) 1     β   +   2 α ( 4     3 β ) ,   p r T S = α β ( 3     3 β     3 λ   +   β λ ) 1     β   +   2 α ( 4     3 β ) ,   π m T S = A 5     A 6   +   A 7 4 1     β   +   2 α ( 4     3 β ) 2 ,   π r T S = 1     β     λ   +   α 2     3 β     λ ( 2   +   β ) 2 1     β   +   2 α ( 4     3 β ) 2 ,   π 3 T S = β 3 α   +   λ ( 1   +   5 α ) 2 1     β   +   2 α ( 4     3 β ) 2 ,   and S W T S = ( 1     2 λ ) 2 ( 1     β )   +   α ( 7     3 β )   +   2 λ λ   +   α 4 λ ( 1   +   α )   +   3 β ( 2     α λ ) 4 1     β   +   2 α ( 4     3 β ) ,
where the values of  A 5  to  A 7  are given in Appendix C.
In Equation (5), to meet the assumptions s T S > 0 , k T S > 0 , and q n T S > q a T S , the following condition should hold:
3 ( 1     β ) 2 2 β   +   α ( 4 3 β ) = λ L T S < λ < λ U T S = 2 ( 1 β )   +   α ( 7 9 β ) 2 1   +   4 α   +   α 2 ( 4 3 β ) .

4.3. Discussion

In this subsection, the sensitivity and comparison analyses of the equilibrium results of Models TO and TS are conducted. Note that, in this paper, all numerical experiments are conducted using artificially simulated parameter settings.

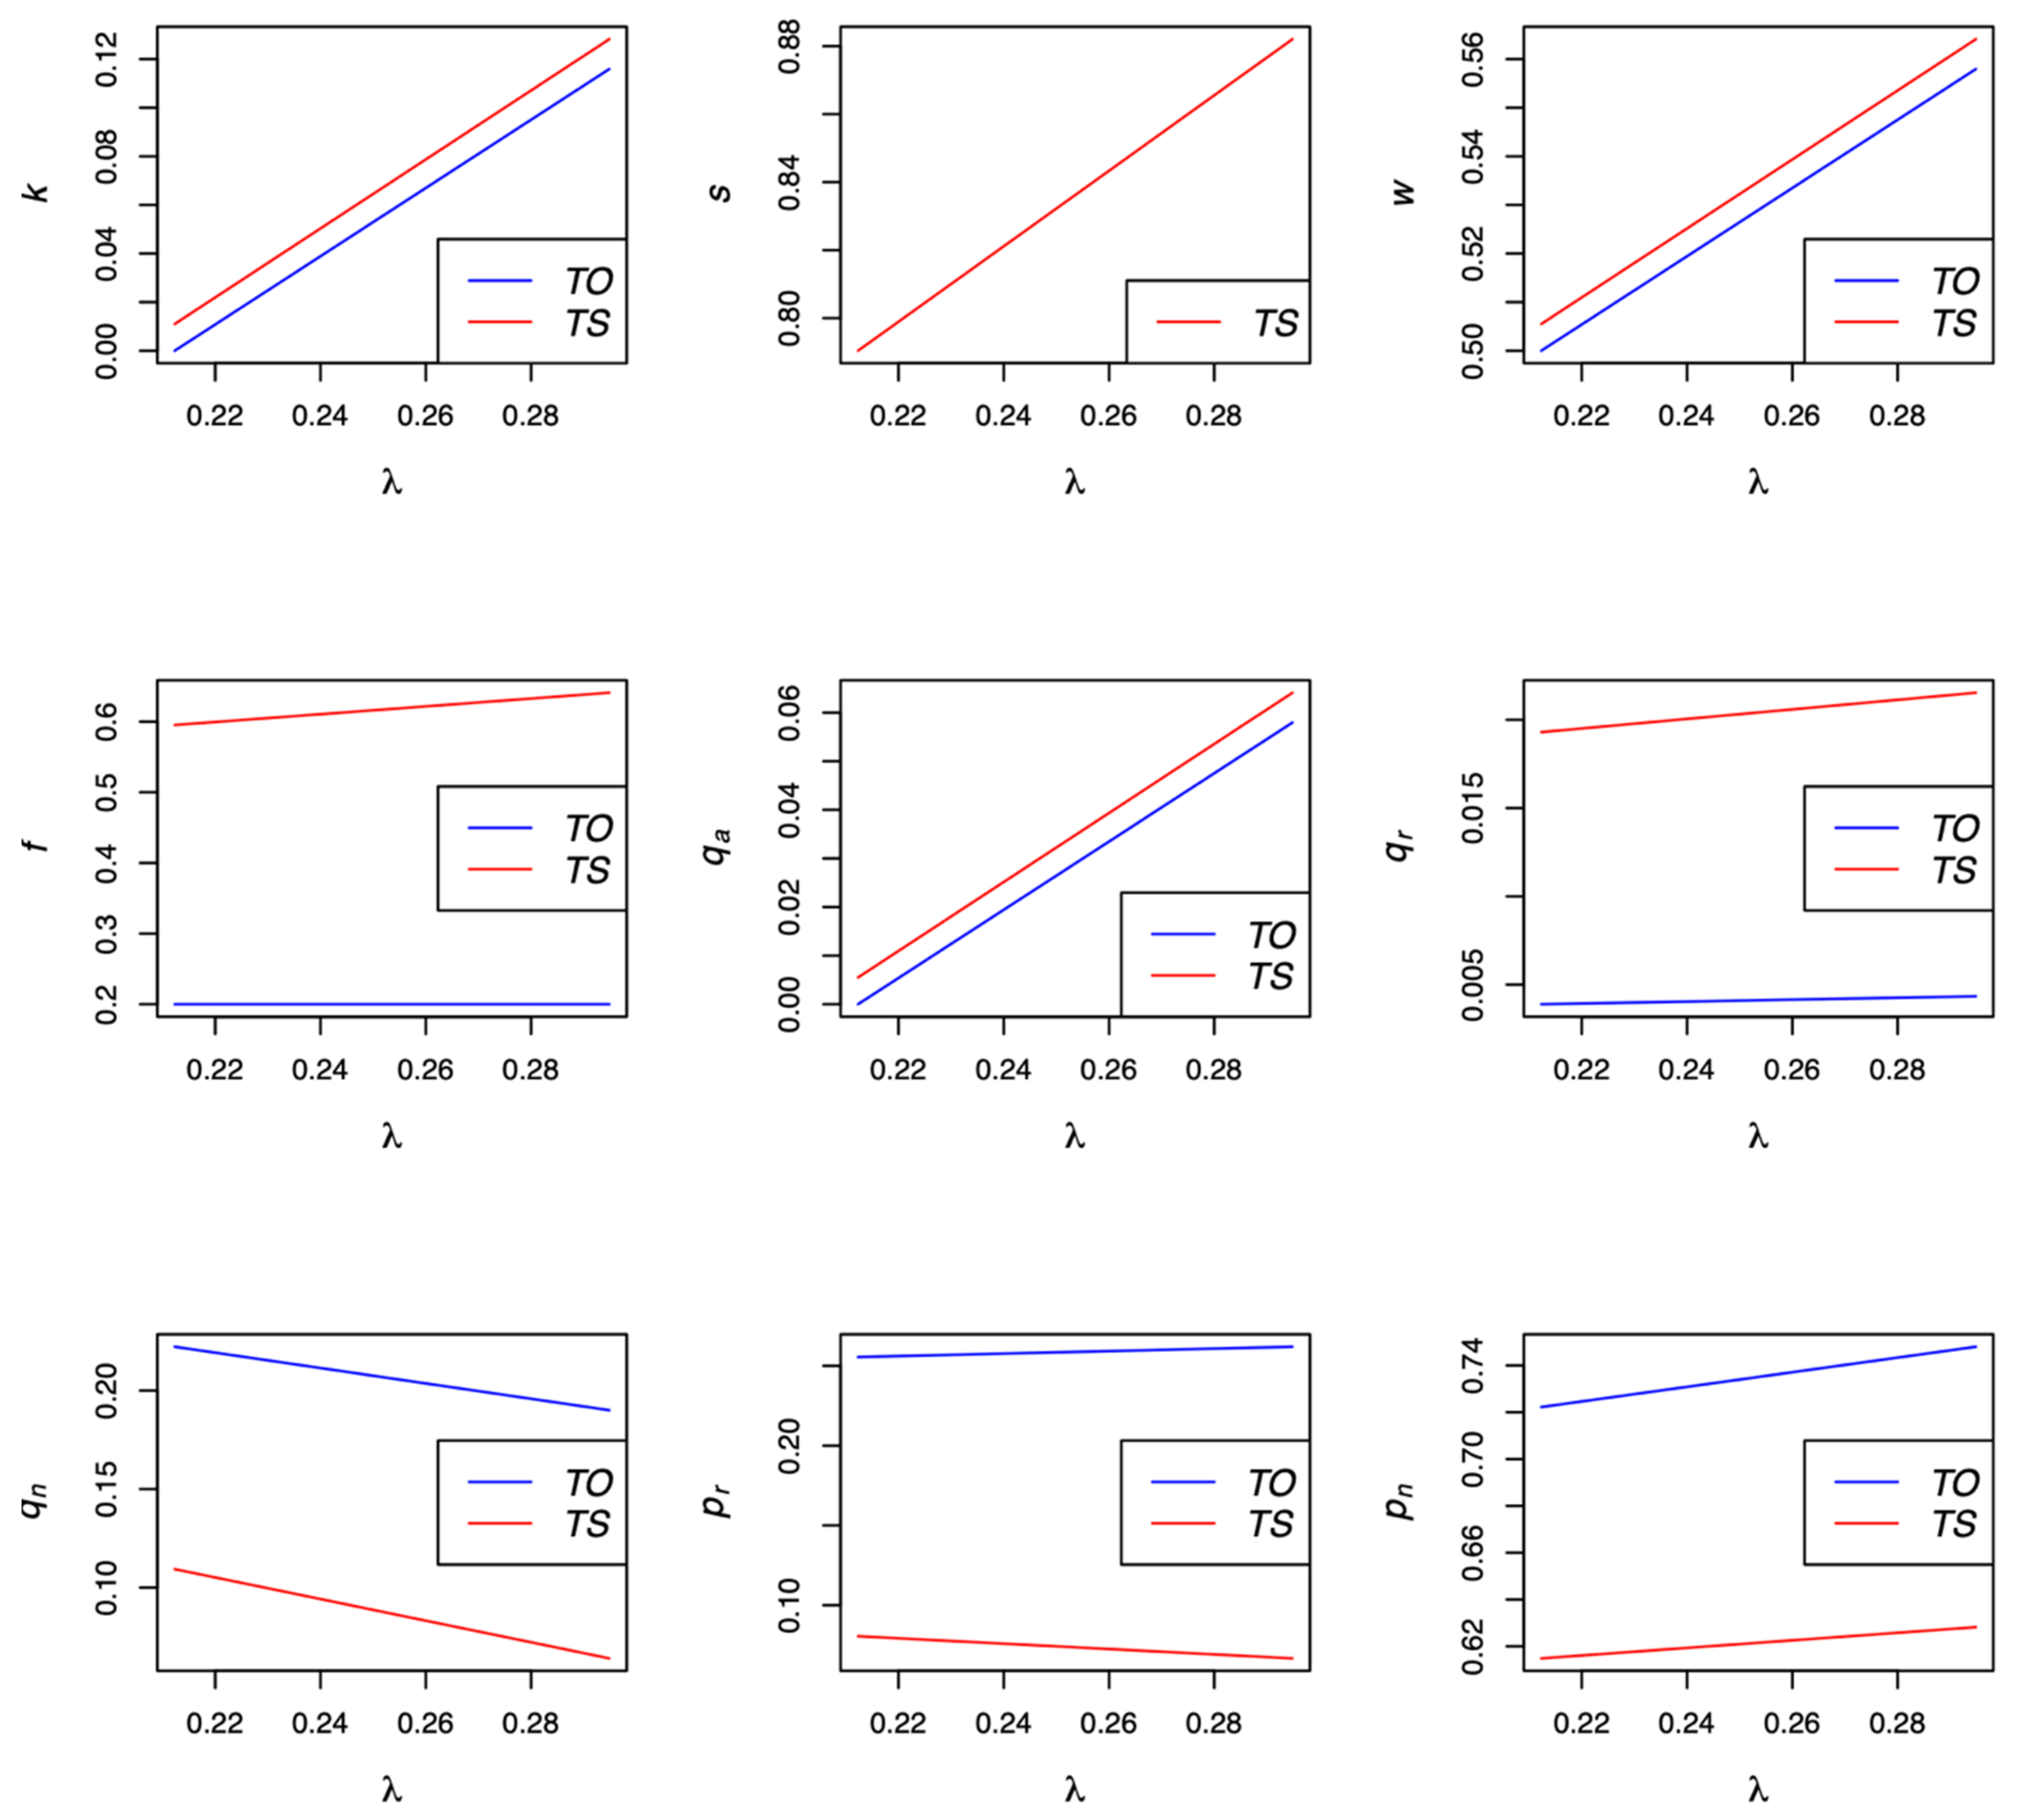
4.3.1. Effects of the Unit Landfill Cost on Equilibrium Decisions

The parameter λ in the social welfare function represents the cost coefficient of environmental damage caused by landfilling an uncollected product. In other words, as the value of λ increases, the negative impact on the environment becomes more pronounced. From Propositions 1 and 2, we can derive the following results of the sensitivity analysis.
Corollary 1.
The effects of λ on the equilibrium decisions in the two models are summarized in Table 2.
Figure 2 illustrates Table 2 with the parameter settings of α = 1 and β = 0.4 . Varying the value of λ from 0.21 to 0.29, we record the equilibrium decisions of Models TO and TS in Figure 2.
Table 2 and Figure 2 show the effects of the unit landfill cost for uncollected products λ on the equilibrium decisions in the two models. In Model TO, where the government solely implements the take-back program, λ exerts a positive influence on the penalty on uncollected products. The greater the detrimental environmental effects of landfilling, the stronger the government’s inclination to encourage the waste collection and remanufacturing of products. In pursuit of this objective, the government enforces a steeper penalty on uncollected products, thereby incentivizing the manufacturer to retrieve a greater quantity of used products. As the volume of used products transferred to the remanufacturer surges, the demand for remanufactured products naturally experiences a corresponding rise. With the escalation of the penalty, the manufacturer finds itself compelled to curtail the production of new products. The augmented penalty concurrently elevates the wholesale price of new products, serving as compensation to the manufacturer for the augmented costs attributable to the heightened penalty. This, in turn, leads to an increase in the selling price of new products. As the retailer increases its selling price, the competing remanufacturer can likewise raise her selling price for remanufactured products. In other words, as λ increases, the fierce competition between the retailer and remanufacturer over the selling price becomes more pronounced. Note that the licensing fee remains constant in Model TO. In Model TS, where the government simultaneously enacts the take-back and subsidy programs, λ has positive effects on both the subsidy and penalty. In order to enhance the collection and remanufacturing of used products, the government offers increased subsidies for remanufactured products, thereby stimulating consumer’s interest in remanufactured products in the market. If the government augments its subsidy level for remanufactured products, the remanufacturer gains the ability to reduce the selling price of her products. This, in turn, amplifies the demand for remanufactured products while diminishing the demand for new products. To make up for the sluggish sales of new products, the manufacturer is inclined to increase his profit by charging a higher licensing fee for an increased number of transferred products. Similar to Model TO, in Model TS, the greater the penalty, the higher both the wholesale and retail prices of new products.

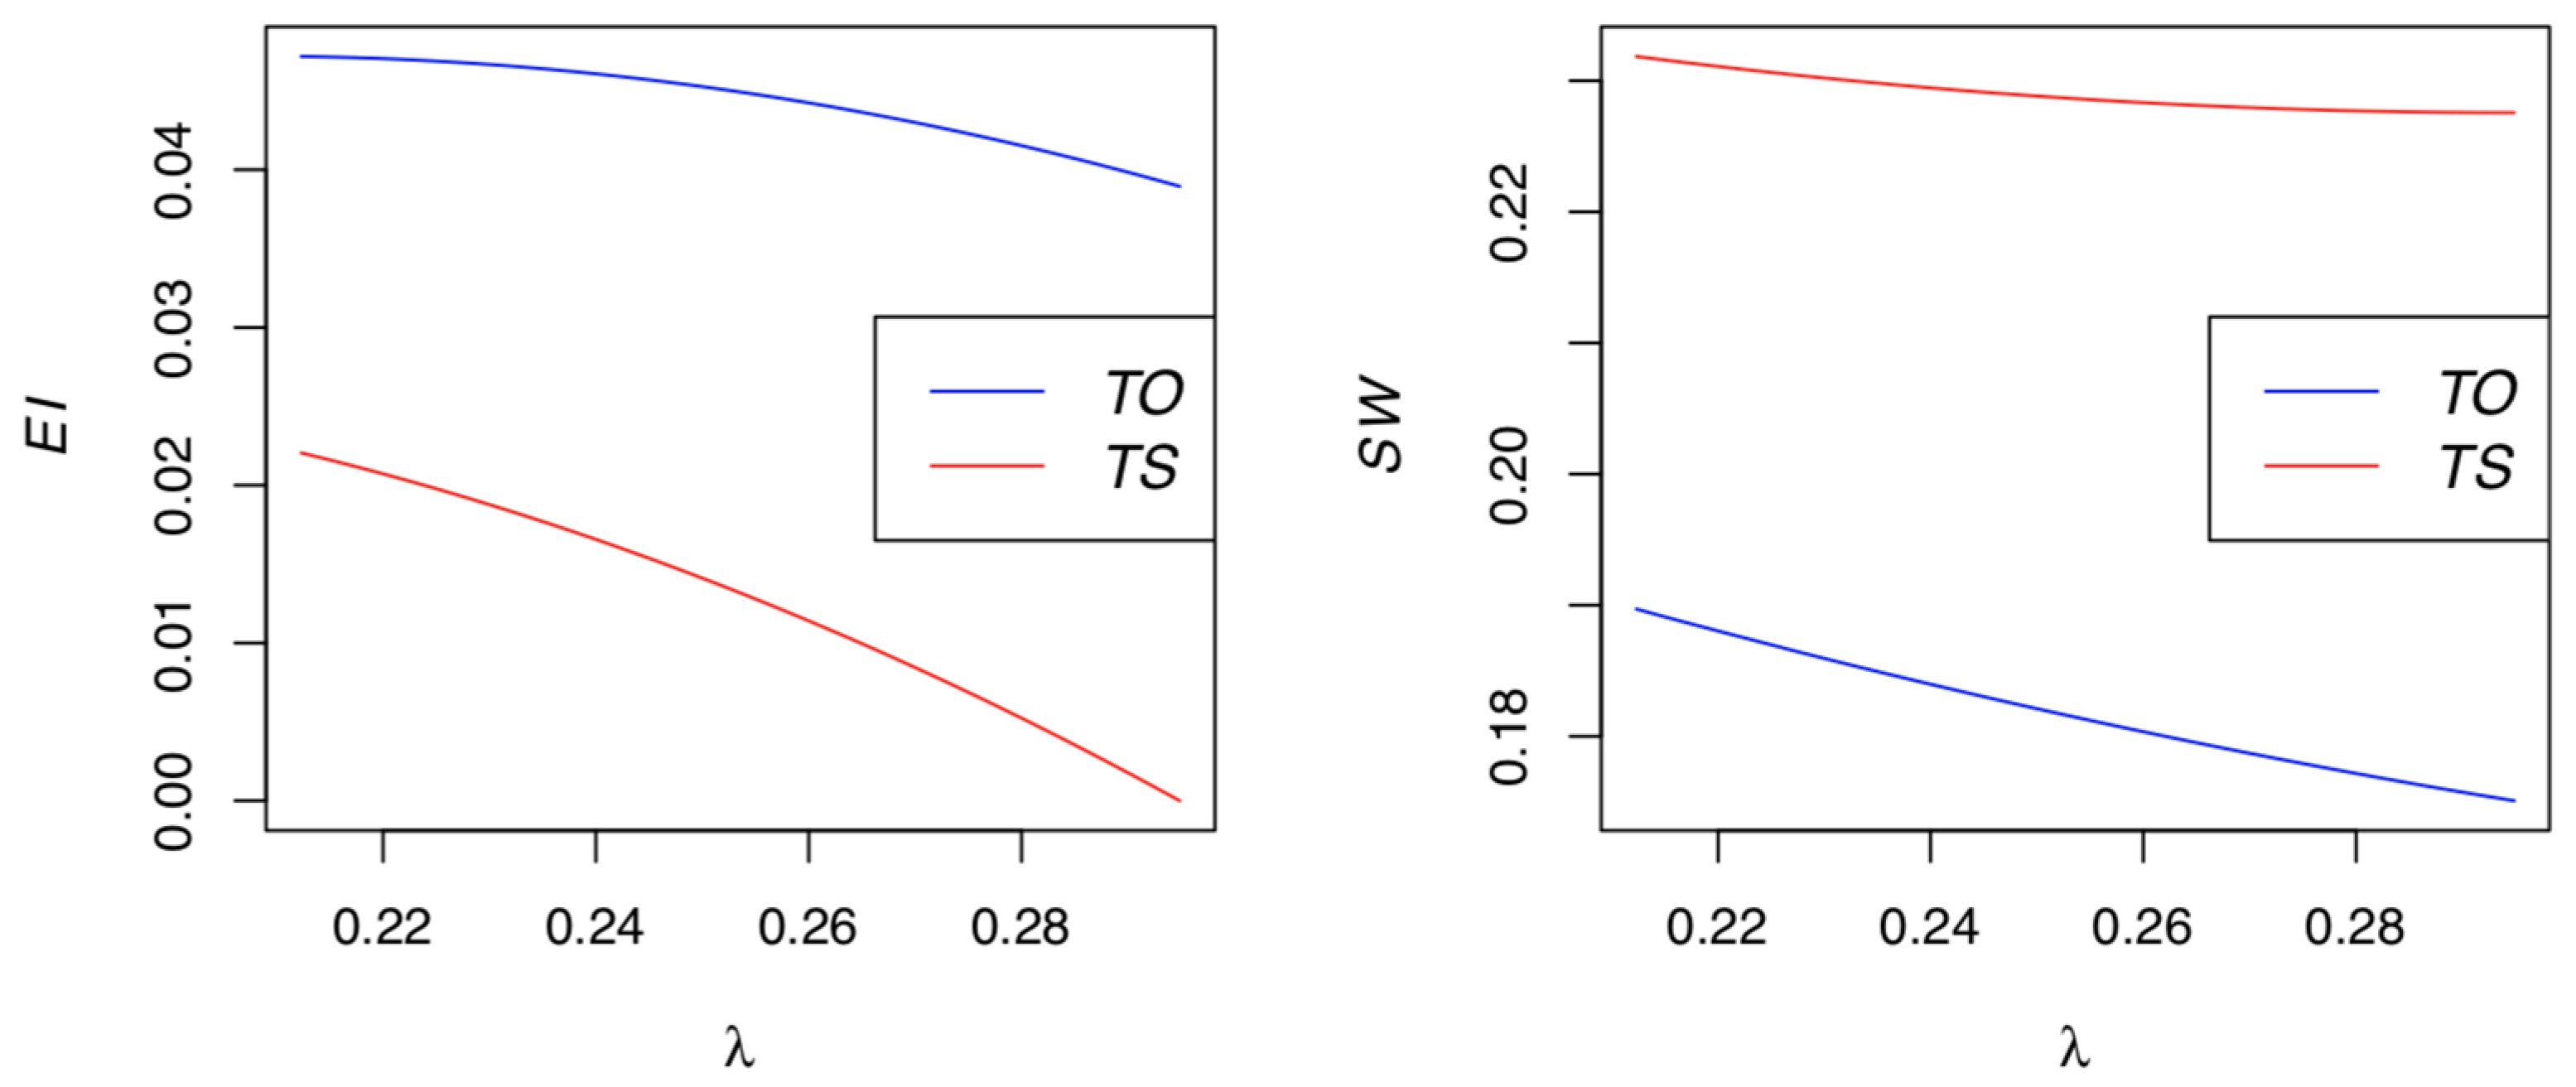
4.3.2. Comparisons between Models TO and TS

One may wonder which model is better for the environment and for society. The answer to this question can be found in Corollary 2 below.
Corollary 2.
k T S > k T O , q a T S > q a T O , and q r T S > q r T O .
Corollary 2 shows the difference between Models TO and TS in terms of the penalties associated with uncollected products and the quantities of collected and remanufactured products. From Corollary 2 and Figure 2, we learn that in Model TS, the government enforces a more substantial penalty compared to Model TO. This compels the manufacturer to collect a greater quantity of used products in Model TS than in Model TO. Furthermore, it is noteworthy that in Model TS, a higher volume of used product is collected, and more remanufactured products are subsequently sold compared to Model TO. The incorporation of the subsidy program empowers the remanufacturer to lower the selling price, consequently stimulating heightened demand for remanufactured products.
Corollary 3.
E I T S < E I T O  and  S W T S > S W T O .
Corollary 3 describes one of our major findings. To confirm Corollary 3, we plot the environmental impact E I and social welfare S W in Figure 3, with the same settings as in Figure 2. From Corollary 3 and Figure 3, when the government enacts the take-back program, the subsidy program has the capability to mitigate the overall environmental impact cost stemming from the disposal of uncollected products in landfills. This can be intuitively derived from Corollary 2 because the collected quantity of used products in Model TS exceeds that in Model TO (i.e., q a T S > q a T O ). Corollary 3 and Figure 3 also show that, from a social welfare standpoint, Model TS surpasses Model TO. Consequently, even from the government’s standpoint, the simultaneous execution of both waste management programs is significantly more favorable in terms of environmental conservation and social welfare.

5. Extension

From Section 4, it is revealed that Model TS outperforms Model TO. The aim of this section is to extend Model TS considering a coalition.

5.1. Model TSC: Model TS Considering Coalition

In Model TSC, which is an extension of Model TS, we consider a coalition between the retailer and the remanufacturer. The purpose of the coalition is to maximize the sum of the retailer’s and remanufacturer’s profits π t . The sequence of the three-stage Stackelberg game in Model TSC is as follows. In the first stage of the game, the government announces the penalty k for each unit of uncollected product and the subsidy level s for each unit of remanufactured product. In the second stage, the manufacturer decides on the wholesale price w , licensing fee f , and quantity of collected products q a . In the last stage of the game, the coalition determines the quantity of new product sales q n and the quantity of remanufactured product sales q r at the same time. Then, the profit and social welfare functions in Model TSC can be expressed as follows:
π m = w q n + f q r q a 2 α k ( q n q a ) ,   π t = π r + π 3 = ( p n w ) q n + ( p r f + s ) q r ,   and   S W = π s c + C S s q r + k ( q n q a ) E I .
Appling backward induction to Equation (6), we can obtain the equilibrium decisions of the players in Model TSC, as presented in Proposition 3.
Proposition 3.
The equilibrium decisions, profits, and social welfare in Model TSC are determined as follows:
s T S C = 3 β ( 1   +   8 α λ ) 1   +   8 α ,   k T S C = 4 λ ( 1   +   2 α )     3 1   +   8 α ,   w T S C = 2 λ   +   4 α ( 1   +   λ )     1 1   +   8 α ,   f T S C = 2 β 1   +   2 α ( 1   +   3 λ ) 1   +   8 α ,   q n T S C = 1     β     λ   +   2 α 1     β     λ ( 1   +   3 β ) ( 1   +   8 α ) ( 1     β ) ,   q r T S C = λ 1     β ,   q a T S C = α 4 λ ( 1   +   2 α )     3 2   +   16 α ,   p n T S C = λ   +   2 α ( 3   +   λ ) 1   +   8 α ,   p r T S C = 6 α β ( 1     λ ) 1   +   8 α ,   π m T S C = 8   +   α ( 41   +   32 α )     8 λ ( 1   +   2 α ) ( 2   +   7 α ) 4 ( 1   +   8 α ) 2   +   2 λ 2 ( 1   +   2 α ) 3   +   2 α β ( 5   +   26 α     4 α 2 ) ( 1   +   8 α ) 2 ( 1     β ) ,   π t T S C = ( 1   +   2 α ) 2 ( 1     β ) ( 1     2 λ )   +   λ 2 1   +   4 α 1   +   α   +   3 β   +   15 α β ( 1   +   8 α ) 2 ( 1     β ) ,   π r T S C = ( 1   +   2 α ) ( 1     λ ) 1     β     λ   +   2 α 1     β     λ ( 1   +   3 β ) ( 1   +   8 α ) 2 ( 1     β ) ,   π 3 T S C = β λ 1   +   2 α ( 1   +   3 λ ) ( 1   +   8 α ) ( 1     β ) ,   and   S W T S C = ( 2   +   7 α ) ( 1     2 λ ) 4 ( 1   +   8 α )   +   λ 2 1   +   4 α ( 1   +   α )   +   4 α β ( 1     α ) 2 ( 1   +   8 α ) ( 1     β ) .
In Equation (7), to meet the assumptions k T S C > 0 and q n T S C > q a T S C , the following condition should hold:
3 4 + 8 α = λ L T S C < λ < λ U T S C = ( 2 + 7 α ) ( 1 β ) 2 + 8 α ( 1 + α + β α β ) .
From Proposition 3, we have Corollary 4.
Corollary 4.
The effects of λ on the equilibrium decisions in Model TSC are summarized in Table 3.
Corollary 4 shows the effects of the unit landfill cost incurred for uncollected products λ on the equilibrium decisions of Model TSC. The effects of λ in Model TSC are identical to those in Model TS; hence, here we omit redundant statements.

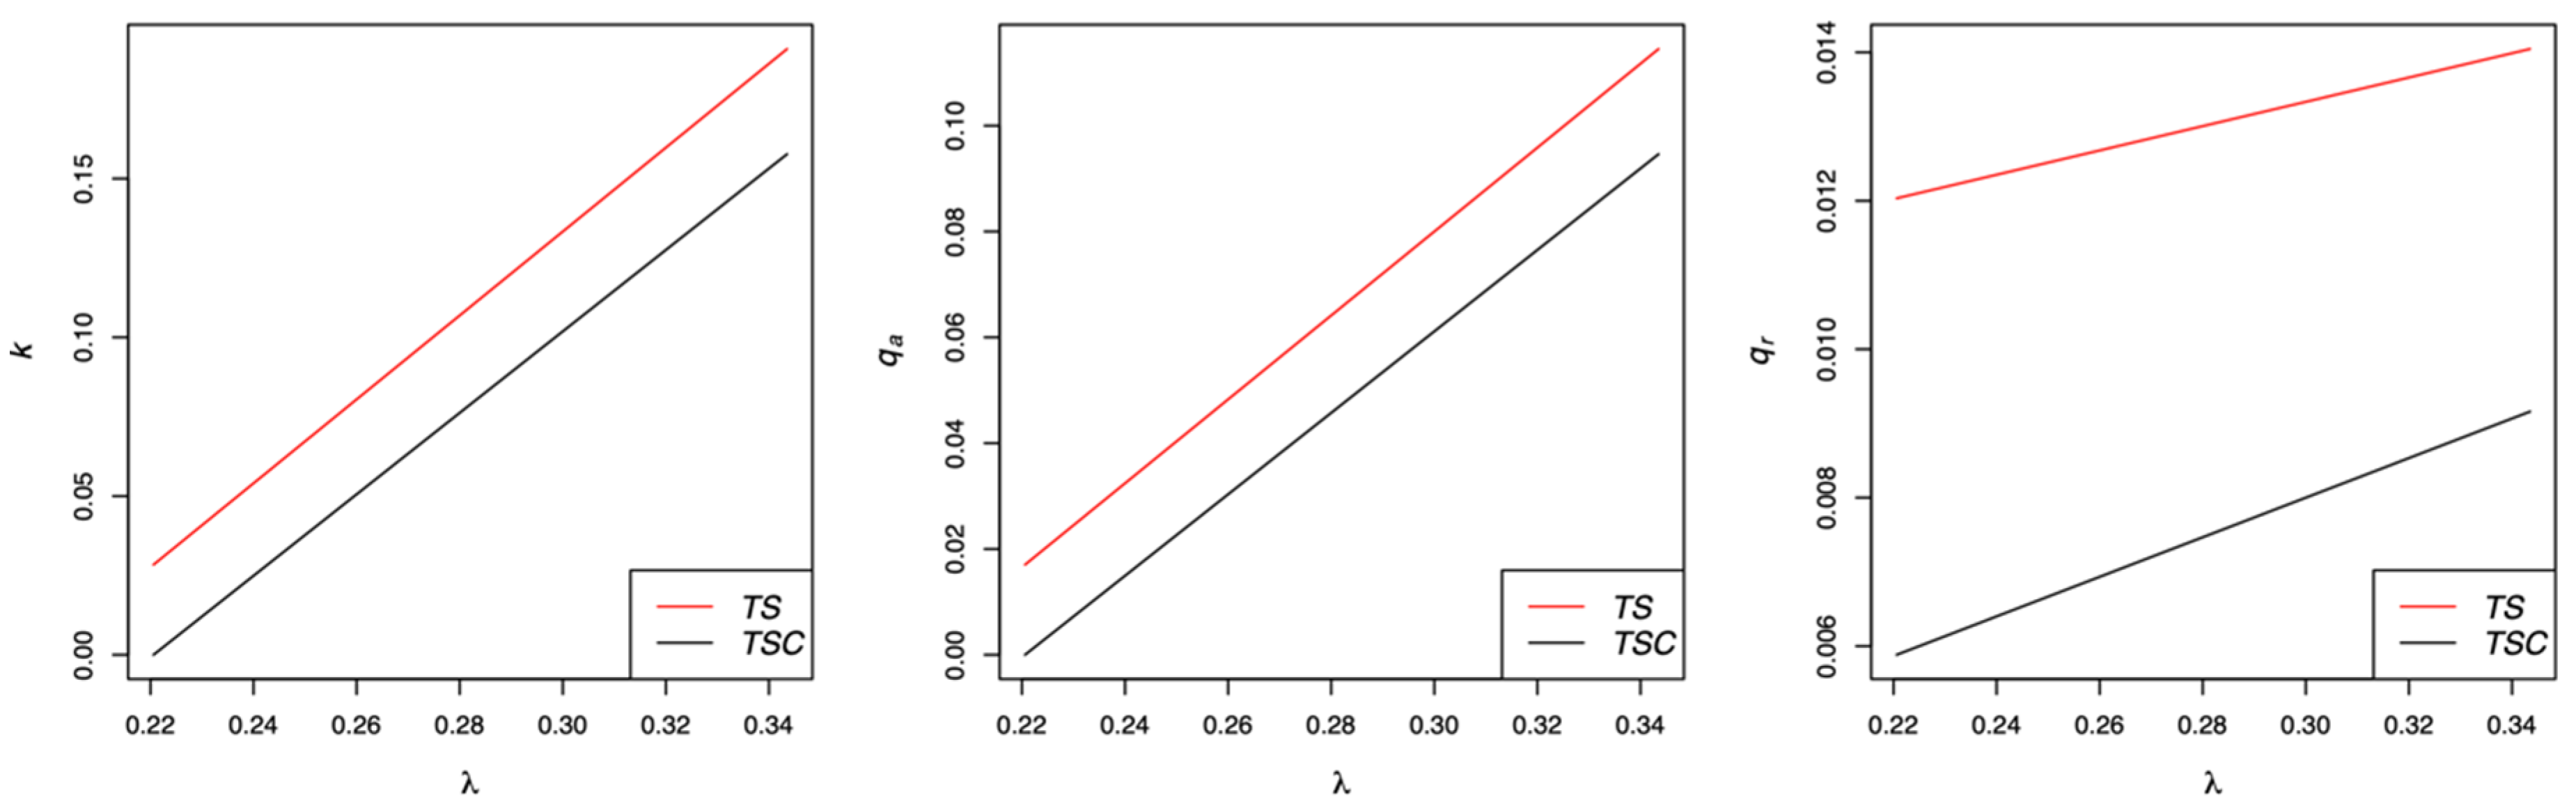
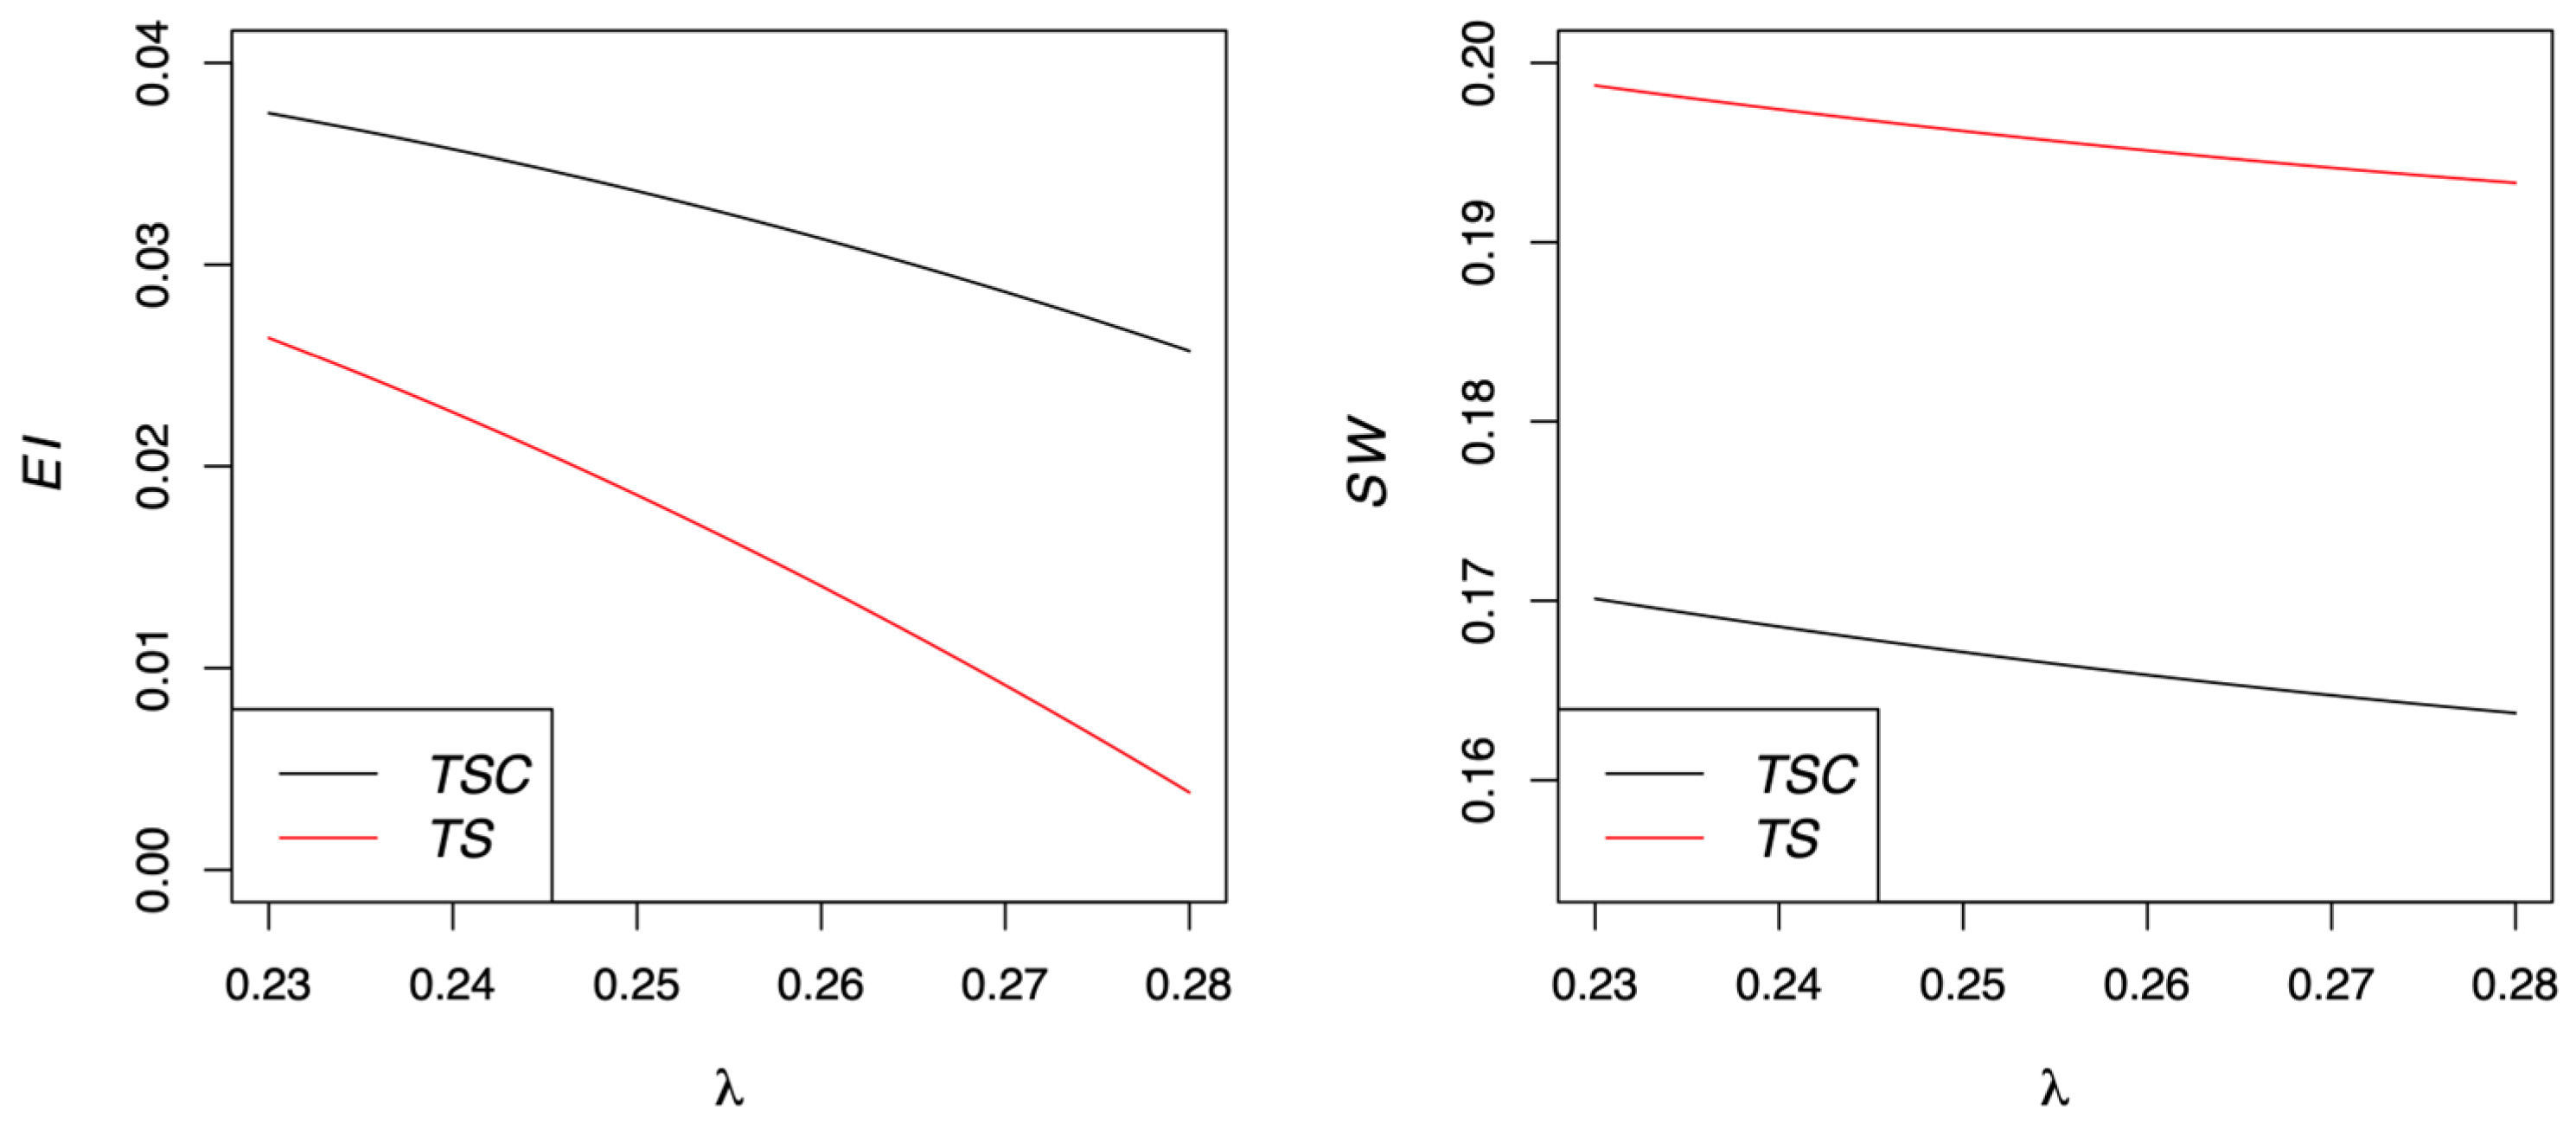
5.2. Comparison of Model TSC with Model TS

In order to observe how the coalition between the retailer and the remanufacturer affects the performances of the CLSC, comparisons between Models TSC and TS are needed. From Propositions 2 and 3, we derive Corollaries 5 and 6 as shown below.
Corollary 5.
k T S C < k T S , q a T S C < q a T S , and  q r T S C < q r T S .
Corollary 5 presents the difference between Models TS and TSC in terms of the penalties for uncollected products and the quantities of collected and remanufactured products. Figure 4 confirms the results in Corollary 5, with the parameter settings α = 1.2 and β = 0.25 . From Corollary 5 and Figure 4, it is found that in Model TS, the government enforces a more substantial penalty compared to Model TSC; as a result, the quantity of collected products in Model TS surpasses that in Model TSC. This suggests that the coalition between the retailer and remanufacturer has the impact of reducing the penalty imposed on the manufacturer, and it also diminishes the manufacturer’s take-back efforts. Corollary 5 and Figure 4 further demonstrate that the demand for remanufactured products in Model TSC  q r T S C consistently lags behind that in Model TS  q r T S , implying that the coalition between the retailer and remanufacturer does not have the capability to boost the demand for remanufactured products.
Corollary 6.
We have the following relationships:
(1)
If  λ < Λ = 3 ( 1   +   5 α ) ( 1     β ) 6     4 β   +   α ( 39     23 β ) , then  E I T S C > E I T S ; otherwise E I T S C < E I T S ;
(2)
S W T S C < S W T S .
Corollary 6 and Figure 5 show the difference between Models TS and TSC in terms of the total environmental impact cost E I and the social welfare S W . If the unit landfill cost for uncollected products λ is relatively low (i.e., λ < Λ ), the coalition between the retailer and the remanufacturer is not a good choice because the total environmental impact cost in Model TSC is greater than that in Model TS. Conversely, if λ is relatively high (i.e., λ > Λ ), the coalition is a good choice in terms of environmental protection. Summarizing the findings thus far, the coalition can be either better or worse for environmental protection, depending on the unit landfill cost. However, as evident from Corollary 6 and Figure 5, it can be observed that in terms of maximizing social welfare, it is far more advantageous for the retailer and remanufacturer not to form a coalition. This interpretation suggests that the coalition between the retailer and remanufacturer not only reduces the quantity of collected products but also diminishes the demand for remanufactured products, thereby exerting a detrimental impact on the social welfare.

6. Managerial Insights

This section provides some key managerial insights summarized as follows:
  • As can be seen from the results of all research models considered in this study, the greater the negative impact that uncollected product has on the environment, the higher the penalty the government should impose on this uncollected product. High penalties for products that are not collected force a manufacturer to put more efforts into take-back activities, which not only naturally reduces damages to the environment but also has positive effects on the sustainability of a CLSC.
  • One of the important results of this study is that the subsidies for remanufactured products have positive impacts on supply chain performance in terms of environmental protection and social welfare. Therefore, the government needs to develop effective subsidy programs to revitalize the remanufacturing industry and implement various remanufacturing promotion policies that can help develop remanufacturing technology.
  • According to the results of this study, the formation of the coalition between a retailer and a remanufacturer has a negative impact on overall social welfare. Their coalition is not always a good choice from an environmental or social welfare perspective because it has the effect of suppressing the demand for remanufactured products. Therefore, the government must recognize the negative effects of forming a coalition between a retailer and a remanufacturer and provide institutional support to other types of cooperation strategies in a CLSC.

7. Conclusions

This paper explores the equilibrium decisions in a CLSC composed of a government, a manufacturer, a retailer, and a third-party remanufacturer. It was assumed that the CLSC takes three models: Model TO, Model TS, and Model TSC. Each CLSC model was analyzed in detail using the Stackelberg game framework. Our major findings are summarized below:
  • As shown in Models TO and TS, if the government implements a take-back program for the manufacturer, there is a greater negative environmental impact of landfilling and a higher penalty for uncollected used products. Thus, more products are collected and remanufactured in the supply chain. A take-back program results in increased social welfare because it reduces the environmental impact.
  • In the supply chain, implementing a take-back program in conjunction with a government subsidy program results in a greater reduction in an environmentally negative impact and in an enhanced social welfare, compared to implementing them separately. In other words, promoting the recycling of disposed products or materials and providing subsidies for remanufactured products is a much better choice in terms of environmental protection and social welfare.
  • Forming a coalition between the retailer and the third-party remanufacturer results in lowering the penalty imposed to the manufacturer, which leads to lowering the quantity of the collected and remanufactured products. Moreover, social welfare in the case of a coalition is smaller than that in the case of no coalition. In terms of maximizing the social welfare, it is much better for the retailer and the remanufacturer not to form the coalition. However, it is difficult to say whether the coalition is good or bad in terms of environmental protection.
While Section 1 of this paper highlights several cases related to the electronic industry supply chain, the model proposed in this study is a universal framework applicable to a variety of industrial sectors. Take-back programs in industries beyond the electronics sector include the following: (1) urban and community settings: Urban and local communities operate programs that collect and manage a wide range of waste types, from household waste to recyclables. These programs encourage waste separation and promote the effective reuse of recyclable resources; (2) manufacturing and industrial sectors: Industries manage waste generated during production processes through collection and recycling programs. Metals, paper, glass, and other manufacturers recycle waste materials or use them as raw materials; (3) food services and hospitality: the food service industry minimizes food waste and promotes recycling by utilizing programs that compost food waste or convert it into biogas, preventing wasteful disposal and environmental impact; (4) automotive and transportation industry: The automotive sector collects and recycles automotive waste, such as parts and tires. Disposal of charging equipment and batteries from electric vehicles is also a significant focus; (5) packaging and retail industry: the packaging industry emphasizes eco-friendly waste management by encouraging the use of renewable materials and recyclable packaging to minimize waste and promote sustainable consumption.
This paper provides several intuitions and recommendations for the decision makers in a CLSC. However, there are also limitations that can be expanded upon and improved in future research: (1) retailer’s and/or third-party remanufacturer’s collection efforts: In this study, we assumed that only a manufacturer engages in take-back activities. However, in reality, multiple members participating in a CLSC can collaborate in the waste collection activity. There is a need to address a research model that considers retailer’s and/or third-party remanufacturer’s collection efforts; (2) vertical coalition: This paper considered only the horizontal coalition between a retailer and a remanufacturer. The extended model can assume the vertical coalition between the manufacturer and the retailer. The vertical coalition can include sales promotion and/or collection activities; (3) cooperative contracts: In many studies, cooperative contracts including revenue sharing and cost sharing in a supply chain are beneficial to enhance the profitability and sustainability of the supply chain operation. The future research topic of this paper is to add various cooperative strategies to a CLSC; (4) dynamic game: Our research models need to accommodate dynamic variations of a CLSC to mitigate potential biases in optimal decision making. Therefore, a comparative analysis between the static game model and dynamic evolutionary game model needs to be conducted.

Author Contributions

Conceptualization, D.-H.L. and E.-H.P.; methodology, D.-H.L.; software, D.-H.L.; validation, E.-H.P.; formal analysis, D.-H.L. and E.-H.P.; investigation, D.-H.L. and E.-H.P.; data curation, E.-H.P.; writing—original draft preparation, D.-H.L. and E.-H.P.; writing—review and editing, D.-H.L. and E.-H.P.; visualization, D.-H.L. and E.-H.P.; supervision, D.-H.L. and E.-H.P.; funding acquisition, E.-H.P. All authors have read and agreed to the published version of the manuscript.

Funding

The work of the second author was supported by the National Research Foundation of Korea (NRF) grant funded by the Ministry of Science and ICT (NRF-2019R1F1A1060746).

Institutional Review Board Statement

Not applicable.

Informed Consent Statement

Not applicable.

Data Availability Statement

Data are contained within the article.

Conflicts of Interest

The authors declare no conflict of interest.

Appendix A

Proof of Proposition 1.
The second-order conditions (SOCs) of the retailer and remanufacturer are given by 2 π r / q n 2 = 2 < 0 and 2 π 3 / q r 2 = 2 β < 0 , respectively. Thus, the first-order conditions (FOCs) of the retailer’s and remanufacturer’s problem yield:
q n = 2 + f 2 w β 4 β   and   q r = 2 f + β ( 1 + w ) β ( 4 β ) .
Substituting q n and q r in Equation (A1) into the manufacturer’s profit function, we obtain the following Hessian matrix:
H T O = 2 π m w 2 2 π m w f 2 π m w q a 2 π m f w 2 π m f 2 2 π m f q a 2 π m q a w 2 π m q a f 2 π m q a 2 = 4 4     β 2 4     β 0 2 4     β 4 β ( 4     β ) 0 0 0 2 α .
Define Δ k l as the leading principal minor of order k in H l . From Equation (A2), we have that the following:
Δ 1 T O = 4 4 β < 0 ,   Δ 2 T O = 4 β ( 4 β ) > 0 ,   and   Δ 3 T O = 8 α β ( 4 β ) < 0 ,
which implies that the manufacturer’s profit is strictly concave with respect to w , f , and q a . By solving the FOCs of the manufacturer’s problem, we obtain the following:
w = 1 + k 2 ,   f = β 2 ,   and   q a = k α 2 .
Integrating w , f , and q a in Equation (A4) into the social welfare function, the SOC of the government’s problem is given by the following:
2 S W k 2 = 4 3 β + 2 α ( 4 β ) 2 4 ( 4 β ) 2 < 0 ,
implying that social welfare is strictly concave with respect to k . Finally, solving the FOC of the government’s problem gives the results in Proposition 1. This completes the proof. □
Proof of Proposition 2.
The SOCs of the retailer and remanufacturer are given by 2 π r / q n 2 = 2 < 0 and 2 π 3 / q r 2 = 2 β < 0 , respectively. Thus, solving the FOCs of the retailer’s and remanufacturer’s problem yields the following:
q n = 2 + f s 2 w β 4 β   and   q r = 2 ( s f ) + β ( 1 + w ) β ( 4 β ) .
Substituting q n and q r in Equation (A6) into the manufacturer’s profit function, we obtain the manufacturer’s Hessian matrix:
H T S = 2 π m w 2 2 π m w f 2 π m w q a 2 π m f w 2 π m f 2 2 π m f q a 2 π m q a w 2 π m q a f 2 π m q a 2 = 4 4     β 2 4     β 0 2 4     β 4 β ( 4     β ) 0 0 0 2 α = H T O .
From Equation (A7), we have the following:
Δ 1 T S = Δ 1 T O < 0 ,   Δ 2 T S = Δ 2 T O > 0 ,   and   Δ 3 T S = Δ 3 T O < 0 ,
which implies that the manufacturer’s profit is strictly concave with respect to w , f , and q a . By solving the FOCs of the manufacturer’s problem, we obtain the following:
w = 1 + k 2 ,   f = s + β 2 ,   and   q a = k α 2 .
Integrating w , f , and q a in Equation (A9) into the social welfare function, we obtain the government’s Hessian matrix:
G T S = 2 S W s 2 2 S W s k 2 S W k s 2 S W k 2 = 4     3 β 4 β ( 4     β ) 2 β 4 ( 4     β ) 2 β 4 ( 4     β ) 2 4     3 β   +   2 α ( 4     β ) 2 4 ( 4     β ) 2 .
Let Θ k l be the leading principal minor of order k in G l . We then have the following:
Θ 1 T S = 4 3 β 4 β ( 4 β ) 2 < 0   and   Θ 2 T S = 1 β + 2 α ( 4 3 β ) 16 β ( 4 β ) 2 > 0 ,
implying that social welfare is strictly concave with respect to s and k . Finally, solving the FOCs of the government’s problem gives the results in Proposition 2. This completes the proof. □
Proof of Corollary 1.
The first-order derivatives of the equilibrium decisions with respect to λ in Models TO and TS are summarized Table A1. This completes the proof. □
Table A1. First-order derivatives of equilibrium decisions with respect to λ in two models.
Models l = T O l = T S l = T S C
s l / λ N/A 2 K 2 β 1 + α ( 8 β ) > 0 24 α β K 3 > 0
k l / λ 2 K 1 ( 4 β ) > 0 2 K 2 2 β + α ( 4 3 β ) > 0 4 K 3 ( 1 + 2 α ) > 0
w l / λ K 1 ( 4 β ) > 0 K 2 2 β + α ( 4 3 β ) > 0 2 K 3 ( 1 + 2 α ) > 0
f l / λ 0 K 2 β 1 + α ( 8 β ) > 0 12 α β K 3 > 0
q a l / λ K 1 α ( 4 β ) > 0 K 2 α 2 β + α ( 4 3 β ) > 0 2 K 3 α ( 1 + 2 α ) > 0
q r l / λ K 1 > 0 K 2 ( 1 + 5 α ) > 0 ( 1 β ) 1 > 0
q n l / λ 2 K 1 < 0 K 2 1 + α ( 2 + β ) < 0 K 3 ( 1 β ) 1 ( 1 + 2 α + 6 α β ) < 0
p r l / λ K 1 β > 0 K 2 α β ( 3 β ) < 0 6 α β K 3 < 0
p n l / λ K 1 ( 2 β ) > 0 K 2 1 β + 2 α ( 1 2 β ) > 0 K 3 ( 1 + 2 α ) > 0
Note: K 1 = 2 + α ( 4 β ) 4 3 β + 2 α ( 4 β ) 2 > 0 , K 2 = 1 1 β + 2 α ( 4 3 β ) > 0 , and K 3 = 1 1 + 8 α > 0 .
Proofs of Corollaries 2 and 3.
From Propositions 1 and 2, we have the following relationships:
k T S k T O = 2 K 4 β 2 > 0 ,   q a T S q a T O = K 4 α β 2 > 0 ,   q r T S q r T O = K 4 2 β + 4 α ( 4 β ) > 0 , E T S E T O = K 4 β λ 1 + α ( 8 β ) < 0 ,   and   S W T S     S W T O = K 4 β 1     β   +   2 λ   +   2 α 4   +   λ ( 8     β ) 4 > 0 ,   where   K 4 = 1     β   +   2 λ   +   2 α 4   +   λ ( 8     β ) 2 4     3 β   +   2 α ( 4     β ) 2 1     β   +   2 α ( 4     3 β ) > 0 .
This completes the proof. □

Appendix B

Proof of Proposition 3.
The Hessian matrix of the coalition is expressed as follows:
C = 2 π t q n 2 2 π t q n q r 2 π t q r q n 2 π t q r 2 = 2 2 β 2 β 2 β .
Define Φ k as the leading principal minor of order k in C . We then have that Φ 1 = 2 < 0 and Φ 2 = 4 β ( 1 β ) > 0 , implying that the profit function of the coalition is strictly concave with respect to q n and q r . Solving the FOCs of the problem of the coalition results in the following:
q n = 1 + f s w β 2 ( 1 β )   and   q r = s f + w β 2 β ( 1 β ) .
Substituting q n and q r in Equation (A14) into the manufacturer’s profit function, we obtain the manufacturer’s Hessian matrix:
H T S C = 2 π m w 2 2 π m w f 2 π m w q a 2 π m f w 2 π m f 2 2 π m f q a 2 π m q a w 2 π m q a f 2 π m q a 2 = 1 1     β 1 1     β 0 1 1     β 1 β ( 1     β ) 0 0 0 2 α .
From Equation (A15), we have the following:
Δ 1 T S C = 1 1 β < 0 ,   Δ 2 T S C = 1 β ( 1 β ) > 0 ,   and   Δ 3 T S C = 2 α β ( 1 β ) < 0 ,
which implies that the manufacturer’s profit is strictly concave with respect to w , f , and q a . By solving the FOCs of the manufacturer’s problem, we obtain the following:
w = 1 + k 2 ,   f = s + β 2 ,   and   q a = k α 2 .
Integrating w , f , and q a in Equation (A17) into the social welfare function, we obtain the government’s Hessian matrix:
G T S C = 2 S W s 2 2 S W s k 2 S W k s 2 S W k 2 = 1 16 β ( 1     β ) 1 16 ( 1     β ) 1 16 ( 1     β ) 1 16 8 α + 1 1     β ,
leading to
Θ 1 T S C = 1 16 β ( 1 β ) < 0   and   Θ 2 T S C = 1 + 8 α 256 β ( 1 β ) > 0 .
Equation (A19) ensures that social welfare is strictly concave with respect to s and k . Accordingly, solving the FOCs of the government’s problem gives the results in Proposition 3. This completes the proof. □
Proof of Corollary 4.
The first-order derivatives of the equilibrium decisions with respect to λ in Model TSC are summarized Table A1. This completes the proof. □
Proof of Corollary 5.
From Propositions 2 and 3, we have the following relationships:
k T S C k T S = 2 K 4 β λ + α ( 3 + 5 λ ) < 0 ,   q a T S C q a T S = K 4 α β λ + α ( 3 + 5 λ ) < 0 ,   q r T S C q r T S = K 4 K 5 α ( 1   +   8 α ) ( 1     β ) ,   where   K 4 = 1 ( 1   +   8 α ) 1     β   +   2 α ( 4     3 β ) > 0   and   K 5 = 3 ( λ     1 )   +   β ( 3     λ ) .
To compare Models TSC and TS, the following condition must be met: λ < min λ U T S C ,   λ U T S . The first-order derivatives of λ U T S C with respect to α and β are given, respectively, by the following:
λ U T S C α = ( 1 β ) 1 + 8 β + 4 α ( 4 + 7 α ) ( 1 β ) 2 1 + 4 α ( 1 + α + β α β ) 2 < 0   and   λ U T S C β = ( 2 + 7 α ) ( 1 + 8 α β ) 2 1 + 4 α ( 1 + α + β α β ) 2 < 0 .
Equation (A21) implies that the maximum value of λ U T S C is equal to 0.5 at ( α ,   β ) = ( 1 ,   0 ) . Applying the same argument to λ U T S , we can prove that λ U T S 0.5 . Therefore, we have that λ ( 0 ,   0.5 ) . The maximum value of K 5 is realized at λ = 0.5 and β = 0.5 because K 5 / λ = 3 β > 0 and K 5 / β = 3 > 0 . Consequently, we have that K 5 < 0.25 , leading to q r T S C q r T S < 0 . This completes the proof. □
Proof of Corollary 6.
From Propositions 2 and 3, we have the following relationships:
E I T S C E I T S = K 4 α β λ 3 ( 1   +   5 α ) ( 1     β )     λ 6     4 β   +   α ( 39     23 β ) ( 1     β )   and   S W T S C S W T S = K 4 K 6 α β 2 ( 1     β ) ,   where   K 6 = λ 2 6 4 β + α ( 39 23 β ) 9 α ( 1 β ) 6 λ ( 1 + 5 α ) ( 1 β ) .
If λ < Λ in Equation (A22), then E I T S C E I T S > 0 ; otherwise, E I T S C E I T S < 0 . To determine the sign of K 6 in Equation (A22), we consider the following mathematical programming problem:
max   K 6 = λ 2 6 4 β + α ( 39 23 β ) 9 α ( 1 β ) 6 λ ( 1 + 5 α ) ( 1 β ) s . t . α 1 ,   0 < β 0.5 ,   a n d   0 < λ < 0.5 .
Using Mathematica software 13, the maximum value of K 6 is equal to 4.5 at ( α ,   β ,   λ ) = ( 1 ,   0.5 ,   0 ) . Therefore, we can conclude that K 6 < 0 and S W T S C S W T S < 0 . This completes the proof. □

Appendix C

A 1 = 16 8 + α ( 41 + 32 α ) 8 β 23 + α ( 115 + 48 α ) + β 2 78 + α ( 425 + 96 α ) 2 β 3 4 + α ( 39 + 4 α ) + 5 α β 4 A 2 = 4 λ ( 4 β ) 2 + α ( 4 β ) 8 5 β + α 28 3 β ( 7 β ) λ 2 + α ( 4 β ) 2 . A 3 = 16 β ( 13 β ) + 2 α 28 β ( 9 β ) . A 4 = 4 λ 8 5 β + α 28 3 β ( 7 β ) λ 2 + α ( 4 β ) 2 . A 5 = 8 ( 1 β ) 2 + 8 α 2 ( 4 + 3 β ) + α ( 1 β ) ( 41 33 β ) . A 6 = 4 λ 2 ( 1 β ) ( 2 β ) + α 22 15 β ( 3 β ) + α 2 28 3 β ( 35 11 β ) . A 7 = 4 λ 2 2 ( 1 + 2 α ) 3 + 6 α β ( 1 α ) ( 1 + 4 α ) α β 2 1 + α ( 2 9 α ) .

References

  1. Chen, M.; Ogunseitan, O.A. Zero E-waste: Regulatory impediments and blockchain imperatives. Front. Environ. Sci. Eng. 2021, 15, 114. [Google Scholar] [CrossRef]
  2. Singh, N.; Ogunseitan, O.A. Disentangling the worldwide web of e-waste and climate change co-benefits. Circ. Econ. 2022, 1, 100011. [Google Scholar] [CrossRef]
  3. Anupam, K.; Vella, A.A.; Suchana, C.; Wilts, H.; Ishrat, I.; Ulrich, K.; Meng, L.; Xiao, L.; Indu, K.M.; Temitope, D.T.O.; et al. Accelerating circular economy solutions to achieve the 2030 agenda for sustainable development goals. Circ. Econ. 2022, 1, 100001. [Google Scholar]
  4. Take-Back Program: Upcycling T-Shirts—Patagonia. Available online: http://www.patagonia.com/our-footprint/take-back-program.html (accessed on 11 November 2022).
  5. Waste Gets Cut from Xerox Recycling Efforts. Available online: http://www.documentcompanypr.com/xerox-recycle-to-reduce-waste (accessed on 11 November 2022).
  6. The Best Takeback Programs from Big Businesses. Available online: http://www.rts.com/blog/the-best-takeback-programs-from-big-businesses (accessed on 11 November 2022).
  7. Manufacturer & Retailer Take Back Programs for Electronics. Available online: https://productstewardship.net/products/electronics/resources/programs/business (accessed on 11 November 2022).
  8. Qiao, H.K.; Su, Q. Impact of government subsidy on the remanufacturing industry. Waste Manag. 2021, 120, 433–447. [Google Scholar] [CrossRef] [PubMed]
  9. Yu, H.; Chang, X.; Liu, W. Cost-based subsidy and performance-based subsidy in a manufacturing-recycling system considering product eco-design. J. Clean. Prod. 2021, 327, 129391. [Google Scholar] [CrossRef]
  10. Li, J.; Du, W.; Yang, F.; Hua, G. The carbon subsidy analysis in remanufacturing closed-loop supply chain. Sustainability 2014, 6, 3861–3877. [Google Scholar] [CrossRef]
  11. Gutowski, T.; Murphy, C.; Allen, D.; Bauer, D.; Brass, B.; Piwonka, T.; Sheng, P.; Sutherland, J.; Thurston, D.; Wolf, E. Environmentally benign manufacturing: Observations from Japan, Europe and the United States. J. Clean. Prod. 2005, 13, 1–17. [Google Scholar] [CrossRef]
  12. Asari, M.; Sakai, S.I. Li-ion battery recycling and cobalt flow analysis in Japan. Resour. Conserv. Recycl. 2013, 81, 52–59. [Google Scholar] [CrossRef]
  13. Liu, H.; Lei, M.; Deng, H.; Leong, G.K.; Huang, T. A dual channel, quality-based price competition model for the weee recycling market with government subsidy. Omega 2015, 59, 290–302. [Google Scholar] [CrossRef]
  14. Cruijssen, F.; Dullaert, W.; Fleuren, H. Horizontal cooperation in transport and logistics: A literature review. Transp. J. 2007, 46, 22–39. [Google Scholar] [CrossRef]
  15. Basso, F.; D’Amours, S.; Rönnqvist, M.; Weintraub, A. A survey on obstacles and difficulties of practical implementation of horizontal collaboration in logistics. Int. Trans. Oper. Res. 2018, 26, 775–793. [Google Scholar] [CrossRef]
  16. Pan, S.; Trentesaux, D.; Ballot, E.; Huang, G.Q. Horizontal collaborative transport: Survey of solutions and practical implementation issues. Int. J. Prod. Res. 2019, 57, 5340–5361. [Google Scholar] [CrossRef]
  17. Ferrell, W.; Ellis, K.; Kaminsky, P.; Rainwater, C. Horizontal collaboration: Opportunities for improved logistics planning. Int. J. Prod. Res. 2019, 58, 4267–4284. [Google Scholar] [CrossRef]
  18. Guajardo, M.; Rönnqvist, M. A review on cost allocation methods in collaborative transportation. Int. Trans. Oper. Res. 2016, 23, 371–392. [Google Scholar] [CrossRef]
  19. Gansterer, M.; Hartl, R. Collaborative vehicle routing: A survey. Eur. J. Oper. Res. 2018, 268, 1–12. [Google Scholar] [CrossRef]
  20. Guajardo, M.; Rönnqvist, M.; Flisberg, P.; Frisk, M. Collaborative transportation with overlapping coalitions. Eur. J. Oper. Res. 2018, 271, 238–249. [Google Scholar] [CrossRef]
  21. Amaro, A.C.S.; Barbosa-Povoa, A.P.F.D. The effect of uncertainty on the optimal closed-loop supply chain planning under different partnerships structure. Comput. Chem. Eng. 2009, 33, 2144–2158. [Google Scholar] [CrossRef]
  22. Savaskan, R.C.; Bhattacharya, S.; Van Wassenhove, L.N. Closed-loop supply chain models with product remanufacturing. Manag. Sci. 2004, 50, 239–252. [Google Scholar] [CrossRef]
  23. Savaskan, R.C.; Van Wassenhove, L.N. Reverse channel design: The case of competing retailers. Manag. Sci. 2006, 52, 1–14. [Google Scholar] [CrossRef]
  24. Atasu, A.; Toktay, L.B.; Van Wassenhove, L.N. How collection cost structure drives a manufacturer’s reverse channel choice. Prod. Oper. Manag. 2013, 22, 1089–1102. [Google Scholar] [CrossRef]
  25. Chen, Y.J.; Sheu, J.-B. Environmental-regulation pricing strategies for green supply chain management. Transport. Res. E-Log. 2009, 45, 667–677. [Google Scholar] [CrossRef]
  26. Toyasaki, F.; Boyaci, T.; Verter, V. An analysis of monopolistic and competitive take-back schemes for WEEE recycling. Prod. Oper. Manag. 2011, 20, 805–823. [Google Scholar]
  27. Huang, M.; Song, M.; Lee, L.H.; Ching, W.K. Analysis for strategy of closed-loop supply chain with dual recycling channel. Int. J. Prod. Econ. 2013, 144, 510–520. [Google Scholar] [CrossRef]
  28. Pangburn, M.S.; Stavrulaki, E. Take back costs and product durability. Eur. J. Oper. Res. 2014, 238, 175–184. [Google Scholar] [CrossRef]
  29. Hong, X.; Xu, L.; Du, P.; Wang, W. Joint advertising, pricing and collection decisions in a closed-loop supply chain. Int. J. Prod. Econ. 2015, 167, 12–22. [Google Scholar] [CrossRef]
  30. Dutta, P.; Das, D.; Schultmann, F.; Fröhling, M. Design and planning of a closed-loop supply chain with three way recovery and buy-back offer. J. Clean. Prod. 2016, 135, 604–619. [Google Scholar] [CrossRef]
  31. Huang, Y.; Wang, Z. Closed-loop supply chain models with product take-back and hybrid remanufacturing under technology licensing. J. Clean. Prod. 2017, 142, 3917–3927. [Google Scholar] [CrossRef]
  32. Feng, D.; Yu, X.; Mao, Y.; Ding, Y.; Zhang, Y. Pricing decision for reverse logistics system under cross-competitive take-back mode based on game theory. Sustainability 2019, 11, 6984. [Google Scholar] [CrossRef]
  33. Pazoki, M.; Samarghandi, H. Take-back regulation: Remanufacturing or Eco-design. Int. J. Prod. Econ. 2020, 227, 107674. [Google Scholar] [CrossRef]
  34. Chang, X.; Xu, G.; Wang, Q.; Zhong, Y. A game theoretic approach for eco-design and remanufacturing considering take-back policy. Sustainability 2020, 12, 7174. [Google Scholar] [CrossRef]
  35. Xu, S.; Liu, H.; Xu, G. Selection of recycling channels and product eco-design with take-back regulation. Sustainability 2021, 13, 8961. [Google Scholar] [CrossRef]
  36. Lee, D.H.; Yoon, J.-C. Equilibrium decisions on pricing and the greenness degree in supply chains under single- and cross-distribution channels of green and non-green products and government subsidies. Math. Prob. Eng. 2022, 2022, 5525780. [Google Scholar] [CrossRef]
  37. Robinson, W.C. What is a government subsidy? Natl. Tax J. 1967, 20, 86–93. [Google Scholar] [CrossRef]
  38. Mitra, S.; Webster, S. Competition in remanufacturing and the effects of government subsidies. Int. J. Prod. Econ. 2008, 111, 287–298. [Google Scholar] [CrossRef]
  39. Sheu, J.-B. Bargaining framework for competitive green supply chains under governmental financial intervention. Transport. Res. E-Log. 2011, 47, 573–592. [Google Scholar] [CrossRef]
  40. Xiong, Y.; Zhou, Y.; Li, G.; Chan, H.-K.; Xiong, Z. Don’t forget your supplier when remanufacturing. Eur. J. Oper. Res. 2013, 230, 15–25. [Google Scholar] [CrossRef]
  41. Wang, Y.; Chang, X.; Chen, Z.; Zhong, Y.; Fan, T. Impact of subsidy policies on recycling and remanufacturing using system dynamics methodology: A case of auto parts in China. J. Clean. Prod. 2014, 74, 161–171. [Google Scholar] [CrossRef]
  42. Hu, S.; Dai, Y.; Ma, Z.J.; Ye, Y.S. Designing contracts for a reverse supply chain with strategic recycling behavior of consumers. Int. J. Prod. Econ. 2016, 180, 16–24. [Google Scholar] [CrossRef]
  43. Han, X.; Yang, Q.; Shang, J.; Pu, X. Optimal strategies for trade-old-for-remanufactured programs: Receptivity, durability, and subsidy. Int. J. Prod. Econ. 2017, 193, 602–616. [Google Scholar] [CrossRef]
  44. Jena, S.K.; Ghadge, A.; Sarmah, S.P. Managing channel profit and total surplus in a closed-loop supply chain network. J. Oper. Res. Soc. 2018, 69, 1345–1356. [Google Scholar] [CrossRef]
  45. He, P.; He, Y.; Xu, H. Channel structure and pricing in a dual-channel closed-loop supply chain with government subsidy. Int. J. Prod. Econ. 2019, 213, 108–123. [Google Scholar] [CrossRef]
  46. Wang, Z.; Huo, J.; Duan, Y. Impact of government subsidies on pricing strategies in reverse supply chains of waste electrical and electronic equipment. Waste Manag. 2019, 95, 440–449. [Google Scholar] [CrossRef]
  47. Zhang, L.; Zhang, Z. Dynamic analysis of the decision of authorized remanufacturing supply chain affected by government subsidies under cap-and-trade policies. Chos Solit. Fractals 2022, 160, 112237. [Google Scholar] [CrossRef]
  48. Liu, K.; Li, Q.; Zhang, H. Analysis of the impact of remanufacturing process innovation on closed-loop supply chain from the perspective of government subsidy. Sustainability 2022, 14, 11333. [Google Scholar] [CrossRef]
  49. Ke, G.Y.; Bookbinder, J.H.; Kilgour, D.M. Coordination of transportation and quantity discount decisions, with coalition formation. Int. J. Oper. Res. 2014, 52, 5115–5130. [Google Scholar] [CrossRef]
  50. Mohebbi, S.; Li, X. Coalitional game theory approach to modeling suppliers’ collaboration in supply networks. Int. J. Prod. Econ. 2015, 169, 333–342. [Google Scholar] [CrossRef]
  51. Ma, Z.-J.; Zhang, N.; Dai, Y.; Hu, S. Managing channel profits of different cooperative models in closed-loop supply chains. Omega 2016, 59, 251–262. [Google Scholar]
  52. Jouida, S.B.; Krichen, S.; Klibi, W. Coalition-formation problem for sourcing contract design in supply networks. Eur. J. Oper. Res. 2017, 257, 539–558. [Google Scholar] [CrossRef]
  53. Alamdar, S.F.; Rabbani, M.; Heydari, J. Pricing, collection, and effort decisions with coordination contracts in a fuzzy, three-level closed-loop supply chain. Expert Syst. Appl. 2018, 104, 261–276. [Google Scholar] [CrossRef]
  54. Zheng, Q.; Zhou, L.; Fan, T.; Ieromonachou, P. Joint procurement and pricing of fresh produce for multiple retailers with a quantity discount contract. Transport. Res. E-Log. 2019, 130, 16–36. [Google Scholar] [CrossRef]
  55. Tian, F.; Sošić, G.; Debo, L. Stable recycling networks under the extended producer responsibility. Eur. J. Oper. Res. 2020, 287, 989–1002. [Google Scholar] [CrossRef]
  56. Kuo, C.-W.; Chen, C.B.; Chen, C.; Yang, Y.-Y. Formulating cross-sector horizontal coalition strategies for multi-product assembly systems with a common component. Comput. Ind. Eng. 2021, 159, 107399. [Google Scholar] [CrossRef]
  57. Asghari, T.; Taleizadeh, A.A.; Jolai, F.; Moshtagh, M.S. Cooperative game for coordination of a green closed-loop supply chain. J. Clean. Prod. 2022, 363, 132371. [Google Scholar] [CrossRef]
  58. Zhong, H.; Huo, H.; Zhang, X.; Zheng, S. Sustainable decision-making in a low-carbon supply chain: Fairness preferences and green investment. IEEE Access. 2022, 10, 48761–48777. [Google Scholar] [CrossRef]
  59. Madzík, P.; Falát, L.; Zimon, D. Supply chain research overview from the early eighties to Covid era—Big data approach based on Latent Dirichlet Allocation. Comput. Ind. Eng. 2023, 183, 109520. [Google Scholar] [CrossRef]
  60. Debo, L.G.; Toktay, L.B.; Van Wassenhove, L.N. Market segmentation and product technology selection for remanufacturable products. Manag. Sci. 2005, 51, 1193–1205. [Google Scholar] [CrossRef]
  61. Ferguson, M.E.; Toktay, L.B. The effect of competition on recovery strategies. Prod. Oper. Manag. 2006, 15, 351–368. [Google Scholar] [CrossRef]
  62. Pazoki, M.; Zaccour, G. A mechanism to promote product recovery and environmental performance. Eur. J. Oper. Res. 2019, 274, 601–614. [Google Scholar] [CrossRef]
Figure 1. Configuration of the closed-loop supply chain considered in this study.
Processes 11 03132 g001
Figure 2. Equilibrium decisions vs. λ in Models TO and TS.
Processes 11 03132 g002
Figure 3. Environmental impact and social welfare vs. λ in Models TO and TS.
Processes 11 03132 g003
Figure 4. Equilibrium decisions vs. λ in Models TS and TSC.
Processes 11 03132 g004
Figure 5. Environmental impact and social welfare vs. λ in Models TS and TSC.
Processes 11 03132 g005
Table 1. Notations.
Table 1. Notations.
ParametersDescriptions
α Acquisition efficiency
β Acceptability of remanufactured product
λ Cost coefficient of the environmental damage of landfills
Decision variablesDescriptions
f Licensing fee per unit of used product
k Take-back penalty per unit of uncollected product
q a Quantity of collected products
q n Quantity of new products
q r Quantity of remanufactured products
s Subsidy per unit of remanufactured product
w Wholesale price
FunctionsDescriptions
p n Selling price of a new product
p r Selling price of a remanufactured product
π m Manufacturer’s profit
π r Retailer’s profit
π 3 Remanufacturer’s profit
π t Sum of retailer’s and remanufacturer’s profits
π s c Supply chain profit
C S Consumer surplus
E I Total environmental impact cost
S W Social welfare
Note: All decision variables and functions are non-negative.
Table 2. Effects of λ on equilibrium decisions in Models TO and TS.
Models k l s l w l f l q a l q r l q n l p r l p n l
l = T O N/A
l = T S
Note: , , and indicate results that increase, decrease, and remain unchanged, respectively.
Table 3. Effects of λ on equilibrium decisions in Models TSC.
kTSCsTSCwTSCfTSC q a T S C q r T S C q n T S C p r T S C p n T S C
Note: and indicate results that increase and decrease, respectively.
Disclaimer/Publisher’s Note: The statements, opinions and data contained in all publications are solely those of the individual author(s) and contributor(s) and not of MDPI and/or the editor(s). MDPI and/or the editor(s) disclaim responsibility for any injury to people or property resulting from any ideas, methods, instructions or products referred to in the content.

