Article

Deep Neural Network Model for Determination of Coal Cutting Resistance and Performance of Bucket-Wheel Excavator Based on the Environmental Properties and Excavation Parameters

1
Jaroslav Černi Water Institute, Jaroslava Černog 80, 11226 Belgrade, Serbia
2
Faculty of Technical Sciences, University of Novi Sad, Trg Dositeja Obradovića 6, 21000 Novi Sad, Serbia
3
The Institute for Artificial Intelligence Research and Development of Serbia, Fruškogorska 1, 21000 Novi Sad, Serbia
4
Faculty of Mining, University of Banja Luka, Aleja Kozarskog Odreda 1, 79101 Prijedor, Bosnia and Herzegovina
*
Author to whom correspondence should be addressed.
Processes 2023, 11(11), 3067; https://doi.org/10.3390/pr11113067
Submission received: 18 September 2023 / Revised: 18 October 2023 / Accepted: 24 October 2023 / Published: 26 October 2023
(This article belongs to the Special Issue Coal Mining and Unconventional Oil Exploration)

Abstract

:
In the present paper, we develop a new model, based on the implementation of deep neural networks, for the estimation of a series of excavation parameters, depending on the main environmental and excavation properties. The developed model, with high statistical accuracy (R > 0.79) and small RMSE (<17% of the actual output values), enables the simultaneous assessment of the following excavation parameters: effective capacity Qef, maximum current consumption Imax, maximum power consumption Nmax, maximum force consumption Pmax, maximum energy consumption Emax, and maximum linear and areal cutting resistance, KLmax and KFmax, respectively, based on the impact of the following environmental properties and excavation parameters: coal unit weight, coal compression strength, coal cohesion, friction angle, excavator movement angle in the left and right direction, slice height and thickness, and wheel velocity. The data analyzed in the present paper were previously collected from three neighboring open-pit coal mines in Serbia: Tamnava Western Field, Tamnava Eastern Field, and Field D. These mines have similar geological conditions and coal properties. Additionally, for each output factor, a complex analysis is provided on the impact of the examined input factors, by applying the multiple linear regression method. As far as we are aware, this is the first time such a comprehensive estimation model has been suggested for the operation of a bucket-wheel excavator in the Neogene coal basins. The deep neural network (DNN) model, trained over 300 epochs, shows an MSE range of 6.7–16.5% across various input factors, with distinct evaluations for Imax due to its unique values (4.8–12.5%).

1. Introduction

For decades, coal exploitation has been representing the main energy source for most countries worldwide. According to Gordon [1], Poland, the United States, the USSR, the United Kingdom, and Germany were the top five global coal-producing countries from 1900 to 1984. In these countries, coal production was the backbone of the industry development, i.e., coal was the source that accounted for the highest share in electricity production in these and many other countries throughout the world. This reliance on coal as the major source of electricity production reached its peak in 1990. When the calls for more strict environmental protection increased, many countries started to abandon this energy source and turned to more “clean” sources, like wind power, solar power, and hydropower, as the so-called green sources of energy. Around 40% of electricity was produced by consuming coal in 1990, while this number declined to 30% in 2022 worldwide [2,3,4]. In Germany, for instance, this number is even more pronounced: electricity production from coal declined from 60% to 30% from 1990 to 2022. Also, in Poland, more than 95% of electricity production came from coal in 1990, while this number dropped to 70% in 2022. Probably the best illustration of this coal abandonment process is the one in the United Kingdom [5]. In the UK, coal production peaked in 1913, when it was produced approximately 292 million tons of coal, while in 2019, it was 150 times lower. Moreover, deep-mine coal production was completely abandoned until 2019. The number of employees in the coal production sector dropped from 1.2 million in the 1920s to approximately 600 thousand in 2019. The use of coal also drastically changed. Earlier, coal was commonly used in industry, railways, gas production, and heating in homes, while today it is only used for electricity production. In the end, coal was the primary energy source for a long time: 1900′s coal supplied more than 95% of the demand; in the 1950s, this number was still above 90%, while in 2019, coal supplied only 3% of the energy demand.
Although there is a strong will and commitment among the top developed countries in the world to increase the participation of these green energy sources in total energy production, the corresponding infrastructure is still underdeveloped, and, in many cases, it is more expensive than the continuation of the coal excavation process, using the existing infrastructure, even in the case when more strict environmental measures are applied. Adding to this the current crisis with the supplement of coal/oil/gas, one can conclude that for now (and at least in the near future) countries need to maintain the coal excavation process and, in such a way, preserve, more or less, a sort of energy independence. Today, ten countries, namely, China, the USA, India, Poland, South Africa, Indonesia, Australia, Germany, Russia, and Kazakhstan, have an annual coal production of more than 100 Mt, i.e., approximately 95% of the overall coal production in the world. Half of this world production comes from China, which is accounted as the country with the highest coal production [6]. In Serbia, surface coal mining still represents the dominant method of coal exploitation. Excavated coal is further processed at thermal power plants, which provide approximately 70% of total electricity production in Serbia [7].
Concerning the current importance of coal excavation and its possible negative effects on the environment, it is of paramount importance to plan and execute coal exploitation in the most optimized way, to perform the excavation as quickly as possible, which will secure the on-time electricity production, and keep the exposure of the environment to the by-products of coal exploitation at the minimum level. There have been several previous attempts to optimize the coal excavation process using the bucket-wheel excavator. A previous fatigue study conducted by Andras et al. [8] used a computer model of the boom of a bucket-wheel excavator developed in SolidWorks. Based on this model, they estimated the period to material failure to reduce the hazard to any form of surface mining activities or the work of any industrial machine. Jiang et al. [9] analyzed the resistance to cutting by invoking the discrete element method and experimental design. The results of their research indicate that the resistance to cutting would decrease as the grain size and cutting velocity increase. The results of their study also indicate that the increasing cohesion among particles can have a positive effect on the resistance to cutting by adding the cohesive force between particles, or it can reduce the resistance by lowering the particle volume fraction through the so-called “big aggregates effect”. Popescu et al. [10] analyzed the reaction time of the excavator during the excavation process. In particular, they examined the response of an excavator boom exposed to non-stationary force, by using the virtual model of a boom. The results of their research indicate that wheel velocity and the number of buckets significantly affect the high and slowly varying forces generated during the coal excavation process. Sowala et al. [11] examined how the choice of excavation parameters at the open-pit lignite mine is affected by the maneuvering movements of the excavator when the stabilized front is cleared out of the coal overburden. The results of their research show that the length of maneuvering roads is a more significant factor than the floor height in the case of excavation with both variable vertical and horizontal divisions. Machniak and Koziol [12] analyzed the mining process of solid rocks using bucket-wheel excavators. They proposed a new method for estimating the workability of solid rocks, in the form of a complex relationship of breaking by tractor rippers and rock compressive strength, velocity of seismic waves, rock density, and the workability classification according to Bulukbasi [13]. Che and Chen [14] provided a theoretical analysis of bucket-wheel excavator production. The results of their study emphasize the need for adequate adjustment of the speed of the bucket-wheel excavator. In fast excavation, a nonuniform distribution of material flow occurs, which further causes a decrease in capacity utilization leading eventually to an unreliable inference between structure and performance parameters. Additionally, the excessive rotary speed of the excavator body will cause an increase in the excavator power consumption, drive power, cost of extraction, and mechanical strength required. Regarding the use of artificial intelligence-based methods for the performance optimization of machines in general, Xiang et al. [15] used deep learning algorithms to enhance the performance of machine regeneration, by invoking deep neural networks, convolutional neural networks, and recurrent neural networks. Also, Xiang et al. [16] apply the same approach to the on-site training of mobile construction machines. Nevertheless, as far as we know, there have been no previous attempts to develop a suitable model for the optimization of the bucket-wheel excavator performance based on the deep neural network approach.
In our previous papers, we evaluated the overburden cutting resistance and energy consumption and suggested the method for the optimization of the coal overburden excavation, which also takes into account the geomechanical properties of the terrain and states of the excavator’s teeth. In particular, we examine the impact of the overburden geomechanical properties on the excavation parameters (wheel velocity and current consumption) for two different states of excavator’s teeth: new and worn-out teeth after a minimum of 250 h of work [17]. According to the results of this study, there are statistically significant two-factor interactions with the increasing influence of overburden friction angle and unit weight on excavator current consumption and wheel velocity. On the other side, overburden cohesion is generally inversely proportional to the examined parameters of the excavation process. In contrast to our previous research. here we examine the case of coal excavation, with the following input factors: (1) coal properties: unit weight, compressive strength, cohesion, and friction angle; and (2) excavation parameters: excavation direction, slice height and thickness, and wheel velocity. The effect of these input factors is examined for the following output parameters: excavator capacity, maximum current consumption, maximum power consumption, maximum force consumption, maximum energy consumption, and maximum linear and areal cutting resistance. The influence of each of the input factors on the chosen output factors is thoroughly examined, including the significant two-factor interactions. The dependence of each analyzed output factor on the examined input factors is represented in the form of an explicit mathematical model. As a result, we suggest a unique artificial intelligence-based model, which enables the reliable estimation of the output factors, based on the value of one or several chosen input variables.

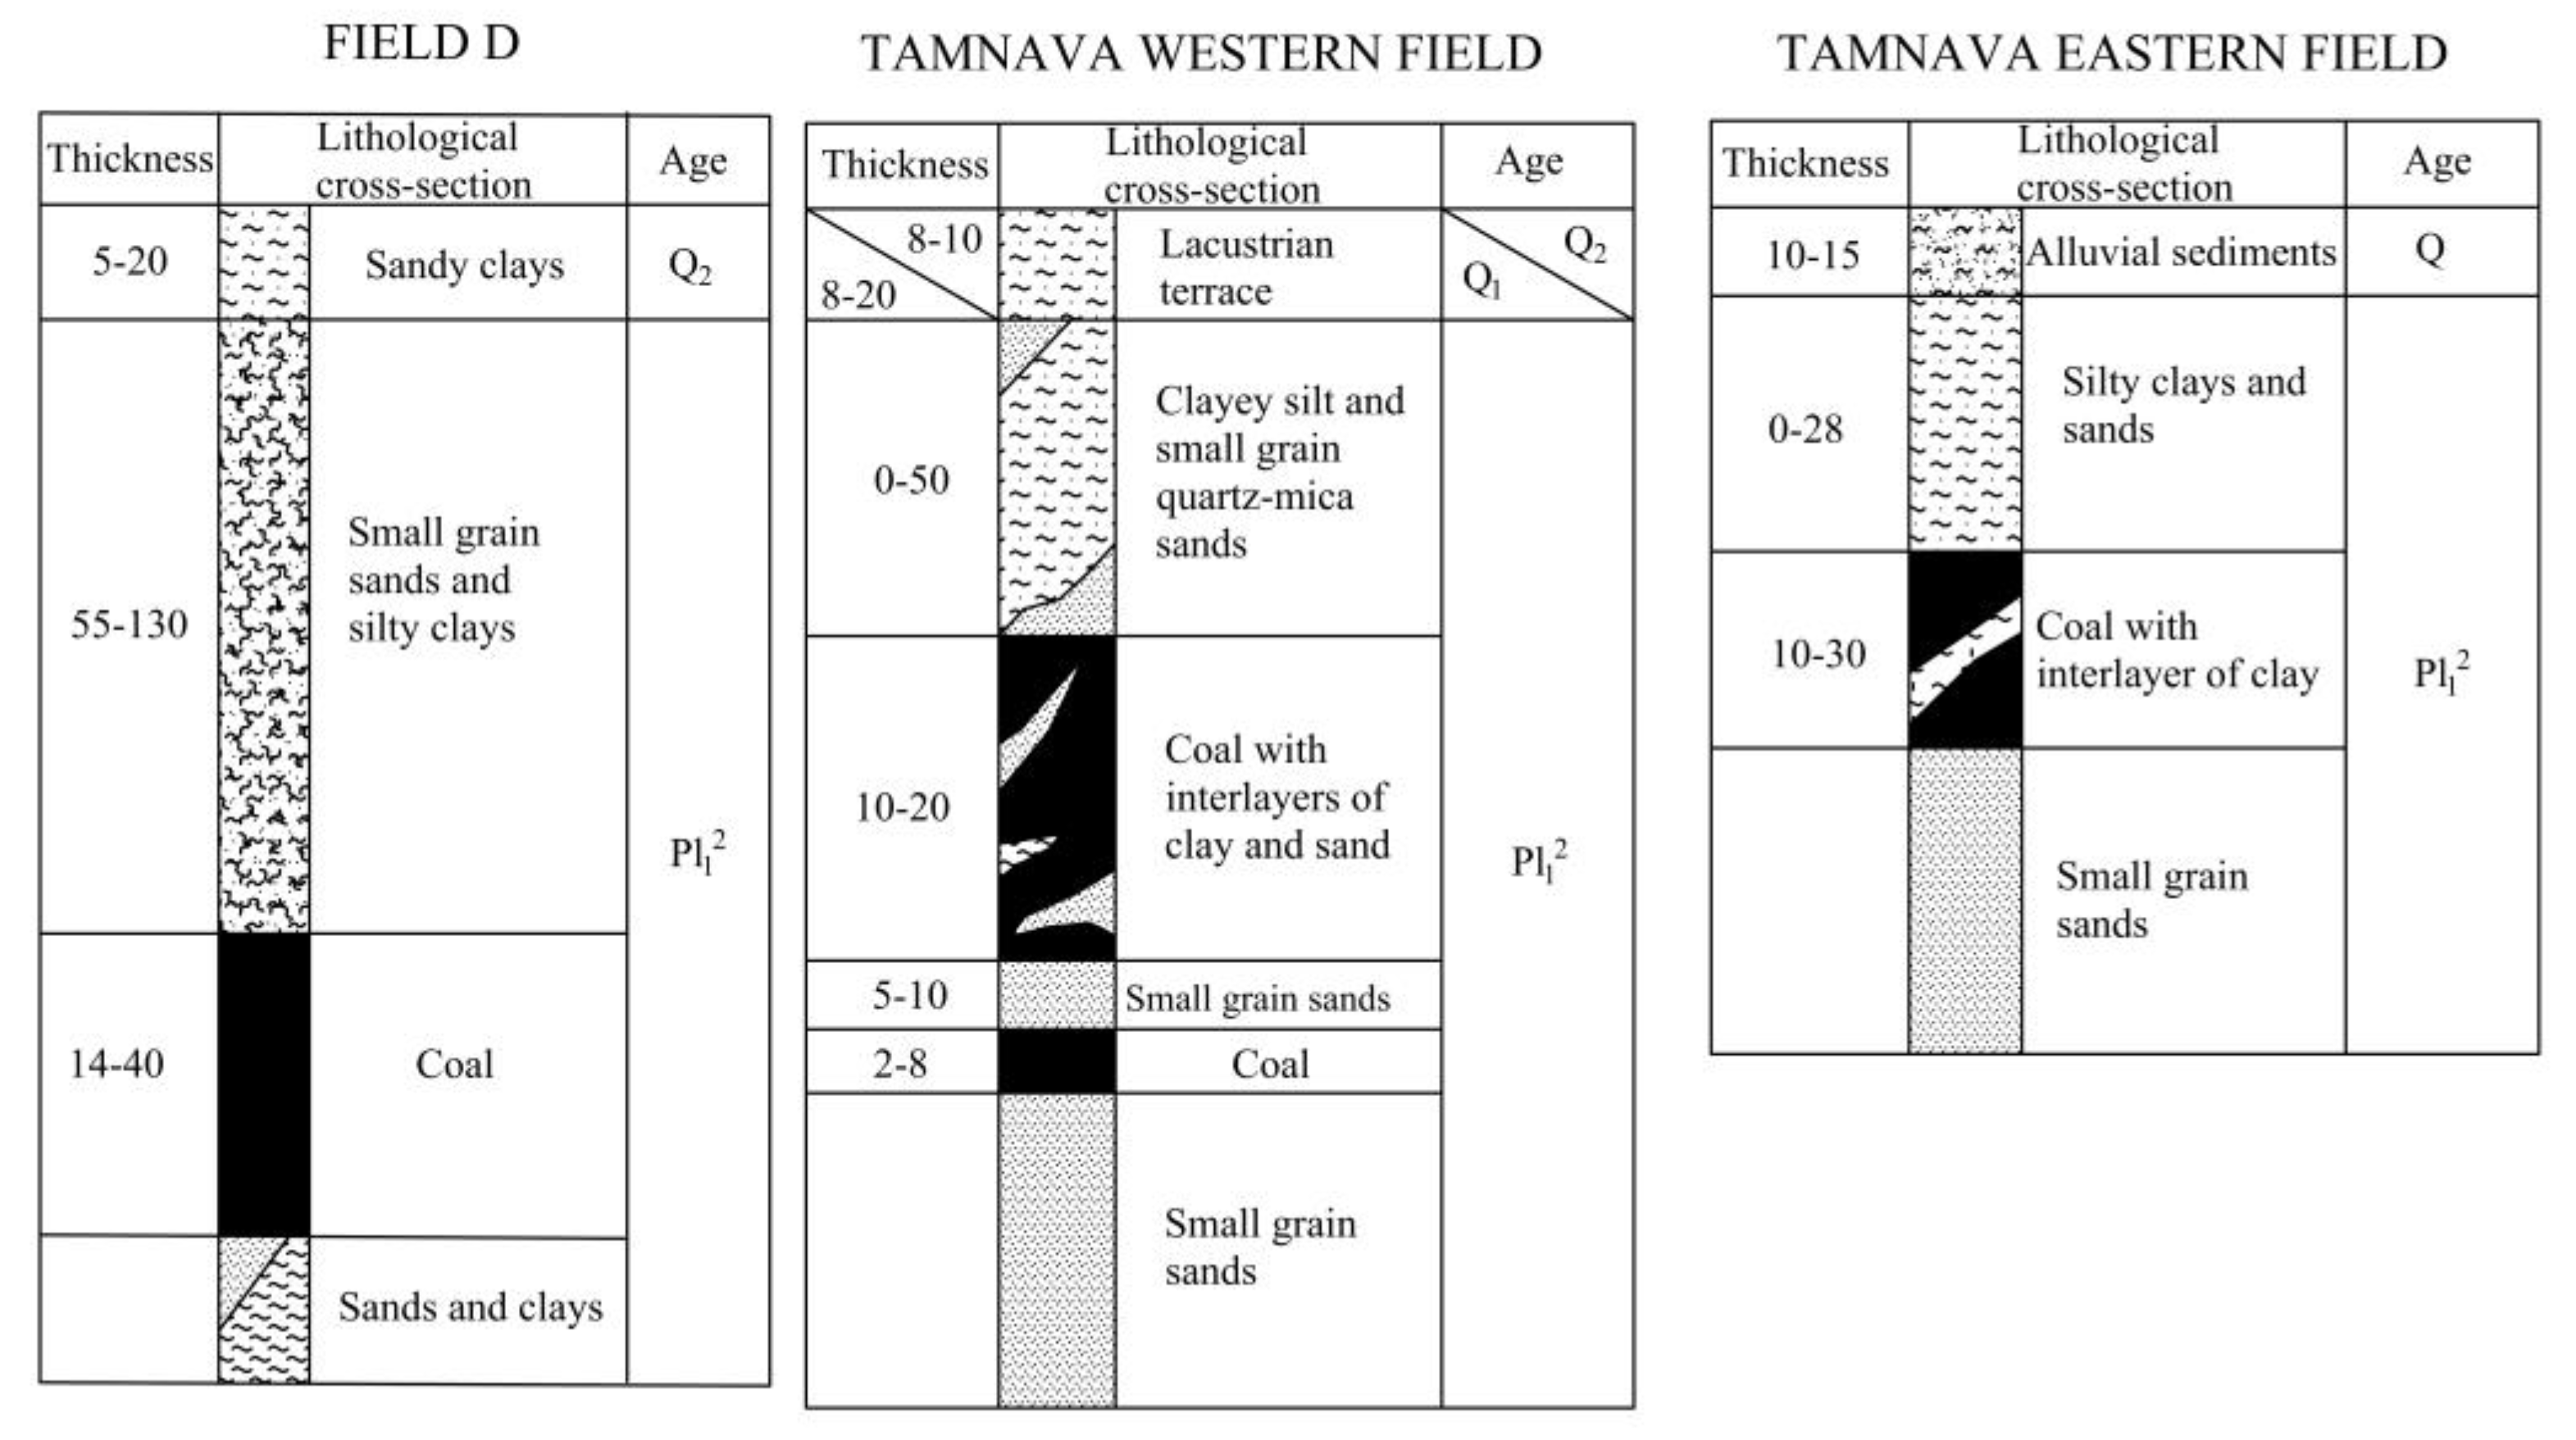
2. Methodology and Data Analyzed

We analyze a dataset of 198 recordings made at different open-pit coal mines in Serbia: Tamnava Eastern Field, Tamnava Western Field, and Field D, which all belong to the Kolubara coal mine in Serbia (Figure 1).
Coal properties at all three locations are the same or similar (coal is of the same origin, and with similar petrological and geomechanical properties), so it was possible to examine the whole dataset as unique data.
The Kolubara coal basin consists of a productive Neogene series lying on a paleo-relief of Paleozoic crystalline shale and Mesozoic sediments breached by dacite-andesitic eruptions of Tertiary age [18]. The productive series of lignite is grouped in three thick layers and several thinner layers, located in the lower part of the series. Both the overlaying and underlying parts of the coal series are composed of the sediments of the upper Pontian age, except in the parts where erosion has carried away the overlaying part. Upper Pontian sediments in the basin are developed in the facies of clay, sandy, and silty clays and sands, which alternate in the vertical and lateral directions. These sediments are with the predominant clay fraction in the eastern part of the basin and with the predominant sand fraction in the western part. The Quaternary formations lie over Pontian sediments with an erosional-tectonic or erosional discordance. Pleistocene silts with layers and lenses of lacustrine-terrace gravels and sands compose a larger part of the terrain, while Quaternary alluvial gravel–sand sediments compose the river valleys.
At Field D, the main layer is excavated, while the sub-layer, recorded in the eastern part of the field, has no exploitable thickness [18]. The thickness of the main layer is 14–40 m and in the southeastern part of the field it lies on clays, while in the rest, the larger part, it lies on sands of different grain sizes. In the overlaying part, there are thick deposits of fine grain to silty sands and silty clays, which are covered by Quaternary clays (Figure 2).
At the Tamnava Eastern Field, the underlying layer of the coal seam is composed of 100 m thick sand (Figure 2). The main coal layer is above the sand, with a coal thickness of about 10–30 m. In the northwestern part of the terrain, this coal seam contains layers of 2–7 m thick sand. The overlaying layer is composed of silty clay with occurrences of lenses of fine-grained sands up to 28 m thick. The strong effect of erosion carried away part of the Pliocene sediments, so that the Kolubara alluvium rests partly on the Pliocene sediments and partly on coal. Alluvial gravels and sands with silt reach a thickness of up to 15 m [18].
At the Tamnava Western Field, the underlaying layer is also made of fine-grain sand. The coal series has a complex composition: two thinner coal layers corresponding to the third coal layer (continuity not confirmed) were developed in the lower part, followed by the second 2–8 m thick coal layer and the first 10–20 m thick coal layer. Between the coal layers are fine-grain sands, very similar to the underlying sands. In the first coal layer, there are interlayers of clay, and rarely are there interlayers or lenses of sand. In the overlaying part of the first coal layer, there are silty clays and, to a lesser extent, silty quartz sands. In the southern part of the field, the Pliocene sediments are covered with lacustrine-terrace gravels. In the northeastern part, in the Kladnica River valley, the Pliocene sediments are covered by alluvial gravels, sands, and silts up to 10 m thick.
The main properties of the input and output data are presented in Table 1, according to [18].
Data were collected [18] for the case of coal excavation with bucket-wheel excavators of the same type, SchRs630, with the following main properties:
  • Installed power for rotary wheel engine: 2 × 500 kW (at Tamnava Western Field) and 2 × 375 kW (at Tamnava Eastern Field and Field D)
  • Bucket volume: 630 L
  • Number of buckets: 20
  • Number of buckets emptied: 162 per min
  • Angular distance between buckets: 18°
  • Rotary wheel diameter: 10 m
  • Length of rotary arrow: 35 m
  • Wheel velocity: 4.24 m/s
All output factors, except KLmax and KFmax, were measured at the excavator. KLmax and KFmax were determined in laboratory conditions with the Orenstein and Koppel cut test. Coal unit weight, compressive strength, cohesion, and friction angle were determined in the laboratory, while φL, φD, h, s, and Vb were set on the excavator.
The effect of the chosen input (controlling) factors on the output factors was examined in two phases. In the first phase, we invoke the multiple linear regression method and derive separate mathematical expressions for the dependence of each singular output factor on the examined controlling factors. The results of these analyses are evaluated using basic statistical parameters and the ANOVA test. In the second phase of the research, we develop a single model based on artificial neural networks, which enables the estimation of multiple output factors based on the significant impact of the controlling parameters.
Regarding the development of the deep neural network (DNN) model, the dataset consists of 198 measurements of 16 variables, of which 9 variables represent the input to the model, i.e., the parameters based on which the prediction is made, as shown in Table 1. Given that the dataset consists of variables expressed in different units, with each variable moving in its range, before training the model, it is necessary to determine the minimum and maximum values for each variable, and then, based on these values, the values are normalized to the range [0,1]. Before training the model from the data, 20% of the total dataset is set aside for testing. The remaining dataset is then split into 80% data used to train the network and 20% data to be used for validation during training.
There are 9 input factors for the developed DNN model. It contains three hidden layers, while the output of the model is in the form of a vector of 7 values (Figure 3). The three-layer DNN architecture is designed to capture a hierarchical representation of features within datasets. The first, second, and third hidden layers contain 256, 128, and 64 nodes, with sigmoid activation. After the first layer, a drop probability of 0.25 is applied, and after the second layer, a drop probability of 0.1 is used. The Adam optimizer is used during training, and the loss function is the mean square error (MSE) function. There were 300 epochs of training, with the following parameters:
  • Parameter ReduceLROnPlateau, which reduces the learning rate if no accuracy on the validation dataset is improved for 35 epochs.
  • Parameter EarlyStopping, which interrupts training if no accuracy is improved on the validation dataset for 45 epochs.
The model was developed with a desktop PC with an Intel Core i9-9900K 3.60 Ghz CPU, 32 GB RAM, and an Nvidia GeForce RTX 2070 GPU.

3. Dependence of Each Output Factor on Controlling Parameters

3.1. Performance of Bucket-Wheel Excavator

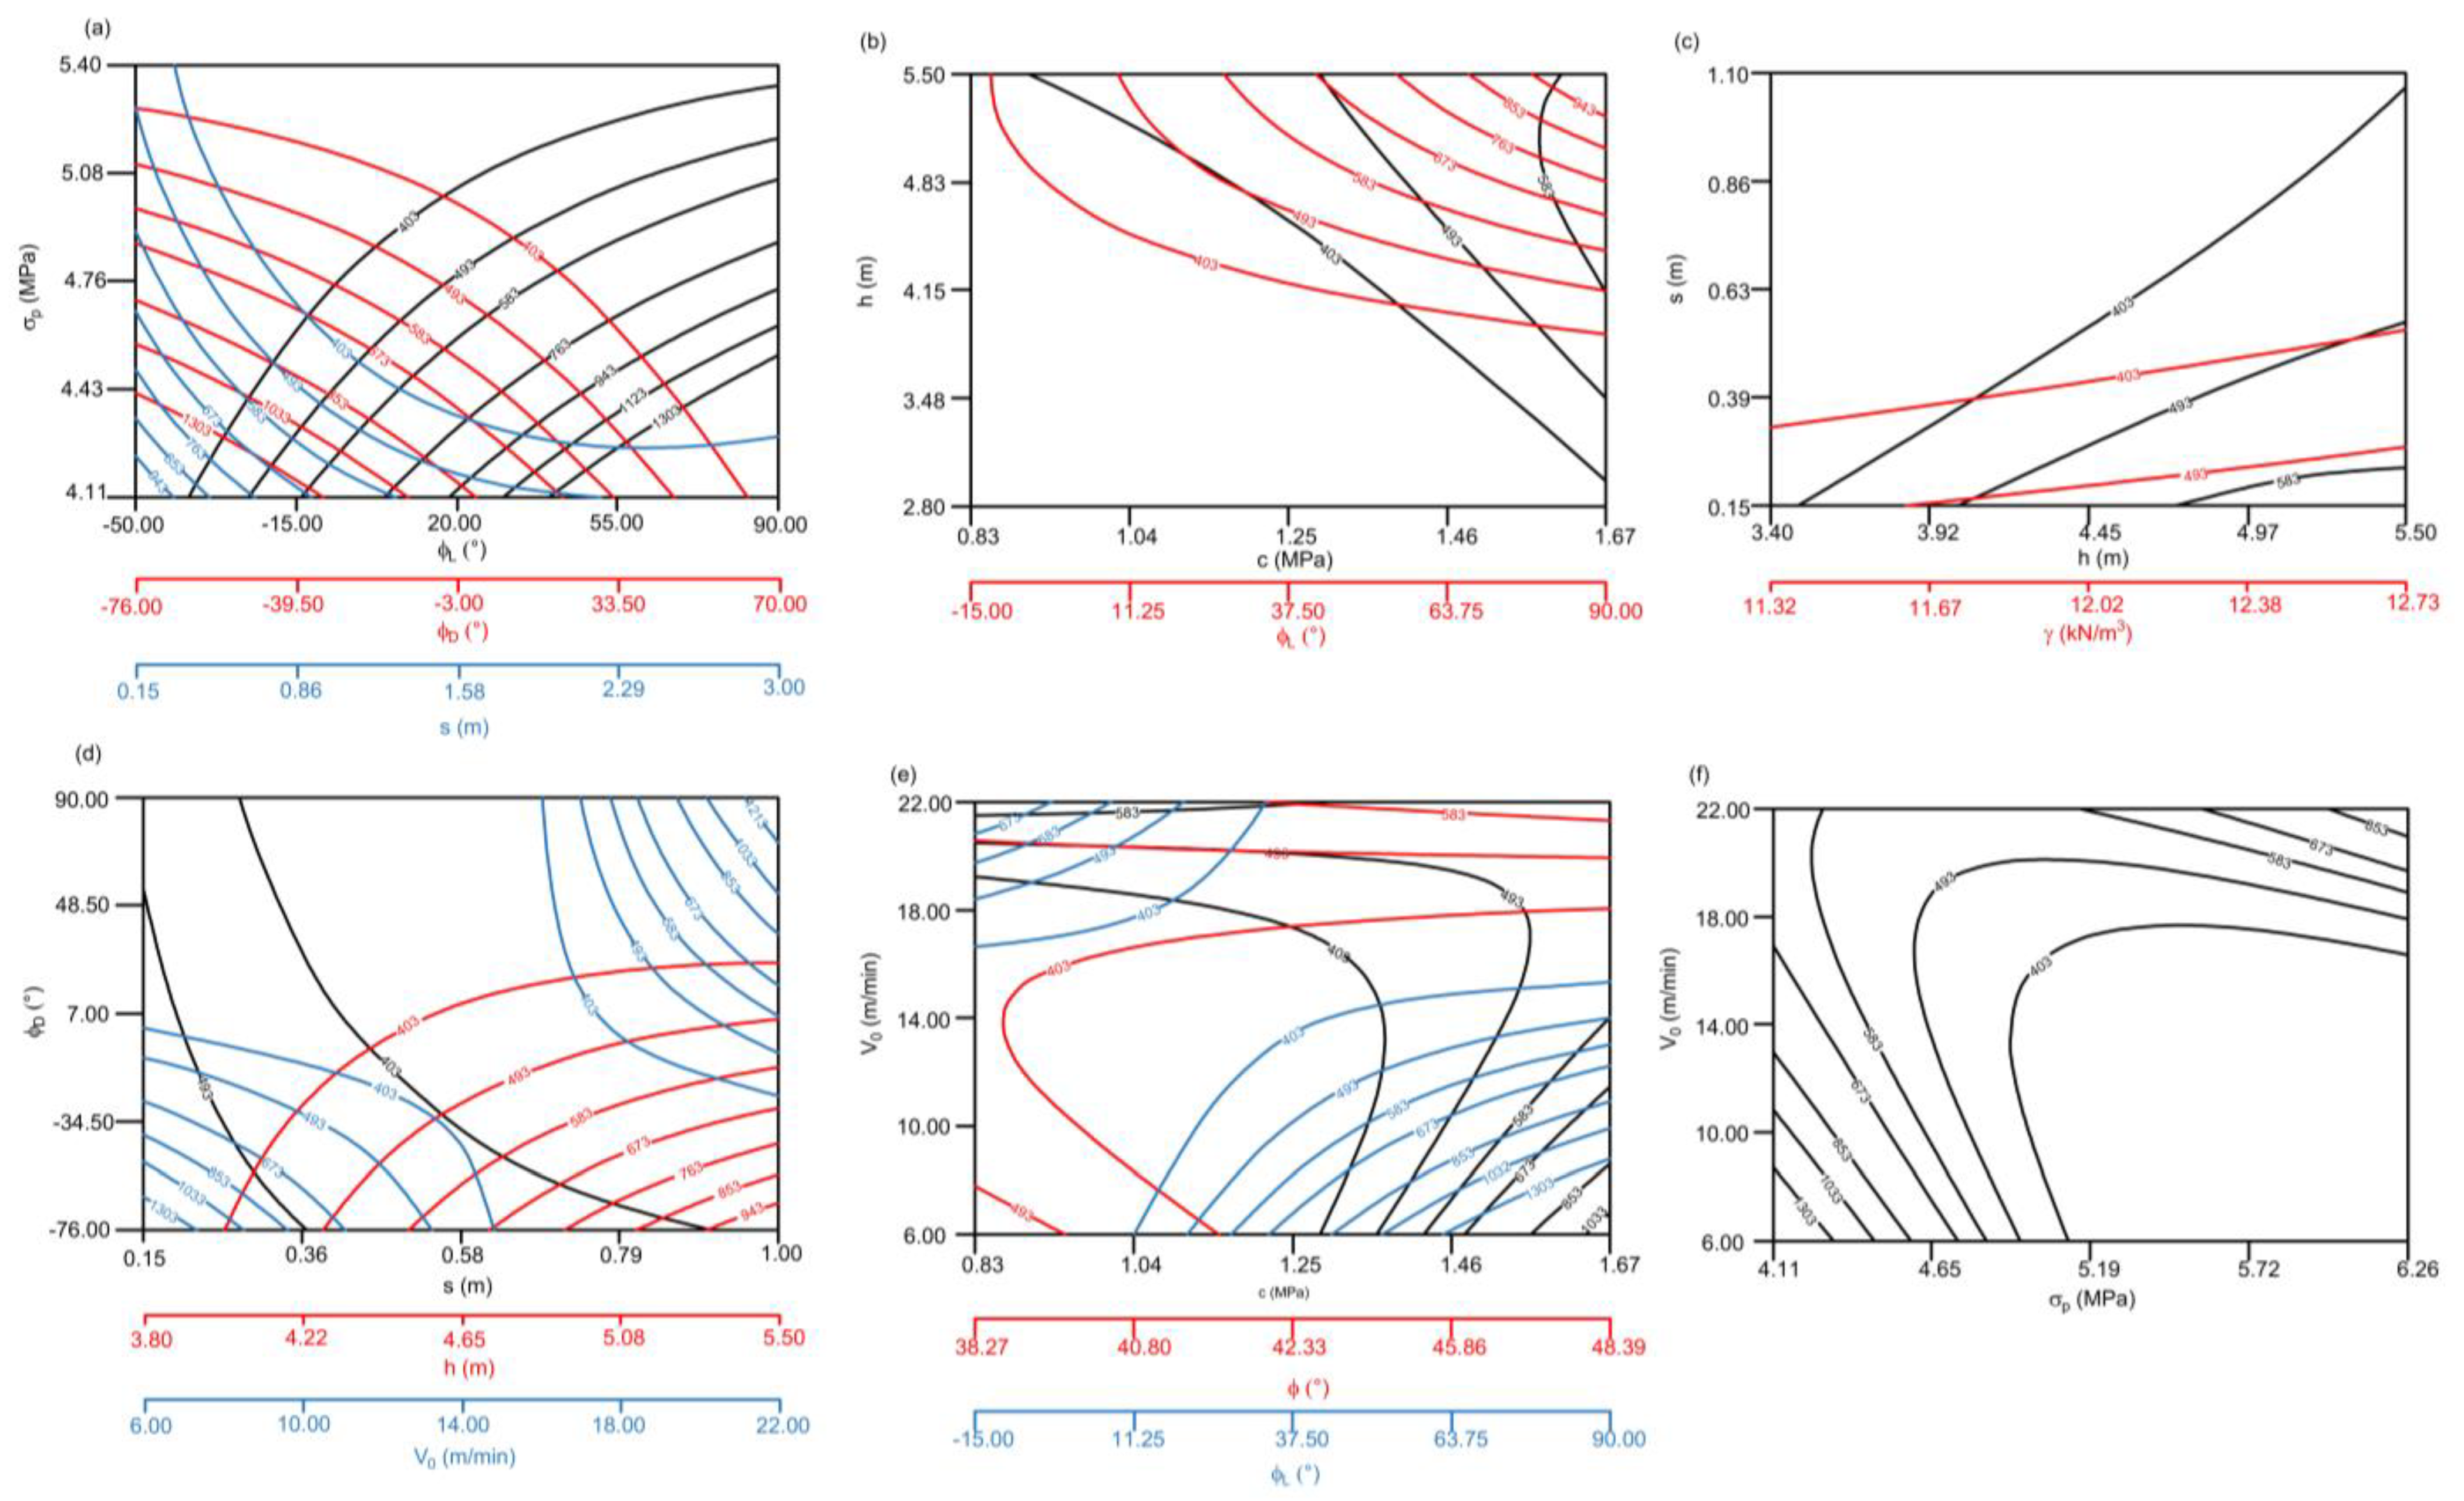
3.1.1. Excavator Capacity Qef

The performed statistical analysis indicates that several two-factor interactions have statistically significant effects on Qef (Figure 4):
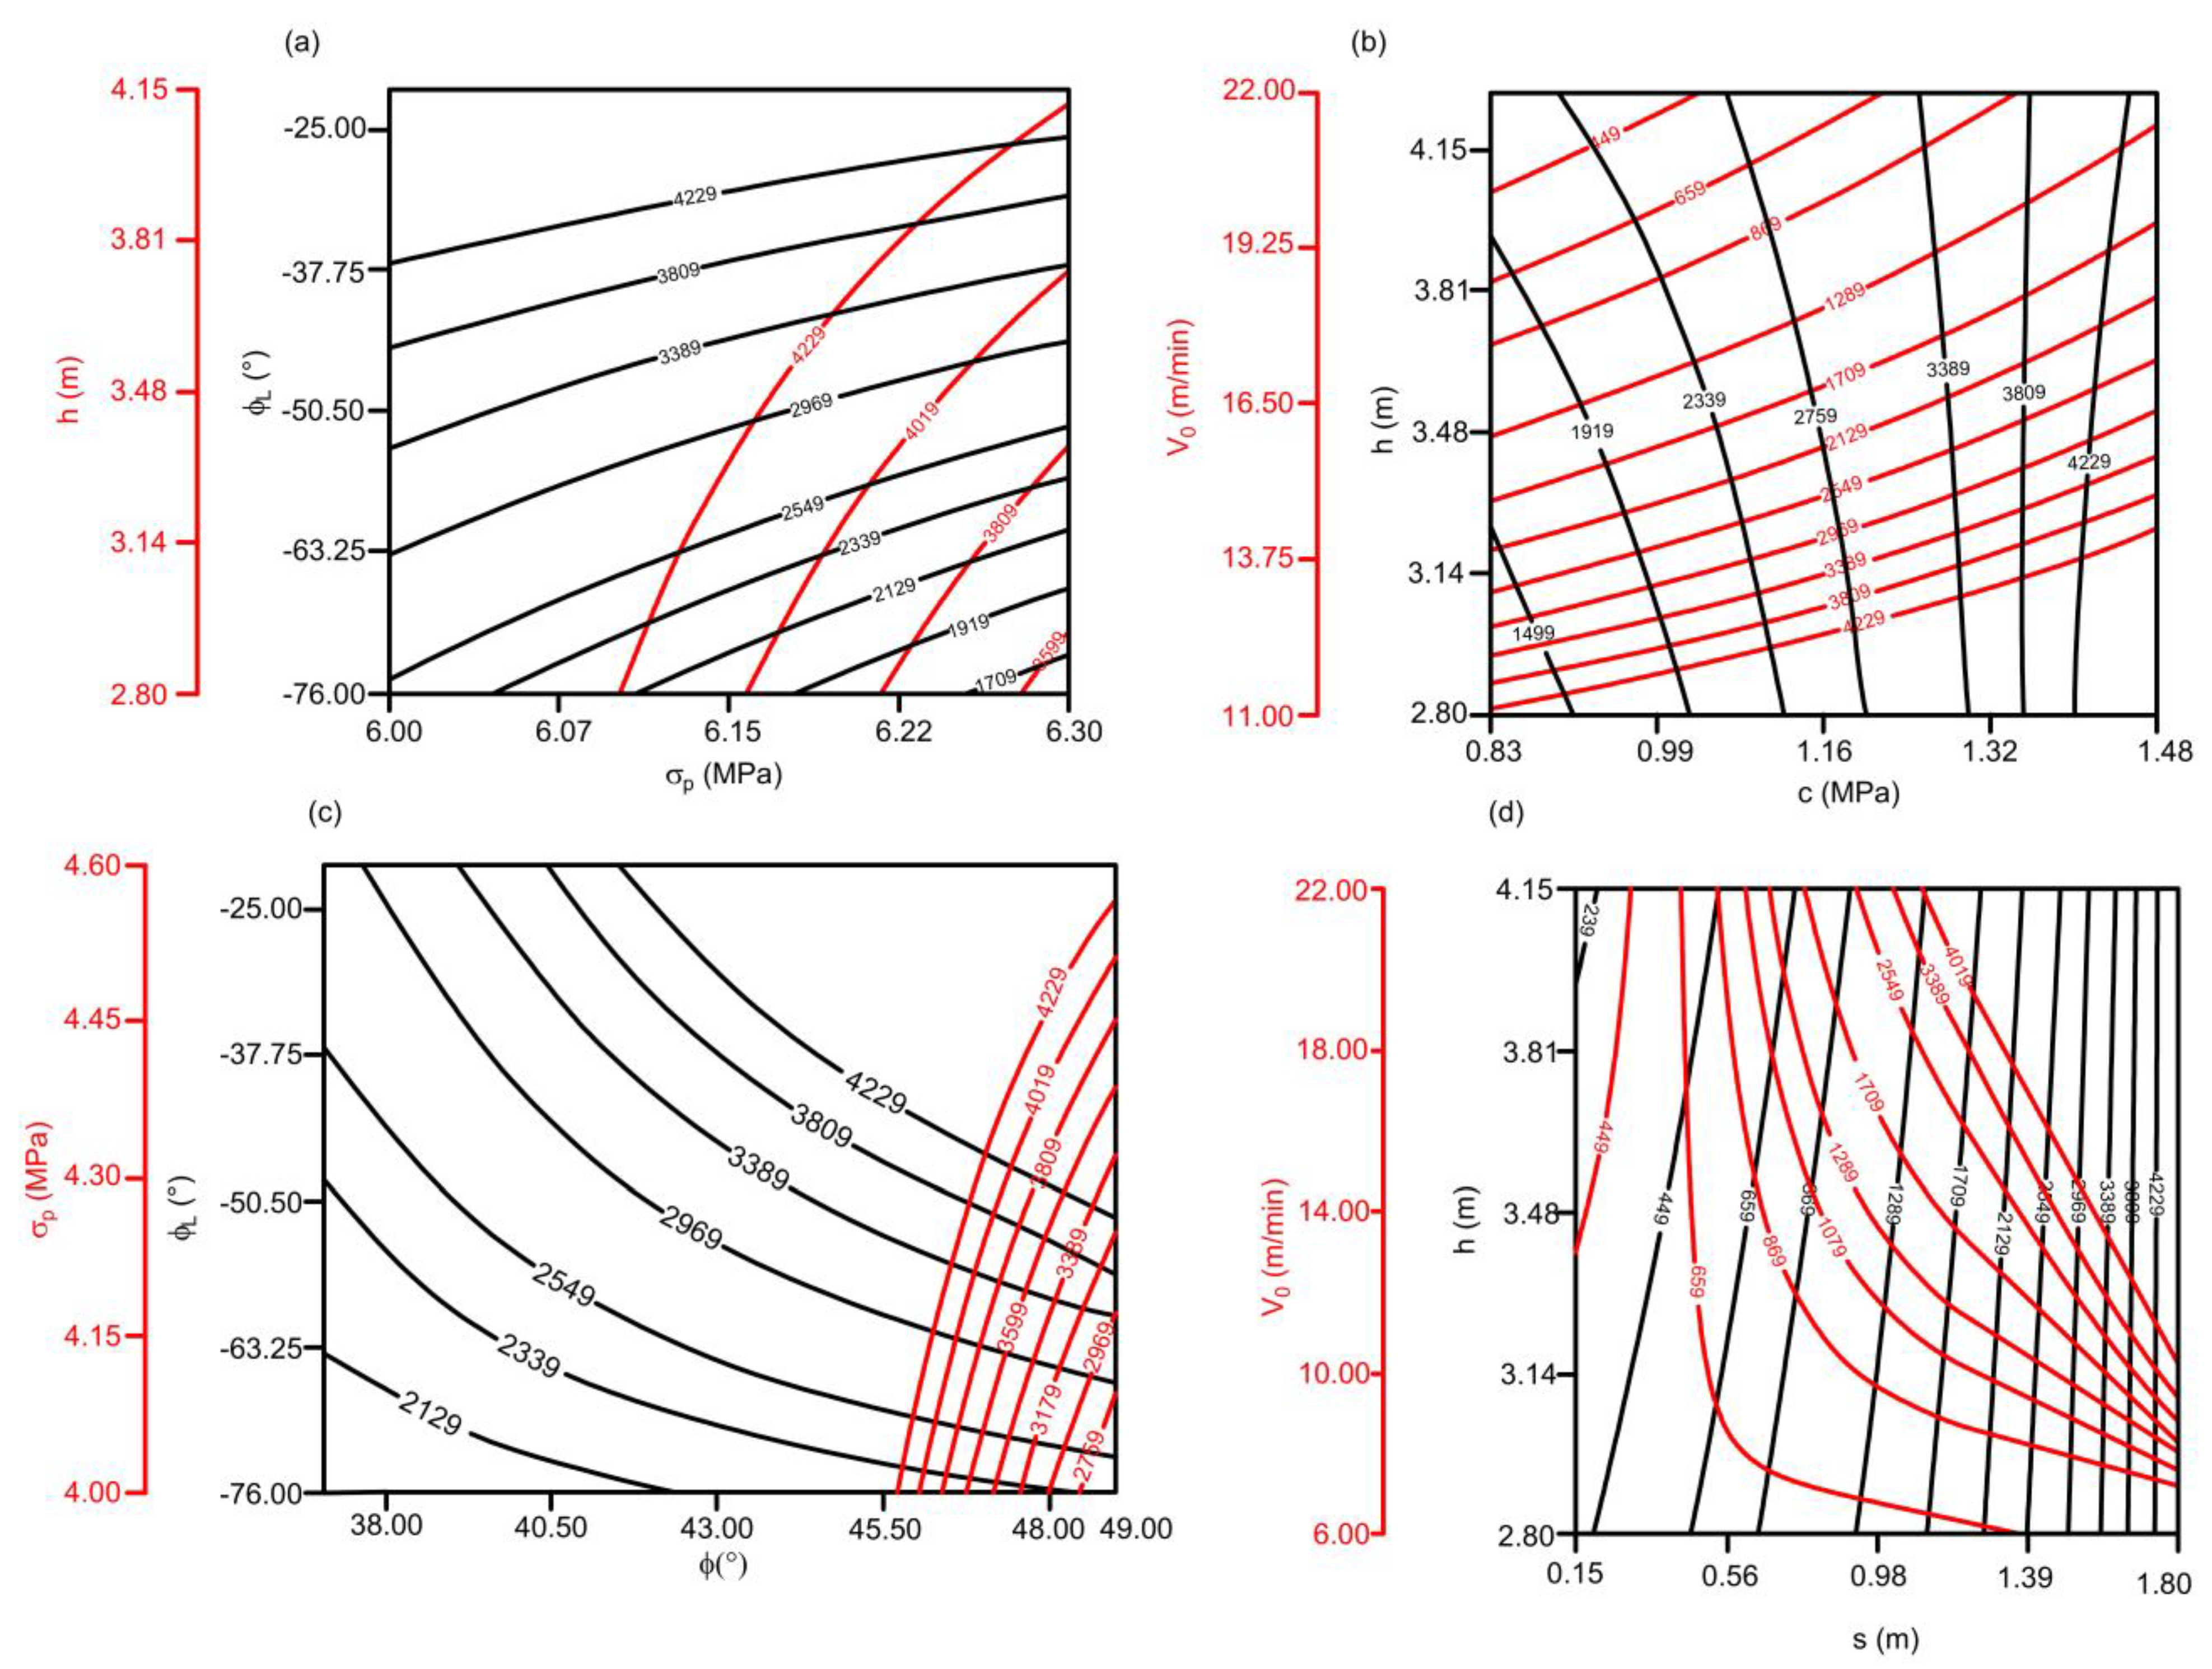
  • Coal uniaxial compressive strength σp: It appears that σp has a variable effect on Qef, depending on the type of the parameter in the interaction. When σp is in interaction with the slice height (h) and the excavator movement angle in the left direction (φL), σp has a negative (decreasing) effect on Qef, meaning that excavator capacity decreases with the increase in σp (Figure 4a), which is expected. Such effect is obtained for the upper range of values of σp (6.00–6.30 MPa). However, when σp is in interaction with the coal friction angle φ, it appears that it has a positive effect on Qef (Figure 4c). This interesting finding could indicate that for high values of coal friction angles (above 45.5°), an increase in σp leads to increase in Qef. One should note that this is achieved for the lower range of values of σp (4.00–4.60 MPa).
  • Slice height h: It has a positive effect on Qef for all statistically significant two-factor interactions: σp (Figure 4a), c (Figure 4b), and s (Figure 4d), meaning that with the increase in slice height, Qef also increases.
  • Excavator movement angle in the left direction (φL): Similarly to slice height, φL also has a positive effect on Qef in all statistically significant interactions: σp (Figure 4a) and φ (Figure 4c).
  • Velocity of the rotary movement of the excavator (V0): V0 has a negative effect on Qef in interaction with c (Figure 4b) and s (Figure 4d), meaning that Qef decreases as V0 increases.
  • Coal cohesion (c): It has a positive effect on Qef (Figure 4b), indicating that Qef increases as c increases. One should note that such an effect is captured for a relatively narrow range of values for cohesion (0.83–1.48 MPa).
  • Coal friction angle (φ): For medium values of σp (around 5 MPa), φ has a positive effect on Qef (Figure 4c). However, for low values of σp (4.00–4.30 MPa), φ has a negative effect on Qef (Figure 4c). However, one should note that the results of the ANOVA test indicate that the individual effect of the coal friction angle is statistically insignificant (p-value = 0.6374), so Figure 4c should be observed as relevant only for φL and σp: an increase in φL leads to an increase in Qef for all examined values of φ, while the increase in σp leads to an increase in Qef only for very high values of φ (>45.5°).
  • Slice thickness (s): Similar to slice height, s also has a positive effect on Qef in all statistically significant interactions: h and V0 (Figure 4d).

3.1.2. Current Consumption Imax

The performed statistical analysis indicates that several two-factor interactions have statistically significant effects on Imax (Figure 5):
  • Velocity of the rotary movement of the excavator (V0): V0 has a positive effect on Imax—an increase in V0 leads to an increase in Vmax in interaction with the coal unit weight (Figure 5a) and friction angle (Figure 5c).
  • Slice thickness (s): s has a positive effect on Imax (Figure 5a).
  • Coal unit weight (γ): γ has a different effect on Imax depending on the parameter in co-action. When γ is interacting with c and V0, γ has a positive effect on Imax (Figure 5a). However, when γ is interacting with s, for lower values of s, the increase in γ has almost no effect on Imax. For higher values of s, the increase in γ leads to the decrease in Imax.
  • Excavator movement angle: It has an opposite effect on Imax, depending on the excavation direction and coal compressive strength, which indicates specific geometry constraints and sedimentation conditions, which are favorable in the right direction of excavation for zones of coal with higher values of σp and in the left direction for zones of coal with lower values of σp:
    Excavator movement angle in the left direction (φL): φL has different effects for lower and medium-to-high values of σp (Figure 5b). For lower values of σp, φL has a negative effect on Imax. However, φL has a positive effect on Imax for medium-to-high values of σp.
    Excavator movement angle in the right direction (φD): φD has different effects for lower and medium-to-high values of σp (Figure 5b). For lower values of σp, φD has a positive effect on Imax. However, φD has a negative effect on Imax for medium-to-high values of σp.
It should be noted that Figure 4b actually shows the same: excavation in the left direction is more favorable for zones of coal with higher σp, while excavation in the right direction is more favorable for zones of coal with lower σp.
  • Coal compressive strength (σp): σp has a different effect on Imax depending on the parameters in interaction and their values. When interacting with φD, σp has a positive effect on Imax for medium-to-lower values of φD, while σp has a negative effect on Imax for higher values of φD (Figure 5b). When interacting with φL, σp has a negative effect on Imax for medium-to-lower values of φL, while σp has a positive effect on Imax for higher values of φL. From the viewpoint of geomechanics, the relevant impact of σp is for the excavation angle in the left direction for σp higher than 5 MPa, where the increase in σp leads to the increase in Imax.
  • Coal angle of internal friction (φ): The effect of φ on Imax depends on the type of parameter in interaction and its values. For lower values of slice height h, φ has a positive effect on Imax, while φ has a negative effect on Imax for medium-to-high values of h (Figure 5c). On the other hand, for medium-to-lower values of V0, φ has a negative effect on Imax, while φ has a positive effect on Imax for higher values of V0 (Figure 5c). However, according to the results of the ANOVA test, the individual effect of φ is statistically insignificant (p-value = 0.5541), so Figure 5 should be considered as relevant only for V0 and h, meaning that for all examined values of φ, an increase in V0 leads to an increase in Imax, while an increase in h leads to a decrease in Imax.
  • Slice height (h): h has a negative effect on Imax (Figure 5c,d). In particular, current consumption is lower for the higher values of slice height.

3.1.3. Power Consumption Nmax

The performed statistical analysis indicates that several two-factor interactions have statistically significant effects on Nmax (Figure 6):
  • Velocity of the rotary movement of the excavator (V0): V0 has a positive effect on Nmax (Figure 6c). Such a relationship is expected, indicating that the increase in V0 requires an increase in power consumption.
  • Slice thickness (s): s has a positive effect on Nmax, regardless of the type of parameter in interaction (Figure 6a). In particular, an increase in slice thickness leads to an increase in Nmax.
  • Excavator movement angle in the left (φL) and right (φD) direction: It has a negative effect on Nmax, regardless of the type of parameter in interaction (Figure 6b,c), which could be interpreted as a product of a specific geometry of the coal seam.
  • Coal compressive strength (σp): σp has a positive effect on Nmax (Figure 6a), which indicates that the increase in σp leads to an increase in Nmax.
  • Coal cohesion (c): c has a positive effect on Nmax, regardless of the type of parameter in interaction (Figure 6b). In particular, an increase in coal cohesion leads to an increase in Nmax.
  • Coal angle of internal friction (φ): φ has a negative effect on Nmax, regardless of the type of parameter in interaction (Figure 6a,c). However, the ANOVA test indicated the statistically insignificant individual effect of φ (p-value = 0.0041). Therefore, Figure 6a,c should be considered as relevant only for s and V0, meaning that Nmax increases with the increase in V0 and s for all the examined values of coal friction angle.
  • Slice height (h): h has a negative effect on Nmax, regardless of the type of parameter in interaction (Figure 6a,b). However, results of the ANOVA test indicate that h has statistically insignificant individual influence (p-value = 0.124), so the two-factor interactions should be considered as relevant only for c, meaning that an increase in cohesion leads to an increase in Nmax for all the examined values of slice height.

3.1.4. Force Consumption Pmax

The performed statistical analysis indicates that several two-factor interactions have statistically significant effects on Pmax (Figure 7):
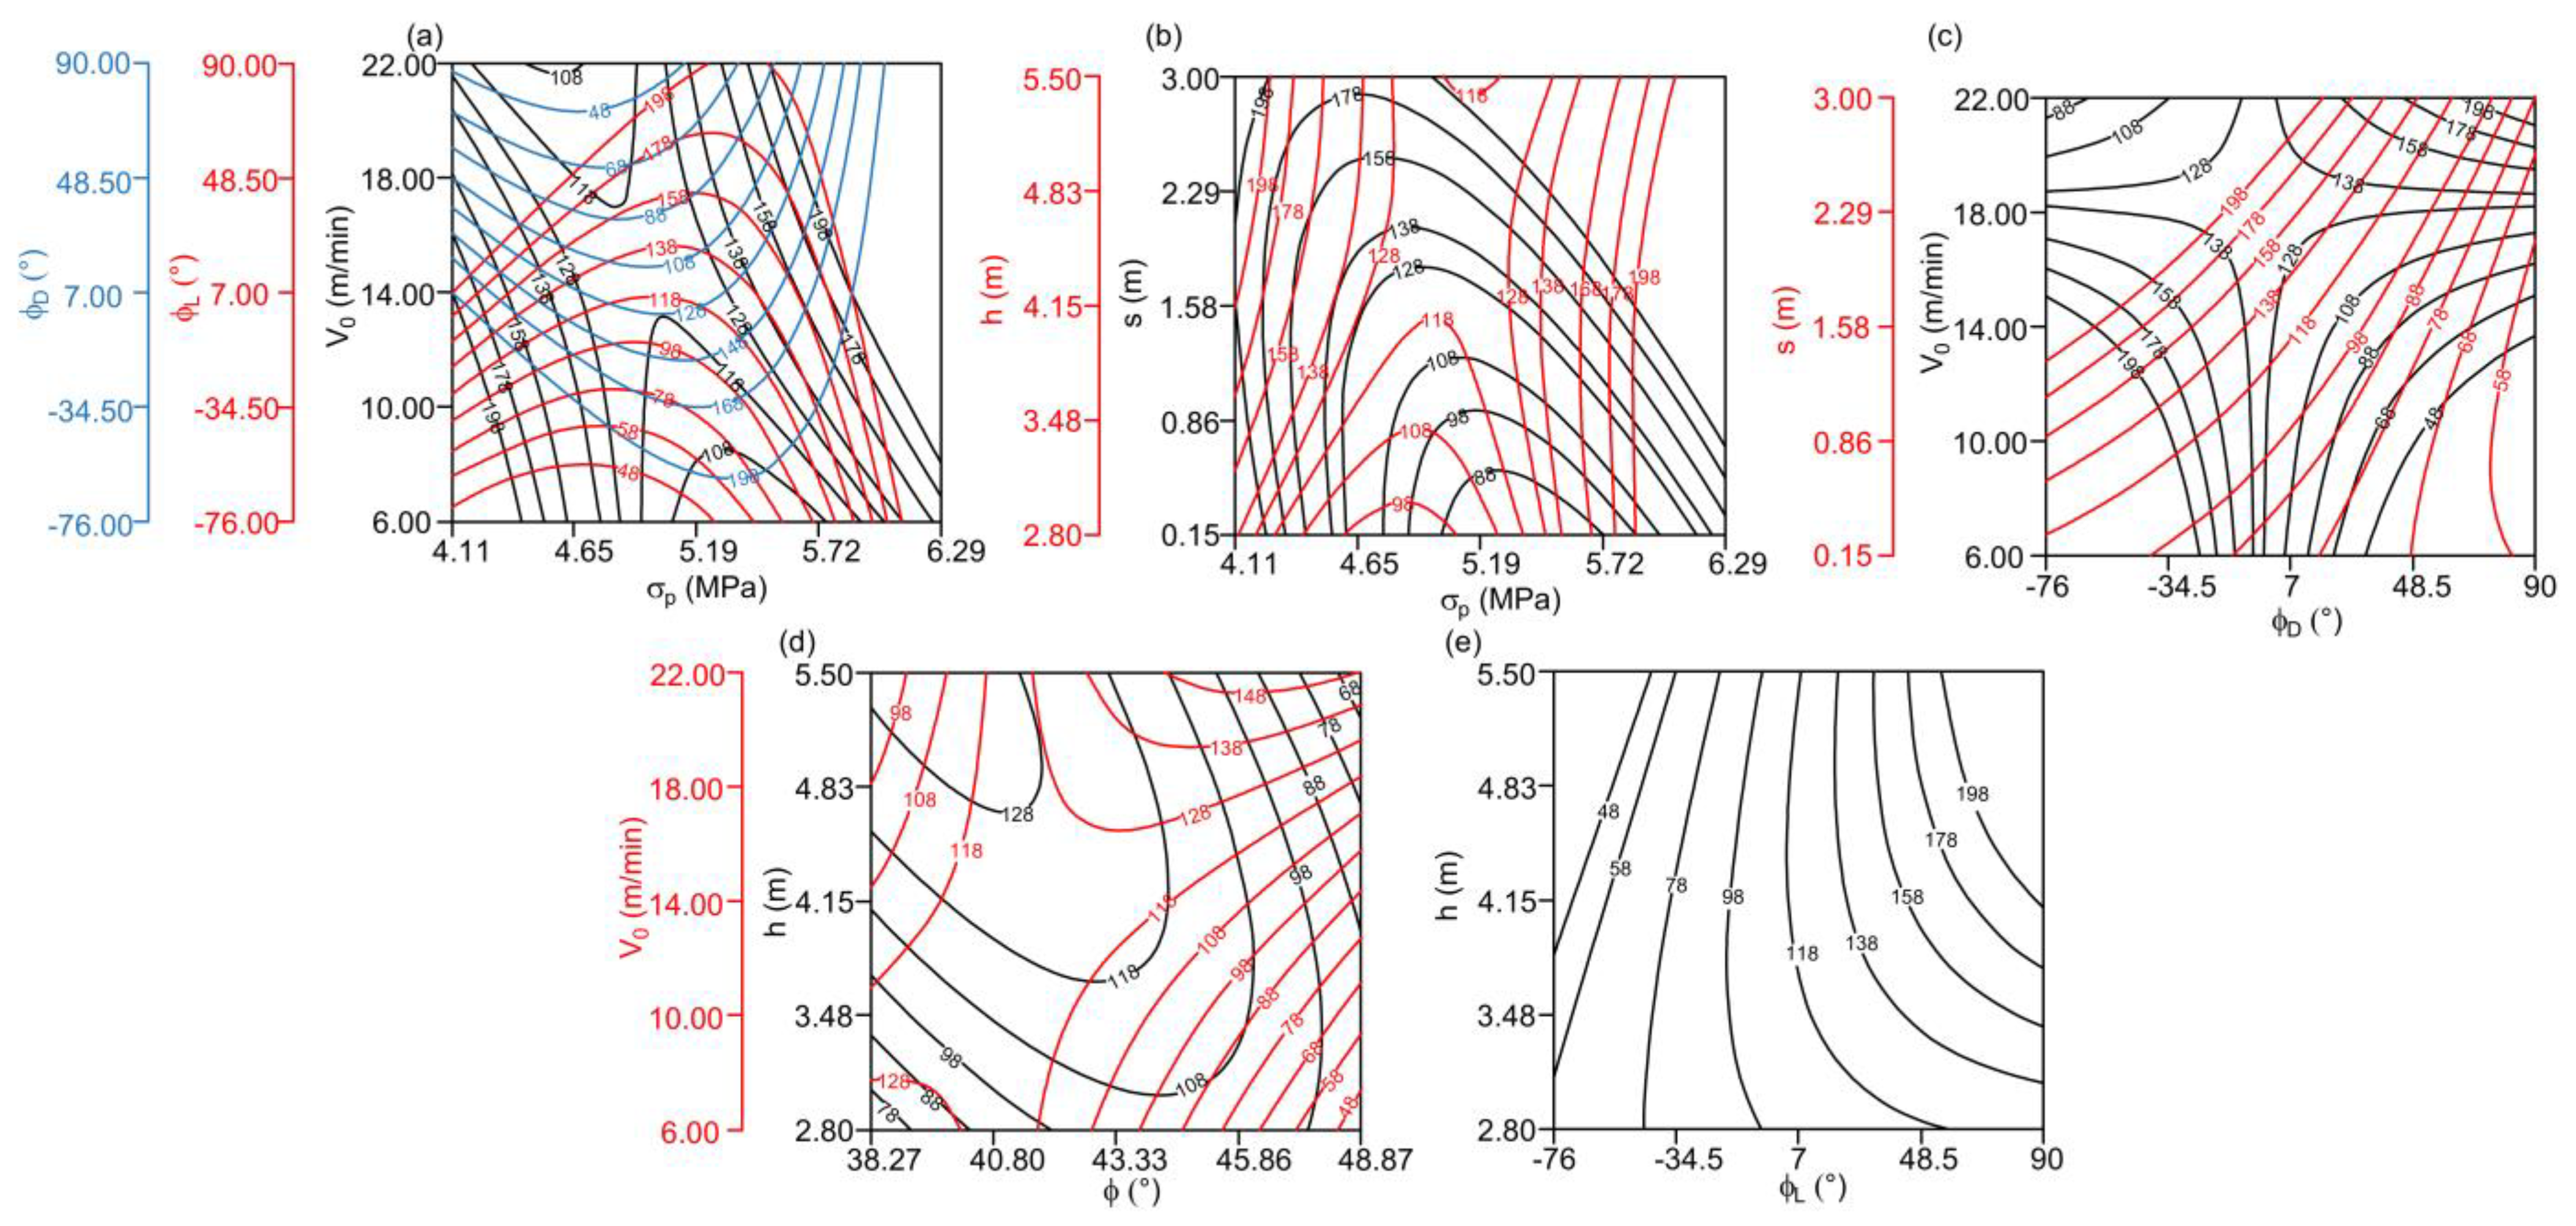
  • Velocity of the rotary movement of the excavator (V0): The effect of V0 on Pmax depends on the type of parameter in interaction and its values. For lower values of σp, φD, and φ, an increase in V0 leads to a decrease in Pmax (Figure 7a,c,d). However, for medium-to-high values of σp, φD, and φ, V0 has a positive effect on Pmax.
  • Slice thickness (s): s has a positive effect on Pmax, regardless of the parameter in interaction (Figure 7b,c). Such influence is expected because the increase in slice thickness should lead to an increase in Pmax.
  • Excavator movement angle: It has an opposite effect on Pmax, depending on the excavation direction, which identifies specific geometry constraints and sedimentation conditions, which are favorable in the right direction of excavation:
    Excavator movement angle in the left direction (φL): φL has a positive effect on Pmax, regardless of the parameter in interaction (Figure 7a,e).
    Excavator movement angle in the right direction (φD): φd has a negative effect on Pmax, regardless of the parameter in interaction (Figure 7a,c).
  • Coal compressive strength (σp): An increase in σp from lower-to-medium values leads to a decrease in Pmax in all interactions (Figure 7a,b). However, a further increase in σp from medium-to-high values leads to an increase in Pmax. Therefore, one could conclude that relevant values of σp are higher than approximately 5 MPa.
  • Coal angle of internal friction (φ): An increase in φ from lower-to-medium values leads to an increase in Pmax in interaction with h (Figure 7d). However, an increase in φ for lower-to-medium values of V0 leads to a decrease in Pmax (Figure 7d). A further increase in φ for higher values of V0 leads to an increase in Pmax (Figure 7d). One should note that according to the ANOVA test, the individual effect of the coal friction angle on Pmax is statistically insignificant (p-value = 0.2113). However, the influence of two-factor interaction φ × V0 is statistically significant (p-value = 0.005), while the impact of φ × h should be taken with caution (p-value = 0.0587). Concerning this, one should consider the effect of the coal friction angle on Pmax as relevant only for the lower values of φ (38–41°).
  • Slice height (h): for lower values of σp, an increase in h leads to an increase in Pmax. For higher values of σp, an increase in h has almost no effect on Pmax (Figure 7b). For lower-to-medium values of φ, h has a positive effect on Pmax, while h has a negative effect on Pmax for higher values of φ (Figure 7d). For lower-to-medium values of φL, an increase in h leads to a decrease in Pmax, while h has a positive effect on Pmax for higher values of φL (Figure 7e).

3.1.5. Energy Consumption Emax

The performed statistical analysis indicates that several two-factor interactions have statistically significant effects on Emax (Figure 8):
  • Velocity of the rotary movement of the excavator (V0): V0 has a negative effect on Emax, for all parameters in interaction, except for slice height, where a positive effect of V0 on Emax is recorded, for the medium-to-high values of V0 and medium-to-high values of slice height (Figure 8b).
  • Slice thickness (s): s has a negative effect on Emax, regardless of the parameters in interaction (Figure 8a,b). This means that the increase in slice thickness leads to a decrease in Emax. One should note that such an effect is obtained only for the range of s = 0.15–0.64 m, while for the higher values of s (0.64–1.20 m), slice thickness does not affect Emax.
  • Coal unit weight (γ): It has almost no effect on Emax (Figure 8a).
  • Excavator movement angle in the right direction (φD): φD has a negative effect on Emax, regardless of the parameters in interaction. This means that an increase in the excavator movement angle in the right direction leads to a decrease in Emax, which could be due to the specific geometry of the coal seam and/or particular sedimentation conditions.
  • Slice height (h): h has a positive effect on Emax, regardless of the parameters in interaction (Figure 8a,b). In particular, an increase in slice height leads to an increase in Emax, which is physically possible and expected.

3.2. Cutting Resistance

3.2.1. Linear Cutting Resistance KLmax

The performed statistical analysis indicates that several two-factor interactions have statistically significant effects on KLmax (Figure 9):
  • Velocity of the rotary movement of the excavator (V0): For low φD and σp, V0 has a negative effect on KLmax (Figure 9d,f). For medium-to-high values of φD, an increase in V0 leads to an increase in KLmax. On the other hand, for low-to-medium values of cohesion c and φL, an increase in V0 leads to an increase in KLmax (Figure 9e), while for higher values of c, V0 has a negative effect on KLmax. There is a positive effect of V0 on KLmax for all values of the coal friction angle φ, except for very low values of φ, where an increase in V0 from low-to-medium values leads to a decrease in KLmax.
  • Slice thickness (s): s has a negative effect on KLmax, regardless of the parameters in interaction (Figure 9a,c). This means that an increase in slice thickness leads to a decrease in linear cutting resistance. However, if one takes a closer look at Figure 8a,c, it is clear that such an effect is captured only for low values of slice thickness. In particular, such effect is captured only for s = 0.15–1.5 m and σp = 4.11–4.43 MPa (Figure 9a); for higher values of s, slice thickness does not affect KLmax. Additionally, for higher values of h (Figure 9c), there is a negative effect on KLmax. However, one could say that in both figures, s predominantly does not affect KLmax.
  • Coal unit weight (γ): Unit weight has a positive effect on KLmax for lower values of c (Figure 9c). For higher values of c, unit weight does not affect KLmax. Indeed, an increase in unit weight should lead to an increase in linear cutting resistance.
  • Excavator movement angle: It has an opposite effect on KLmax, depending on the excavation direction, which indicates specific geometry constraints and sedimentation conditions, which are favorable in the right direction of excavation:
    Excavator movement angle in the left direction (φL): φL has a positive effect on KLmax, regardless of the parameters in interaction (Figure 9a,b);
    Excavator movement angle in the right direction (φD): φD has a negative effect on KLmax, regardless of the parameters in interaction (Figure 9a,d).
  • Coal compressive strength (σp): σp has a negative effect on KLmax for all parameters in interaction (Figure 9a,f), except for a very high value of V0 (Figure 9f) when σp has a positive effect on KLmax. The effect of compressive strength is apparently physically possible only for the higher values of V0 because the increase in compressive strength should lead to the increase in KLmax;
  • Coal cohesion (c): c has a positive effect on KLmax, regardless of the parameters in interaction (Figure 9b,e). Such an effect is expected—an increase in cohesion should lead to an increase in KLmax.
  • Slice height (h): h has a positive effect on KLmax, regardless of the parameters in interaction (Figure 9b–d), except for the high values of φD when h does not affect KLmax. In particular, the increase in the slice height requires higher excavation power, which, further, reduces the cutting resistance.

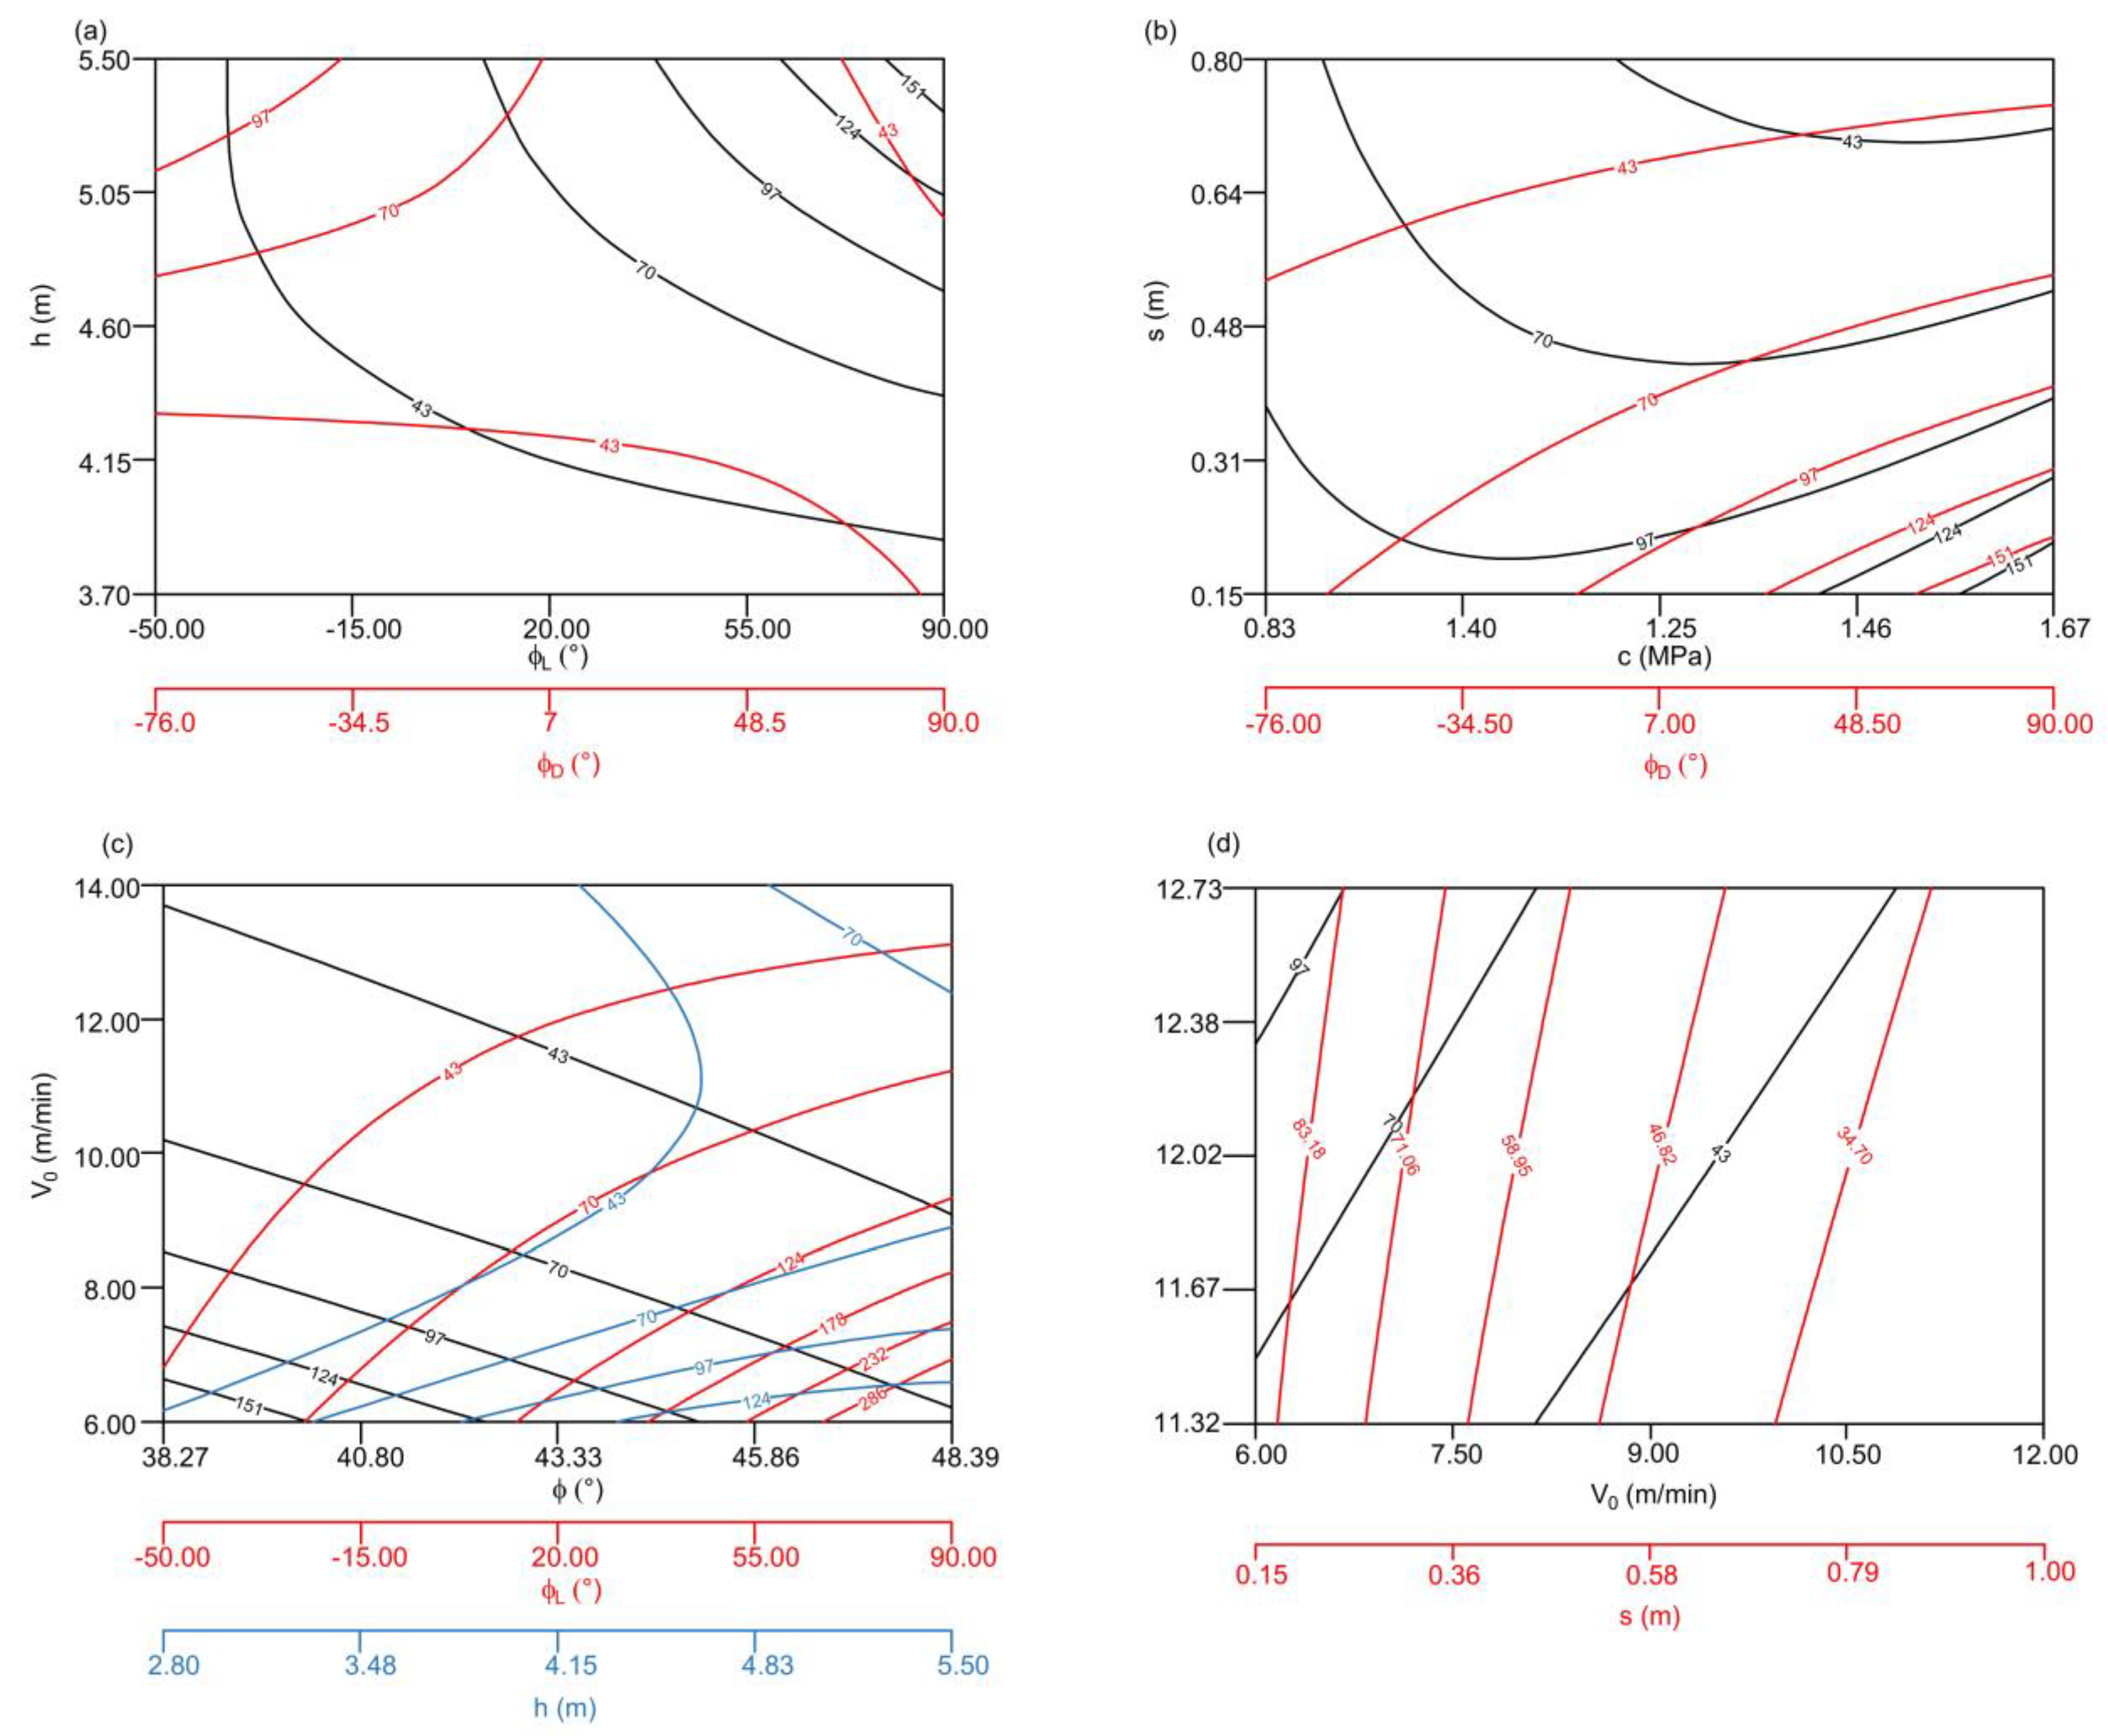
3.2.2. Areal Cutting Resistance KFmax

The performed statistical analysis indicates that several two-factor interactions have statistically significant effects on KFmax (Figure 10):
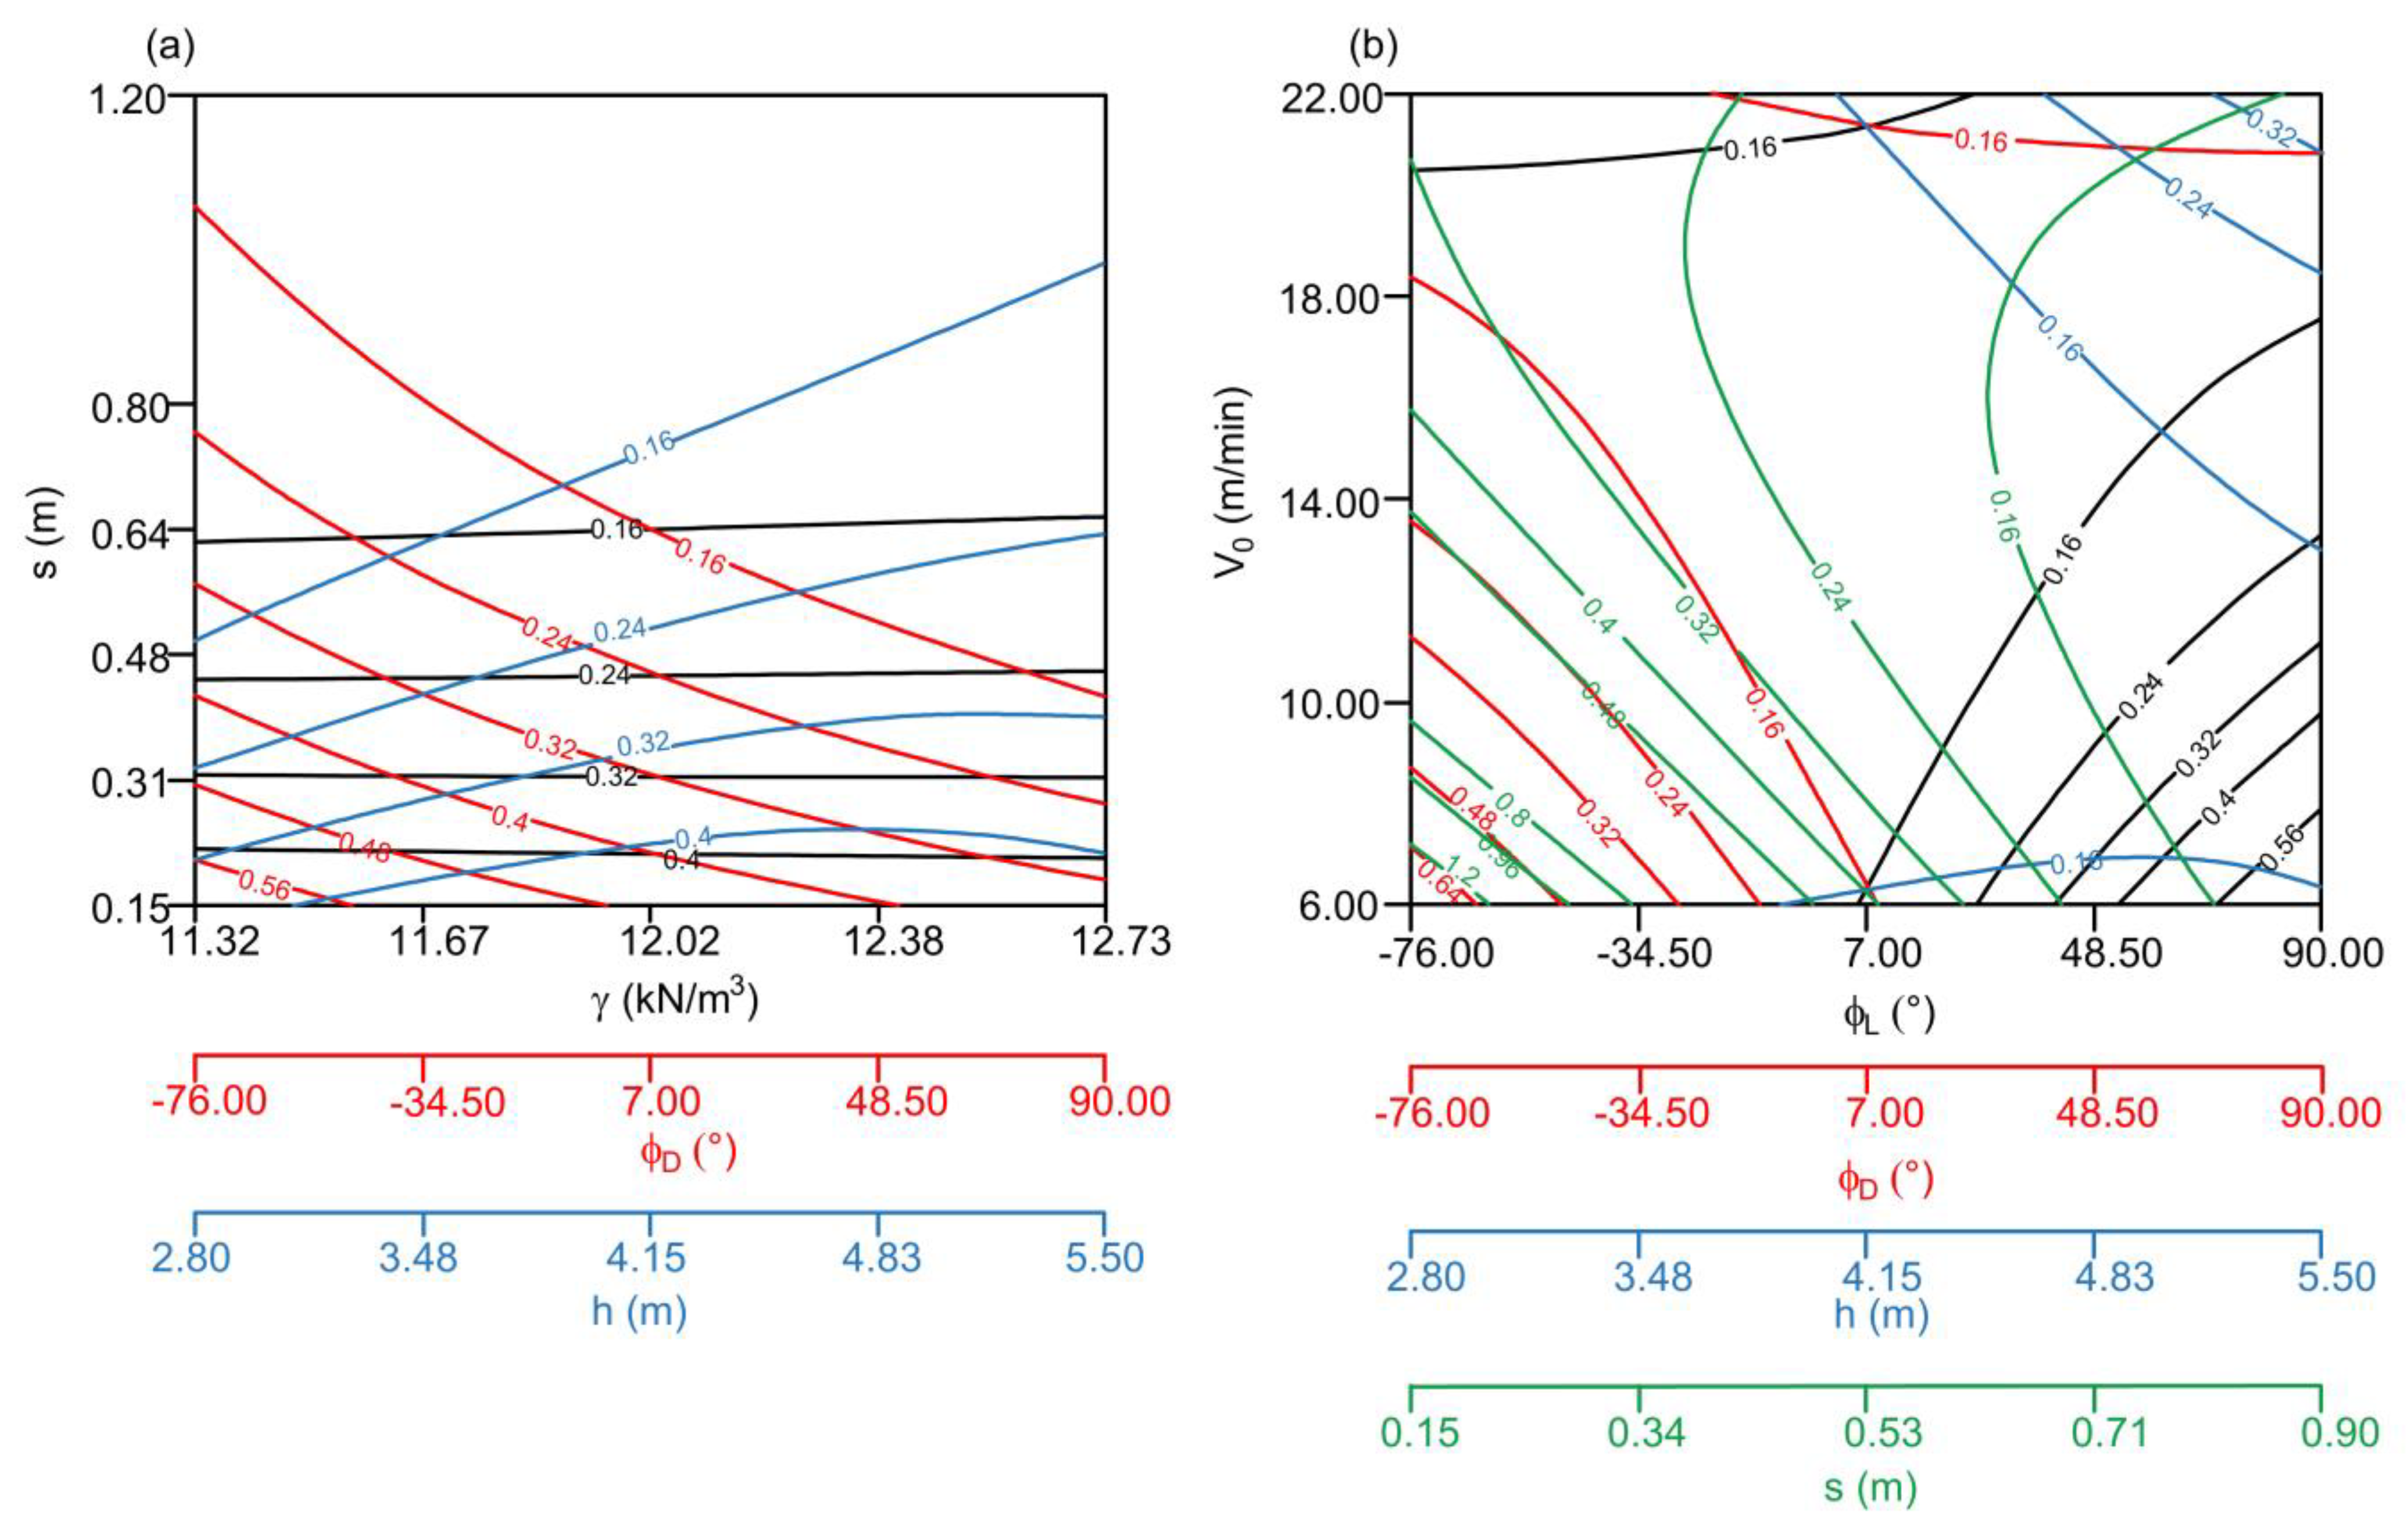
  • Velocity of the rotary movement of the excavator (V0): V0 has a negative effect on KFmax, regardless of the parameters in interaction (Figure 10c,d). Such an effect is expected, because the increased wheel velocity indicates higher power and, thus, lower cutting resistance.
  • Slice thickness (s): s has a negative effect on KFmax, regardless of the parameters in interaction (Figure 10b,d). This means that the increase in slice thickness leads to a decrease in areal cutting resistance. However, one should note that such an effect is observed only for low values of slice thickness (below 1 m), so it could be said that predominantly s has no effect on KFmax.
  • Coal unit weight (γ): γ has a positive effect on KFmax (Figure 10d). From a geomechanical viewpoint, such an effect is expected: the increase in unit weight leads to the increased cutting resistance.
  • Excavator movement angle in the left direction (φL): φL has a positive effect on KFmax, regardless of the parameters in interaction (Figure 10a,c). In a particular case, it means that the increase in the movement angle in the left direction leads to the increase in cutting resistance, which could be ascribed to the specific geometry of the coal seam and inherent sedimentation conditions.
  • Excavator movement angle in the right direction (φD): φD has a different effect on KFmax, depending on the type of parameter in interaction. In interaction with σp and h, φD has a negative effect on KFmax. In particular, for higher values of h (4.60–5.50 m), an increase in φD leads to a decrease in KFmax. This effect is the same for lower values of σp (4.11–4.81 MPa). In interaction with s, φD has a positive effect on KFmax, which is identical to the influence in the case of φL.
  • Coal cohesion (c): c has a positive effect on KFmax (Figure 10b). Such effect is expected because the increase in cohesion of the coal indeed leads to the increase in the areal cutting resistance.
  • Coal angle of internal friction (φ): φ has a negative effect on KFmax (Figure 10c). One would expect that because cohesion has a positive effect on KFmax, such influence is expected also for the friction angle. However, resistance to failure during the cutting is obviously determined by cohesion, while, once the failure is achieved during the cutting process, shear strength does not affect KFmax. Figure 10c should be observed as relevant only for wheel velocity V0, meaning that the increase in V0 for any value of φ leads to a decrease in KFmax. This is further proven by the ANOVA test, which indicates a much smaller p-value for V0 (0.0096) compared to the p-value for φ (0.0631). The p-value of V0×φ is also relatively high (0.0614).
  • Slice height (h): h has a positive effect on KFmax, regardless of the parameters in interaction (Figure 10a,c). In particular, the increase in the slice height requires higher excavation power, which, further, reduces the cutting resistance.

3.3. Analysis of the Most Significant Factors

Based on the performed multiple linear regression analysis, whose results are shown in Section 3.1 and Section 3.2, one could single out the most important two-factor interactions affecting the chosen parameters of coal cutting resistance and excavator performance. Significant two-factor interactions are singled out according to the lowest p-value (Table 2).
As one can see from Table 2, excavator movement angle in both directions, wheel velocity, and coal compressive strength are the most significant factors affecting all the examined output factors. Such an important influence of φL and φD could be ascribed to the specific geometry of the coal seam, its spatial distribution, and particular internal structure. The important effect of V0 and σp on the excavator performance and coal cutting resistance is expected and verified in the present research.
Coal cohesion and slice height also have a significant influence, but only for some of the output factors, while slice thickness has the most important impact on maximum energy consumption.
On the other hand, one can see that coal unit weight and angle of internal friction do not occur as the most significant influential factors. In general, the unit weight of coal changes in a small range, which commonly does not affect the important geomechanical properties of coal and the excavator performance. As for the friction angle, the results of the present research indicate the following: once the part of coal shear strength attributed to cohesion is overcome by the excavator, friction angle does have such a significant influence in the subsequent excavation process.

4. Development of a Model Based on Deep Neural Networks

In this research, deep neural networks (DNNs) have been devised to extrapolate a sequence of excavation parameters, depending on the main environmental and excavation properties. The model choice is selected based on the guidelines provided by Bergen et al. [19], Reichstein et al. [20], and Mignan and Broccardo [21], primarily attributed to the capability of DNN models in capturing complex, nonlinear relationships and identifying patterns within expansive datasets, notably within the realm of engineering disciplines such as earth science engineering.
Utilizing a three-layer DNN architecture is motivated by the aim of leveraging the DNN’s capability to capture hierarchical features inherent in the datasets. Specifically, the first layer is tuned to detect rudimentary or low-level attributes, the subsequent layer identifies intermediate or medium-level features, and the final layer focuses on advanced, high-level, or abstract characteristics [22]. By reducing the number of nodes in deeper layers from 256 and 128 to 64, DNNs are inclined to prioritize and retain only the most critical information, leading to a streamlined and concise representation of the data [23,24]. A higher dropout rate of 0.25 is assigned to the first layer, which has the most nodes, while for the second and third layers, a dropout rate of 0.1 is employed. This choice is motivated by the fact that the initial layer, capturing rudimentary or low-level attributes, possesses a broader and more diversified set of features, while the next two layers systematically transform the extensive input data into more detailed estimates [25].
Regarding the optimization of DNNs, the Adam optimizer is particularly favored due to its capability to effectively manage the complexities of large parameter spaces and layered architectures, thus offering superior performance in comparison to other optimization methods [25]. In contrast to alternatives like Gradient Descent, Stochastic Gradient Descent, and Adagrad, Adam excels by combining the benefits of adaptive learning rates, often resulting in more rapid convergence and superior performance in DNNs.
The adequate architecture of the neural network is determined based on the following. Three different optimization algorithms are examined, among which Adam’s optimization algorithm is chosen, as the one with the lowest MSE (Table 3).
For the Adam optimization algorithm, four different architectures are tested, with different numbers of nodes per hidden layer (Table 4). It is clear from Table 4 that the Adam optimization algorithm with 256, 128, and 64 nodes per hidden layer has the lowest MSE.
The chosen DNN model with the determined architecture undergoes training over 300 epochs to determine the optimal parameters for prediction. The overall efficiency of the model parameters, using mean square error (MSE), is evaluated across all modeling parameters (Figure 3) and depicted in Figure 11. It is evident that the MSE decreases sharply up to roughly 50 epochs, and upon increasing further epochs, it stabilizes to relatively consistent MSE values (Figure 11).
Once the DNN model is selected, its efficiency is assessed for six variables: Qef, Nmax, Pmax, Emax, KLmax, and KFmax (Figure 12). During model training, the MSE ranges between 6.7% and 11.5%, indicating that the model is suitable for all the variables. The highest matching between the expected and predicted variables is observed for Nmax (Figure 12b), whereas the model’s performance for KFmax suggests the least but relatively good alignment with the expected variable (Figure 12f).
When tested with an unseen dataset, the DNN model validation indicates satisfactory results, with MSE values between 9.2% and 16.5% (Figure 13). The highest correspondence is seen for Nmax, consistent with the training dataset (Figure 13b). On the other hand, while the alignment for Emax (Figure 13d) and KFmax (Figure 13f) is on the lower side, it is still reasonable at 16.5% and 16.4%, respectively.
For Emax, the mean squared error (MSE) stands at 10.36%. For KFmax, it is slightly lower at 7.6%. The R2 values for these variables are 0.982 and 0.988, respectively. For KFmax, when the predicted and expected values range from 500 to 1000 N/cm2, the model performs well. Outside of this range, the model tends to have higher errors. In the case of Emax, for values exceeding 1 kWh/m3, there is a divergence between the predicted and expected values, which contributes to the MSE of 10.36%. Nevertheless, based on the R2 and MSE values, the modeling performance can be deemed robust and effective, especially within the anticipated ranges (KFmax between 500 and 1000 N/cm2 and Emax up to 1 kWh/cm3)
The outcomes of the DNN model for the variable Imax are presented distinctly. This is due to the unique characteristic of the Imax values which can be either extremely low or high. For a more concise representation, Figure 14 displays promising results with an MSE between 4.8% and 12.5%.

5. Conclusions

The results of the performed analysis indicate that some of the controlling factors do not have a statistically significant effect on some of the output factors, i.e.,:
  • Coal unit weight γ has a statistically significant effect only for the current consumption Imax, areal cutting resistance KFmax, and for the linear cutting resistance KLmax for low values of coal cohesion. For all the rest of the output factors, γ does not have a statistically significant influence.
  • Coal cohesion c has a statistically significant effect only for the excavator capacity Qef, power consumption Nmax, and linear and areal cutting resistance of coal, KLmax and KFmax.
  • Coal angle of internal friction φ does not have a statistically significant effect on energy consumption Emax and linear cutting resistance KLmax.
  • Coal compressive strength σp does not have a statistically significant influence on energy consumption Emax and areal cutting resistance KFmax.
  • Excavator movement angle in the right direction (φD) does not have a statistically significant influence on excavator capacity Qef.
All parameters have a certain effect on output factors, independent of the quality of the two-factor interaction, or dependent on the values of the other interacting controlling factors:
  • Velocity of the rotary movement of the excavator (V0):
    V0 has a negative effect (meaning that the output parameter decreases as V0 increases) on (1) Qef in interaction with c and s; (2) Pmax, for lower values of σp, φD, and φ; (3) Emax, for all parameters in interaction, except for moderate-to-high values of slice height; (4) KLmax, for low-to-medium values of cohesion c and φL, and for higher values of c and V0 and very low values of φ; and (5) KFmax;
    V0 has a positive effect (meaning that the output parameter increases as V0 increases) on (1) Imax; (2) Nmax; (2) Pmax, for medium-to-high values of σp, φD, and φ; (3) Emax, for medium-to-high values of slice height; and (4) KLmax, for low-to-medium values of cohesion c and φL.
  • Slice thickness (s):
    s has a negative effect (meaning that the output parameter decreases as s increases) on Emax, KLmax, and KFmax;
    s has a positive effect (meaning that the output parameter increases as s increases) on Qef, Imax, Nmax, and Pmax.
  • Coal unit weight (γ):
    γ has a negative effect (meaning that the output parameter decreases as γ increases) on Imax, for higher values of slice thickness s;
    γ has a positive effect (meaning that output parameter increases as γ increases) on (1) Imax, except for the higher values of s; (2) KLmax, for lower values of cohesion; and (3) KFmax.
  • Excavator movement angle in the left direction (φL):
    φL has a negative effect (meaning that the output parameter decreases as φL increases) on (1) Imax, for lower values of σp, and (2) Nmax;
    φL has a positive effect (meaning that the output parameter increases as φL increases) on Qef, Imax (for moderate to high values of σp), Pmax, KLmax, and KFmax.
  • Excavator movement angle in the right direction (φD):
    φD has a negative effect (meaning that the output parameter decreases as φD increases) on Imax (for medium-to-high values of σp), Nmax, Pmax, Emax, KLmax, and KFmax (in interaction with σp and h);
    φD has a positive effect (meaning that the output parameter increases as φD increases) on Imax (for lower values of σp) and KFmax (in interaction with s).
  • Coal compressive strength (σp):
    σp has a negative effect (meaning that the output parameter decreases as σp increases) on (1) Qef, in interaction with slice height (h) and excavator movement angle in the left direction (φL); (2) Imax, for higher values of φD and for medium-to-lower values of φL; (3) Pmax, for lower-to-medium values of σp; and (4) KLmax, except for very high values of V0;
    σp has a positive effect (meaning that the output parameter increases as σp increases) on (1) Qef, in interaction with friction angle, for a lower range of values of σp (4.00–4.60 MPa); (2) Imax, for medium-to-lower values of φD and for higher values of φL; (3) Nmax; (4) Pmax, for moderate-to-high values of σp; and (5) KLmax, for very high values of V0.
  • Coal cohesion (c):
    c has no negative effect on the output parameters;
    c has a positive effect (meaning that the output parameter increases as c increases) on Qef, Nmax, KLmax, and KFmax.
  • Coal angle of internal friction (φ):
    φ has a negative effect (meaning that the output parameter decreases as φ increases) on (1) Qef, for low values of σp (4.00–4.30 MPa); (2) Imax, for medium-to-high values of h and for medium-to-lower values of V0; (3) Nmax; (4) Pmax, for lower-to-medium values of V0; and (5) KFmax;
    φ has a positive effect (meaning that the output parameter increases as φ increases) on (1) Qef, for medium values of σp (around 5 MPa); (2) Imax, for lower values of slice height h and higher values of V0; and (3) Pmax, for lower-to-medium values of φ and for higher values of V0.
  • Slice height (h):
    h has a negative effect (meaning that the output parameter decreases as h increases) on Imax, Nmax, and Pmax (for higher values of φ and for lower-to-medium values of φL);
    h has a positive effect (meaning that the output parameter decreases as h increases) on Qef; Pmax (for lower values of σp and for lower-to-medium values of φ, and for higher values of φL); Emax; KLmax, except for the high values of φD; and KFmax.
The DNN joint model for estimation of excavator performance and coal cutting resistance has three hidden layers (256, 128, and 64 nodes) with drop rates of 0.25 and 0.1, and it was trained using the Adam optimizer and MSE for 300 epochs. The DNN model’s efficiency showed decreasing MSE up to ~50 epochs before stabilizing. When assessed for six examined variables, the model had an MSE between 6.7% and 11.5%, with the best match for Nmax. On unseen data, results remained consistent, with MSEs between 9.2% and 16.5%. The variable Imax, due to its distinct low or high values, is separately visualized, yielding a 4.8% to 12.5% MSE range.
The model developed in the present study, including the determined complex relations between different parameters of the excavation process and coal properties, could be further used for both planning and optimization of the coal exploitation process. In particular, the planning process for long-term operation at open-pit coal mines could be significantly improved because the choice of the adequate type of bucket-wheel excavator could be made based on the estimated performances. As for the optimization process, it is possible to estimate the excavation performance of the bucket-wheel excavator solely based on laboratory-determined coal properties. Moreover, a required parameter of the excavation performance could be roughly estimated solely by addressing the single most significant parameter of the coal. The DNN model presented in this study, although it is developed for the specific location, could be updated with new parameter values and used for estimation of performance cutting resistance at any other open-pit surface mine with similar geological conditions as the one examined in the present paper.

Author Contributions

All authors contributed to the study’s conception and design. Analysis of the effect of each influential factor was performed by S.K. and J.T. Development of the DNN model was performed by V.I., S.K. and M.S. wrote the first draft of the manuscript. All authors commented on previous versions of the manuscript. All authors have read and agreed to the published version of the manuscript.

Funding

This research received no external funding.

Data Availability Statement

Data used or generated within this study will be made available upon reasonable request.

Conflicts of Interest

The authors declare no conflict of interest.

References

  1. Gordon, L.R. World Coal. Economics, Policies and Prospects; Cambridge University Press: London, UK, 1987. [Google Scholar]
  2. Available online: https://ember-climate.org/data-catalogue/yearly-electricity-data/ (accessed on 15 August 2023).
  3. Available online: https://ember-climate.org/insights/research/european-electricity-review-2022/ (accessed on 15 August 2023).
  4. Available online: https://www.energyinst.org/statistical-review/ (accessed on 15 August 2023).
  5. Ritchie, H. The Death of UK Coal in Five Charts. Available online: https://ourworldindata.org/death-uk-coal (accessed on 8 August 2023).
  6. Liu, X.; Li, L.; Yang, Y. Development status of coal mining in China. J. South. African Inst. Min. Metal. 2023, 123, 19–28. [Google Scholar] [CrossRef]
  7. Vujić, S. (Ed.) Serbian Mining and Geology in the Second Half of the XX Century; Academy of Engineering Science of Serbia, Matica Srpska and Mining Institute: Belgrade, Serbia, 2014. (In Serbian) [Google Scholar]
  8. Andraș, A.; Radu, S.M.; Brînaș, I.; Popescu, F.D.; Budilică, D.I.; Korozsi, E.B. Prediction of Material Failure Time for a Bucket Wheel Excavator Boom Using Computer Simulation. Materials 2021, 14, 7897. [Google Scholar] [CrossRef] [PubMed]
  9. Jiang, Y.; Liao, G.; Zhu, S.; Hu, Y. Investigation on Cutting Resistance Characteristic of Bucket Wheel Excavator Using DEM and DOE Methods. Simul. Model. Pract. Theory 2021, 111, 102339. [Google Scholar]
  10. Popescu, F.D.; Radu, S.M.; Kotwica, K.; Andraș, A.; Kertesz, I. Simulation of the Time Response of the ERc 1400-30/7 Bucket Wheel Excavator’s Boom during the Excavation Process. Sustainability 2019, 11, 4357. [Google Scholar] [CrossRef]
  11. Sowała, M.; Strempski, A.; Woźniak, J.; Pactwa, K. Impact of the Length of Manoeuvering Roads of a Bucket Wheel Excavator for Working Times in the Shortwall. J. Min. Sci. 2019, 55, 603–609. [Google Scholar] [CrossRef]
  12. Machniak, L.; Kozioł, W. Method of assessment of hard rock workability using bucket wheel excavators. Arch. Min. Sci. 2017, 62, 73–82. [Google Scholar] [CrossRef]
  13. Bolukbasi, N.; Koncagul, O.; Pasamehmetoglu, A.G. Material diggability studies for the assessment of bucket wheel excavator performance. Min. Sci. Technol. 1991, 13, 271–277. [Google Scholar] [CrossRef]
  14. Chen, Z.; Chen, Y. Determination and analysis of the theoretical production of a bucket wheel excavator. Arch. Min. Sci. 2014, 59, 283–291. [Google Scholar]
  15. Xiang, Y.; Mutschler, S.; Brix, N.; Brach, C.; Geimer, M. Optimization of Operation Strategy for Primary Torque based Hydrostatic Drivetrain using Artificial Intelligence. arXiv 2020, arXiv:2003.10011. [Google Scholar]
  16. Xiang, Y.; Tang, T.; Su, T.; Brach, C.; Liu, L.; Mao, S.S.; Geimer, M. Fast CRDNN: Towards on Site Training of Mobile Construction Machines. IEEE Access 2021, 9, 124253–124267. [Google Scholar] [CrossRef]
  17. Kostić, S.; Trivan, J. Optimization of coal overburden excavation considering variable geomechanical properties and states of excavator teeth. Arch. Min. Sci. 2022, 67, 123–142. [Google Scholar]
  18. Ignjatović, D. Study on Optimization of the Construction of Buckets of the Buecket-Wheel Excavator in Order to Increase the Capacity of the Excavator; University of Belgrade Faculty of Mining and Geology: Belgrade, Serbia, 2003; p. 218. (In Serbian) [Google Scholar]
  19. Bergen, K.J.; Johnson, P.A.; de Hoop, M.V.; Beroza, G.C. Machine learning for data-driven discovery in solid Earth geoscience. Science 2019, 363, eaau032. [Google Scholar] [CrossRef] [PubMed]
  20. Reichstein, M.; Camps-Valls, G.; Stevens, B.; Jung, M.; Denzler, J.; Carvalhais, N.; Prabhat, F. Deep learning and process understanding for data-driven Earth system science. Nature 2019, 566, 195–204. [Google Scholar] [CrossRef] [PubMed]
  21. Mignan, A.; Broccardo, M. Neural network applications in earthquake prediction (1994–2019): Meta-analytic and statistical insights on their limitations. Seismol. Res. Lett. 2020, 91, 2330–2342. [Google Scholar] [CrossRef]
  22. LeCun, Y.; Bengio, Y.; Hinton, G. Deep learning. Nature 2015, 521, 436–444. [Google Scholar] [CrossRef] [PubMed]
  23. Glorot, X.; Bengio, Y. Understanding the difficulty of training deep feedforward neural networks. In Proceedings of the Thirteenth International Conference on Artificial Intelligence and Statistics, JMLR Workshop and Conference Proceedings, Sardinia, Italy, 13 May 2010; pp. 249–256. [Google Scholar]
  24. Gal, Y.; Ghahramani, Z. Dropout as a bayesian approximation: Representing model uncertainty in deep learning. In Proceedings of the International Conference on Machine Learning, New York, NY, USA, 19–24 June 2016; pp. 1050–1059. [Google Scholar]
  25. Zeiler, M.D. Adadelta: An adaptive learning rate method. arXiv 2012, arXiv:1212.5701. [Google Scholar]
  26. Kingma, D.P.; Ba, J. Adam: A method for stochastic optimization. arXiv 2014, arXiv:1412.6980. [Google Scholar]
  27. Bottou, L. Large-scale machine learning with stochastic gradient descent. In Proceedings of the COMPSTAT’2010: 19th International Conference on Computational Statistics, Paris, France, 22–27 August 2010; Keynote, Invited and Contributed Papers. pp. 177–186. [Google Scholar]
Figure 1. Locations of Tamnava Eastern Field, Tamnava Western Field, and Field D, from which data were collected and further analyzed.
Processes 11 03067 g001
Figure 2. General lithological composition of open pits Field D, Tamnava Western Field, and Tamnava Eastern Field (according to [18]).
Processes 11 03067 g002
Figure 3. Deep neural network (DNN) model used for training.
Processes 11 03067 g003
Figure 4. Statistically significant effect of different environmental properties and excavation parameters on excavator capacity Qef: (a) Qef = f(σp, φL, h), (b) Qef = f(c, h, V0), (c) Qef = f(σp, φL, φ), (d) Qef = f(V0, h, s). While the influential factors for each case are varied, other parameters are held constant for the fixed average values: γ = 12.02 kN/m3, c = 1.25 MPa, φL = 7°, φD = 7°, h = 4.15 m, s = 1.58 m, V0 = 14 m/min, σp = 5.19 MPa, φ = 43.33°. Mutual two-factor interactions are obtained for high values of R (0.91) and low MSE (6.99).
Processes 11 03067 g004
Figure 5. Statistically significant effect of different environmental properties and excavation parameters on maximum current consumption Imax: (a) Imax = f(γ, c, s, V0), (b) Imax = f(σp, φL, φD), (c) Imax = f(φ, h, V0), (d) Imax = f(h, s). While the influential factors for each case are varied, other parameters are held constant for the fixed average values: γ = 12.02 kN/m3, c = 1.25 MPa, φL = 7°, φD = 7°, h = 4.15 m, s = 1.58 m, V0 = 14 m/min, σp = 5.19 MPa, φ = 43.33°. Mutual two-factor interactions are obtained for high values of R (0.98) and low MSE (5.63).
Processes 11 03067 g005
Figure 6. Statistically significant effect of different environmental properties and excavation parameters on maximum power consumption Nmax: (a) Nmax = f(σp, φ, s), (b) Nmax = f(c, h, φL), (c) Nmax = f(φD, φL, V0). While the influential factors for each case are varied, other parameters are held constant for the fixed average values: γ = 12.02 kN/m3, c = 1.25 MPa, φL = 7°, φD = 7°, h = 4.15 m, s = 1.58 m, V0 = 14 m/min, σp = 5.19 MPa, φ = 43.33°. Mutual two-factor interactions are obtained for high values of R (0.77) and low MSE (0.00184).
Processes 11 03067 g006
Figure 7. Statistically significant effect of different environmental properties and excavation parameters on maximum force consumption Pmax: (a) Pmax = f(σp, φD, φL, V0), (b) Pmax = f(σp, h, s), (c) Pmax = f(φD, V0, s), (d) Pmax = f(φ, V0, h), (e) Pmax = f(φL, h). While the influential factors for each case are varied, other parameters are held constant for the fixed average values: γ = 12.02 kN/m3, c = 1.25 MPa, φL = 7°, φD = 7°, h = 4.15 m, s = 1.58 m, V0 = 14 m/min, σp = 5.19 MPa, φ = 43.33°. Mutual two-factor interactions are obtained for high values of R (0.86) and low MSE (10.43).
Processes 11 03067 g007
Figure 8. Statistically significant effect of different environmental properties and excavation parameters on maximum energy consumption Emax: (a) Emax = f(φD, h, s), (b) Emax = f(φD, s, h, V0). While the influential factors for each case are varied, other parameters are held constant for the fixed average values: γ = 12.02 kN/m3, c = 1.25 MPa, φL = 7°, φD = 7°, h = 4.15 m, s = 1.58 m, V0 = 14 m/min, σp = 5.19 MPa, φ = 43.33°. Mutual two-factor interactions are obtained for high values of R (0.95) and low MSE (0.82).
Processes 11 03067 g008
Figure 9. Statistically significant effect of different environmental properties and excavation parameters on maximum linear cutting resistance KLmax: (a) KLmax = f(σp, φD, s), (b) KLmax = f(φL, c, h), (c) KLmax = f(γ, h, s), (d) KLmax = f(φD, h, s, V0), (e) KLmax = f(φ, φL, V0), (f) KLmax = f(σp, V0). While the influential factors for each case are varied, other parameters are held constant for the fixed average values: γ = 12.02 kN/m3, c = 1.25 MPa, φL = 7°, φD = 7°, h = 4.15 m, s = 1.58 m, V0 = 14 m/min, σp = 5.19 MPa, φ = 43.33°. Mutual two-factor interactions are obtained for high values of R (0.73) and low MSE (6.57).
Processes 11 03067 g009
Figure 10. Statistically significant effect of different environmental properties and excavation parameters on maximum areal cutting resistance KFmax: (a) KFmax = f(φL, φD, h), (b) KFmax = f(φD, c, s), (c) KFmax = f(φL, h, V0), (d) KFmax = f(γ, V0, s). While the influential factors for each case are varied, other parameters are held constant for the fixed average values: γ = 12.02 kN/m3, c = 1.25 MPa, φL = 7°, φD = 7°, h = 4.15 m, s = 1.58 m, V0 = 14 m/min, σp = 5.19 MPa, φ = 43.33°. Mutual two-factor interactions are obtained for high values of R (0.75) and low MSE (4.63).
Processes 11 03067 g010
Figure 11. Training and validation of the DNN model using mean square error (MSE) as the optimization criterion over epochs.
Processes 11 03067 g011
Figure 12. Results from the DNN model training for variables: (a) Qef, (b) Nmax, (c) Pmax, (d) Emax, (e) KLmax, and (f) KFmax.
Processes 11 03067 g012
Figure 13. Results from DNN model verification: (a) Qef, (b) Nmax, (c) Pmax, (d) Emax, (e) KLmax, and (f) KFmax.
Processes 11 03067 g013
Figure 14. Results from the DNN model test and verification for Imax: (a) training of model of low values, (b) verification of model of low values; (c) training of model of high values; (d) verification of model of high values.
Processes 11 03067 g014
Table 1. Overview of the examined input and output data.
Output FactorsRange of Values
Qef, effective capacity (m3/h)239.3–1782
Imax, maximum current consumption (A)25–1335
Nmax, maximum power consumption (kW)314.8–755.5
Pmax, maximum force consumption (kN)48.1–176.4
Emax, maximum energy consumption (kWh/m3)0.16–1.77
KLmax, maximum linear cutting resistance (N/cm)403.7–1276.7
KFmax, maximum areal cutting resistance (N/cm2)43–285
Input FactorsRange of Values
γ, coal unit weight (kN/m3)11.32–12.73
σp, coal compressive strength (MPa)4.11–6.26
c, coal cohesion (Mpa)0.83–1.67
φ, coal angle of internal friction (°)38.27–48.39
φL, excavator movement angle in the left direction (°)−76–90
φD, excavator movement angle in the right direction (°)−76–90
h, slice height (m)2.8–5.5
s, slice thickness (m)0.15–3.0
V0, velocity of the rotary movement of the excavator (m/min)6–22
Table 2. The most statistically significant two-factor interactions.
Significant Input Factors (p < 0.0001)Output Factors
φL × V0Nmax, Pmax, Emax, KLmax
φD× V0Nmax, Emax, KLmax, Pmax
σp × φLQef, Imax, KLmax
φL × φDQef, Emax
c × hImax, KLmax
φD× hKLmax, KFmax
σp × φDImax
φD× s, h × s, s × V0Emax
c × V0KLmax
σp × V0KFmax
Table 3. MSE of the DNN model with different optimization algorithms.
Optimization AlgorithmMSE (Training)MSE (Test)
Adam [26]0.01210.0191
AdaDelta [25]0.04340.0432
SDG [27]0.04250.0431
Table 4. MSE of the DNN model with a different number of nodes per hidden layer.
Model ConfigurationMSE (Training)MSE (Test)
512, 256, 128, Adam0.01420.0206
256, 128, 64, Adam0.01210.0192
128, 64, 32, Adam0.01130.0198
64, 32, 16, Adam0.02100.0199
Disclaimer/Publisher’s Note: The statements, opinions and data contained in all publications are solely those of the individual author(s) and contributor(s) and not of MDPI and/or the editor(s). MDPI and/or the editor(s) disclaim responsibility for any injury to people or property resulting from any ideas, methods, instructions or products referred to in the content.

