
A Study on a Knowledge Graph Construction Method of Safety Reports for Process Industries


1
Big Data Research Laboratory of Process Industry, Computer and Artificial Intelligence, Alibaba Cloud Big Data College, Changzhou University, Changzhou 213000, China
2
College of Microelectronics and Control Engineering, Changzhou University, Changzhou 213000, China
*
Author to whom correspondence should be addressed.
†
Current address: School of Computer and Artificial Intelligence, Changzhou University, Changzhou 213000, China.
Processes 2023, 11(1), 146; https://doi.org/10.3390/pr11010146
Submission received: 24 November 2022
/
Revised: 25 December 2022
/
Accepted: 25 December 2022
/
Published: 3 January 2023
(This article belongs to the Special Issue Machine-Learning-Assisted Intelligent Processing and Optimization of Complex Systems)
Abstract
:There are some representative reports in industrial safety engineering, such as the Hazard and Operability Analysis and Pre-Hazard Analysis; however, a large amount of industrial safety knowledge in the report has not been fully explored. In order to reuse and release the value of industrial safety knowledge, this paper constructs a new industrial safety knowledge extraction framework. The framework combines the asset management shell to summarize the knowledge concept entities of machine description language and model description language. According to the safety report template, the framework also constructs a new industrial safety knowledge-mapping standard structure. Specifically, firstly, considering that the knowledge structure of safety reports is different in different processes of the process industry, this paper innovatively proposes a general industrial safety knowledge-mapping standard structure, which provides a practical solution for the integration of industrial knowledge representation problems in different processes. Secondly, based on the research progress of named entities, this paper presents an industrial named entity extraction method (INERM) for the process industry. This method designs an entity weight model to calculate the entity weight of each sentence, and adds part-of-speech weight to improve the entity extraction algorithm, which alleviates the problem that the existing entity extraction methods cannot reasonably use the semantic information and context of word. Finally, we construct a triple of industrial safety knowledge based on the rules and store it in Neo4j. In this paper, four semantic-type templates and five semantic relation templates are constructed based on the new industrial safety knowledge map standardization construction process of the process industry. The comparative experiments show that the accuracy of the INERM on the test set is improved by 17 percentage points on average compared with other key entity extraction algorithms. A total of 1329 entities are constructed in the directional application example of the fluid transportation process, which provides a large number of references for the safety of the fluid transportation process and is more conducive to improving the safety guarantee of the fluid transport process.
1. Introduction
At present, many risk analysis methods are popular in the industry, such as the Hazard and Operability Analysis (HAZOP), which can provide safety analysis decisions for any process in the industry. HAZOP can predict the spread of dangerous events through the potential deviation in nodes in the system and propose effective solutions. The analysis results are eventually recorded in the HAZOP report in the form of text [1]. For example, a prior risk analysis (PHA) can analyze the types, distribution, occurrence conditions, and possible accident consequences of various risk factors in the project before carrying out a project activity, such as involving, construction, production, or maintenance [2]. It is stored in a security report as text. The common characteristics of these risk analysis methods make the industrial safety report contain a wealth of safety knowledge systems. However, the existing industrial safety reports have the following shortcomings:
(1) Industrial safety reporting is an expert-driven engineering design in the form of brainstorming [3]. It relies on the experience and real-time judgment of experts, which makes the analysis time-consuming and laborious, and it may not be comprehensive. The current methods such as HAZOP and FMEA, given human limitations, are not providing confidence that these will lead to a complete inventory of all the significant possibilities [4].
(2) For the same process, various HAZOP reports appear in the analysis strategies of different expert teams [5], making the industrial safety knowledge extraction process more difficult.
The core of the above problem is that human factors cannot be excluded. In each stage and step, various human factors will harm the quality of learning [6]. Previously, some studies attempted to reuse industrial safety knowledge in a computer-aided manner. In 2013, Nicola Paltrinieri designed a tool to support the identification and assessment of atypical potential accident scenarios related to the considered material, equipment, and site [7]. Manuel Rodríguez introduced a tool for the semi-automatic HAZOP study of process units. The diagnostic system used an expert system to predict behavior modeled using d diagrams [8]. Faisal I. Khan developed an expert system for automating HAZOP (HAZard and operability) studies [9]. With the rise of artificial intelligence, some studies focused on introducing natural language processing technology into HAZOP reports mining semantic information and industrial safety knowledge. In recent years, research at the safety reporting level was applied by some scholars due to the rise of natural language processing techniques. Hu proposed a fault diagnosis method that combines HAZOP with a dynamic Bayesian network inference to reveal early deviations in the causal chain of faults [10], which is important for emergency decision making. Feng (2021) used a deep learning approach to classify the consequences reported by HAZOP according to the severity of consequences [11]. Wang et al. designed a variety of novel active learning algorithms to construct entity recognition models and mine industrial safety knowledge in HAZOP reports, which is of great significance for improving industrial safety. Zeng (2021) conducted a comprehensive analysis of the causal factors of a chemical park or enterprise explosion [12], extracted the entities and relationships in chemical safety knowledge, stored them in Neo4j, and presented them in a visualized form. The knowledge-mapping technology in the chemical safety field provides ideas for the follow-up. Wang proposed HAZOP-based industrial safety knowledge mapping [13], which developed a standardized framework for safety reports through deconstruction and generalization [14] and realized the integration, sharing, and reuse of industrial safety report knowledge. The aforementioned studies are mainly aimed at alleviating the problem of this paper and lack in-depth research on the issue. In this study, the new knowledge graph connecting data science and engineering design inspires [15,16,17,18], and we propose a new industrial safety knowledge graph integrating matter of fact, which is based on industrial safety reports and can improve the effective comprehensiveness of safety reports. First, because the knowledge structure of different processes in different process industries is different [19], for example, the “low-low interlock” of the oil and gas inlet process and the “open valve” of the vaporization process are different, we analyze and summarize and creatively develop a general safety knowledge standardization framework for industrial safety report extraction in a top-down manner. The safety knowledge standardization framework contains safety knowledge ontology and safety knowledge relations, which can standardize the safety reports of different processes and unify the representation and integration of different types of safety knowledge as a practice to broaden the research field of industrial safety engineering design. Secondly, considering the specificity of the text, a novel and reliable information extraction model (INERM) based on deep learning and data science is selectively conceived in safety report text, and the INERM consists of four modules: BERT, with a powerful linguistic representation and feature extraction capability to extract semantic features [20], and a bidirectional long- and short-term memory network (BiLSTM) to obtain the INERM extracts the industrial safety knowledge. Finally, the industrial safety knowledge triad is constructed and stored in a Neo4j-based graphical database.
The INERM can extract industrial safety knowledge from safety reports based on a standardized framework of safety knowledge. We take potential safety knowledge in fluid transportation processes as an example to construct a knowledge graph of fluid transportation safety, which can integrate, share, and reuse safety knowledge and also inspire other researchers. Our main contributions are as follows:
(1) Inspired by the new knowledge graph connecting data science and engineering design [15], we propose a new industrial knowledge graph structure with safety reports as the carrier, which can enhance the value of industrial safety knowledge and improve the knowledge reuse and efficiency of safety reports;
(2) A standardized framework of industrial safety knowledge based on the idea of an asset management shell to provide digital representation for assets is proposed. Our work is about discovering this atomized asset-based representation of the concept, or how assets are accurately represented in the knowledge-mapping domain, and practicing this asset representation application in the oil and gas transportation process. It can provide a structured representation scheme for different safety reports to represent industrial safety knowledge in a unified way with different expressions to achieve the expressibility of industrial safety knowledge;
(3) Through the BERT-BILSTM-CRF-TFIDF model and formulating dynamic data update rules based on the characteristics of the industrial safety knowledge in this paper, industrial safety knowledge can be extracted effectively, which provides a structured and logically feasible solution for the process industrial safety knowledge extraction;
(4) The application of industrial knowledge-mapping orientation for the fluid transportation process is carried out, which can effectively reduce the safety hazards of the gathering and transportation process, optimize the safety decision awareness, and strengthen industrial safety.
2. Related Work
In this paper, we combine safety reports, asset administration shells, and knowledge graphs together, so we carry out the related research work on safety reports, asset administration shells, and knowledge graphs, respectively.
2.1. Knowledge Graph
Applying knowledge graph technology to the industrial domain requires first realizing the formal representation of domain knowledge, i.e., realizing a machine-understandable knowledge representation under multimodal data requirements [21]. In the direction of the formal representation of industrial domain knowledge, the key technical means involved contain the predicate logic knowledge representation method [22], the framework-based knowledge representation method [23], the semantic network-based knowledge representation method [24], and the ontology-based knowledge representation method [25]. The current representative works on ontology-based knowledge representation methods in the industrial domain include the following: for product design process knowledge and manufacturing process knowledge, Chhim et al. developed ontologies that unite the two types of knowledge and tried to apply them to the knowledge reuse process; for process design knowledge [16], Guo et al. considered the process knowledge characteristics and domain scope [25] and proposed a logical architecture of process knowledge management based on ontology; for the whole life cycle knowledge of the manufacturing domain, Liu et al. [26] proposed a multi-level and multidimensional knowledge expression model based on ontology to realize the structured and dimensional representation of manufacturing domain knowledge; and for collaborative design knowledge, Bock et al. explored the method of combining ontology and model-based technology for collaborative design [27]. It can be seen that the current ontology-based knowledge representation methods in industrial fields have gained extensive research, and the research scope involves the creation of multidimensional ontologies for design processes and manufacturing processes, which provides a basis for the subsequent automatic construction of knowledge graphs.
In the process of practical application in enterprises, the ontologies constructed by existing scholars can be used as the basis to improve the efficiency of enterprise knowledge ontology construction. However, the ontologies constructed in the existing studies are often not highly detailed, and the application process needs to be expanded according to the actual enterprise needs. Huang et al. (2022) designed a KG-based automatic knowledge base construction method for the machining domain, which overcomes the disadvantages of the traditional method of being time-consuming, and constructed a knowledge-mapping-driven method for optimizing equipment resource allocation [28], which improved equipment utilization as well as equipment machining flexibility, while integrated knowledge reuse also reduced the cost of optimally allocating manufacturing resources required for machining tasks [29]. Wang proposed the industrial safety knowledge graph with HAZOP as the carrier and developed a standardized framework for safety reporting through deconstruction and generalization [13], realizing the integration, sharing, and reuse of industrial safety reporting knowledge. Wang analyzed report text mining based on the harm and operability of active learning [30].
The above-mentioned work began to apply knowledge graph technology to the industrial field, but the research rarely involved a large amount of knowledge reuse of industrial safety reports, so knowledge graph technology could not be used from a safety perspective. We have designed an industrial safety knowledge graph construction technology with safety reports as the carrier, which can effectively enhance the value of industrial safety knowledge, improve the knowledge reuse and efficiency of safety reports, and can also escort industrial safety.
2.2. Safety Report
The industrial safety report emerged to predict the propagation of hazard events through potential deviations in nodes in the system and to propose effective solutions. This core feature is more logical and, as an industry-recognized report template, it can be a powerful aid to the structuring of industrial safety knowledge. The main presentation forms of industrial safety reports are [31] the Job Hazard Analysis (JHA), Failure-Type Effects (FMEA), PHA, Event Tree (ET), Accident Tree (AT), Operating Conditions Hazard Evaluation Method (OCHE), HAZOP, Quantitative Risk Assessment (QRA), Layer of Protection Analysis (LOPA), risk-based risk assessment-based equipment inspection techniques (RBI), safety integrity-level analysis (SIL), and failure assumption method (WI). Safety reporting is an analytical process of reverse reasoning whose main purpose is to explore systematically and in an organized manner whether there are hazards in process equipment or facilities [32] and which provides the necessary decisions to eliminate and reduce the hazards in the process and mitigate the consequences of accidents. Currently, safety reports have achieved great success in various process industries widely used in various processes and have achieved excellent performance [33]. For example, in the natural gas boosting process, q Yang et al. (2021) analyzed the main hazards and causes of the generation of piston gas compressors in a safety report PHA environment, which improved the staff’s ability to prevent hazards [34]. Most of the improved quantitative and semi-quantitative methods are based on the LOPA, using the LOPA as a database to solve the problem of overly conservative traditional safety reports [35]. Li used the HAZOP analysis method to analyze the preliminary design of a natural gas distribution field station as an example [36]. Lu et al. introduced the phenol hydrogenation reaction of a company’s 100-ton-per-year cyclohexanone unit, selected the unit reactor to produce cyclohexanone with higher risk, and used the LOPA to conduct a further analysis to quantify the frequency to determine whether some protection is sufficient [37]. Based on the current abundant and important industrial safety report templates, we innovatively design a common expression structure so that the knowledge of safety reports can be effectively utilized and knowledge reuse and expressible work can be realized.
2.3. Asset Administration Shell
An asset administration shell (AAS) is intended to be a standardized digital representation of assets. According to its goals, it has the potential to integrate all data generated during the PLM process into one data model and to provide a universally valid interface for all PLM phases [38]. The asset administration shell, as a component of Industry 4.0, has the three-layer concept of RAMI4.0 for communication, information, and functionality.
RAMI4.0 integrates the key elements of I4.0 components into a structured and hierarchical model; the AAS is a virtualized, digital, and active representation of I4.0 components. The “inventory” is considered a catalog of data that represents the meta-information of the assets and is an important component of the virtual representation. In addition to the meta-information, the “inventory” also includes the connection relationships between the management shell and the assets, as well as information related to security capabilities [39].
The IEC/TS 62832-1 standard defines the concept of an asset class to describe a set of assets with common characteristics in a digital factory, each specific asset being directly or indirectly derived from an asset class. The structure of the asset class consists of two parts, the leader and body, where the leader contains the identification information of the asset class and the body mainly contains the identification information of the asset class. In the asset class, the specification of the definition of data elements shall follow the principles defined in IEC 61360 for the characteristic data structure. These property data structures have been fixed in the form of a database called the Common Data Dictionary (CDD) and used as the base data model [39], together with the lists of equipment characteristics (LOPs) in the IEC 61987 series of standards to form the Property Database reference system for assets, which becomes the enabling technical framework for building an AAS. Drawing on the idea that the AAS takes the standardized digital representation of assets as its main theme, our work is to discover the conceptual expression of this asset-based atomization. This article will demonstrate how assets are accurately expressed in the field of knowledge mapping and how assets are applied in the process of oil and gas transportation.
3. Methods
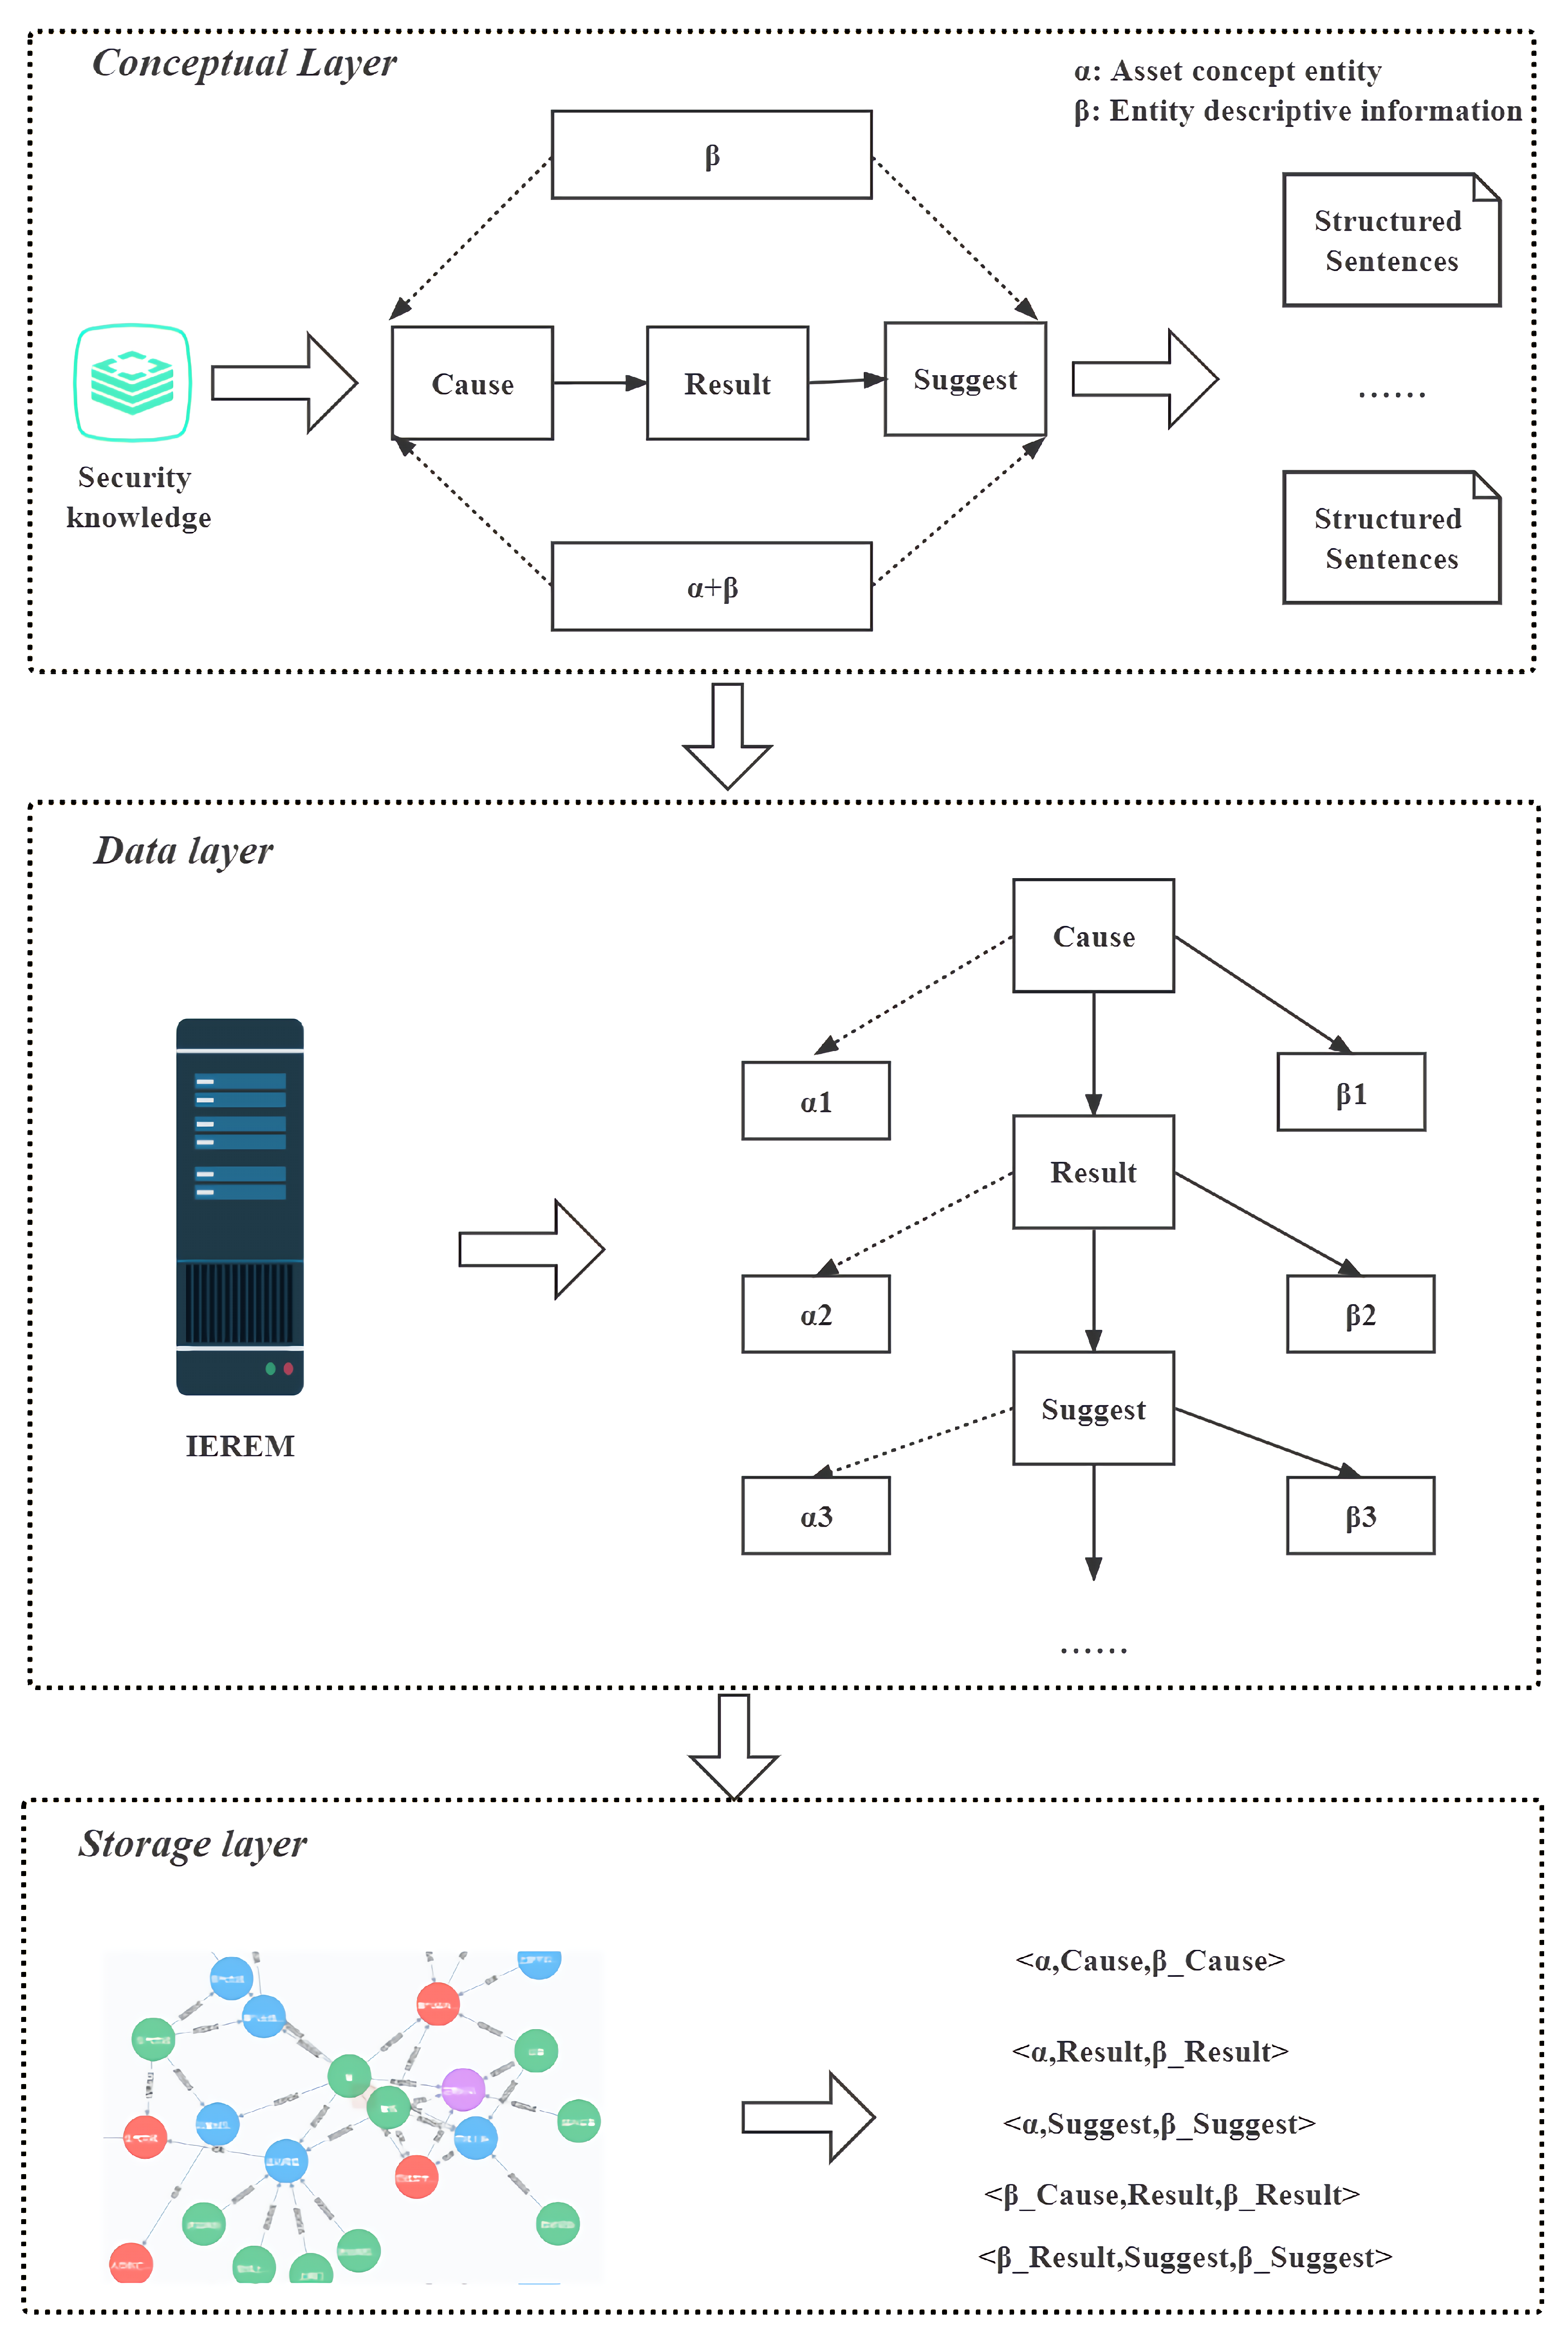
In the following section, we describe the process of developing industrial safety knowledge in the form of safety reports. First, because the safety reports of different processes in the process industry contain different knowledge, we innovatively build a general industrial knowledge standardization framework at the “conceptual layer” to structure the safety reports of different processes and represent the industrial safety knowledge of different processes in a unified manner. Then, considering the specificity of safety texts, we combine data science to conceive an artificial intelligence-based INERM model, which can extract industrial safety knowledge from safety reports based on the industrial safety knowledge standardization framework, called the “extraction layer”. The quality of the conceptual layer and the extraction layer will directly affect the quality of the knowledge graph, which is the focus of this paper. Finally, in the “storage layer”, we construct industrial safety knowledge triads based on the extraction results of the “extraction layer” and store them in the graph database. The overall structure is shown in Figure 1.
3.1. Conceptual Layer
Safety reports contain different knowledge for different processes in the process industry, such as fans and compressors in the fluid transport industry, and even within the same process, as safety experts have different focuses [40]. Therefore, the design of industrial safety knowledge entities and their relationships faces a great challenge. To address this difficulty, we propose a process industry safety knowledge standardization framework to standardize the safety knowledge information of different processes and to represent the industrial safety knowledge of different processes uniformly. In addition, we design a generic process industrial safety knowledge expression relationship.
Due to the existence of a large number of obscure and difficult professional terms in the safety report, it is impossible to adopt methods such as clustering and merging to describe the industrial safety knowledge ontology. Therefore, we try to use the main structure of the safety report as a breakthrough. Inspired by the international standard IEC 61882 [41], we use a top-down approach to systematically parse safety reports. First, we decompose safety reports into various hazard event processes, then decompose them into generic structures, and finally obtain an industrial safety knowledge ontology.
We decompose the safety report into a set of entities . The is briefly described as follows:
(1) C: Cause entity, which is derived from the abnormal causes in HAZOP and the formation causes in PHA, such as “transport system failure” and “flow control valve FVC closed”, “coil blockage”.
(2) R: Resulting entity, derived from consequences in HAZOP, consequences in JHA, event description in LOPA, consequences in PHA, e.g., “liquid crude oil without vaporization flows into the transport system”, “crude oil in the vaporizer will boil”.
(3) S: Recommended entities, derived from the recommended measures in HAZOP, recommendations in LOPA, control measures in JHA, and preventive measures in PHA, e.g., “Clean the coils” and “Shut down the FCV linkage”.
The diagram category is appropriately divided into string and inverse tree , positive tree , and tie tree according to the differences between entities in , as shown in Equation (1).
Among them, is the simplest , which contains only a single causal chain of relations. For , different causes produce the same result, and it is a very tricky problem to analyze by exhausting all the causes. In the structure, each result generates multiple suggestions, which creates more obstacles for subsequent work. is the most complex, integrating , , and . In general, industrial processes are closely connected, and if one process fails, it will affect the others. Therefore, has also gained the attention of industry professionals as a key structure in the field of process industry safety. Equations (2)–(5) are their definitions.
Furthermore, we denote each entity in each EL in the form of “”, where denotes the asset concept entity corresponding to the asset in the asset management shell (an asset is an “object of value to an organization”), and denotes the descriptive information of the concept entity, e.g., the “failure” of the “supply system failure”. “failure” is the descriptive information about the “failure” of the concept entity “feed system”. and , as a general framework of basic knowledge, can be used to represent safety reports and form industrial safety knowledge ontologies () from them. We transition the possible pitfalls of such a corpus by treating assets as possible components of entities, as shown in Equation (6).
The general framework of industrial safety knowledge constructed in this paper differs from the general knowledge graph in that there is no general sense of the relationship between industrial safety knowledge in safety reports. For example, “the main character of the movie Drunken Fist is Jackie Chan”, “Drunken Fist”, and “Jackie Chan” have the relationship of “main character”, but in the industrial field, “Drunken Fist” and “Jackie Chan” have the relationship of “main character”. However, in the industrial field, the “carburetor overload”, there is no relationship. Therefore, to overcome this obstacle, it is necessary to step out of the traditional shackles. The nature of safety reporting leads us to the following discussions:
(1) Industrial safety knowledge relationships aim to connect industrial safety knowledge into an organic whole. Safety reports usually have potential categories, such as PHA with multiple categories consisting of risk factors, consequences, formation causes, and preventive measures. Safety report as the carrier of the relationship can be equated to the key elements in the industrial safety report template collection V: cause, result, and recommendation;
(2) Safety reports take time toward the implementation of safety measures for prevention, and their own characteristics of the order of execution in terms of the causes and consequences of events make the execution more logical.
Therefore, we follow the execution logic of safety reports in a novel way by using industrial safety knowledge attributes as relations of ISK, with the relation links shown in Equations (9) and (10).
In summary, we have completed the construction of the conceptual layer of the industrial safety knowledge ontology in this section; studied how the knowledge categories, including those specific to industrial safety reports, are transformed into relationships; and proposed a novel unified structure of industrial safety knowledge that enables the reuse and structured representation of industrial safety reports for different processes. The unified structure of industrial safety knowledge is an industrial safety engineering design practice, which expands the perspective of industrial safety engineering design and provides ideas for academic researchers. We also believe that it can help realize the intelligent and automated expression of knowledge in the field of industrial safety.
3.2. Extraction Layer
The general structure of the knowledge graph is a triadic structure of entities through relationships to another entity. The extraction layer should address both entity extraction and relationship extraction. Because the industrial safety knowledge relationships are already identified in the conceptual layer, this section focuses on how to perform the extraction of entities. The current security report text mainly has the following characteristics:
(1) A wide variety of long entities. For example, “safety switch installation set machinery”, “compressed gas regulation system”, “gas mains and gas cabinet water of gas cabinet”;
(2) Diversified entity nesting. For example, “gas main pipe of gas cabinet and gas cabinet water”, “overflow pipe of gas washing tower”, “water jacket or steam ladle constitutes a closed system”;
(3) Plenty of technical terms, such as “valve diversion" and “opening degree”;
(4) Even in the same process industry scenario, different experts usually have different semantic expressions for the same incident. For example, statements are inverted (“low flow initiates FAL”), and subjects are omitted (“no crude oil inflow”), so the text is more diverse.
It is worth noting that in the unified structure of industrial safety knowledge (ISKG), safety reports such as ISKG(, ) (ISKG with and content) or ISKG() (ISKG with content), and are intertwined, e.g., “The Roots blower pumped negative pressure, allowing air to enter the system and mix with semi-water gas”. How to extract entities from security reports with such characteristics is a problem worth considering. Therefore, inspired by the new knowledge graph connecting data science and engineering design, we design an advanced industrial safety information extraction model, INERM, which is a named entity information extraction model with a mixture of multilayer neural network and machine learning. We will describe the extraction layer from three aspects: security report dataset, INERM, and experiment.
3.2.1. Safety Report Dataset
First, we extract unstructured data from professional websites, such as China Industrial Safety Network, China ChemNet, Oil and Gas Storage and Transportation Network, and Aerospace Cloud Network, and search websites, such as Baidu Encyclopedia, Wikipedia, and Baidu Library. We preprocess them to obtain the original text of safety reports and collect 12,948 safety reports from the original text by data cleaning and segmentation operations and rule-based methods.
BIO is a classical and common annotation method in the field of named entities: B means the word is at the beginning of an entity (Begin), I means inside (Inside), and O means outside (Outside). A group of BI can form an entity (Single), another expansion B_x expresses the beginning of entity category x, I_x expresses the end of entity category X, O indicates that it does not belong to any type. We adopted the BIO annotation method to label 8000 security descriptive sentences with different relationships. Our definition of entity categories is shown in Table 1. Finally, we split the security description corpus sentences into 80% training sets, 10% verification sets, and 10% test sets.
3.2.2. INERM
Bidirectional encoder representations for transformers (BERT) is a transformer’s bidirectional encoder designed to pre-train deep bidirectional representations from an unlabeled text by conditional computation common in left and right contexts. For a more accurate logical structure of R() in security reports, NEST sentence prediction (NSP) can predict better. However, the coexistence of multiple entities in safety report information often leads to the problem of correct linkage of entities. For example, “equipment and piping are not observed in manufacturing, inspection, and maintenance, and are inherently defective”, where there are multiple causal entities and only one factor, “defective”, leading to undesirable consequences, while “Inspection and maintenance are not observed” will not lead to adverse consequences. To solve, we provide a more natural way of thinking: calculate the entity weight of each entity based on the entity contribution weight model of BERT-biLSTM-CRF, then improve the Term Frequency-Inverse Document Frequency (TFIDF) algorithm by combining the entity weight of each candidate key entity, and finally retrieve and extract the key entity.
In conclusion, INERM is mainly composed of BERT, bidirectional long short-term memory (BiLSTM), conditional random field (CRF), and TFIDF. BERT extends and enriches semantic features. BiLSTM is used to obtain context information and information from the long-distance-dependent encoder. CRF can calibrate the order and relationship between labels to obtain the global optimal prediction sequence. TFIDF extracts key entities through statistical features. Figure 2 shows the overall framework, where the input to INERM is the security report description and the output is the corresponding entity. First, token embedding (sentence embedding and position embedding) generated by the security report description is trantokensmitted to BERT, Then, BERT converts the joint embedding into semantic vectors containing semantic features and passes them to BiLSTM. Next, the BiLSTM uses a pair of bidirectional LSTM to encode the semantic vector to obtain a context vector with context characteristics. Finally, CRF calibrates the order and relationship between tags, the entity link rules constrain the output of entities, and TFIDF decodes the context vector to output the entity sequence with the maximum probability. A detailed description of each module follows.
BERT
Language model pre-training can effectively improve many natural language processing tasks [42], where the BERT pre-training model is based on a bidirectional multilayer transformer model, and the transformer model is based on encoder–decoder and attention mechanisms [43]. The BERT model removes the limitation of self-attentiveness of the unilateral context (above or below) through the bidirectional self-attentiveness mechanism [44]. Applying the BERT pre-training model achieved better results in several natural language processing tasks.
In this paper, we use the model BERT, which is constructed as follows. First, the joint embedding of word embedding and location embedding is passed to the multi-headed attention layer. The attention distribution is obtained by the formulae of the multi-headed self-attentive layers q, k, v. Then, the vector e and the vector a are normalized to obtain , and is transferred to the feedforward neural network (FFN) to obtain a deeper representation of the vector . Finally, the vector f and the vector are layer normalized once more to obtain the output vector . The multi-headed sub-attention layer is the core of BERT, which solves the problem of long-range dependence on RNNs. The self-attention of BERT is shown in Equation (11).
where is the query vector, is the key vector, is the value vector. Q, K, and V are obtained by linear mapping of the different weights W of the vector E, which have the same dimension. It is worth noting that where is the dimensionality of K. In addition, we apply the Chinese BERT pre-training model released by Google on GitHub, which is trained using the Chinese Wikipedia corpus. The specific parameters of the model are introduced as shown in Table 2.
In this paper, we extract the output of the last 4 layers of the pre-trained BERT model to calculate the sentence vector. Assuming that is the output of the penultimate i layer of the pre-trained model with time step j (0 < i < 5, 0 < j < 41), the sentence vector is computed as follows. First, calculate the average of the output of each layer:
The entity vector B is the merge of the mean of the four layers.
That is, if the input text is a sequence of text tweens containing more than 3 entities, the final output B is a two-dimensional matrix, , where l is the text length and H is the BERT model output vector dimension 768.
BiLSTM
BiLSTM is a special recurrent neural network that has been used as a tool for processing long time-series data and consists of the following three main parts. The first part is the information transfer part, where the input value is a coefficient of in the interval [0, 1], which is a mapping of the sigmoid function of based on the output value . If is 1, the whole will be retained. If is 0, the whole will be discarded as shown in Equation (14). Then comes the information addition part. First, the hyperbolic tangent (tanh) generalization is performed on and simultaneously to generate the candidate vector ; then, the sigmoid functionalization is performed on and simultaneously to generate the weights W to regulate the update of ; finally, the superimposed state vectors and to update , as shown in Equation (15). The third part simultaneously sigmoid functionalizes and to generate weights , interacting with the functionalized to obtain , as shown in Equation (16). These operations give the LSTM the ability to memorize and retain only important features, which can alleviate the problems of poor long-term dependence, gradient disappearance, and gradient explosion [13].
The entity weight recognition model proposed in this paper is namely a sequence-labeling model for textual entity sequences.
Among them, LSTM solves the problem that the standard RNN model disappears when the time lag between the relative input event and the target signal is greater than 5–10 discrete time steps [44] and has a wide range of applications in sequence-labeling-related tasks. The entity contribution recognition in this paper is a sequence-labeling task, and its processing of the current time-step semantic data requires both previous and subsequent semantic information, compared to standard RNN, LSTM cells add input gates, output gates, forgetting gates, a single LSTM cell as shown in Figure 3.
Assuming that the input sequence is , which is the sequence of text vectors containing entities obtained by the BERT pre-training model, the LSTM cells are represented as follows:
where is the input gate, is the forgetting gate, is the cell state, is the output gate, is the hidden layer, is the activation function, W is the weight parameter, b is the bias parameter, and W as well as b are the parameters to be trained in the model. The network structure is shown in Figure 4.
The BiLSTM is a superposition of a forward LSTM and a backward LSTM, and the output equation of a single-layer BiLSTM is as follows:
is the output of the hidden layer with forward LSTM time step t in BiLSTM, and is the output of the hidden layer with backward LSTM time step t.
CRF
BiLSTM treats each label as an independent existence and focuses more on the maximum probability of the labels without considering the dependency relationship between labels, which leads to confusing prediction information. INERM introduces CRF as a decoder to solve the above problem. CRF can calibrate the order and relationship between labels to obtain the globally optimal prediction sequence. The maximum likelihood estimation loss function of CRF is shown in Equation (19). It should be noted that after obtaining the entity label, the entity link rule constraint is performed, and the specific constraint is seen in the storage layer (Section 3.3).
where is the input sequence, is the sequence of predicted entities, is the actual entity sequence, and is the sum of the firing and transition fractions.
BERT-BiLSTM-CRF-Based Entity Weight Calculation Model
The structure of the BERT-BiLSTM-CRF-based entity vector weight calculation model, i.e., the entity identification model. The entity vector weight calculation model based on BERT-BiLSTM-CRF is the entity identification model. The sentence vector sequence preprocessed by BERT is input to the BiLSTM model, and the output is the hidden vector H. The output of the hidden layer of the BiLSTM model enters the CRF to correct the entity labels at each time step, and then the classification is performed by the classifier to complete the entity identification. The selected classifier is a softmax classifier with the following equation:
where W hidden layer output, H classifier parameters. Suppose the final trained BiLSTM model is a function g, the BERT Chinese model is a function f, and the input text sequence is , then the probabilities of entity categories (key entities (category 0), minor entities (category 1), and common entities (category 2)) in the model text sequence are calculated by sentence vectors as follows:
where arguments of the maxima (argmax) is the function to determine the position of the maximum value.
TFIDF
TFIDF is a common method to extract keywords by statistical features. Among them are TF Term Frequency, which is used to quantify the ability of a word to summarize the subject content of a text, and IDF, which refers to Inverse Document Frequency, which is used to quantify the ability of a word to distinguish different categories of texts. In this paper, we add sentence weights and external corpus to improve the TFIDF algorithm.
TF Calculation
The traditional TF calculation only takes the number of occurrences of a candidate word in a sentence as the ability of the word to summarize the text topic content, ignoring the semantic and contextual information, and thus cannot correctly represent the ability of the word to summarize the text topic content. In this paper, we propose the TF value algorithm for adding sentence weights, and the TF value for the entity in the jth sentence is calculated as follows:
where is the number of occurrences of entity in the jth sentence, to balance the effect of sentence length; entity in the lth occurrence of the jth sentence.
The sentence contribution weight that is introduced as follows. Firstly, the probability that an entity in a sentence belongs to each type is calculated by the entity contribution weight calculation model, then the entity type is the class with the highest probability. Because different entity types correspond to different entity contribution weights, we use the parameter to control the effect of type on the sentence contribution weight.
Calculation of IDF values by applying external corpus
The traditional IDF value is calculated as the log value of the ratio of the number of texts with candidate words to the total number of texts, which ignores the distribution of candidate words among different topics, e.g., the word “accident” occurs in almost all of the safety report corpus. In this paper, we apply the external corpus value algorithm, i.e., in the process of IDF value calculation, the external general corpus is added to the safety report sentence corpus, and the corpus for calculating IDF value is the set of external general corpus and safety report corpus, and the formula for calculating IDF value of words in the jth sentence is as follows:
where D denotes the set of security report sentences and d denotes the set of external corpus sentences, where shows the total number of sentences in the original corpus and the external corpus merged set, the number of sentences with words occurring in the corpus and the external corpus set.
TFIDF value calculation
The TFIDF value is the product of the TF value and the IDF value, and the TFIDF value for the entity in the jth sentence is calculated as follows:
Experimental results
The metrics precision (P), recall (R), and F1-score (F1) are used to evaluate the extraction performance of INERM. P: P in this paper refers to how many of the keywords extracted by the algorithm are correct and are calculated. The expression is as follows:
R: R in this paper refers to how many correct keywords are extracted by the algorithm in a sentence and are calculated. The expression is as follows:
m is the number of correct key entities extracted, is the number of key entities extracted, and is the number of keywords in the text itself. F: The F-value is the weighted summed average of the precision rate P and the recall rate R, calculated as follows:
In this paper, we determine the sentence contribution weight parameter experimentally, compare the model results of choosing different on the training set, and select the best value. Considering that most of the key entities of each sentence in the product development knowledge corpus are 2–4, the algorithm selects the first 4 as the key entities for each sentence. The performance of the algorithm corresponding to different values on the training set is shown in Table 3. When the value in the table is 0.6, the accuracy of the model on the test set and the verification set is on average 8 percentage points higher than other values. Therefore, the value selected is 0.6.
The keyword extraction algorithm proposed is used to verify the algorithm. Considering that there are different kinds of key entities in each sentence of the industrial safety report corpus, the total number of key entities is 1–4. For each sentence algorithm, 1–4 different types of key entities can be extracted. It should be noted that the common hyperparameters for all neural networks are the same in both evaluation and comparison experiments. For example, we use the Adam optimizer with a learning rate of , the ReLU activation function, and train 30 epochs on the validation set and the test set for all models. In order to confirm the extraction effect of INERM, this paper conducts a comparative experiment on different algorithms to predict all entities on the test set. The comparison results are shown in Table 4. The results show that INERM has a strong extraction performance. The results show that INERM is feasible in the task of industrial safety knowledge extraction.
In the table, the F score of the INERM predicted entity in the test set is 67.5%. From the overall comparison experiment results, the accuracy of the existing models on the test set is far less than 67.5%. In addition, the overall performance of all models in P, R, and F scores is far less than that of the INERM model. In the comparison of the F value, INERM is 19 percentage points higher than BERT, 21.4 percentage points higher than BiLSTM, and 15 percentage points higher than the most classic combination model BERT-BiLSTM-CRF. The results show that INERM has a strong entity extraction performance and also prove the feasibility of INERM in the field of industrial safety. We believe that it can make an important contribution to the task of industrial safety knowledge extraction.
3.3. Storage Layer
We show the industrial safety knowledge graph triad constructed by the relationship between industrial entities and settings in the form of Equation (29). Where the set of the industrial safety knowledge-mapping triad consists of node head and node tail , which are both industrial safety entities, and two nodes are connected with an edge e, which denotes the relationship located between the two entities. Specifically, each industrial safety report node description is taken as input. By extracting the entities ( and ) in the input, element relationships are embedded between and in turn. Considering the possibility of multiple C and S, the triples about R are first constructed from both ends of the input, and then the triples about C and S are constructed.
We import the industrial safety knowledge-mapping triad into the Neo4j graph database (Miller, 2013; Zhe Huang et al., 2020; W. Huang et al., 2020; Kim et al., 2021) to complete the non-normative industrial safety knowledge mapping. It is worth noting that the results recorded in the industrial safety reports are standardized and accurate with multiple analyses by expert groups, and even though the words are very close to each other literally, each word still has a unique meaning, such as “process pipeline” and “pipeline”. In addition, due to the complexity of the process, some entities and relationships are redundant. Therefore, to address the above issues, we adopt a set of regular entity linking rules as follows:
(1) Multiple logical words of the same kind of entities are linked as one entity, and each iteration is merged into the entity library. For example, if “gas main pipe of the gas cabinet”, “gas cabinet”, and “gas main pipe” are all asset entities, at this time, due to the logical word “of”, you can consider “gas master of the gas cabinet” as the same asset entity. Similar logical words are “on, attributed to, attached to, attributed to, in… on, contains… in”;
(2) The larger the length of the entity, the higher the priority of the association. The larger the length of an entity that has been linked to the entity library, the clearer the meaning of the entity and the more representative of a key entity, such as “ammonia production key equipment nitrogen and hydrogen compressor”, which is more representative of “ammonia production key equipment” than “ammonia production key equipment”. For example, “ammonia production critical equipment nitrogen and hydrogen compressor” is a class of entities compared to “ammonia production critical equipment”. Therefore, when linking entities, it is preferred to associate entities with greater length to the entity library;
(3) If there is only one key entity in a sentence, the key entity is linked to the entity library first;
(4) When there are multiple concurrent entities in a sentence, the entities should be split and linked to the corresponding entities. For example, “Carbon is a kind of flammable material, which is prone to spontaneous combustion under the conditions of high temperature and superheat accidental mechanical impact, airflow impact, electrical short circuit, external fire and static spark”, where “airflow impact”, “high temperature and superheat”, “accidental mechanical impact”, and other causes may lead to the result of “carbon spontaneous combustion”, so it should be split into multiple cause entities, respectively associated to the “carbon spontaneous combustion". Therefore, it should be split into multiple cause entities and linked to the resulting entity of “carbon self-ignition”;
(5) For an entity extracted from INERM, if its degree of repetition with the entity in the entity library is greater than , it is considered to belong to the corresponding entity in the entity library. In this paper, all kinds of industrial safety entities are composed of asset entities and descriptive language. If the asset entities are the same and the repetition of descriptive language is 80%, they are considered to be the same entity.
It should be noted that this entity linking rule is also used in the extraction layer (CRF).
4. Case Study
In this study, we have studied fluid transportation processes in the industry. Due to the danger and complexity of the gathering process, the safety production of the gathering process has become the focus of attention of society. In the process of oilfield development, the gathering process plays an important role, which not only determines the overall level of oilfield development but also effectively improves the social and economic benefits of oil and gas enterprises. To this end, we collected a total of 1745 analytical records for the multi-programmed processes of fluid transport (gravity transport, vacuum transport, and evaporative transport) and established a knowledge map of industrial safety reports. For example, for fluid transport, Figure 5 shows the standardized industrial safety knowledge graph structure, and it is noteworthy that some nodes and relationships in the knowledge graph have been constrained by entity linking rules.
Safety-oriented knowledge-mapping applications, such as industrial safety knowledge-mapping visualization, industrial safety knowledge-mapping retrieval, and risk propagation reasoning, can explore and expand the value of industrial safety knowledge mapping and further improve its value to enhance the execution efficiency of industrial safety reports, which is important to improve the safety of the system. It can provide expandable practical applications for industrial engineering design and industrial safety integration, and the following are application-specific descriptions:
(1) Industrial safety knowledge graph visualization. The visualization process is shown in the Figure 6. The green circle is the asset entity, the blue circle is the cause entity, the red circle is the result entity, the purple circle is the suggestion entity, and the arrow indicates the relationship between various entities. The arrows between green and blue represent the cause composition relationship, the arrows between green and red represent the result composition relationship, the arrows between green and purple represent the measure composition relationship, the arrows between blue and red represent the result relationship, and the arrows between red and purple represent the measure relationship. We take the nodes in Figure 6 as an example. In the process of a raw gas inlet, the raw gas enters the inlet cut-off valve magic Kui and the clear pipe acceptance device to the separator inlet. The industrial safety knowledge mapping uses the state ’not closed’ (cause entity) corresponding to the asset ’receiving ball cylinder bypass valve’ (asset entity) as the starting point for the hazard analysis and extends the consequences, ’the gathering of raw material gas causes fire and explosion hazards’ (result entity). This is a very logical result. Through the above process, it is clear that industrial safety knowledge mapping can visually show that after the ’not closed’ cause, it results in an ’explosion hazard’. This hazard process can be determined to take ’increase pressure low low interlock Shutdown’ (suggestion entity) measures. Industrial safety knowledge-mapping visualization reduces the error rate of hazard detection and provides a reliable solution with greater completeness and safety;
(2) Industrial safety knowledge-mapping search. We need industrial safety knowledge maps that can be efficiently located and present us with relevant information. For example, when we retrieve an incoming valve set, its collector branch (operating pressure rise), cause status (false shutdown), and equipment assets (HH interlock, upper valve, and collector branch) can all be provided by the industrial safety knowledge map. The resulting process allows employees to more fully grasp the industrial safety knowledge mapping and become familiar with the corresponding requirements for process safety and the related operations;
(3) Auxiliary industrial safety reporting. When an accident occurs, operators can locate the consequences of a hazardous event and trace the cause of failure through industrial safety knowledge mapping based on abnormal phenomena to quickly make suggestions and effectively eliminate hidden dangers, which is of great significance to further improve the safety of the system;
(4) Hazard propagation reasoning. Omissions in industrial safety reports are inevitable. To further improve the industrial safety report, risk reasoning can be realized through industrial safety knowledge mapping to correct and make up for the industrial safety report. Industrial safety knowledge mapping can infer other possible propagation paths of accidents based on the paths between existing entities, which makes the whole safety protection process better and also assists experts in brainstorming to optimize industrial safety reports and achieve better knowledge accuracy.
In conclusion, the industrial safety knowledge mapping constructed based on the INERM and its application liberate the safety reports and realize the reuse and motivation of industrial safety knowledge. The unified structure of industrial safety knowledge is an industrial safety engineering design practice [45], which expands the perspective of industrial safety engineering design and provides ideas for academic researchers. We also believe it can help realize intelligent and automated knowledge expression in industrial safety.
5. Conclusions
The industrial safety report, a central representative in industrial safety engineering, can optimize any scenario in a process industrial safety process and provide effective safety analysis decisions. It should be noted that the rich industrial safety knowledge contained in the industrial safety report template is not fully utilized. To effectively utilize the value of the industrial safety knowledge graph and optimize industrial safety reports, we build a new knowledge graph with industrial safety reports as the carrier.
Industrial safety knowledge mapping follows a knowledge-mapping-based approach. Specifically, firstly, in response to the dilemma of different expressions of industrial safety knowledge maps, a knowledge standardization framework is creatively developed to deconstruct and summarize industrial safety reports in a top-down manner. The industrial safety knowledge mapping contains the ontologies and relationships of industrial safety knowledge mapping, which can standardize industrial safety reports in various processes and unify the representation and integration of industrial safety knowledge mapping. Secondly, considering the special characteristics of industrial safety report texts, a deep learning-based information extraction model, INERM, is conceived by cleverly combining data science and deep learning to extract industrial safety knowledge graphs from industrial safety reports based on a structured framework of industrial safety knowledge, which realizes engineering design-oriented data science. Briefly, the INERM consists of a pre-trained model, a two-way long short-term memory network, a conditional random field, and a TFIDF. Finally, the industrial safety knowledge graph triad is constructed based on the industrial safety knowledge graph-structured framework and the INERM and is stored in the Neo4j graph database.
We have completed the example for oil and gas entry and exit stations. The industrial safety knowledge graph is an excellent example of combining artificial intelligence and industrial engineering, which can integrate and unlock the value of industrial safety knowledge graph reports in a feasible way. In addition, it is oriented to applications such as industrial safety knowledge graph visualization, industrial safety knowledge graph retrieval, and assisted industrial safety reports, which can develop the value of an industrial safety knowledge graph and further improve the execution efficiency of industrial safety reports, which is important for improving the system security which is of great significance. In addition, the development of targeted applications, such as question-and-answer systems, can also popularize safety knowledge and enhance the awareness of non-professionals.
In future work, we will further improve the scope of the abstraction of various industrial safety reports, such as the abstraction of deviations from HAZOP and the severity of the consequences of the PHA, and carry out tasks such as entity processing, entity linking, and knowledge fusion. All in all, shortly, we can foresee that the industrial safety knowledge graph will become more mature, providing added value to the daily practice of industrial safety and inspiring other researchers working on industrial safety engineering design and industrial knowledge graph design.
Author Contributions
Conceptualization, S.X. and Y.Y.; data curation, Z.Y., X.T. and Y.Y.; formal analysis, S.X. and Y.Y.; funding acquisition, L.S.; methodology, Z.Y.; project administration, S.X. and L.S.; resources, Z.Y. and X.T.; software, Z.Y., L.S. and X.T.; supervision, S.X., L.S. and Y.Y.; validation, Z.Y., S.X., L.S. and Y.Y.; visualization, Z.Y., L.S. and X.T.; writing—original draft, Z.Y. and X.T.; writing—review and editing, Z.Y. and X.T. All authors have read and agreed to the published version of the manuscript.
Funding
Funds required in this paper are provided by the Jiangsu Provincial Petrochemical Process Key Equipment Digital Twin Technology Engineering Research Center Open Project No. DTEC202103 and the Postgraduate Research & Practice Innovation Program of Jiangsu Province (No. KYCX22_3078).
Acknowledgments
Thanks to Shoukun Xu, Lin Shi, and Yang Yuan for their guidance on the experiment. Thank you Tan for providing the operational mechanism formula for the industrial equipment. Thanks to the tutor team for providing fund support.
Conflicts of Interest
The authors declare that the research was conducted in the absence of any commercial or financial relationships.
Abbreviations
The following abbreviations are used in this manuscript:
| HAZOP | Hazard and Operability Analysis |
| PHA | Pre-Hazard Analysis |
| INERM | Industrial Safety Knowledge Extraction Model |
| BERT | Bidirectional Encoder Representation from Transformers |
| BiLSTM | Bidirectional Long- and Short-term Memory Network |
| JHA | Job Hazard Analysis |
| ET | Event Tree |
| AAS | Asset Administration Shell |
| NSP | NEST Sentence Prediction |
| CRF | Conditional Random Field |
| CDD | Common Data Dictionary |
| RNN | Recurrent Neural Network |
References
- Kang, J.; Guo, L. HAZOP analysis based on sensitivity evaluation. Saf. Sci. 2016, 88, 26–32. [Google Scholar] [CrossRef]
- Flaus, J. Preliminary Hazard Analysis. In Risk Analysis; John Wiley & Sons, Inc.: Hoboken, NJ, USA, 2013; Available online: https://onlinelibrary.wiley.com/doi/pdf/10.1002/9781118790021.ch8 (accessed on 5 November 2022).
- Baybutt, P. A critique of the Hazard and Operability (HAZOP) study. J. Loss Prev. Process. Ind. 2015, 33, 52–58. [Google Scholar] [CrossRef]
- Cameron, I.; Mannan, S.; Németh, E.; Park, S.; Pasman, H.; Rogers, W.; Seligmann, B. Process hazard analysis, hazard identification and scenario definition: Are the conventional tools sufficient, or should and can we do much better? Process. Saf. Environ. Prot. 2017, 110, 53–70. [Google Scholar] [CrossRef] [Green Version]
- Baybutt, P. Requirements for improved process hazard analysis (PHA) methods. J. Loss Prev. Process. Ind. 2014, 32, 182–191. [Google Scholar] [CrossRef]
- Naderpour, M.; Lu, J.; Zhang, G. An abnormal situation modeling method to assist operators in safety-critical systems. Reliab. Eng. Syst. Saf. 2015, 133, 33–47. [Google Scholar] [CrossRef] [Green Version]
- Paltrinieri, N.; Tugnoli, A.; Buston, J.; Wardman, M.; Cozzani, V. Dynamic Procedure for Atypical Scenarios Identification (DyPASI): A new systematic HAZID tool. J. Loss Prev. Process. Ind. 2013, 26, 683–695. [Google Scholar] [CrossRef]
- Rodríguez, M.; de la Mata, J.L. Automating HAZOP studies using D-higraphs. Comput. Chem. Eng. 2012, 45, 102–113. [Google Scholar] [CrossRef] [Green Version]
- Khan, F.I.; Abbasi, S. Towards automation of HAZOP with a new tool EXPERTOP. Environ. Model. Softw. 2000, 15, 67–77. [Google Scholar] [CrossRef]
- Hu, J.; Zhang, L.; Cai, Z.; Wang, Y. An intelligent fault diagnosis system for process plant using a functional HAZOP and DBN integrated methodology. Eng. Appl. Artif. Intell. 2015, 45, 119–135. [Google Scholar] [CrossRef]
- Feng, X.; Dai, Y.; Ji, X.; Zhou, L.; Dang, Y. Application of natural language processing in HAZOP reports. Process. Saf. Environ. Protect. 2021, 155, 41–48. [Google Scholar] [CrossRef]
- Zeng, W. Research on building chemical safety knowledge graph based on Neo4j. Heilongjiang Sci. 2021, 12, 3. [Google Scholar]
- Wang, Z.; Zhang, B.; Gao, D. A novel knowledge graph development for industry design: A case study on indirect coal liquefaction process. arXiv 2021, arXiv:2111.13854. [Google Scholar]
- Wang, J.; Zhang, W.; Wang, Y.; Sun, Z. Construction and inferential analysis of matter cognitive graphs for big data domains. Chin. Sci. Inf. Sci. 2020, 50, 15. [Google Scholar]
- Chiarello, F.; Belingheri, P.; Fantoni, G. Data science for engineering design: State of the art and future directions. Comput. Ind. 2021, 129, 103447. [Google Scholar] [CrossRef]
- Chhim, P.; Chinnam, R.B.; Sadawi, N. Product design and manufacturing process based ontology for manufacturing knowledge reuse. J. Intell. Manuf. 2017, 905–916. [Google Scholar] [CrossRef]
- Chiarello, F.; Melluso, N.; Bonaccorsi, A.; Fantoni, G. A Text Mining Based Map of Engineering Design: Topics and their Trajectories Over Time. In Proceedings of the Design Society: International Conference on Engineering Design, Delft, The Netherlands, 5–8 August 2019; Available online: https://www.researchgate.net/publication/334711416_A_Text_Mining_Based_Map_of_Engineering_Design_Topics_and_their_Trajectories_Over_Time (accessed on 25 March 2022).
- Chiarello, F.; Cirri, I.; Melluso, N.; Fantoni, G.; Pavanello, T. Approaches to Automatically Extract Affordances from Patents; Cambridge University Press: Cambridge, UK, 2019; pp. 2487–2496. Available online: https://www.researchgate.net/publication/334711467_Approaches_to_Automatically_Extract_Affordances_from_Patents (accessed on 26 March 2022).
- Khan, F.I.; Abbasi, S. Techniques and methodologies for risk analysis in chemical process industries. J. Loss Prev. Process. Ind. 1998, 11, 261–277. [Google Scholar] [CrossRef]
- Devlin, J.; Chang, M.W.; Lee, K.; Toutanova, K. BERT: Pre-training of Deep Bidirectional Transformers for Language Understanding. 2018. Available online: https://arxiv.org/pdf/1810.04805.pdf (accessed on 1 April 2022).
- Wang, Y.; Luo, S.; Yang, Y.; Zhang, H. Review of knowledge graph visualization. J. Comput. Aided Des. Graph. 2019, 31, 11. [Google Scholar] [CrossRef]
- Gong, J.; Liu, J.; Zhao, B.-X.; Wu, H.-C. Knowledge-based automatic evaluation technique for pipeline layout. Comput. Integr. Manuf. Syst. 2014, 20, 2522–2531. [Google Scholar] [CrossRef]
- Huijun, Z.; Shigang, W. Conceptual design of mechanical products based on multilayer reasoning mechanism. J. Comput. Aided Des. Graph. 1997, 9, 548–553. [Google Scholar] [CrossRef]
- Cai, H.; He, Y.; Liu, H. Modeling and implementation of a design repository based on hierarchical semantic network. Comput. Integr. Manuf. Syst. 2005, 11, 73–78. [Google Scholar]
- Guo, X.; Zhao, W.; Wang, J.; Wang, C.; Zhang, K.; Chen, C. Research on process design knowledge model and retrieval method for innovative design. J. Mech. Eng. 2017, 53, 80–86. [Google Scholar] [CrossRef]
- Liu, H.; Du, J.; Bai, Y. Research on semantic modeling of manufacturing domain knowledge based on multidimensional ontology. Manuf. Technol. Mach. Tools 2019, 140–146. [Google Scholar]
- Bock, C.; Zha, X.F.; Suh, H.W.; Lee, J.H. Ontological product modeling for collaborative design. Adv. Eng. Inform. 2010, 24, 510–524. [Google Scholar] [CrossRef]
- Huang, R.; Zhang, S.; Shi, Y.; Tao, J. Process language understanding and process semantic model construction for 3D reconstruction. Aerosp. Manuf. Technol. 2011, 4. [Google Scholar] [CrossRef]
- Zhou, B.; Bao, J.S.; Zhang, Q.W.; Liu, T.Y.; Liu, Y.H. A Knowledge Graph-Driven Method for Optimizing Equipment Resource Allocation. 2020. Available online: https://doc.taixueshu.com/patent/CN111191821A.html (accessed on 1 April 2022).
- Wang, Z.; Zhang, B.; Gao, D. Text Mining of Hazard and Operability Analysis Reports Based on Active Learning. Processes 2021, 9, 1178. [Google Scholar] [CrossRef]
- Wei, S.G.; Cai, B.; Gou, C.; Jian, W.; Wang, J. Research on reliability evaluation of high-speed railway train control system based on fault injection. In Proceedings of the International Conference on Environmental Science & Information Application Technology, Wuhan, China, 17–18 July 2010; Available online: http://en.cnki.com.cn/Article_en/CJFDTOTAL-TDTH201007003.htm (accessed on 7 February 2022).
- Daramola, O.; Stålhane, T.; Omoronyia, I.; Sindre, G. Using Ontologies and Machine Learning for Hazard Identification and Safety Analysis. In Managing Requirements Knowledge; Maalej, W., Thurimella, A.K., Eds.; Springer: Berlin/Heidelberg, Germany, 2013; pp. 117–141. [Google Scholar] [CrossRef] [Green Version]
- Qian, S.L.; Zhang, H.J.; Corporation, J.G.; University, H.N. The Research Development of Hazard and Operability (HAZOP) Analysis. Shandong Chem. Ind. 2013, 2–5. Available online: http://en.cnki.com.cn/Article_en/CJFDTotal-SDHG201310020.htm (accessed on 5 November 2022).
- Qin, Y.; Qi, X.; Wei, T.; Qingxiu, Y. Application of advance hazard analysis in natural gas boosting engineering. Oil Gas Chem. 2012, 41, 4. [Google Scholar] [CrossRef]
- Wei, L.; Yanping, W. protective layer analysis method. Saf. Health Environ. 2006, 8–15. [Google Scholar] [CrossRef]
- Li, Z. Application of HAZOP analysis method in natural gas distribution field stations. Chin. Pet. Chem. Stand. Qual. 2016, 23, 3. [Google Scholar] [CrossRef]
- Lu, Y.H.; Zhang, L.; Tao, G.; Yu, Y.L. Risk Analysis of Cyclohexanone Production Unit Based on HAZOP-LOPA Coupled Phenol Hydrogenation. 2020. Available online: https://kns.cnki.net/KCMS/detail/detail.aspx?dbcode=IPFD&filename=ZKHJ202007001170 (accessed on 3 April 2022).
- Imort, S. Product Lifecycle Management with the Asset Administration Shell. Computers 2021, 10, 84. [Google Scholar] [CrossRef]
- Yue, L.; Liu, D.; Fang, Y. Asset management shell in Industry 4.0 components. China Instrum. 2017, 13, 6. [Google Scholar]
- Dunjó, J.; Fthenakis, V.; Vílchez, J.A.; Arnaldos, J. Hazard and operability (HAZOP) analysis. A literature review. J. Hazard. Mater. 2010, 173, 19–32. [Google Scholar] [CrossRef] [PubMed]
- Current, T. International Electrotechnical Commission-IEC. Environ. Technol. 2003, PER-7, 27. [Google Scholar] [CrossRef]
- Schuhmacher, M. Knowledge Graph Exploration for Natural Language Understanding in Web Information Retrieval. 2016. Available online: https://portal.dnb.de/opac.htm?method=simpleSearch&cqlMode=true&query=idn%3D1120302587 (accessed on 2 May 2022).
- Vaswani, A.; Shazeer, N.; Parmar, N.; Uszkoreit, J.; Jones, L.; Gomez, A.N.; Kaiser, L.; Polosukhin, I. Attention Is All You Need. arXiv 2017, arXiv:1706.03762. [Google Scholar]
- Gers, F.A.; Schmidhuber, J.; Cummins, F. Learning to Forget: Continual Prediction with LSTM. Neural Comput. 2000, 12, 2451–2471. [Google Scholar] [CrossRef] [PubMed]
- Calijorne Soares, M.A.; Parreiras, F.S. A literature review on question answering techniques, paradigms and systems. J. King Saud Univ. Comput. Inf. Sci. 2020, 32, 635–646. [Google Scholar] [CrossRef]
Figure 1.
Industrial safety knowledge development process.

Figure 2.
Overall structure diagram of INERM.

Figure 3.
Single LSTM cells: is output gate, is cell, is forget gate, is forget gate.

Figure 4.
BILSTLM Network Structure.

Figure 5.
Standardized industrial safety knowledge graph structure.

Figure 6.
Content and structure display of safety knowledge map of oil and gas inbound module.


Table 1.
Entity Label.
| Label Name | Label Head | Label Tail |
|---|---|---|
| Assert | B_assert | I_assert |
| Cause | B_cause | I_cause |
| Result | B_result | I_result |
| Suggest | B_suggest | I_suggest |
Table 2.
Chinese BERT model parameter.
| Model Parameter | Value |
|---|---|
| Number of layers | 14 |
| H | 768 |
| A | 14 |
| max_seq | 40 |
Table 3.
The results of the evaluation experiments.
| P | R | F | ||||
|---|---|---|---|---|---|---|
| ϱ | Test | val | Test | val | Test | val |
| 0.30 | 0.57393 | 0.54143 | 0.53154 | 0.56123 | 0.52810 | 0.55123 |
| 0.60 | 0.66390 | 0.63425 | 0.68422 | 0.63674 | 0.67423 | 0.65689 |
| 0.90 | 0.59304 | 0.52316 | 0.56381 | 0.55316 | 0.59019 | 0.55316 |
Table 4.
Comparison of various algorithm models on the test set.
| Model | P | R | F |
|---|---|---|---|
| TextRank | 0.36624 | 0.43152 | 0.39621 |
| TFIDF | 0.38817 | 0.45732 | 0.41992 |
| INERM | 0.57511 | 0.63612 | 0.59231 |
| BERT | 0.35612 | 0.50232 | 0.43225 |
| BERT+BiLSTM | 0.37485 | 0.52622 | 0.42421 |
| BiLSTM | 0.42991 | 0.47892 | 0.40892 |
| BiLSTM+CRF | 0.41329 | 0.52340 | 0.38021 |
| BERT+BiLSTM+CRF | 0.44892 | 0.52301 | 0.45289 |
Disclaimer/Publisher’s Note: The statements, opinions and data contained in all publications are solely those of the individual author(s) and contributor(s) and not of MDPI and/or the editor(s). MDPI and/or the editor(s) disclaim responsibility for any injury to people or property resulting from any ideas, methods, instructions or products referred to in the content. |
© 2023 by the authors. Licensee MDPI, Basel, Switzerland. This article is an open access article distributed under the terms and conditions of the Creative Commons Attribution (CC BY) license (https://creativecommons.org/licenses/by/4.0/).
Share and Cite
MDPI and ACS Style
Yin, Z.; Shi, L.; Yuan, Y.; Tan, X.; Xu, S. A Study on a Knowledge Graph Construction Method of Safety Reports for Process Industries. Processes 2023, 11, 146. https://doi.org/10.3390/pr11010146
AMA Style
Yin Z, Shi L, Yuan Y, Tan X, Xu S. A Study on a Knowledge Graph Construction Method of Safety Reports for Process Industries. Processes. 2023; 11(1):146. https://doi.org/10.3390/pr11010146
Chicago/Turabian StyleYin, Zhiqiang, Lin Shi, Yang Yuan, Xinxin Tan, and Shoukun Xu. 2023. "A Study on a Knowledge Graph Construction Method of Safety Reports for Process Industries" Processes 11, no. 1: 146. https://doi.org/10.3390/pr11010146
Note that from the first issue of 2016, this journal uses article numbers instead of page numbers. See further details here.