Article

Pinch Analysis for Heat Integration of Pulverized Coke Chemical Looping Gasification Coupled with Coke-Oven Gas to Methanol and Ammonia

1
State Key Laboratory of Clean and Efficient Coal Utilization, Taiyuan University of Technology, Taiyuan 030024, China
2
Key Laboratory of Coal Science and Technology, Ministry of Education, Taiyuan University of Technology, Taiyuan 030024, China
3
Department of Mechanics, Jinzhong University, Jinzhong 030619, China
4
School of Chemical Engineering and Pharmacy, Wuhan Institute of Technology, Wuhan 430205, China
5
Shanxi-Zheda Institute of Advanced Materials and Chemical Engineering, Taiyuan 030024, China
*
Authors to whom correspondence should be addressed.
Processes 2022, 10(9), 1879; https://doi.org/10.3390/pr10091879
Submission received: 24 August 2022 / Revised: 12 September 2022 / Accepted: 15 September 2022 / Published: 16 September 2022

Abstract

:
Methanol and ammonia are important chemical materials in the chemical industry. During the production of methanol and ammonia, a large amount of waste heat is released. The waste heat can be used to save energy and reduce CO2 emissions. In this study, pinch analysis is used to design the heat exchanger network (HEN) of pulverized coke (PC) chemical looping gasification coupled with coke-oven gas (COG) to methanol and ammonia (PCCLHG-CGTMA). The heat integration process is accomplished in two ways, as mentioned below. (1) The HENs in each of the three heat exchange units are designed individually; (2) the HENs of the three heat exchange units are treated as a whole and designed simultaneously. Compared to the HEN designed individually, when the HENs are designed as a whole, a total of 112.12 MW of hot and cold utilities are saved. In the HENs designed as a whole, the reduction in operating cost is sufficient to offset the increase in capital cost; the total annual cost (TAC) is reduced by 10.9%. These results reveal that the HENs designed as a whole have more scope for energy saving, which can be a reference for new HEN design and modification to realize more heat recovery and lower investment.

Graphical Abstract

1. Introduction

Methanol is an important raw material for the coal chemical industry, as well as for chemical production. It is a relatively clean energy source as a substitute fuel for petroleum and gasoline. Ammonia is one of the most effective products used in the chemical industry. It is used as a fertilizer, processed into a variety of nitrogen and nitrogen-containing fertilizers, and widely used as a refrigerant. Due to the wide use of ammonia, especially in agriculture, it plays an important role in the national economy. Therefore, the industrial demand for large-scale and high-energy-efficiency methanol and ammonia production processes has received considerable attention. Traditional methanol production processes rely on fossil fuels as a carbon source [1], while ammonia syntheses involve natural gas reforming or water gas conversion as hydrogen sources [2]. In China, typical energy sources are rich in coal but deficient in oil and natural gas. Therefore, the efficient and clean production of methanol and ammonia from coal can contribute to the development of national economy in the future.
China’s annual coke consumption is approximately 471 million tons, which produces approximately 210 billion cubic meters of coke oven gas (COG) [3]. COG is a hydrogen-rich fuel, and its approximate composition is: CO 5–8 vol.%, H2 55–60 vol.%, and CH4 23–27 vol.% [4]. At present, direct combustion of COG in coking plants causes a large amount of energy waste and serious environmental pollution [5]. High value-added utilization of COG can be realized by synthesizing chemicals from COG; for example, methanol can be feasibly obtained from COG, and it has good application prospects [6,7]. The R ratio of hydrogen to carbon in case of COG is approximately 5.2, while that of syngas for methanol synthesis is 2.0–2.1 [8]. By traditional steam reforming and dry reforming of COG, the R ratio can be decreased to 4–5 and less than 2, respectively. The R ratio of syngas obtained from partial oxidation reforming is approximately between 2.5 and 3, which still has the problem of adjusting the R ratio by oxidizing the hydrogen in COG. This method reduces hydrogen utilization and wastes hydrogen energy, and the oxygen requires an air separation system, which increases energy consumption, that is, there are severe technical challenges in the high value-added utilization of COG in coking plants. Considering mass balance, adding carbon to COG can result in syngas with R ratio of 2 for methanol production. Pulverized coke (PC) is a by-product of coking plants, because its particle size is small and cannot be used in metallurgical applications [9], so the PC can be a cheap carbon source for producing methanol from COG.
Chemical looping combustion (CLC) is an efficient, low-cost, and environmentally friendly CO2 capture technology [10,11,12]. In a fuel reactor, the fuel is oxidized by oxygen carriers, and reduced oxygen carriers are oxidized by the air in the air reactor. The exhaust from the fuel reactor is solid oxygen carriers and flue gas, which contains steam and CO2. High concentration of CO2 can be obtained via condensing and separation of the steam in the flue gas [11]. Some new chemical looping concepts have been proposed based on CLC, such as chemical looping hydrogen production [13,14], chemical looping reforming [15,16], and chemical looping gasification [17,18]. Introducing chemical looping technology into a polygeneration system can improve system performance [9,19,20,21]. Xiang et al. proposed a process of COG chemical looping hydrogen-assisted COG-to-natural gas, which could increase hydrogen utilization and exergy efficiencies [22]. In another successful example proposed by Xiang et al., pulverized coke chemical looping combustion and COG were integrated into the olefins and ammonia generation process to increase techno-economic performance [9]. Furthermore, Xiang et al. studied a series of new processes for chemical production with chemical looping hydrogen generation (CLHG) from pulverized coke and COG, which improved energy efficiency and reduced CO2 emission [23,24]. The results of these reports strongly show that CLHG improves the COG transformation into useful chemicals from both energetics and environmental point of view. Based on this, a new system of using PC as fuel for CLHG-assisted COG to methanol and ammonia production (PCCLHG-CGTMA) was proposed in our previous study [25]. CO2 from CLHG was innovatively utilized for methanol production, while the H2 and N2 from the CLHG were ideal feedstocks for ammonia production. System modeling and key operational parameters were optimized to investigate the novel process for hydrogen and carbon utilization efficiency, feedstock consumption, CO2 emissions, and energy (exergy) efficiency. Compared with different technologies for the conversion of COG to methanol or ammonia, the novel proposed system demonstrated an excellent hydrogen utilization efficiency of 88.8%, a high exergy efficiency of 78.7%, and a relative CO2 reduction ratio of 0.67. Based on the demand for methanol and ammonia, the proposed system achieved different scales of production of chemicals, making it flexible and adjustable.
Pinch technology is the most widely used energy analysis technology and has become an important tool for heat integration and process integration in the process industry and any system with energy optimization scope [26,27,28,29,30]. Pinch-based HEN retrofit analysis in recent years has emerged as an area of growing interest. Chen et al. used pinch technology to analyze the current situation of energy consumption and HEN of methanol synthesis and distillation systems and proposed a suitable optimization scheme [31]. Song et al. used pinch technology to optimize the heat integration of SMR-PSA during the hydrogen production process; the total energy consumption decreased by 60.5% compared with traditional hydrogen production [32]. Liu et al. used pinch analysis to recover low-temperature waste heat generated by CO2 compression and the water gas change unit during coal-to-methanol conversion [33]. Chen et al. designed and simulated a new steam recompression process for the phenol and ammonia recovery process [34]. Pinch technology was used to design the HEN for the process, and it resulted in improved energy efficiency. Liu et al. used pinch technology to integrate and optimize the HEN during the conversion of coal to olefin [35]. Compared to the original plant, the utility decreased by 4.76%, the heat exchange area decreased by 8.63%, and the capital and operating costs and the TAC decreased by 8.29%, 2.78%, and 3.66%, respectively. Yurim Kim et al. optimized wastewater heat recovery (WWHR) systems in textile dyeing processes using pinch analysis. Compared to the conventional textile dyeing process without the WWHR system, the presented optimal WWHR system decreased energy consumption and TAC by 73.65% and 28.64%, respectively [36].
Since inception, the pinch technology has been continuously extended to various fields and used for more application to a wide range of industrial, regional, and global challenges well beyond heat. Further directions have been developed based on analogies with the original pinch idea. El-Halwagi et al. first developed mass exchange network pinch analysis, extending pinch technology beyond thermal systems [37]. Later, other pinch methods were broadly developed. For example, water pinch analysis for wastewater minimization [38], carbon emissions pinch analysis for energy planning to achieve the overall low-GHG emissions [39], hydrogen pinch for identification of bottlenecks in refinery hydrogen networks [40], power pinch analysis for the electricity targets of hybrid renewable energy sources [41], and other pinch analysis tool for aggregate planning in supply chains [42] and macroscale energy systems planning [43]. The most recent extensions have been the pinch analysis performance of heat pumps [44]. Yang et al. proposed the application of heat pump technology to the HEN design of the azeotropic dividing wall column configuration, which can reduce the TAC by 32.91% compared to the existing configuration. CO2 emissions are reduced by 86.43% and exergy loss by 36.72% [45].
The previous study [25] was investigated with designs for methane reforming, methanol synthesis, ammonia synthesis, CLHG reactors, and the purification and separation of methanol and ammonia, and the heating and cooling loads of the process were determined. Methane reforming is a strong endothermic reaction, that is, it absorbs a considerable amount of heat. Synthesis of methanol and ammonia are exothermic reactions, that is, these reactions release a considerable amount of heat. The preheating and condensation of the import and export flows of the three reactors of CLHG, as well as the reboiler and condenser of methanol distillation tower, should be able to absorb and release heat as required. The discharge of a large amount of waste heat or inefficient recovery in a chemical process results in waste energy and leads to the release of a large amount of CO2. From the perspective of energy and environmental impact, waste heat recovery is an important direction for the sustainable development of the chemical industry. Therefore, the future research should consider the design of appropriate heat exchanger network (HEN). If the heat load recovered in the process cannot meet the requirements of the system, external utilities are needed, that is, the design and selection of utilities should be considered.
In our previous study [25], energy balance analysis was carried out for the system based on the first and second law of thermodynamics. For heat recovery in the system, energy quality and quantity were considered, and the maximum recoverable heat under ideal conditions was obtained, without considering the design of specific HENs, such as the heat exchangers arrangement and their relationship with investment; therefore, the heat recovery process for the system had to be reconsidered. As a mature technology for energy integration in process industries, the HEN design method has already been applied in retrofit projects, as well as in grassroots synthesis [46,47]. However, to the best of our knowledge, most contemporary research focuses on the retrofit of only some units or parts of an existing chemical process as a case study using pinch technology. For example, for methanol synthesis and distillation units [31], for steam methane reforming units [32], for phenol and ammonia recovery process [34], for methanol to olefins conversion process [35], and for the textile dying process [36]; and few studies have investigated the grassroots synthesis of total energy optimization for a new system. Therefore, this study aims to perform the grassroots synthesis of a HEN using pinch technology for the PCCLHG-CGTMA system, followed by deriving an optimal HEN scheme for guiding practical industrial applications, overcoming the lack of consideration of practical heat transfer in previous works [25]. In addition, many reported HEN designs of chemical production processes are ideal heat transfer processes with the assumption that heat can be maximally recovered, ignoring the heat exchanger area, resulting in high investment costs. However, the HEN design of this study considers the relationship between utility consumption, heat transfer area of HEN design and the practical economy including the cost of utilities and heat exchangers, and also investigates the impact of different heat exchange schemes (the HEN designed individually and as a whole) on the HEN design. As a result, this paper can provide a practical application reference for the HEN design of those ideal heat transfer processes. Pinch technology is used to integrate and optimize the HEN of the PCCLHG-CGTMA system considering the following two aspects. (1) The HENs in each heat exchange unit are designed individually; (2) the HENs in the three heat exchange units are treated as a whole and designed simultaneously. Theoretically, more heat can be recovered through heat integration of the system as a whole; however, the increase in heat exchange area may elevate the capital cost. Therefore, it is necessary to comprehensively compare the economic feasibility of the two abovementioned schemes basis the TAC. It is expected to obtain the relationship between heat recovery and capital cost in the heat integration process and aid this decision-making process.
The paper is organized as follows. Section 2 presents the process description, including the model establishment of the system and the selection of the method. In Section 3, pinch technology is selected to integrate and optimize the HEN of the system. Section 4.1 and 4.2 analyze the energy based the composite curves, grand composite curves, and balanced composite curves, and perform the grassroots synthesis of HENs for the system from the two schemes: (1) dividing the entire system into three heat exchange units, CLHG + COMB, DRU + MSU, and APU; and (2) treating the system as a whole. A comparison of economic feasibility basis the TAC is carried out in Section 4.3, and the insights for the heat recovery and utilization of the HEN system are provided. The main conclusions are presented in Section 5.

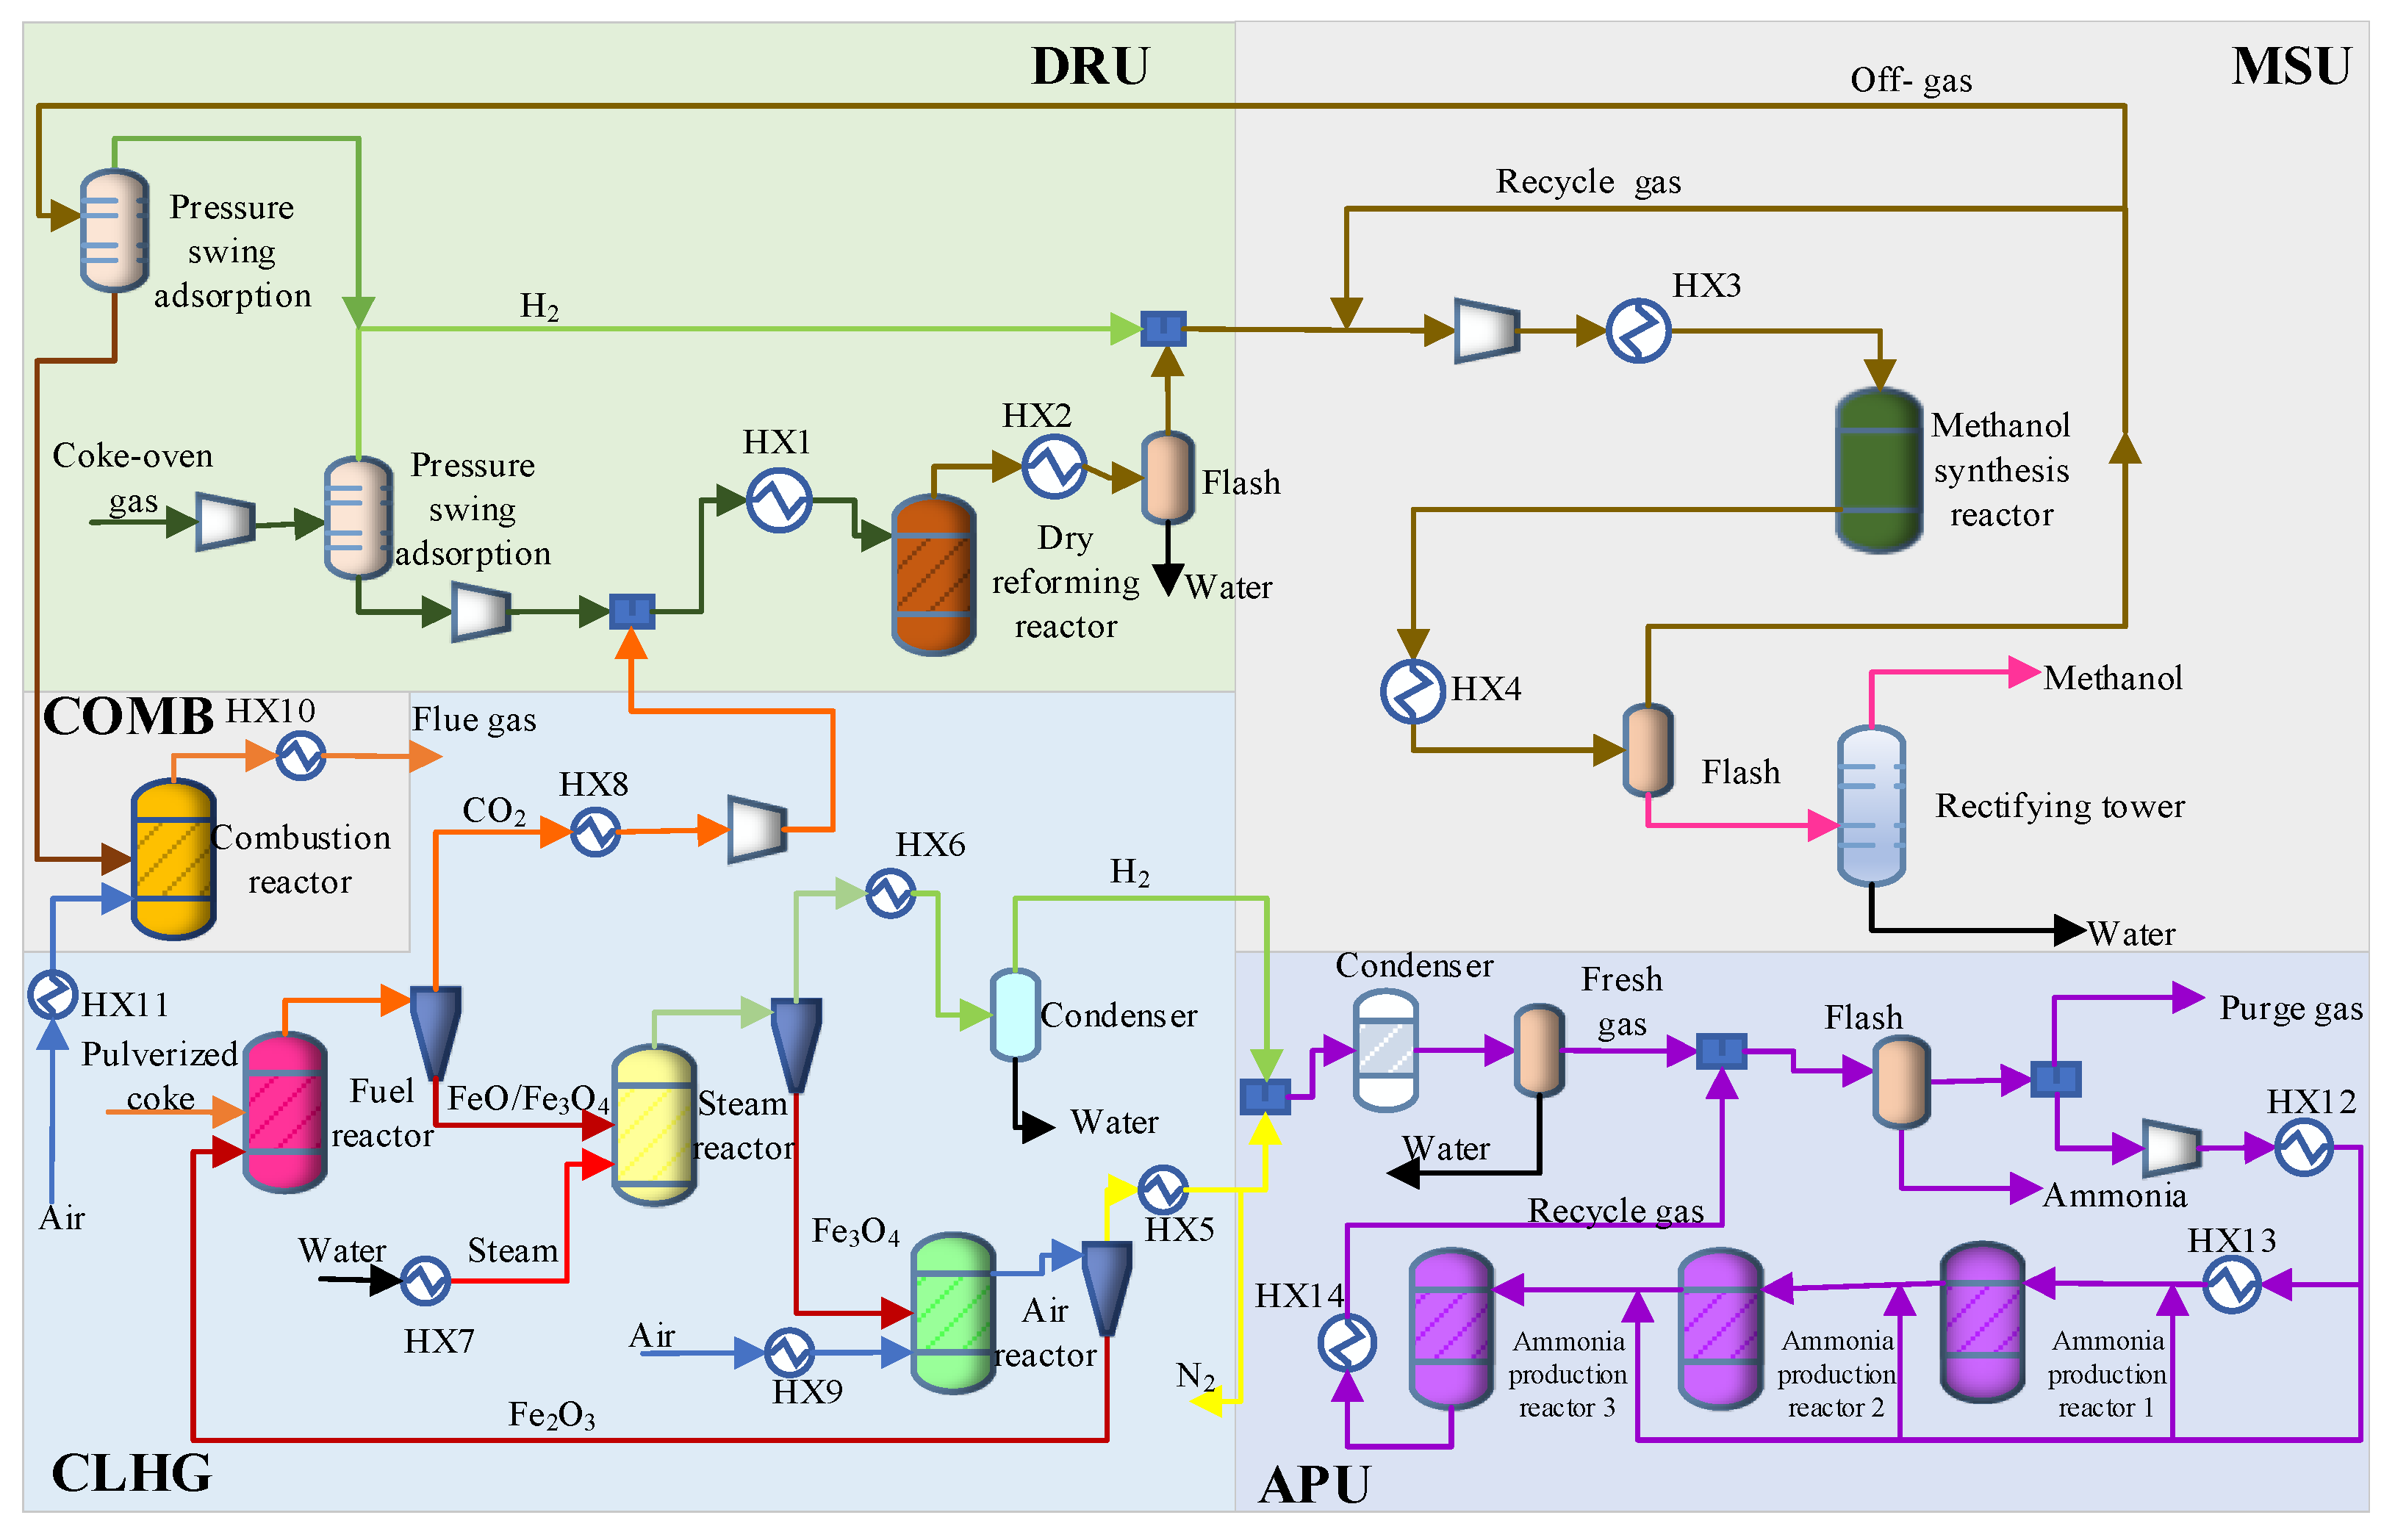
2. Process Description

Aspen Plus V11 software was used for simulation [25]. The process flow diagram is shown in Figure 1; it comprised five units: (1) CLHG, (2) dry reforming unit (DRU), (3) methanol synthesis of unit (MSU), (4) ammonia production unit (APU), and (5) combustion unit (COMB). A description of each unit process and the location of all heat exchangers in the system process are presented below.

2.1. DRU

COG passed through the pressure swing adsorption unit, where H2 was separated, mixed with the CO2 flue gas from the CLHG unit, and preheated. The corresponding heat exchanger is represented by HX1, as shown in Figure 1. Then, it entered the DRU for the reforming reaction. After syngas was cooled at the outlet of the reforming reactor (HX2), the water was separated by flash evaporation and mixed with H2 into the MSU.

2.2. MSU

The syngas from the DRU was mixed with the circulating gas, where it was compressed and preheated (HX3) and then entered the MSU. The reaction heat was used by cold water to generate steam, thus recovering the reaction heat. The flow from the methanol synthesis reactor was cooled (HX4) to condense the methanol, and then flashed to separate the gas and the crude liquid methanol. The crude methanol entered the distillation column, and 99.5% methanol was extracted. The condenser and reboiler in the distillation column required cooling and heating loads, respectively. Part of the unreacted gas was recycled to produce methanol, and the remaining part entered the pressure swing adsorption to separate H2. After separating H2, the unreacted gas was sent to the combustion unit to provide heat for methane reforming.

2.3. CLHG

Iron oxide was selected as the oxygen carrier material for CLHG. The PC was oxidized by Fe2O3 in fuel reactor to form CO2 and H2O, and the oxygen carriers were reduced to FeO and Fe3O4. The flue gas containing CO2 and H2O was cooled (HX8) to condense and separate the water, and CO2 was compressed in the DRU. The cold water entering the SR was heated (HX7). The reduced oxygen carriers were completely oxidized to Fe3O4 by steam and generated H2. The mixture of H2 and steam was cooled (HX6) to condense and separate the water and obtain pure H2. The air entering AR was preheated (HX9), and the oxygen carrier Fe3O4 from the steam reactor was completely oxidized to Fe2O3 under the air atmosphere. Oxygen in the air was consumed and the remaining N2 was cooled (HX5) before being discharged. The oxygen carrier Fe2O3 at the outlet of the air reactor entered the fuel reactor for recycling. The three reactors, fuel reactor, steam reactor, and air reactor, in the CLHG unit could achieve self-thermal equilibrium.

2.4. COMB

To improve the hydrogen element utilization rate of the system, part of the purge gas from MSU was separated by pressure swing adsorption to separate H2 and then sent to the combustion reactor to provide the heat for the methane reforming reaction. The air entering the combustion reactor was preheated (HX11), and the flue gas at the outlet of the fuel reactor was cooled (HX10) before being discharged. The fuel reactor could provide sufficient heat for the methane reforming reaction.

2.5. APU

The H2 and N2 from CLHG were mixed at a 3:1 ratio and entered the APU. Fresh gas was mixed with the circulating gas and then flashed to separate the produced NH3. The remaining flash gas, which was preheated (HX12), was divided into four streams. The first stream was preheated (HX13) and then mixed with the second stream to enter the first ammonia production reactor. The outlet flow was mixed with the third stream to enter the second ammonia production reactor, and the outlet flow was mixed with the fourth stream to enter the third ammonia production reactor. The outlet flow was cooled (HX14) and mixed with the fresh gas. The above ammonia synthesis process is based on the findings of [48].

2.6. Model Assumptions and Validation of the System

To develop a model, several assumptions have been made [49]:
(1)
There was no heat loss between the units of the system;
(2)
All parameters of the reactor were constant during the reaction;
(3)
The equilibrium was reached very fast—reaction rates of all processes were very high;
(4)
There was no temperature gradient, during the heating of the reactants.
Our previous work [25] shows the comparison between simulation results and literature data of the key units (DRU, MSU, CLHG, and APU), as shown in Table 1. The simulated results are very close to the literature data, implying that the established models are reliable for the simulation of the systems.

3. Pinch Technology

Pinch technology is a heuristic method based on thermodynamics proposed by Linnhoff et al. [51,52]; it considers the whole system as the starting point. The basis of the problem of the table algorithm and composite curves is that the minimum temperature difference of the system is set so that the network is divided in two thermodynamic regions: temperatures “above the Pinch”, where there is a deficit of thermal load and the service required is only hot utility, and temperatures “below the Pinch”, where there is an excess of thermal load and the service required is only cold utility. Pinch design should follow the three principles: no cold utility above the pinch point, no heat utility below the pinch point, and no heat transfer across the pinch point. In other words, to achieve the minimum requirements of energy in a process set by the composite curves, the designer must not transfer heat across the pinch. If these principles are violated, the total heat duty of utility as well as the capital cost will increase.
The pinch point for all thermal systems cannot be obtained. Some thermal systems reach a point at which one of the thermal utilities reduces to zero; the value of ΔTmin diminishes by moving the hot and cold composite curves on horizontal axes. This is known as the threshold problem [53]. In the HEN design for threshold problem, the cold-end threshold problem can be considered as having only the part above the pinch point and should be designed from the cold-end; the hot-end threshold problem can be considered as having only the part below the pinch point and should be designed from the hot-end. The minimum utility consumption of HEN can be obtained using pinch technology [54]. Based on this design approach, Linnhoff et al. proposed some heuristic rules to guide the design of HEN to achieve the energy target [55]. Utility is a general term for the auxiliary facilities that maintain the normal operation of a chemical plant, providing the heat as well as power required by the process and at the same time recovering the waste heat from the process. The most typical utility system is the steam power system for combined heat and power supply, which is integrated with the production process.
Pinch technology has several shortcomings, for example, it focuses on the equipment units, rather than the flowsheet level [56], cannot handle the changes in pressure and chemical composition in the process under consideration [57]. However, the important strength of pinch technology to process integration is the targeting stage where important performance targets are determined prior to the design stage. Establishment of meaningful and achievable targets provides critical guidance in the design stage to the engineer of the performance limitations and inherent compromises within a system. The purpose of this paper is exactly to perform the grassroots synthesis design of a HEN for the PCCLHG-CGTMA system, followed by deriving an optimal HEN scheme for guiding practical industrial applications. Therefore, pinch technology is selected for the HENs design in this paper.
The total heat transfer area Atot in a HEN is calculated using Formula (1) [58].
A t o t = A i = Q i U i · Δ T L M
where Ai is in m2, Qi is the heat transferred in each exchanger (kW), Ui is the overall heat transfer coefficient (kW/(m2 K)), Δ T L M is the log mean temperature difference (K): Δ T L M = Δ T H Δ T C L n Δ T H Δ T C ,   and   Δ T H and Δ T C refer to temperature differences at hot and cold ends of the heat exchange interval, respectively: Δ T H = T h , i n T c , o u t , Δ T C = T h , o u t T c , i n .
The total heat duty Qtot in a HEN is calculated using Formula (2) [58].
Q t o t = Q i = ( m i · C p i · Δ T i )
where Qi is the heat duty of stream i (kW), mi is the mass flow rate of stream i (kg/s), Cpi is specific heat of stream i (kJ/(kg∙°C)), and ΔTi is the temperature difference between inlet and outlet of stream i (°C).
Operation cost (OC) refers to the utility cost consumed by the HEN, and the calculation formula is shown in Formula (3) [59].
OC = m N H U ( C m , H U Q m , H U ) + n N C U ( C n , C U Q n , C U )
where Q m , H U is the duty of hot utility m, MW; Q n , C U is the duty of cold utility n, MW; C m , H U is per unit cost of hot utility m, USD/MWh; C n , C U is per unit cost of cold utility n, USD/MWh; N H U is the number of hot utility; and N C U is the number of cold utility.
Hot utilities of steam include high, medium, and low-pressure steam (250 °C, 175 °C, and 125 °C), with costs of 7.2 USD/MWh, 7.92 USD/MWh, and 9.0 USD/MWh, respectively. The refrigerant type needs to be determined according to the desired cooling temperature. Cold utilities used in this study include cooling water (20–25 °C), air (30–35 °C), and refrigerant (between −25 and −24 °C), with costs of 0.76 USD/MWh, 3.6 × 10 3 USD/MWh, and 9.86 USD/MWh, respectively. When the heat exchange demand is satisfied, the process parameters, such as pressure of steam, temperature, and type of refrigerant, have no influence on the matching of heat and cold heat exchange streams in HEN, while it determines the economy of the HEN. Under the premise of meeting the heat transfer demand, the larger the temperature difference between utility and process streams, the more exergy loss from the point of view of exergy analysis. Therefore, it is necessary to choose the smaller temperature difference between utility and process streams in the HEN.
Capital costs (CC) mainly depend on the equipment material, pressure, and type of heat exchanger. The investments of heat exchanger are related to the heat exchanger area and are estimated using Formula (4) [58].
CC = 10000 + 800 A 0.8
The TAC calculation formula is shown in (5) [58].
TAC = OC + [ ( 1 + R O R ) P L P L ]   C C
where ROR is the rate of return, 10%, and PL is the plant life cycle, 15 years [58,60].
The above utility prices are derived from industrial data.
The energy target of the HEN is that the heat exchange between the cold and hot flows should reach the maximum heat recovery after the minimum temperature difference (ΔTmin) has been specified and the utility has been minimized. The economic target of the HEN is to reduce heating and cooling costs by matching hot and cold flows, i.e., minimizing the sum of capital and operating costs. Thus, in this analysis, the following steps were considered referring to the flowchart of Figure 2:
  • Data gathering is used to extract stream data from different processing units, considering the total heat and mass balances of the system to calculate heat exchanged for all hot and cold streams. The data gathering considers two aspects. (1) The entire network system is divided into three heat exchange units, namely, CLHG + COMB, DRU + MSU, and APU. (2) The system is treated as a whole, and the dates of all cold and hot streams are collected simultaneously;
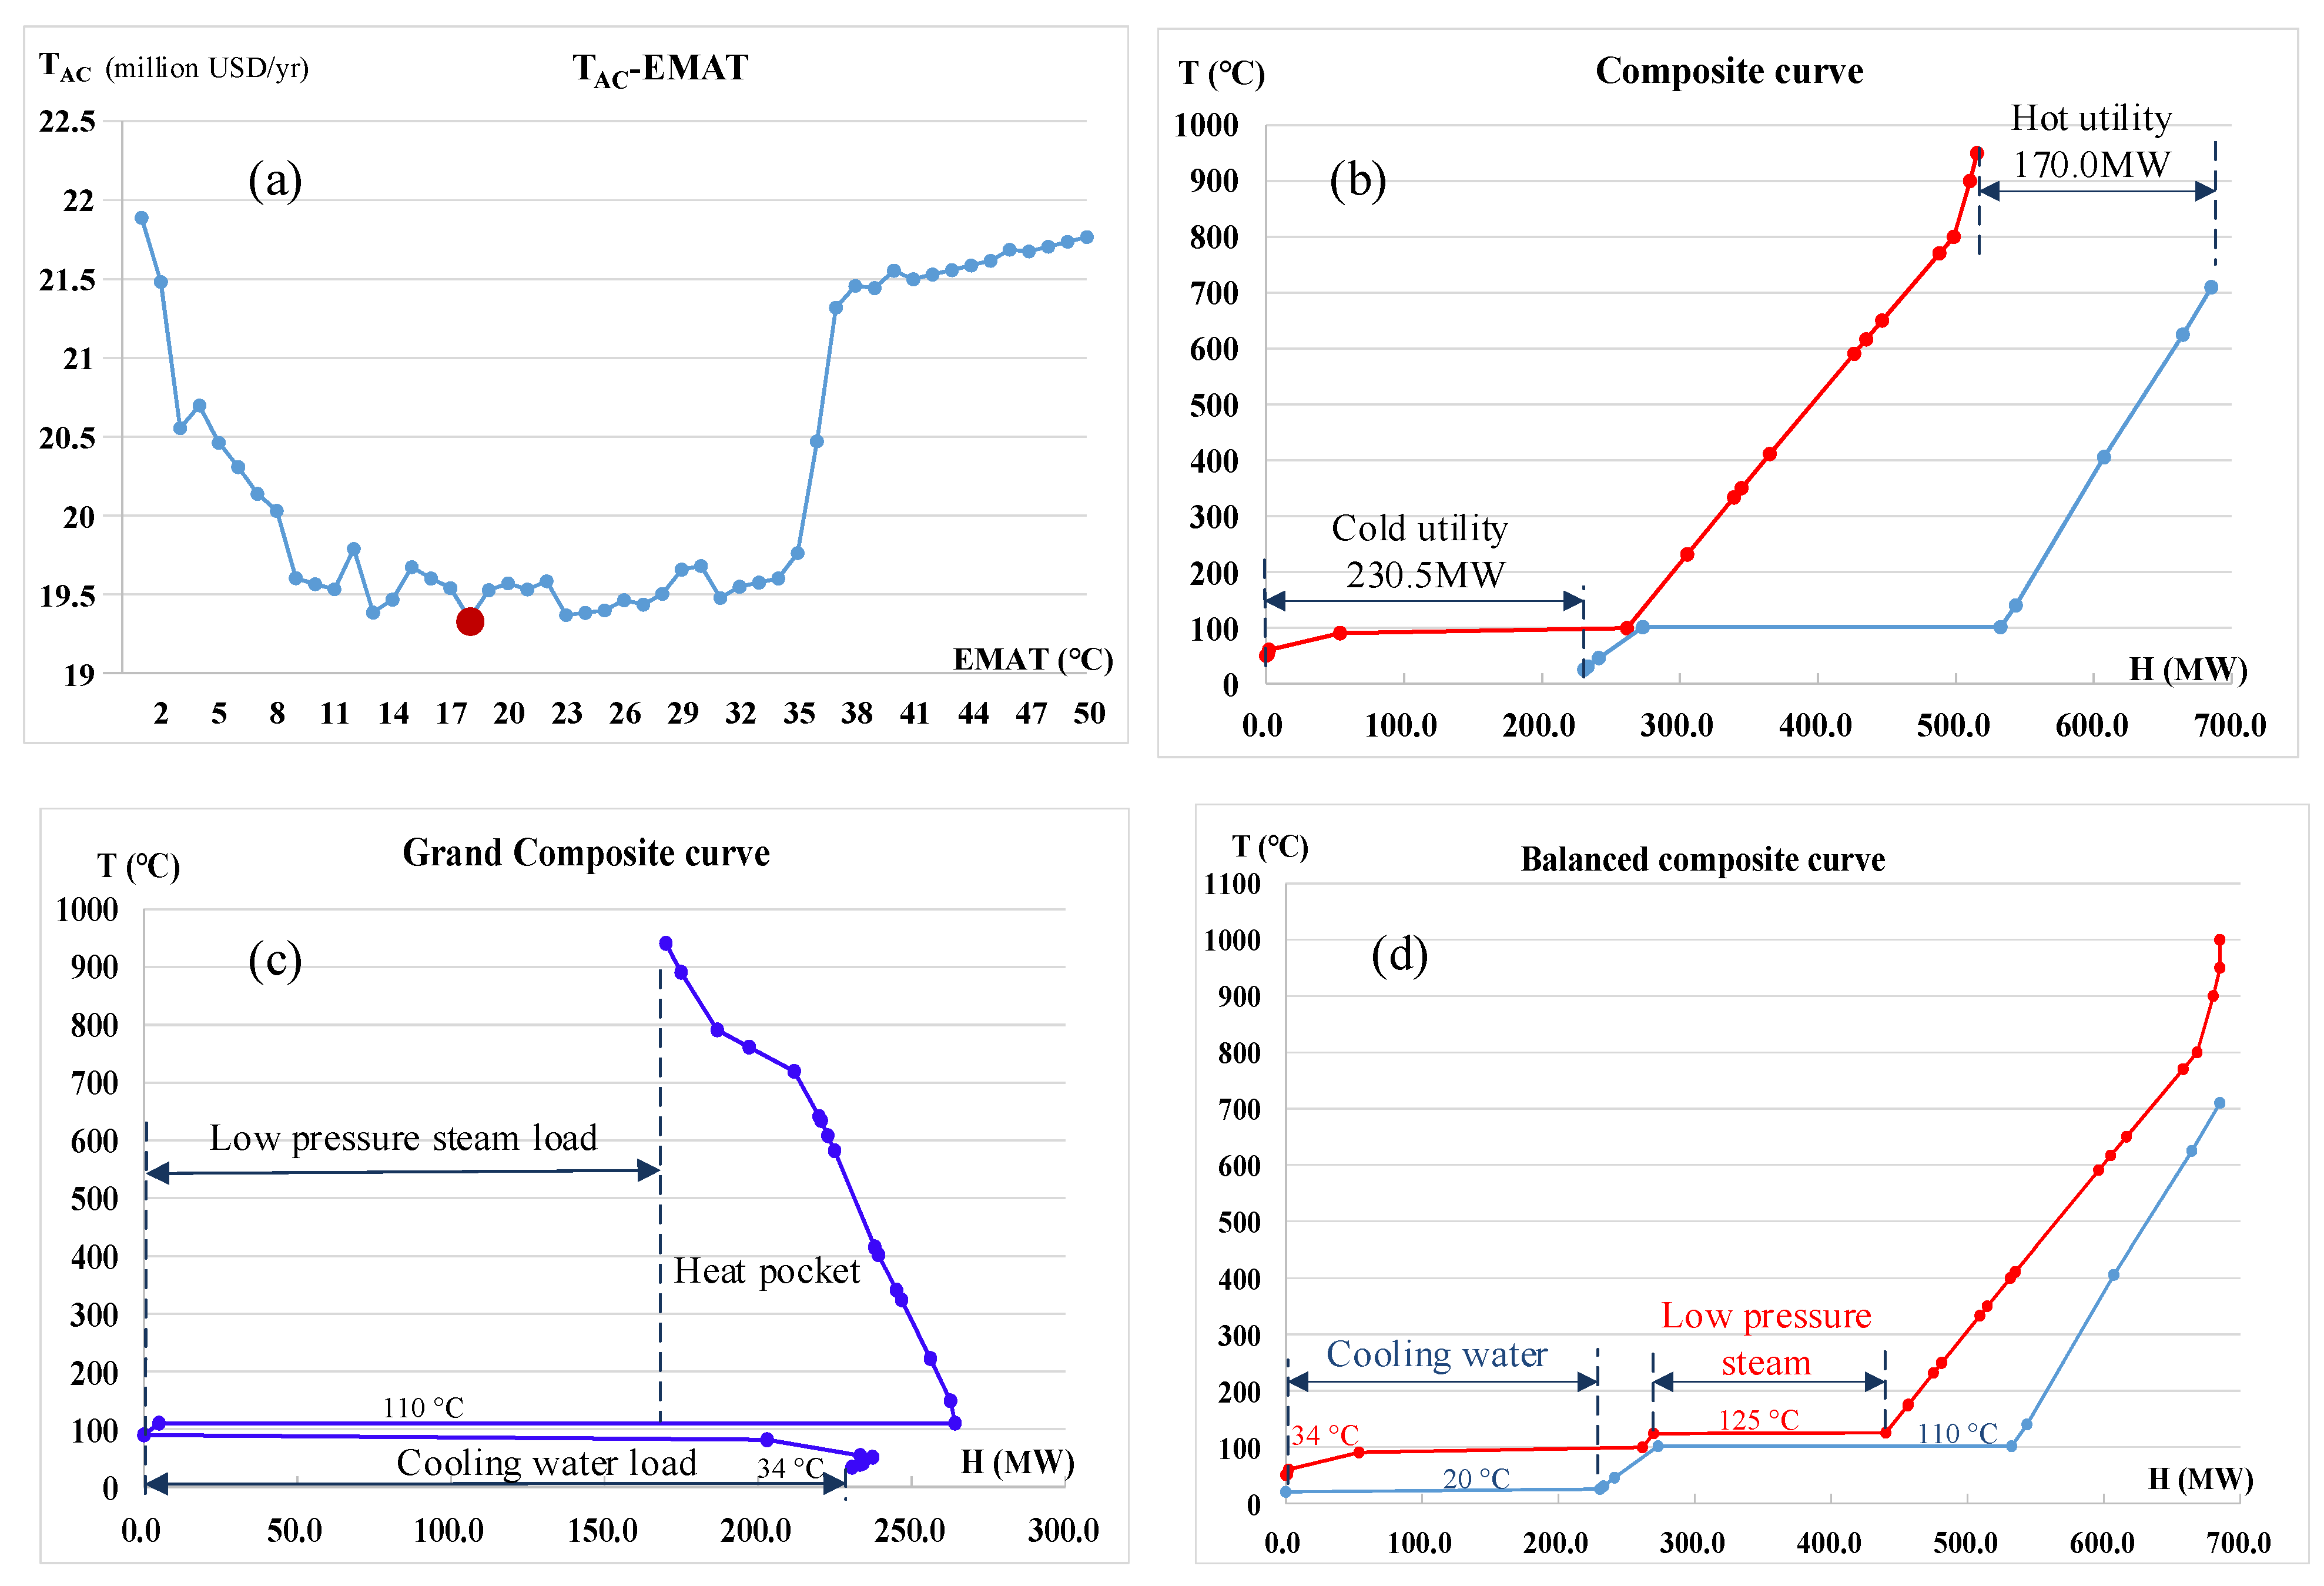
  • The estimate of ΔTmin in each heat exchange unit based on the minimum TAC according to TAC vs. ΔTmin diagrams;
  • The drawing composite curve, grand composite curve, and balanced composite curve are used to determine the amount of energy consumption and utility required;
  • Pinch analysis is applying to design the HENs from two aspects: (1) the HEN in each heat exchange unit is designed individually, and then the total site is analyzed when solving interplant integration; and (2) the HENs of the three heat exchange units are treated as a whole and are designed simultaneously;
  • Through heat integration from the above two aspects, the theoretical maximum heat recovery or the minimum energy requirement is obtained. Then, the economic feasibility of the two abovementioned schemes is compared basis the TAC;
  • The results of the previous steps provide insights for the heat recovery and utilization of the HEN system.

4. Results and Discussion

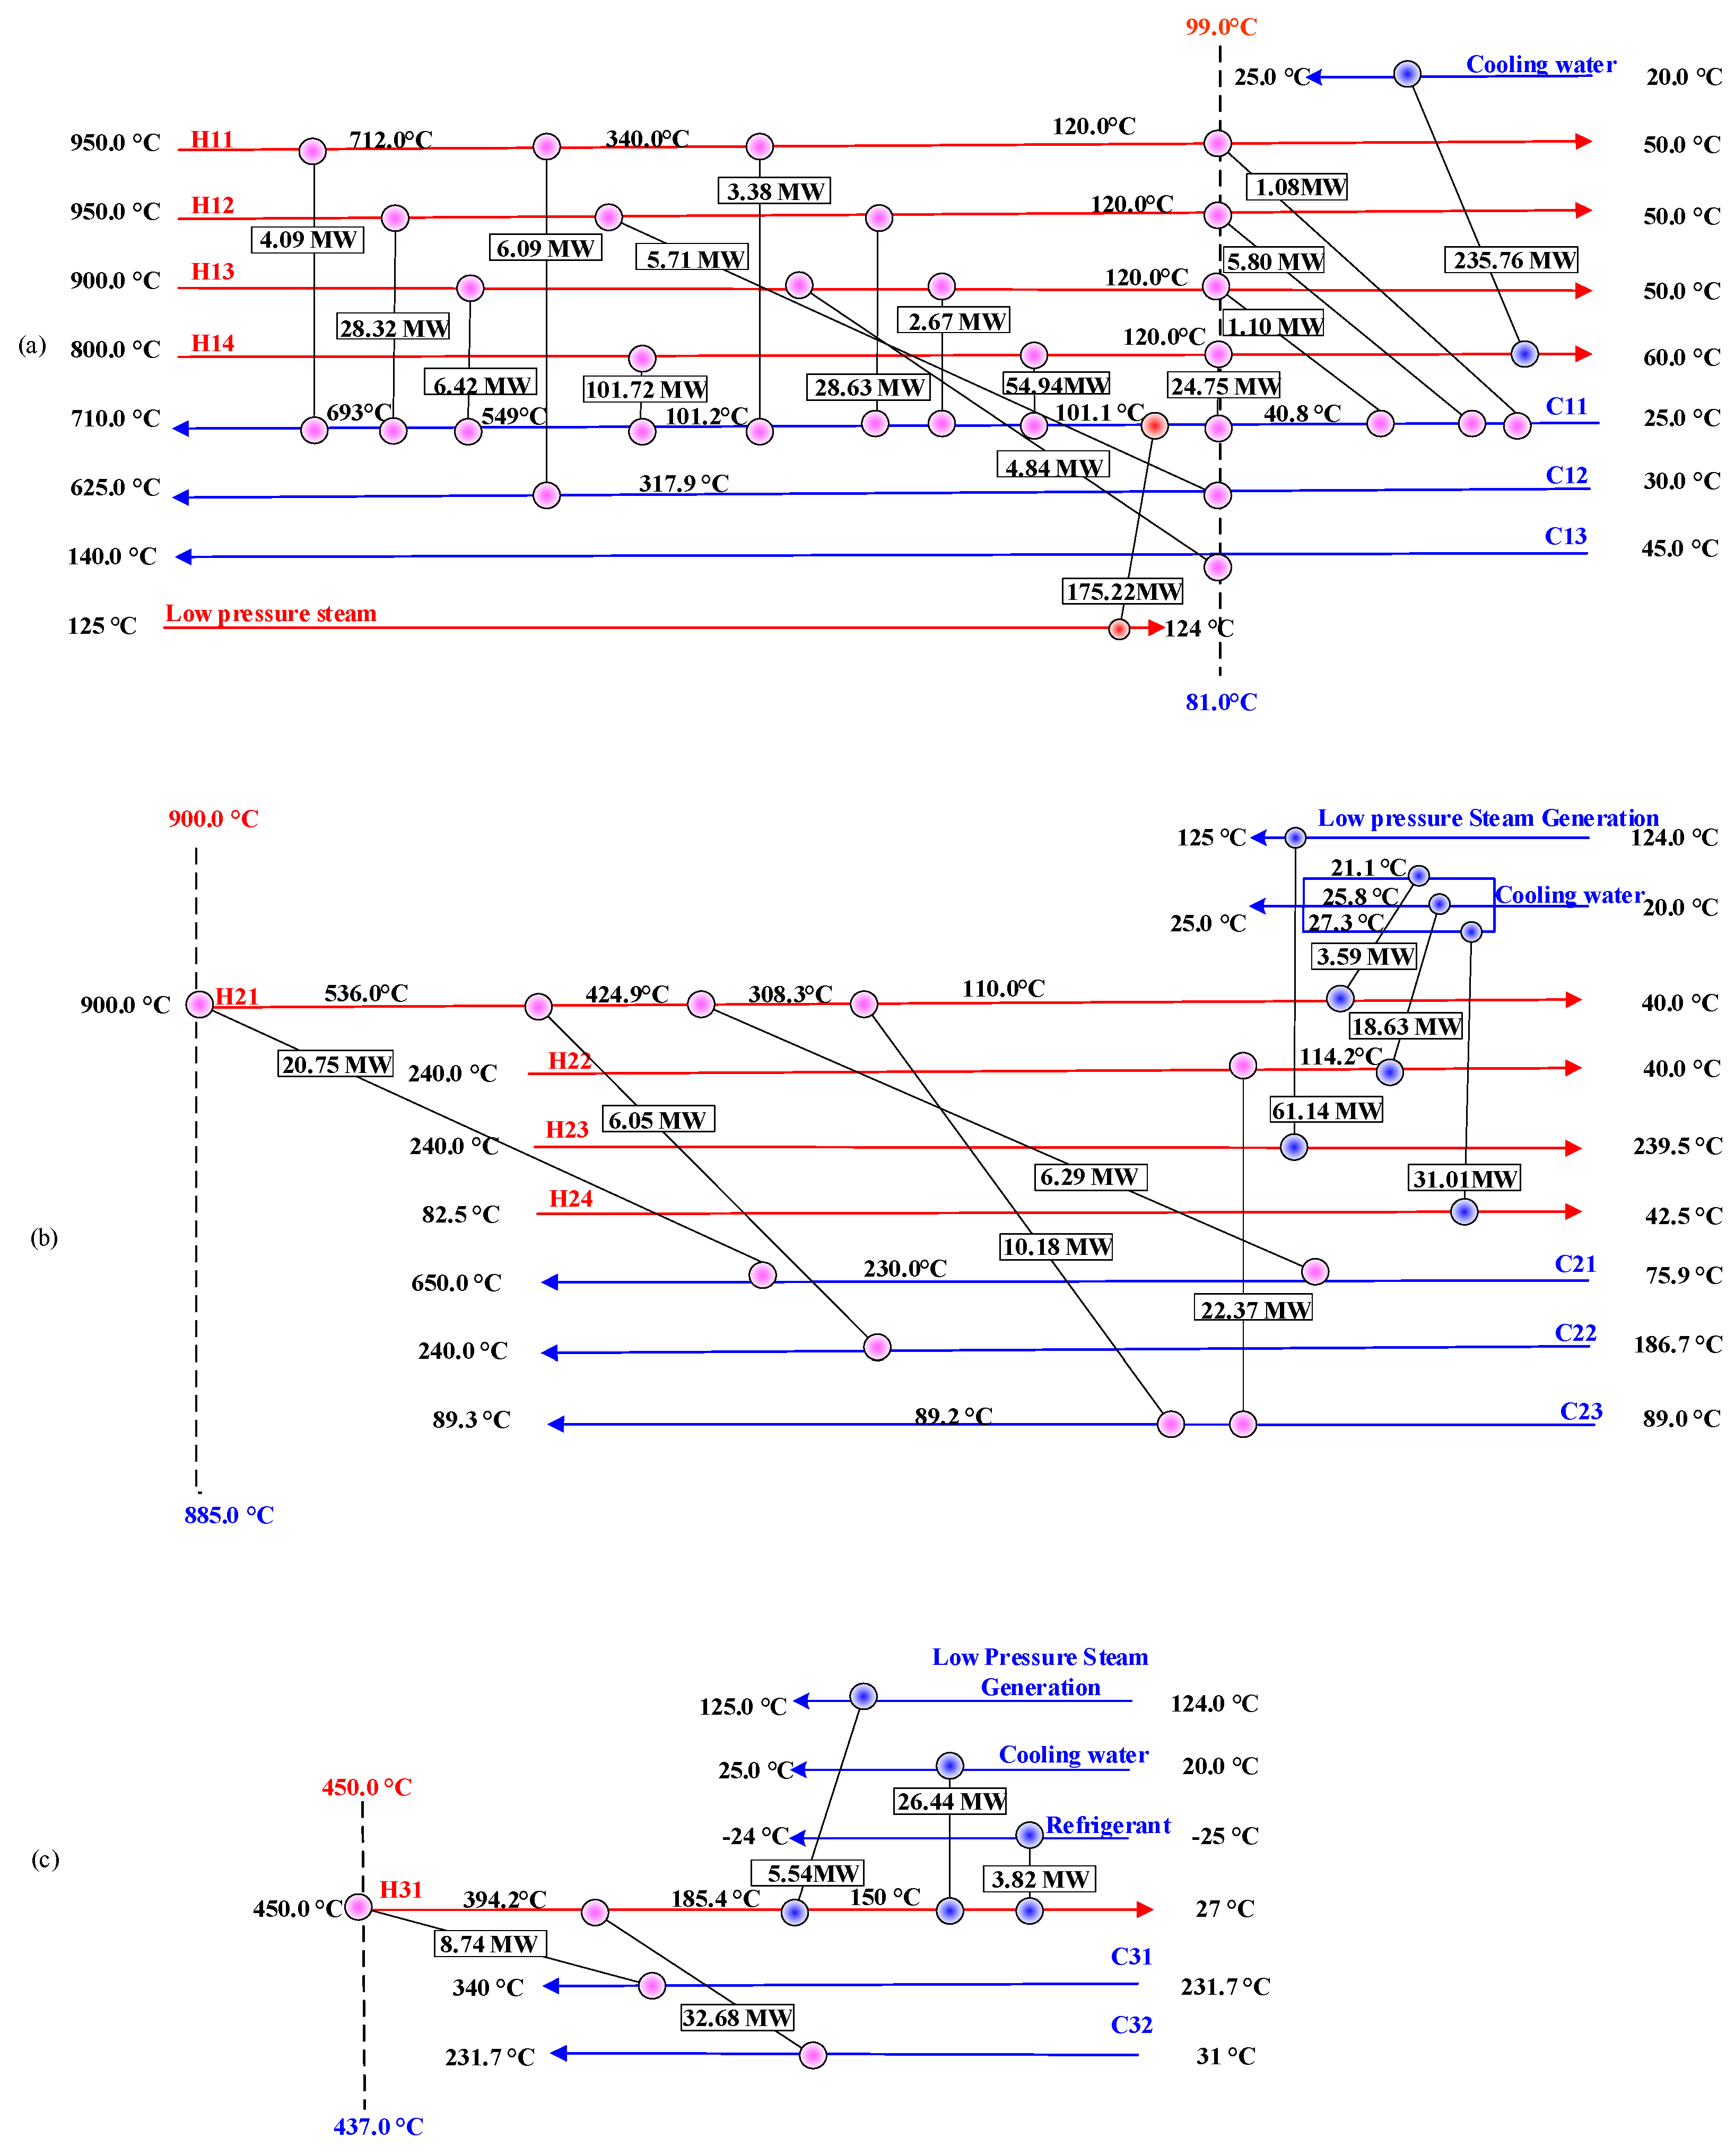
4.1. Heat Integration of the Three Heat Exchange Units

4.1.1. CLHG + COMB

Heat transfer flows of the CLHG + COMB system are presented in Table 2, which shows four hot streams and three cold streams. It also shows the supply temperature, target temperature, heat load, and mass flow of all streams for the CLHG + COMB. Data in Table 2 were obtained from the simulation calculation results of the system performance optimization in our previous study, and the specific calculation methods are presented in the reference [25].
The change of ΔTmin affects the operation and capital costs, thus affecting the TAC, as shown in Figure 3a. With an increase in ΔTmin, the TAC first decreased and then increased slowly, and the TAC reached the minimum value when ΔTmin = 18 °C. According to design experience, ΔTmin is between 15 and 20 °C; thus, the value of ΔTmin was set to 18 °C. The cold and hot composite curves of CLHG + COMB are shown in Figure 3b. The HEN needs heating as well as cooling utilities. The pinch at 90 °C corresponds to 99 °C and 81 °C for the hot and cold composite curves, respectively; then, the heat and cold utilities are 170.0 and 230.5 MW, respectively. The steam outlet of the SR released a large amount of latent heat of vaporization, and the steam entering the SR absorbed a large amount of latent heat of vaporization. The grand composite curve of CLHG + COMB is shown in Figure 3c, with a large “heat pocket” to the right of the dotted line, indicating that a large amount of heat can be recovered by internal heat transfer between cold and heat flows. With the “heat pocket” removed, the target temperatures of streams in the HEN that need to be heated is 110 °C, and the low-pressure steam temperature is 125 °C, which can meet the requirement of heating, and the low-pressure steam pressure is lower and safer, so the low-pressure steam is selected as the heat utility. The target temperature of streams in the HEN that need to be cooled is 34 °C, and the temperature of cooling water is 20–25 °C, which can meet the requirements of cooling, so the cooling water is selected as the cold utility.
The balanced composite curve is shown in Figure 3d. It can be seen that the low-pressure steam and the cooling water can meet the requirements of the HENs.
According to Figure 4a, the cold flow C11 absorbed a large amount of latent heat of vaporization during heating from cold water to superheated steam and the target temperature of 710 °C was achieved. Based on this feature, the high-temperature hot streams exchanged heat with C11 and the latent heat of vaporization required by C11 were provided by low-pressure steam; thus, hot utilities at high temperature and reduction of operation costs were not required. The position of the pinch point can be seen in Figure 4a. The HEN required 175.22 MW of low-pressure steam and 235.76 MW of cooling water.
The costs of HENs for CLHG + COMB are summarized in Table 3; the operating cost of the heat exchange unit was USD 12.64 million/year, the capital cost was USD 47.160 million, and the TAC was USD 18.85 million/year.

4.1.2. DRU + MSU

The heat transfer flows of the DRU+MSU are shown in Table 2, with four hot streams and three cold streams. The supply temperature, target temperature, heat load, and mass flow of all streams for DRU+MSU are also listed.
As shown in Figure 5a, the total investment was negative, indicating that the HEN could produce steam and gain benefits. With an increase in ΔTmin, the benefit first increased and then decreased, and reached the maximum at ΔTmin = 5 °C. Combined with design experience, when the heat transfer stream was in the gas phase, ΔTmin was in the range 15–30 °C, between 15 °C and 30 °C; the most steam was produced and the maximum benefit was obtained at 15 °C. Thus, the value of ΔTmin was set to 15 °C. The hot and cold composite curves of the network for DRU + MSU are shown in Figure 5b. This case is the well-known threshold problem, as a special type of pinch analysis, and it required cold utility of 114.4 MW, no hot utility, and pinch at 900 °C for the hot composite curve. The grand and balanced composite curves of the DRU + MSU are shown in Figure 5c,d, respectively, from which it can be seen that this HEN system can produce high-pressure steam (250 °C) and medium-pressure steam (175 °C) during the cooling process. The HEN of CLHG + COMB required low-pressure steam, as shown in Section 4.1. CLHG + COMB. To realize energy integration between the heat exchange units, the high-pressure steam and medium-pressure steam generated by the DRU + MSU can be transported to the high and medium pressure pipe network for integration; however, its conversion to low-pressure steam will lead to energy waste and increase the equipment cost. Based on the above analysis, the low-pressure steam generation is selected as the cold utility. Moreover, the target temperature of streams in this HEN that needs to be cooled is 37 °C, and the temperature of cooling water is 20–25 °C, which can meet the requirements of cooling, so the cooling water is also selected as cold utility.
The HEN design of the DRU + MSU is illustrated in Figure 4b, in which the HEN achieves the energy target, that is, the heat exchange between cold and hot streams has reached the maximum heat recovery and the utility is the minimum. The hot stream H23 represents the heat released by the methanol synthesis reactor, which could generate medium-to-low pressure steam of 61.14 MW. For H24 in the condenser of the methanol rectification tower, the cold utility was cooling water (cooling load = 31.01 MW). For the hot streams H21 and H22, the cold utility was cooling water (cooling load = 22.22 MW).
The cost of the HEN for DRU+MSU are summarized in Table 3; the benefit of the heat exchange unit was USD 3.29 million/year, the capital cost was USD 2.523 million, and the total benefit was USD 2.958 million/year.

4.1.3. APU

The heat transfer flows of the APU are shown in Table 2, with one hot stream and two cold streams. The supply temperature, target temperature, heat load, and mass flow of all streams for APU are also shown.
The influence of ΔTmin on the TAC is shown in Figure 6a. With an increase in ΔTmin, the TAC first decreased and gradually produced benefits; the benefits first increased and then decreased, and the total benefits reached the maximum value when ΔTmin = 13 °C. Based on design experience, ΔTmin range was 10–20 °C; thus, the value of ΔTmin was set to 13 °C. The hot and cold composite curves of the network for APU are shown in Figure 6b. This case is the threshold problem, with cold utility of 35.8 MW, no hot utility, and pinch at 450 °C for the hot composite curve. The grand and balanced composite curves of DRU + MSU are shown in Figure 6c,d, respectively, from which it can be seen that this HEN system can produce high pressure steam (250 °C) during the cooling process. However, in view of the demand of low-pressure steam for the HEN of CLHG + COMB, the low-pressure steam generation is selected as the cold utility. Moreover, the target temperature of streams in this HEN that needs to be cooled is 20.5 °C, and the cooling water could not fully meet the requirements of cooling; therefore, in addition to the low-pressure steam generation and cooling water, the refrigerant (−25° C) is also selected as cold utility. The refrigerant load (238 kW) is very small compared to that of high-pressure steam generation and cooling water, which is not shown in the Figure 6d.
The HEN designed for APU is shown in Figure 4c, in which the HEN reaches the energy target. The hot flow H31 could heat the cold flows C31 and C32 to the target temperature; this generated low-pressure steam 5.54 MW, and its cold utility was cooling water (26.44 MW) and refrigerant (3.82 MW). The cost of HEN for APU is summarized in Table 3. The operating cost was USD 0.1763 million/year, capital cost was USD 0.4343 million, and the TAC was USD 0.2334 million per year.
The total site profile for the system is illustrated in Figure 7, in which 175.22 MW low-pressure steam is required; total site produced 66.68 MW low-pressure steam. By integrating these low-pressure steam flows, the hot utility was decreased to 108.54 MW and 288.75 MW cold utility was consumed.

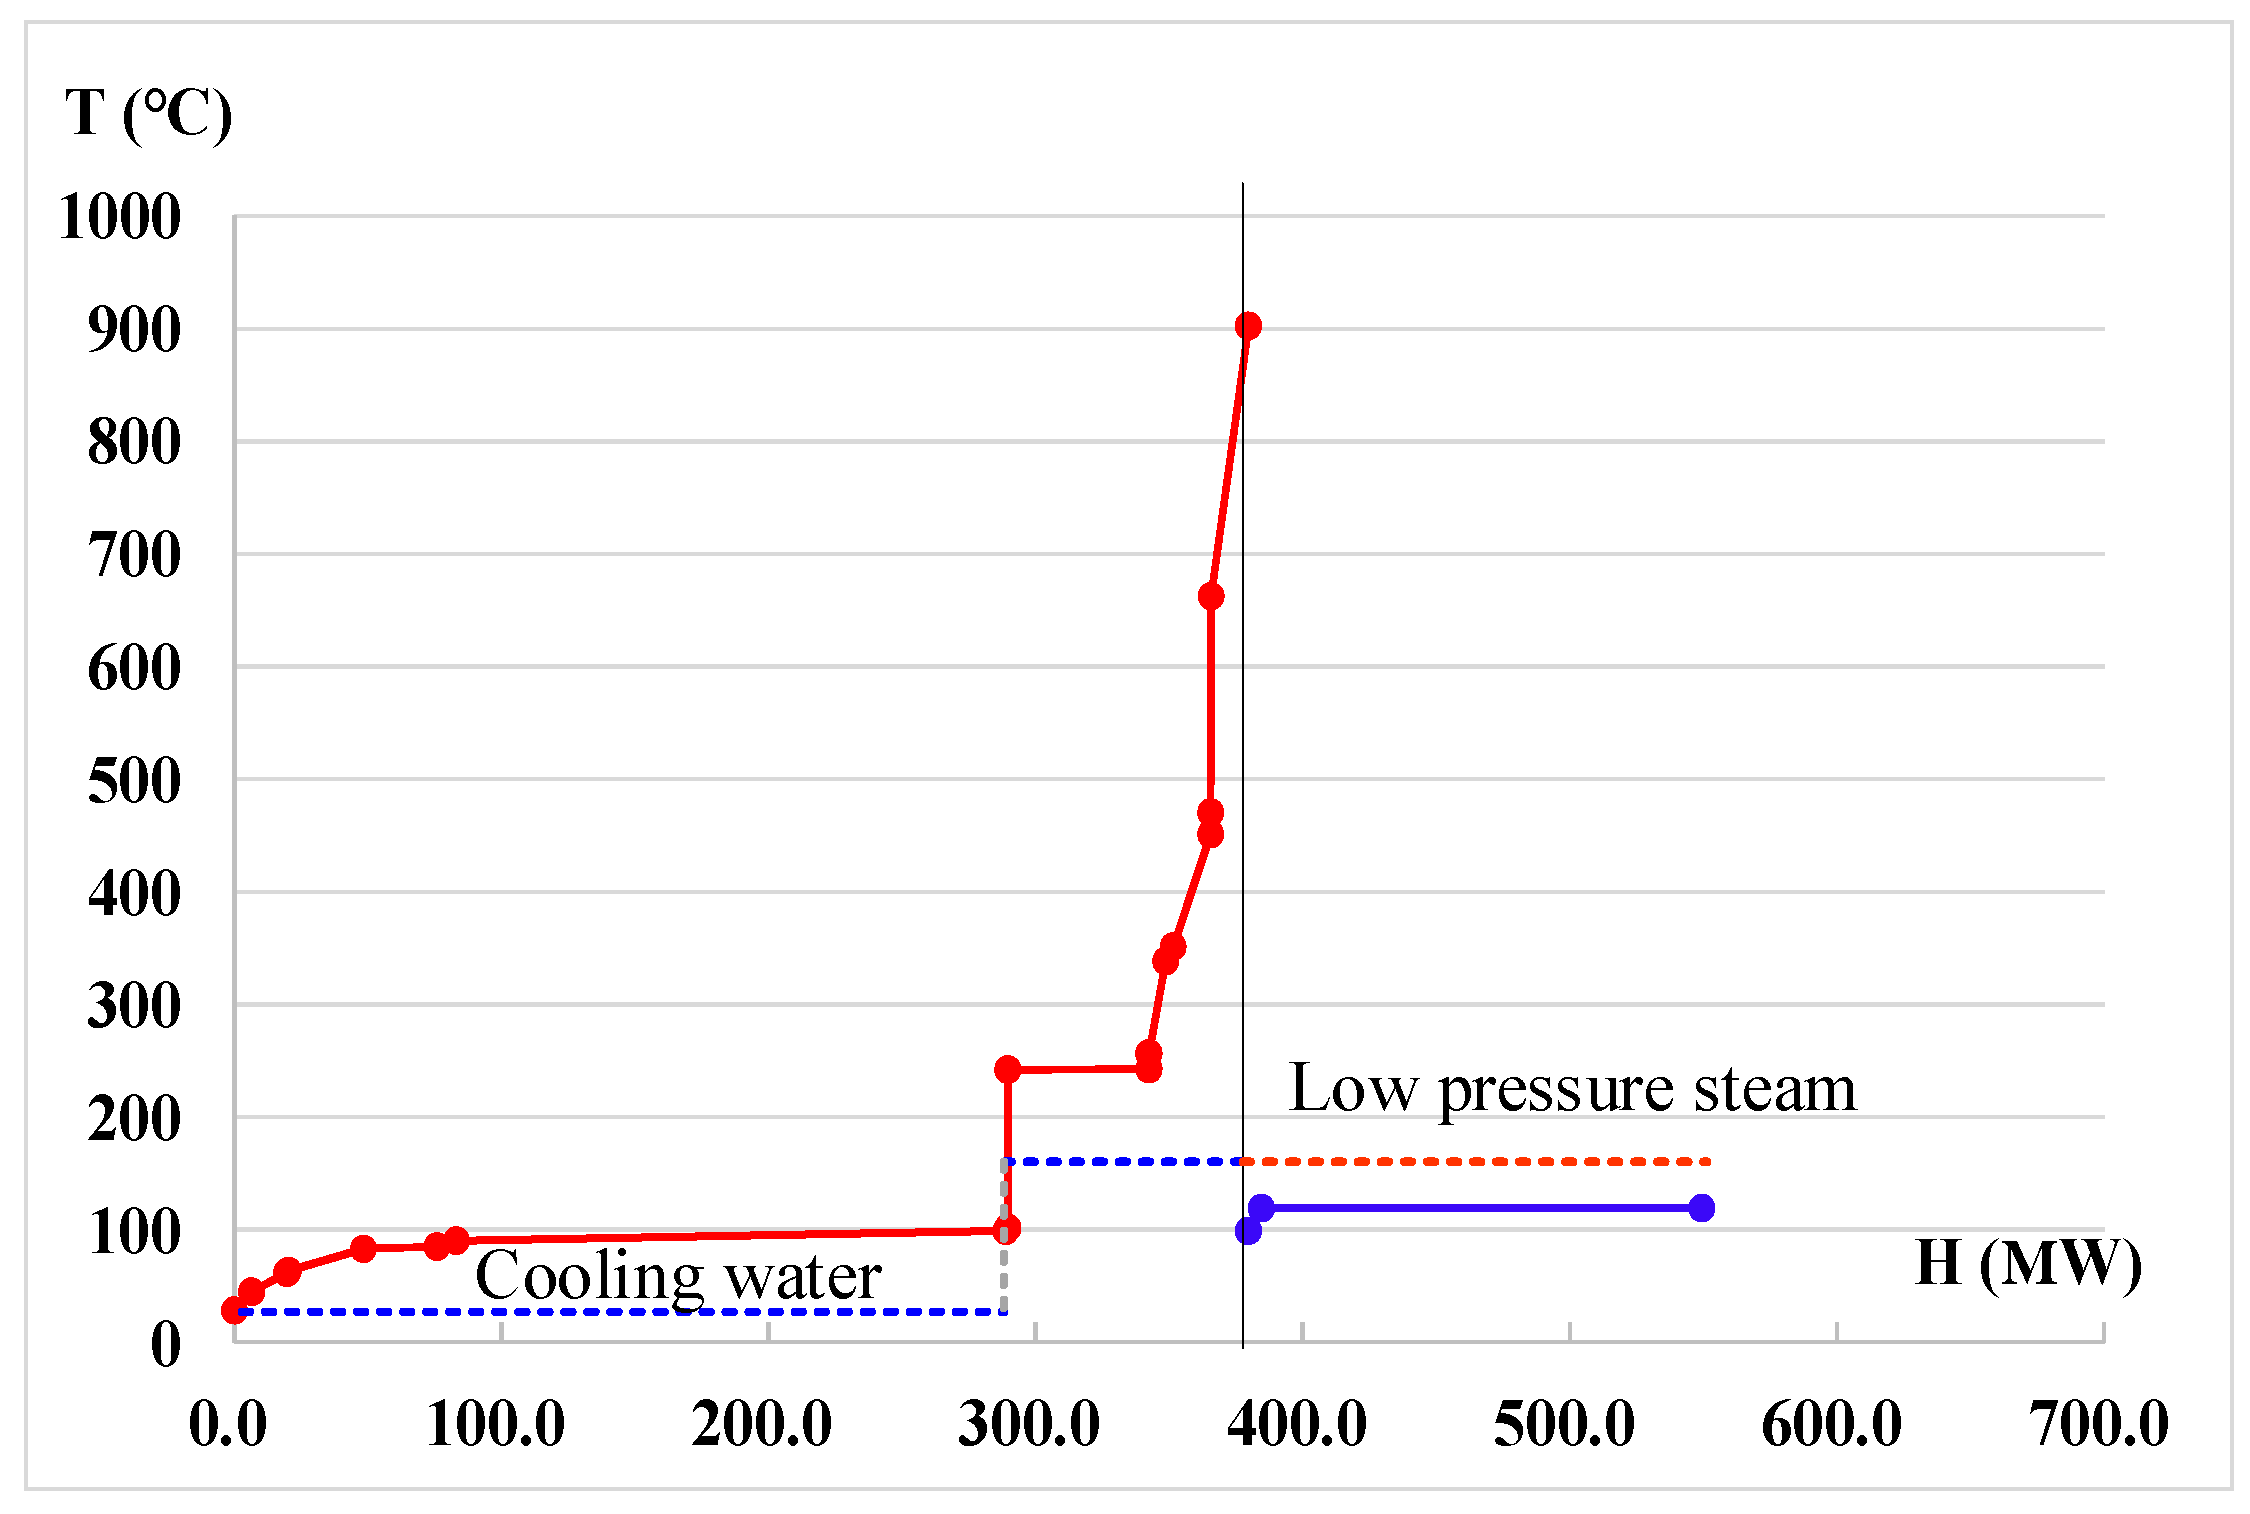
4.2. Heat Integration of the System as a Whole

When all heat exchange units, including nine hot streams and eight cold streams, were combined, it increased the possibility of internal heat exchange between the cold and heat streams, leading to recovery of more energy and reducing utility consumption as well as the TAC.
As can be seen from Figure 8a, with increase in ΔTmin, the TAC first decreased and then increased greatly, and the TAC reached the minimum value when ΔTmin = 8 °C. The HENs of DRU + MSU have gas phase and the heat exchange temperature difference is between 15–30 °C. In the heat integration of the system, the overall heat transfer contains that of DRU+MSU, as a result, the overall heat transfer temperature difference also should be chosen between 15–30 °C, accordingly. Combined with design experience, when there was heat transfer in gas phase, ΔTmin was in the range 15–30 °C. In this interval, the value of TAC increased gradually, and the minimum value of TAC can be obtained at 15 °C. Thus, the value of ΔTmin was set to 15 °C. The hot and cold composite curves of this system are shown in Figure 8b. The pinch point shifted to 96.5 °C (104 and 89 °C for the hot and cold composite curves, respectively), and the minimum heat and cold utilities were 79.0 and 289.9 MW, respectively. The grand composite curve of the system is shown in Figure 8c. There is a relatively large “heat pocket” on the right of the dotted line, indicating that a large amount of heat can be recovered through internal heat exchange between the cold and hot streams of the system. The balanced composite curve of the system is shown in Figure 8d. With the “heat pocket” removed, the target temperature of streams in the HEN that need to be heated is 106 °C, and the low-pressure steam can meet the requirements of heating, so the low-pressure steam is selected as the heat utility. Moreover, the target temperature of streams in this HEN that needs to be cooled is 19 °C; therefore, in addition to the cooling water (20–25 °C) and air (30–35 °C), the refrigerant (−25 °C) is also selected as cold utility. The refrigerant load (238 kW) and cooling water load (6097 kW) are very small compared to that of air cooling, which is not shown in the Figure 8d. The HEN design of the system is shown in Figure 9. It required low-pressure steam (85.83 MW) and cold utilities of air cooling (261.5 MW), cooling water (21.43 MW), and refrigerant (13.59 MW).
The cost of the HEN for the system are summarized in Table 3. The operating cost was USD 6.7440 million/year, the capital cost was USD 57.990 million, and the TAC was USD 14.3700 million/year.

4.3. Discussion

The HEN of the system as a whole (Figure 9) was compared with the HENs of CLHG + COMB (Figure 4a), DRU+MSU (Figure 4b), and APU (Figure 4d). In the CLHG + COMB HEN, the cold flow C11 was heated by the hot streams (H11, H12, H13, H14) to 90.0 °C and then heated to 101.1 °C by the hot utility (the total heat load = 175.22 MW). For the whole HEN system, the cold stream C11 was heated by the hot streams (H14, H22, H24) to 101.1 °C and the total heat utility load was 85.83 MW when the C11 was further heated by utility to the same state as the in the HENs of CLHG + COMB. The lower heat utility load for the HEN of the system as a whole was due to the fact that more heat can be exchanged between the hot streams (H14, H22, H24) and the cold water C11. In the case of DRU + MSU HEN, the hot stream H24 was cooled to a target temperature of 42.5 °C by cold utilities (cooling load = 31.01 MW). In the HEN of the system as a whole, the hot stream H24 was cooled to 81.9 °C by cold stream C11 and then cooled to 42.5 °C by cold utility with a cooling load of 9.87 MW. The hot stream H31 was cooled by cold streams C31 and C32 to 185.4 °C, with a minimum temperature difference of 110 °C, and then cooled by cold utilities (cooling load = 35.80 MW). In the HEN of the system as a whole, the hot stream H31 was cooled to 55.5 °C by cold streams C11, C31, C22, and C32 and then cooled by cold utilities (cooling load = 13.59 MW). For the HEN of the system as a whole, the increase in heat exchange of the process streams within the system brings the heat exchange streams temperature closer to the target temperature, resulting in lower utility consumptions. Therefore, the heat and cold utilities of the HEN of the system as a whole were 22.71 and 89.44 MW, respectively, lower than that of the HEN for the three heat exchange units, resulting in a reduction of USD 3,052,300 per year in operating costs. Compared with the HEN of the three heat exchange units, the heat exchange area of the HEN for the system as a whole increased by 45,234.9 m2; as a result, the capital cost increased by USD 7.8727 million, and the TAC decreased by USD 1,755,400 per year, as shown in Figure 10. The reduction in operating cost is sufficient to offset the increase in capital cost, and the TAC is reduced by 10.9%. Thus, the HEN designed as a whole improves energy efficiency.
This shows that when heat integration is carried out as a whole, the heat exchange streams are better matched and the internal heat exchange increases, resulting in a reduction in utility consumption and greater scope for energy savings. Before the system is put into practical construction, the project economics can be studied based on the results achieved in this study, using the cost of total energy savings against the total capital cost of heat exchangers required to be installed, and the most economical and feasible plant construction plan can be sought. This will avoid the energy waste and investment costs to a certain extent compared with the later retrofit, achieving the effect of energy saving and emission reduction. This study, however, is only a theoretical analysis; in plant construction, various practical factors should be considered comprehensively to enable effective decision-making.

5. Conclusions

In this study, pinch analysis is used to integrate and optimize the HEN of the conversion of PC and COG to methanol and ammonia with chemical looping technology (PCCLHG-CGTMA). When the HEN is designed individually, the HEN of CLHG + COMB requires 175.22 MW of low-pressure steam, and the HENs of DRU+MSU and APU produce 61.14 MW and 5.54 MW of low-pressure steam, respectively. By integrating these low-pressure steam flows with CLHG + COMB, the heat utility of the total site can be decreased to 108.54 MW, and the HEN designed individually requires cold utility of 288.75 MW. Compared to the HEN designed individually, the HEN designed as a whole requires 85.83 MW low-pressure steam and 296.52 MW cold utilities, saving a total of 112.12 MW of hot and cold utilities. For the HEN designed as a whole, the reduction in operating cost is sufficient to offset the increase in capital cost, with 10.9% reduction in TAC. Thus, both heat recovery and capital cost affect the economics of the heat integration process. For the PCCLHG-CGTMA system, when heat integration is carried out as a whole, there are more opportunities for energy saving and cost reduction, which have a greater impact on the TAC. Therefore, the economics of the HEN designed as a whole is more competitive for heat integration project.

Author Contributions

Y.Z. (Yaxian Zhao): Conceptualization, Methodology, Software, Writing—Original Draft, and Formal analysis. Y.Z. (Yingjie Zhao): Investigation, Software, and Formal analysis. Y.H.: Software and Formal analysis. J.W.: Project Administration and Supervision. W.B.: Conceptualization and Supervision. L.C.: Supervision. L.S.: Conceptualization and Methodology. Q.Y.: Methodology, Project Administration, Supervision, Writing—Reviewing and Editing, and Funding acquisition. All authors have read and agreed to the published version of the manuscript.

Funding

This research was funded by the Knowledge Innovation Program of Wuhan–Basic Research (2022020801010354), the Joint Fund of the Yulin University and the Dalian National Laboratory for Clean Energy (Grant. YLU-DNL Fund 2021021), the National Natural Science Foundation of China (51776133; U1810125), Shanxi-Zheda Institute of Advanced Materials and Chemical Engineering (2022SX-TD015), and the Science and Technology Innovation Program of Shanxi Provincial Education Department—China (2020L0611).

Acknowledgments

The authors gratefully acknowledge the financial support of the Knowledge Innovation Program of Wuhan –Basic Research, the Joint Fund of the Yulin University and the Dalian National Laboratory for Clean Energy the National Natural Science Foundation of China (51776133; U1810125), Shanxi-Zheda Institute of Advanced Materials and Chemical Engineering (2022SX-TD015), and the Science and Technology Innovation Program of Shanxi Provincial Edu-cation Department—China.

Conflicts of Interest

The authors declare that they have no known competing financial interests or personal relationships that could have appeared to influence the work reported in this paper.

Nomenclature

Abbreviations
Rmolar ratio of (H2-CO2)/(CO+CO2)
PCpulverized coke
APUammonia production unit
CLCchemical looping combustion
COGcoke-oven gas
DRUdry reforming unit
HENheat exchanger network
MSUmethanol synthesis unit
TACtotal annual cost
CLHGchemical looping hydrogen generation
COMBcombustion unit
PCCLHG-CGTMAPC CLHG assisted COG to methanol and ammonia
Notations in formulation
Aheat transfer surface area
Ccost
Nnumber
Qheat duty
Uheat transfer coefficient
mmass flow
CCcapital cost
CPheat capacity flow rate
Cpspecific heat capacity
CUcold utility
HUhot utility
OCoperation cost
PLthe plant life cycle
RORthe rate of return
Δ T C temperature differences at cold end of the heat exchange interval
Δ T H temperature differences at hot end of the heat exchange interval
Δ T L M the log means temperature difference
ΔTminminimum heat exchange temperature difference at pinch point
Subscripts
Crelating to cold stream
Hrelating to hot stream
irelating to the individual heat transfer device in each zone
CUcold utility
HUhot utility
totrelating to the total quantity in each zone

References

  1. Keshavarz, A.; Mirvakili, A.; Chahibakhsh, S.; Shariati, A.; Rahimpour, M.R. Simultaneous methanol production and separation in the methanol synthesis reactor to increase methanol production. Chem. Eng. Process.—Process Intensif. 2020, 158, 108176. [Google Scholar] [CrossRef]
  2. Ishaq, H.; Dincer, I. Dynamic modelling of a solar hydrogen system for power and ammonia production. Int. J. Hydrog. Energy 2021, 46, 13985–14004. [Google Scholar] [CrossRef]
  3. NBS (National Bureau of Statistics). China Energy Statistics Yearbook; NBS: Beijing, China, 2021.
  4. Yi, Q.; Gong, M.-H.; Huang, Y.; Feng, J.; Hao, Y.-H.; Zhang, J.-L.; Li, W.-Y. Process development of coke oven gas to methanol integrated with CO2 recycle for satisfactory techno-economic performance. Energy 2016, 112, 618–628. [Google Scholar] [CrossRef]
  5. Yang, Z.; Ding, W.; Zhang, Y.; Lu, X.; Zhang, Y.; Shen, P. Catalytic partial oxidation of coke oven gas to syngas in an oxygen permeation membrane reactor combined with NiO/MgO catalyst. Int. J. Hydrog. Energy 2010, 35, 6239–6247. [Google Scholar] [CrossRef]
  6. Razzaq, R.; Li, C.; Zhang, S. Coke oven gas: Availability, properties, purification, and utilization in China. Fuel 2013, 113, 287–299. [Google Scholar] [CrossRef]
  7. Yi, Q.; Li, W.; Feng, J.; Xie, K. Carbon cycle in advanced coal chemical engineering. Chem. Soc. Rev. 2015, 44, 5409–5445. [Google Scholar] [CrossRef]
  8. Gong, M.-H.; Yi, Q.; Huang, Y.; Wu, G.-S.; Hao, Y.-H.; Feng, J.; Li, W.-Y. Coke oven gas to methanol process integrated with CO2 recycle for high energy efficiency, economic benefits and low emissions. Energy Convers. Manag. 2017, 133, 318–331. [Google Scholar] [CrossRef]
  9. Xiang, D.; Xiang, J.; Liu, S.; Sun, Z.; Jiang, Y.; Dong, Z.; Tao, Q.; Cao, Y. A chemical looping scheme of co-feeding of coke-oven gas and pulverized coke toward polygeneration of olefins and ammonia. Chem. Eng. J. 2018, 334, 1754–1765. [Google Scholar] [CrossRef]
  10. Zhu, X.; Shen, T.; Bollas, G.; Shen, L. Design and operation of a multi-stage reactor system for chemical looping combustion process. Fuel Process. Technol. 2021, 215, 106748. [Google Scholar] [CrossRef]
  11. Abuelgasim, S.; Wang, W.; Abdalazeez, A. A brief review for chemical looping combustion as a promising CO2 capture technology: Fundamentals and progress. Sci. Total Environ. 2021, 764, 142892. [Google Scholar] [CrossRef]
  12. Liu, Z.; Li, Z.; Zhang, Y.; Zhang, Y.; Zhao, B. Thermodynamic analysis of using chemical-looping combustion in Allam-Z cycle instead of common combustion. Energy Convers. Manag. 2022, 254, 115229. [Google Scholar] [CrossRef]
  13. Luo, M.; Yi, Y.; Wang, S.; Wang, Z.; Du, M.; Pan, J.; Wang, Q. Review of hydrogen production using chemical-looping technology. Renew. Sustain. Energy Rev. 2018, 81, 3186–3214. [Google Scholar] [CrossRef]
  14. Hou, F.; Kou, X.; Wang, Y.; Li, Y. Diffusion transport characteristic of carbon monoxide within calcium sulfate slit in chemical looping hydrogen production: Molecular dynamics simulation. Int. J. Hydrog. Energy 2022, in press. [Google Scholar] [CrossRef]
  15. Adanez, J.; Abad, A.; Garcia-Labiano, F.; Gayan, P.; de Diego, L.F. Progress in Chemical-Looping Combustion and Reforming technologies. Prog. Energy Combust. Sci. 2012, 38, 215–282. [Google Scholar] [CrossRef]
  16. Nourbakhsh, H.; Khani, Y.; Zamaniyan, A.; Bahadoran, F. Hydrogen and syngas production through dynamic chemical looping reforming-decomposition of methane. Int. J. Hydrog. Energy 2022, 47, 9835–9852. [Google Scholar] [CrossRef]
  17. Qing, M.; Jin, B.; Ma, J.; Zou, X.; Wang, X.; Zheng, C.; Zhao, H. Thermodynamic and economic performance of oxy-combustion power plants integrating chemical looping air separation. Energy 2020, 206, 118136. [Google Scholar] [CrossRef]
  18. Guo, W.; Zhang, R.; Shang, J.; Zhang, H.; Yang, B.; Wu, Z. Thermal behavior and kinetics analysis from liquid chemical looping gasification of cellulose with bismuth-based and antimony-based oxygen carriers. Fuel 2022, 321, 124047. [Google Scholar] [CrossRef]
  19. Salkuyeh, Y.K.; Adams, T.A. A new power, methanol, and DME polygeneration process using integrated chemical looping systems. Energy Convers. Manag. 2014, 88, 411–425. [Google Scholar] [CrossRef]
  20. Zhang, D.; Duan, R.; Li, H.; Yang, Q.; Zhou, H. Optimal design, thermodynamic, cost and CO2 emission analyses of coal-to-methanol process integrated with chemical looping air separation and hydrogen technology. Energy 2020, 203, 117876. [Google Scholar] [CrossRef]
  21. Chen, S.; Lior, N.; Xiang, W. Coal gasification integration with solid oxide fuel cell and chemical looping combustion for high-efficiency power generation with inherent CO2 capture. Appl. Energy 2015, 146, 298–312. [Google Scholar] [CrossRef]
  22. Xiang, D.; Huang, W.; Huang, P. A novel coke-oven gas-to-natural gas and hydrogen process by integrating chemical looping hydrogen with methanation. Energy 2018, 165, 1024–1033. [Google Scholar] [CrossRef]
  23. Dong, X.; Zhou, Y. Concept design and techno-economic performance of hydrogen and ammonia co-generation by coke-oven gas-pressure swing adsorption integrated with chemical looping hydrogen process. Appl. Energy 2018, 229, 1024–1034. [Google Scholar]
  24. Xiang, D.; Li, P.; Liu, L. Concept design, technical performance, and GHG emissions analysis of petroleum coke direct chemical looping hydrogen highly integrated with gasification for methanol production process. Sci. Total Environ. 2022, 838, 156652. [Google Scholar] [CrossRef]
  25. Zhao, Y.; Zhao, Y.; Yi, Q.; Li, T.; Wang, J.; Bao, W.; Chang, L. Highly flexible and energy-efficient process for converting coke-oven gas and pulverized coke into methanol and ammonia using chemical looping technology. Energy Convers. Manag. 2021, 248, 114796. [Google Scholar] [CrossRef]
  26. Bandyopadhyay, R.; Alkilde, O.F.; Upadhyayula, S. Applying pinch and exergy analysis for energy efficient design of diesel hydrotreating unit. J. Clean. Prod. 2019, 232, 337–349. [Google Scholar] [CrossRef]
  27. Brunet, R.; Boer, D.; Guillén-Gosálbez, G.; Jiménez, L. Reducing the cost, environmental impact and energy consumption of biofuel processes through heat integration. Chem. Eng. Res. Des. 2015, 93, 203–212. [Google Scholar] [CrossRef]
  28. Shemfe, M.B.; Fidalgo, B.; Gu, S. Heat integration for bio-oil hydroprocessing coupled with aqueous phase steam reforming. Chem. Eng. Res. Des. 2016, 107, 73–80. [Google Scholar] [CrossRef]
  29. Lei, G.; Yu, J.; Kang, H.; Li, Q.; Zheng, H.; Wang, T.; Yang, L.; Xuan, Z. A novel intercooled series expansion refrigeration/liquefaction cycle using pinch technology. Appl. Therm. Eng. 2019, 163, 114336. [Google Scholar] [CrossRef]
  30. Ebrahim, M.; Kawari, A. Pinch technology: An efficient tool for chemical-plant energy and capital-cost saving. Appl. Energy 2000, 65, 45–49. [Google Scholar] [CrossRef]
  31. Chen, Q.; Li, S.; Li, J. Energy efficiency optimization of methanol synthesis and distillation units. Chem. Eng. 2012, 40, 1–5. [Google Scholar] [CrossRef]
  32. Song, C.; Liu, Q.; Ji, N.; Kansha, Y.; Tsutsumi, A. Optimization of steam methane reforming coupled with pressure swing adsorption hydrogen production process by heat integration. Appl. Energy 2015, 154, 392–401. [Google Scholar] [CrossRef]
  33. Liu, X.; Liang, J.; Xiang, D.; Yang, S.; Qian, Y. A proposed coal-to-methanol process with CO2 capture combined Organic Rankine Cycle (ORC) for waste heat recovery. J. Clean. Prod. 2016, 129, 53–64. [Google Scholar] [CrossRef]
  34. Bokun, C.; Yu, Q.; Siyu, Y. Integration of thermo-vapor compressors with phenol and ammonia recovery process for coal gasification wastewater treatment system. Energy 2019, 166, 108–117. [Google Scholar] [CrossRef]
  35. Liu, S.; Yang, L.; Chen, B.; Yang, S.; Qian, Y. Comprehensive energy analysis and integration of coal-based MTO process. Energy 2021, 214, 119060. [Google Scholar] [CrossRef]
  36. Kim, Y.; Lim, J.; Shim, J.Y.; Lee, H.; Cho, H.; Kim, J. Optimizing wastewater heat recovery systems in textile dyeing processes using pinch analysis. Appl. Therm. Eng. 2022, 214, 118880. [Google Scholar] [CrossRef]
  37. El-Halwagi, M.M.; Gabriel, F.; Harell, D. Rigorous graphical targeting for resource conservation via material recycle/reuse networks. Ind. Eng. Chem. Res. 2003, 42, 4319–4328. [Google Scholar] [CrossRef]
  38. Manan, Z.A.; Alwi, S.; Ujang, Z. Water pinch analysis for an urban system: A case study on the Sultan Ismail Mosque at the Universiti Teknologi Malaysia (UTM). Desalination 2006, 194, 52–68. [Google Scholar] [CrossRef]
  39. Tan, R.R.; Foo, D.C.Y. Pinch analysis approach to carbon-constrained energy sector planning. Energy 2007, 32, 1422–1429. [Google Scholar] [CrossRef]
  40. Marques, J.P.; Matos, H.A.; Oliveira, N.M.C.; Nunes, C.P. State-of-the-art review of targeting and design methodologies for hydrogen network synthesis. Int. J. Hydrog. Energy 2017, 42, 376–404. [Google Scholar] [CrossRef]
  41. Alwi, S.; Rozali, N.; Abdul-Manan, Z.; Klemes, J.J. A process integration targeting method for hybrid power systems. Energy 2012, 44, 6–10. [Google Scholar] [CrossRef]
  42. Singhvi, A.; Shenoy, U.V. Aggregate Planning in Supply Chains by Pinch Analysis. Chem. Eng. Res. Des. 2002, 80, 597–605. [Google Scholar] [CrossRef]
  43. Tan, R.R.; Aviso, K.B.; Foo, D. Carbon emissions pinch analysis of economic systems. J. Clean. Prod. 2018, 182, 863–871. [Google Scholar] [CrossRef]
  44. Gai, L.; Varbanov, P.S.; Walmsley, T.G. Critical analysis of process integration options for joule-cycle and conventional heat pumps. Energies 2020, 13, 635. [Google Scholar] [CrossRef]
  45. Yang, A.; Jin, S.; Shen, W.; Cui, P.; Chien, I.L.; Ren, J. Investigation of energy-saving azeotropic dividing wall column to achieve cleaner production via heat exchanger network and heat pump technique. J. Clean. Prod. 2019, 234, 410–422. [Google Scholar] [CrossRef]
  46. Kamel, D.; Gadalla, M.; Ashour, F. New set of Graphical Axes for Grassroots Design of Heat Exchanger Networks for Chemical Engineering Applications. In Computer Aided Chemical Engineering; Pierucci, S., Manenti, F., Bozzano, G.L., Manca, D., Eds.; Elsevier: Amsterdam, The Netherlands, 2020; Volume 48, pp. 637–642. [Google Scholar]
  47. Fu, D.; Nguyen, T.; Lai, Y.; Lin, L.; Dong, Z.; Lyu, M. Improved pinch-based method to calculate the capital cost target of heat exchanger network via evolving the spaghetti structure towards low-cost matching. J. Clean. Prod. 2022, 343, 131022. [Google Scholar] [CrossRef]
  48. Araújo, A.; Skogestad, S. Control structure design for the ammonia synthesis process. Comput. Chem. Eng. 2008, 32, 2920–2932. [Google Scholar] [CrossRef]
  49. Yang, Q.; Yan, M.; Zhang, L.; Xia, X.; Wang, X. Thermodynamic analysis of chemical looping coupling process for coproducing syngas and hydrogen with in situ CO2 utilization. Energy Convers. Manag. 2021, 231, 113845. [Google Scholar] [CrossRef]
  50. Puig-Gamero, M.; Argudo-Santamaria, J.; Valverde, J.; Sánchez, P.; Sanchez-Silva, L. Three integrated process simulation using aspen plus®: Pine gasification, syngas cleaning and methanol synthesis. Energy Convers. Manag. 2018, 177, 416–427. [Google Scholar] [CrossRef]
  51. Linnhoff, B.; Mason, D.R.; Wardle, I. Understanding heat exchanger networks. Comput. Chem. Eng. 1979, 3, 295–302. [Google Scholar] [CrossRef]
  52. Linnhoff, B.; Hindmarsh, E. The pinch design method for heat exchanger networks. Chem. Eng. Sci. 1983, 38, 745–763. [Google Scholar] [CrossRef]
  53. Panjeshahi, M.H.; Ghasemian Langeroudi, E.; Tahouni, N. Retrofit of ammonia plant for improving energy efficiency. Energy 2008, 33, 46–64. [Google Scholar] [CrossRef]
  54. Quijera, J.A.; Garcia, A.; Alriols, M.G.; Labidi, J. Heat integration options based on pinch and exergy analyses of a thermosolar and heat pump in a fish tinning industrial process. Energy 2013, 55, 23–37. [Google Scholar] [CrossRef]
  55. Linnhoff, B.; Akinradewo, C.G. Linking process simulation and process integration. Comput. Chem. Eng. 1999, 23, S945–S953. [Google Scholar] [CrossRef]
  56. Aspelund, A.; Berstad, D.O.; Gundersen, T. An Extended Pinch Analysis and Design procedure utilizing pressure based exergy for subambient cooling. Appl. Therm. Eng. 2007, 27, 2633–2649. [Google Scholar] [CrossRef]
  57. Anantharaman, R.; Abbas, O.S.; Gundersen, T. Energy Level Composite Curves—A new graphical methodology for the integration of energy intensive processes. Appl. Therm. Eng. 2006, 26, 1378–1384. [Google Scholar] [CrossRef]
  58. Mehdizadeh-Fard, M.; Pourfayaz, F.; Mehrpooya, M.; Kasaeian, A. Improving energy efficiency in a complex natural gas refinery using combined pinch and advanced exergy analyses. Appl. Therm. Eng. 2018, 137, 341–355. [Google Scholar] [CrossRef]
  59. Sun, L. Energy System Optimization in Process Industries—Heat Exchanger Network and Steam Power System; Chemical Industry Press: Beijing, China, 2021. [Google Scholar]
  60. Mano, T.B.; Guillén-Gosálbez, G.; Jiménez, L.; Ravagnani, M.A.S.S. Synthesis of heat exchanger networks with economic and environmental assessment using fuzzy-Analytic Hierarchy Process. Chem. Eng. Sci. 2019, 195, 185–200. [Google Scholar] [CrossRef]
Figure 1. Schematic diagram of the PCCLHG-CGTMA process.
Processes 10 01879 g001
Figure 2. Flowchart of energy integration framework.
Processes 10 01879 g002
Figure 3. (a) TAC vs. ΔTmin, (b) cold and hot composite curves, (c) grand composite curve, and (d) balanced composite curve of CLHG+COMB. (Note: in figures (b,d), red line represents hot compound curve; blue line represents cold compound curve.).
Processes 10 01879 g003
Figure 4. Grid diagram of HENs for (a) CLHG + COMB, (b) DRU + MSU, and (c) APU.
Processes 10 01879 g004
Figure 5. (a) TAC vs. ΔTmin, (b) cold and hot composite curves, (c) grand composite curve, and (d) balanced composite curve of DRU + MSU. (Note: in figures (b,d), red line represents hot compound curve; blue line represents cold compound curve.)
Processes 10 01879 g005
Figure 6. (a) TAC vs. ΔTmin, (b) cold and hot composite curves, (c) grand composite curve, and (d) balanced composite curve of APU. (Note: in figures (b,d), red line represents hot compound curve; blue line represents cold compound curve.)
Processes 10 01879 g006
Figure 7. Total site profile for the system. (Note: red solid line represents heat source profile; blue solid line represents heat sink profile; red dashed line represents utility consumption curve; blue dashed line represents utility generation curve.)
Processes 10 01879 g007
Figure 8. (a) TAC vs. ΔTmin, (b) cold and hot composite curves, (c) grand composite curve, and (d) balanced composite curve of the system. (Note: in figures (b,d), red line represents hot compound curve; blue line represents cold compound curve.)
Processes 10 01879 g008
Figure 9. Grid diagram of HEN for the system.
Processes 10 01879 g009
Figure 10. Cost comparison of HENs designed individually and as a whole.
Processes 10 01879 g010
Table 1. Verification of simulation results for the key units.
UnitsT/°CP/MPaMolar RatioKey Component Conversion Rate/%Relative Error
Calculation FormulaLiteratureAspen
DRU8000.1CH4/CO2 = 1 C H 4   conversion = F C H 4 i n F C H 4 o u t F C H 4 i n % 89 [8]863%
H 2   selectivity = F H 2 o u t F H 2 i n 2 ( F C H 4 i n F C H 4 o u t ) % 97 [8]94
C O   selectivity = F CO o u t F CO i n F C H 4 i n F C H 4 o u t + F C O 2 i n F C O 2 o u t % 103 [8]106
MSU2405H2/CO = 2 C O   conversion = F CO i n F CO o u t F CO i n % 35 [50]332%
APU45020.3H2/N2 = 3 H 2   conversion = F H 2 i n F H 2 o u t F H 2 i n % 24 [48]270~3%
N 2   conversion = F N 2 i n F N 2 o u t F N 2 i n % 27 [48]27
N H 3   selectivity = F N H 3 o u t F N H 3 i n 2 ( F N 2 i n F N 2 o u t ) % 100 [48]100
Note: F i i n and F i o u t in the table are the flow rates of the inlet and outlet gas i, respectively.
Table 2. Hot and cold flow streams of HEN for CLHG + COMB, DRU + MSU, and APU.
Heat Exchange UnitsHeat ExchangerStream No.Supply TemperatureTarget TemperatureHeat LoadMass Flow
°C°CkWkg/s
CLHG + COMBHX5H119505014,63314.56
HX10H129505068,47062.77
HX8H139005015,02615.61
HX6H1480060417,174104.00
HX7C1125710438,123111.10
HX9C123062511,79818.65
HX11C1345140484450.40
DRU + MSUHX2H219004046,853.9329.28
HX4H222404041,003.9345.41
MSU-H23240239.561,133.81-
Distillation column-CondenserH2482.542.531,018.0324.32
HX1C2175.965027,039.5529.28
HX3C22186.72406046.5245.41
Distillation column-ReboilerC238989.332,548.64258.34
APUHX14H314502777,222.5047.13
HX13C31231.73408739.1723.56
HX12C3231231.732,678.3647.13
Table 3. Cost of HEN.
ItemCLHG + COMBDRU + MSUAPUThe Whole System
Total Area (m2)269,212.113,7402013330,200
Heating (million USD/y)11.06005.417
Cooling (million USD/y)1.58−3.290.17631.327
Operating (million USD/y)12.64−3.290.17636.744
Capital (million USD)47.162.5230.434357.99
Total Cost (million USD/y)18.85−2.9580.233414.37
Publisher’s Note: MDPI stays neutral with regard to jurisdictional claims in published maps and institutional affiliations.

