Article

Construction of Edge Computing Platform Using 3D LiDAR and Camera Heterogeneous Sensing Fusion for Front Obstacle Recognition and Distance Measurement System

Department of Electrical Engineering, National Chin-Yi University of Technology, Taichung 41170, Taiwan
*
Author to whom correspondence should be addressed.
Processes 2022, 10(9), 1876; https://doi.org/10.3390/pr10091876
Submission received: 15 August 2022 / Revised: 8 September 2022 / Accepted: 13 September 2022 / Published: 16 September 2022
(This article belongs to the Section Automation Control Systems)

Abstract

:
This research aims to utilise heterogeneous sensor fusion using 3D Light Detection and Ranging (LiDAR) and cameras, combined with an object recognition system and a ranging system, to construct an edge computing platform such that a vehicle equipped with the platform can perform computations offline in real time. This work comprises two main sections: the first is heterogeneous fusion, and the second is obstacle recognition and ranging detection. To achieve heterogeneous sensor fusion, 3D–3D point matching was used to find rigid body transformation between two sensors and finally project the LiDAR 3D point cloud image onto the 2D image. For object recognition, YOLOv4-Tiny was used as the detection network. A lightweight network architecture and high computational speed could be effectively used on edge computing hardware with limited performance. Further, by drawing the bounding box, we could detect the point cloud within the bounding box to estimate the distance to the obstacle. For detecting distance, we conducted experiments in two ways: ‘minimum point in box’ and ‘median point in box’ and compared the results. With heterogeneous sensor fusion, object recognition and the ranging system, detecting the category and distance of obstacles ahead of the vehicle was possible in real time. Furthermore, integrating the edge computing platform architecture enabled moving the entire system offline, making it an independent system that returns results in real time. Finally, a dynamic test was conducted on a road. The experiment showed that the detection speed of YOLOv4-Tiny in the dynamic test was higher than 60 FPS, and the accuracy rate surpassed 70%. Furthermore, the distance detection error of the 3D LiDAR was less than 3 cm, which is sufficiently accurate to be applied to complex environments on roads.

1. Introduction

The vigorous development of High-Performance Computing (HPC) and cloud computing have led to technological innovations in fields such as AI, intelligent robots and autonomous driving. In particular, car manufacturers worldwide are actively investing in autonomous vehicles and related technologies. Self-driving cars need to be equipped with various cutting-edge technologies to function, such as self-driving systems, GPS positioning, car body design and multiple sensors. The combination of technologies enables the car to constantly sense its surrounding environment and immediately respond to any emergency [1]. Technologies commonly used in anti-collision systems include image recognition, ultrasound, infrared, radar and LiDAR. Each has its own advantages and disadvantages and is useful in different situations. A complete anti-collision system requires multiple sensors working together, combining the strengths of multiple sensors to achieve heterogeneous sensor fusion to obtain richer and more accurate environmental information.
The industry definition of autonomous vehicles is generally based on the J3016 standard of the Society of Automotive Engineers (SAE). Vehicles are divided into six levels bases on the degree of automation, from Level 0 (without automation) to Level 5 (fully automated). In 2019, SAE updated to the J3018 standard, which provides road safety guidelines for Levels 3–5 vehicles. The updated standard better reflects the current and future need for road safety testing with autonomous driving technology [2]. Self-driving cars will not replace manual driving overnight; instead, there will be a gradual shift from manual to autonomous driving. This process relies on the continuous development and improvement of Advanced Driver Assistance Systems (ADAS). In ADAS, Forward Collision Warning (FCW) reminds the driver to reduce the speed or take evasive measures when it detects that the relative position and speed of the vehicle in front reaches certain criteria. This helps reduce the number of accidents. In addition, a more advanced Autonomous Emergency Braking (FCW) system can take over the control of the vehicle when the driver does not respond appropriately in a situation. Regardless of whether the driver steps on the brake, AEB will activate to reduce the speed of the vehicle to avoid accidents or reduce the seriousness of injuries caused by accidents [3].
Furthermore, with the rise of artificial intelligence, several fields are also utilising AI technology. One such example is the introduction of AI in the IoT, transforming it into AIoT (AI + IoT), which optimises the traditional IoT and makes it more intelligent. However, with the development of AI, the IoT and big data, technical challenges such as cloud computing efficiency, AI computing power and big data analysis are also encountered. Among them, AI edge computing technology is the main focus of development in the global industry. The market is optimistic about the development of AI edge computing because it has low latency, responds fast, maintains privacy (especially with the option of offline processing), consumes little power and is safe when processing and transmitting data. In the past, server equipment was simply used to collect data and computation relied on sending data and receiving responses from the cloud or fog. However, with the introduction of AI edge computing, it is possible to perform computations on an edge computation device that has undergone machine learning and optimisation processes to achieve real-time AI computing for specific tasks without going through the network and the cloud [4]. Each car can be regarded as an edge node and equipped with an edge computing platform within the vehicle-to-everything network. Each node can independently perform calculations using predesigned software or programmes in the platform to ensure that the most appropriate decision is made in the shortest time. Computation and decision-making do not need to go through the cloud server. When communication is permitted, the calculation results or decision events are returned to the cloud database for backend personnel to review the necessity and accuracy of each decision in order to provide the basis for future system updates and revisions.

2. Literature Review

Our research referenced literature of four main categories: ROS, sensors, heterogeneous sensor fusion and object detection.

2.1. Robot Operating Systems

Robot Operating System (ROS) [5] is a flexible framework that can be used to write robot software. It assumes the role of a communication bridge between the robot’s hardware and software. Under this framework, the operating system of the robot can be integrated more easily and comprehensively. One of the advantages of the ROS framework is that the incompatibility and difficulties in the integration between sensors and other hardware can be avoided when developing algorithms based on this architecture. ROS toolkits work independently without interfering with each other, making them easy to maintain. This is similar to the Simultaneous Localization And Mapping (SLAM) [6] technology that is usually found in autonomous driving. Even YOLO, which has been very popular in object detection in recent years, uses Darknet as its working environment that can also be built in ROS [7]. Therefore, our research is based on ROS for system development.

2.2. Sensors

The first step is determining how to obtain information from the surrounding environment to detect obstacles ahead; the solution is sensors. Sensors commonly used in vehicle anti-collision systems include the infrared, ultrasonic, camera, radar and LiDAR. Kallhammer et al. used a low-resolution Far Infrared (FIR) lens to detect the possibility of pedestrians present ahead [8]. Yi et al. used ultrasound to detect obstacles in a disturbed environment [9]. In recent years, cameras have been frequently used combined with deep learning algorithms to identify obstacles or scan lane lines warn drivers when they have crossed a line. Tesla’s autopilot system uses the front lens to identify vehicles and the lane ahead, the millimeter-wave radar to track the vehicle’s distance ahead and several ultrasonic radars placed around the vehicle to sense surrounding vehicles and obstacles [10]. Google’s self-driving car is equipped with a 3D LiDAR having a 360° field of view on the roof and some small radars on the bumper. A camera is also present in front of the rear mirror to detect stop lights, stop signs, pedestrians, bicycles, etc. [11]. This work uses cameras to detect the types of obstacles and 3D LiDAR as a sensor for measuring distances.

2.3. Heterogeneous Sensor Fusion

The ideal sensing unit of an autonomous vehicle must have three characteristics simultaneously: high resolution, high precision and strong weather resistance. However, no single sensor fulfils all three characteristics; therefore, combining the strengths of different sensors using heterogeneous sensing fusion is one way to overcome the shortcomings of each sensor. Sensor fusion can be divided into three main modes. The first is the complementary fusion mode. In this mode, each sensor’s scanning area does not overlap. For example, installing millimetre-wave radars at the front and rear of the vehicle, in which each radar is responsible for different areas, thus increasing the overall sensing range of the system. The second is the competitive fusion mode; in this mode, multiple same sensors scan the same area to improve the overall recognition accuracy of the system or different sensors can scan the same object to provide the same or different physical information. For example, using a camera to identify the type of obstacle while a millimeter-wave radar and LiDAR provide the position and distance of the obstacle. This mode provides a more accurate and complete set of information regarding the object being detected. The last mode is the cooperative fusion mode, which is similar to competitive fusion, except that after a sensor detects or identifies something, instead of only relying on its own information, it needs to use the information provided by other sensors before returning a result. This mode improves the speed and accuracy of identification [12]. Our research uses the cooperative fusion mode for heterogeneous sensing fusion.
However, a mutual reference point must be found between different sensors before the information they provide can be fused. In the case of a camera and a 3D LiDAR, the field of view and the dimensions of the data are different; therefore, the two sets of data need to be aligned first. In [13], a correction method based on 3D–3D point correspondences is proposed when aligning the data for a camera and 3D LiDAR. The method finds the relationship of the translation and rotation between the LiDAR and the camera by fusing point clouds from multiple images at different locations and performing multiple iterations. Nowicki [14] further discusses the time offset between sensors; the author believes that not only the spatial relationship needs to be corrected, but the time offset will also affect the final fitting result. The time offset is generally caused by the different scanning frequency of each sensor, the speed of data processing and the delay of data transmission. To solve this problem, the author proposed a complete LiDAR-Camera spatiotemporal calibration method.

2.4. Object Detection

Object Detection can be divided into two categories: traditional algorithms and deep learning algorithms. In recent years, improvements in the performance of CPU and GPU computing coupled with the rapid development of CNN have also helped in object detection.
There are two main schools of using deep learning in object detection. First is using an object detector in a candidate region, also known as the two-stage detector. The most representative of this school is the R-CNN proposed by Girshick et al. [15], the improved Fast R-CNN [16], Faster R-CNN [17] and Mask R-CNN [18]. The two-stage detector functions by first proposing candidate regions (finding the target object), and then classifying the candidate regions. Although it has a higher accuracy rate than a one-stage detector, it is also slower. The second school is the faster one-stage detector, one of the most common ones among which is the Single Shot MultiBox Detector (SSD) proposed by Liu et al. [19], the YOLO proposed by Redmon et al. [20], YOLO9000 [21], YOLOv3 [22] and YOLOv4 [23] proposed by Bochkovskiy et al. One-stage detectors can predict the location of the object and classify the object simultaneously. Thus, it may be slightly inferior in detection accuracy but is considerably faster than two-stage detectors.
The main goal is to use 3D LiDAR and camera to achieve heterogeneous sensing fusion, and to build a forward obstacle recognition and distance measurement system on top of the edge computing platform.

3. Materials and Methods

In this research, we explain our methodology in three parts: heterogeneous sensor fusion, the YOLOv4-Tiny network and distance detection of obstacles ahead. The system architecture is shown in Figure 1. And the Mind Map is shown in Figure 2.

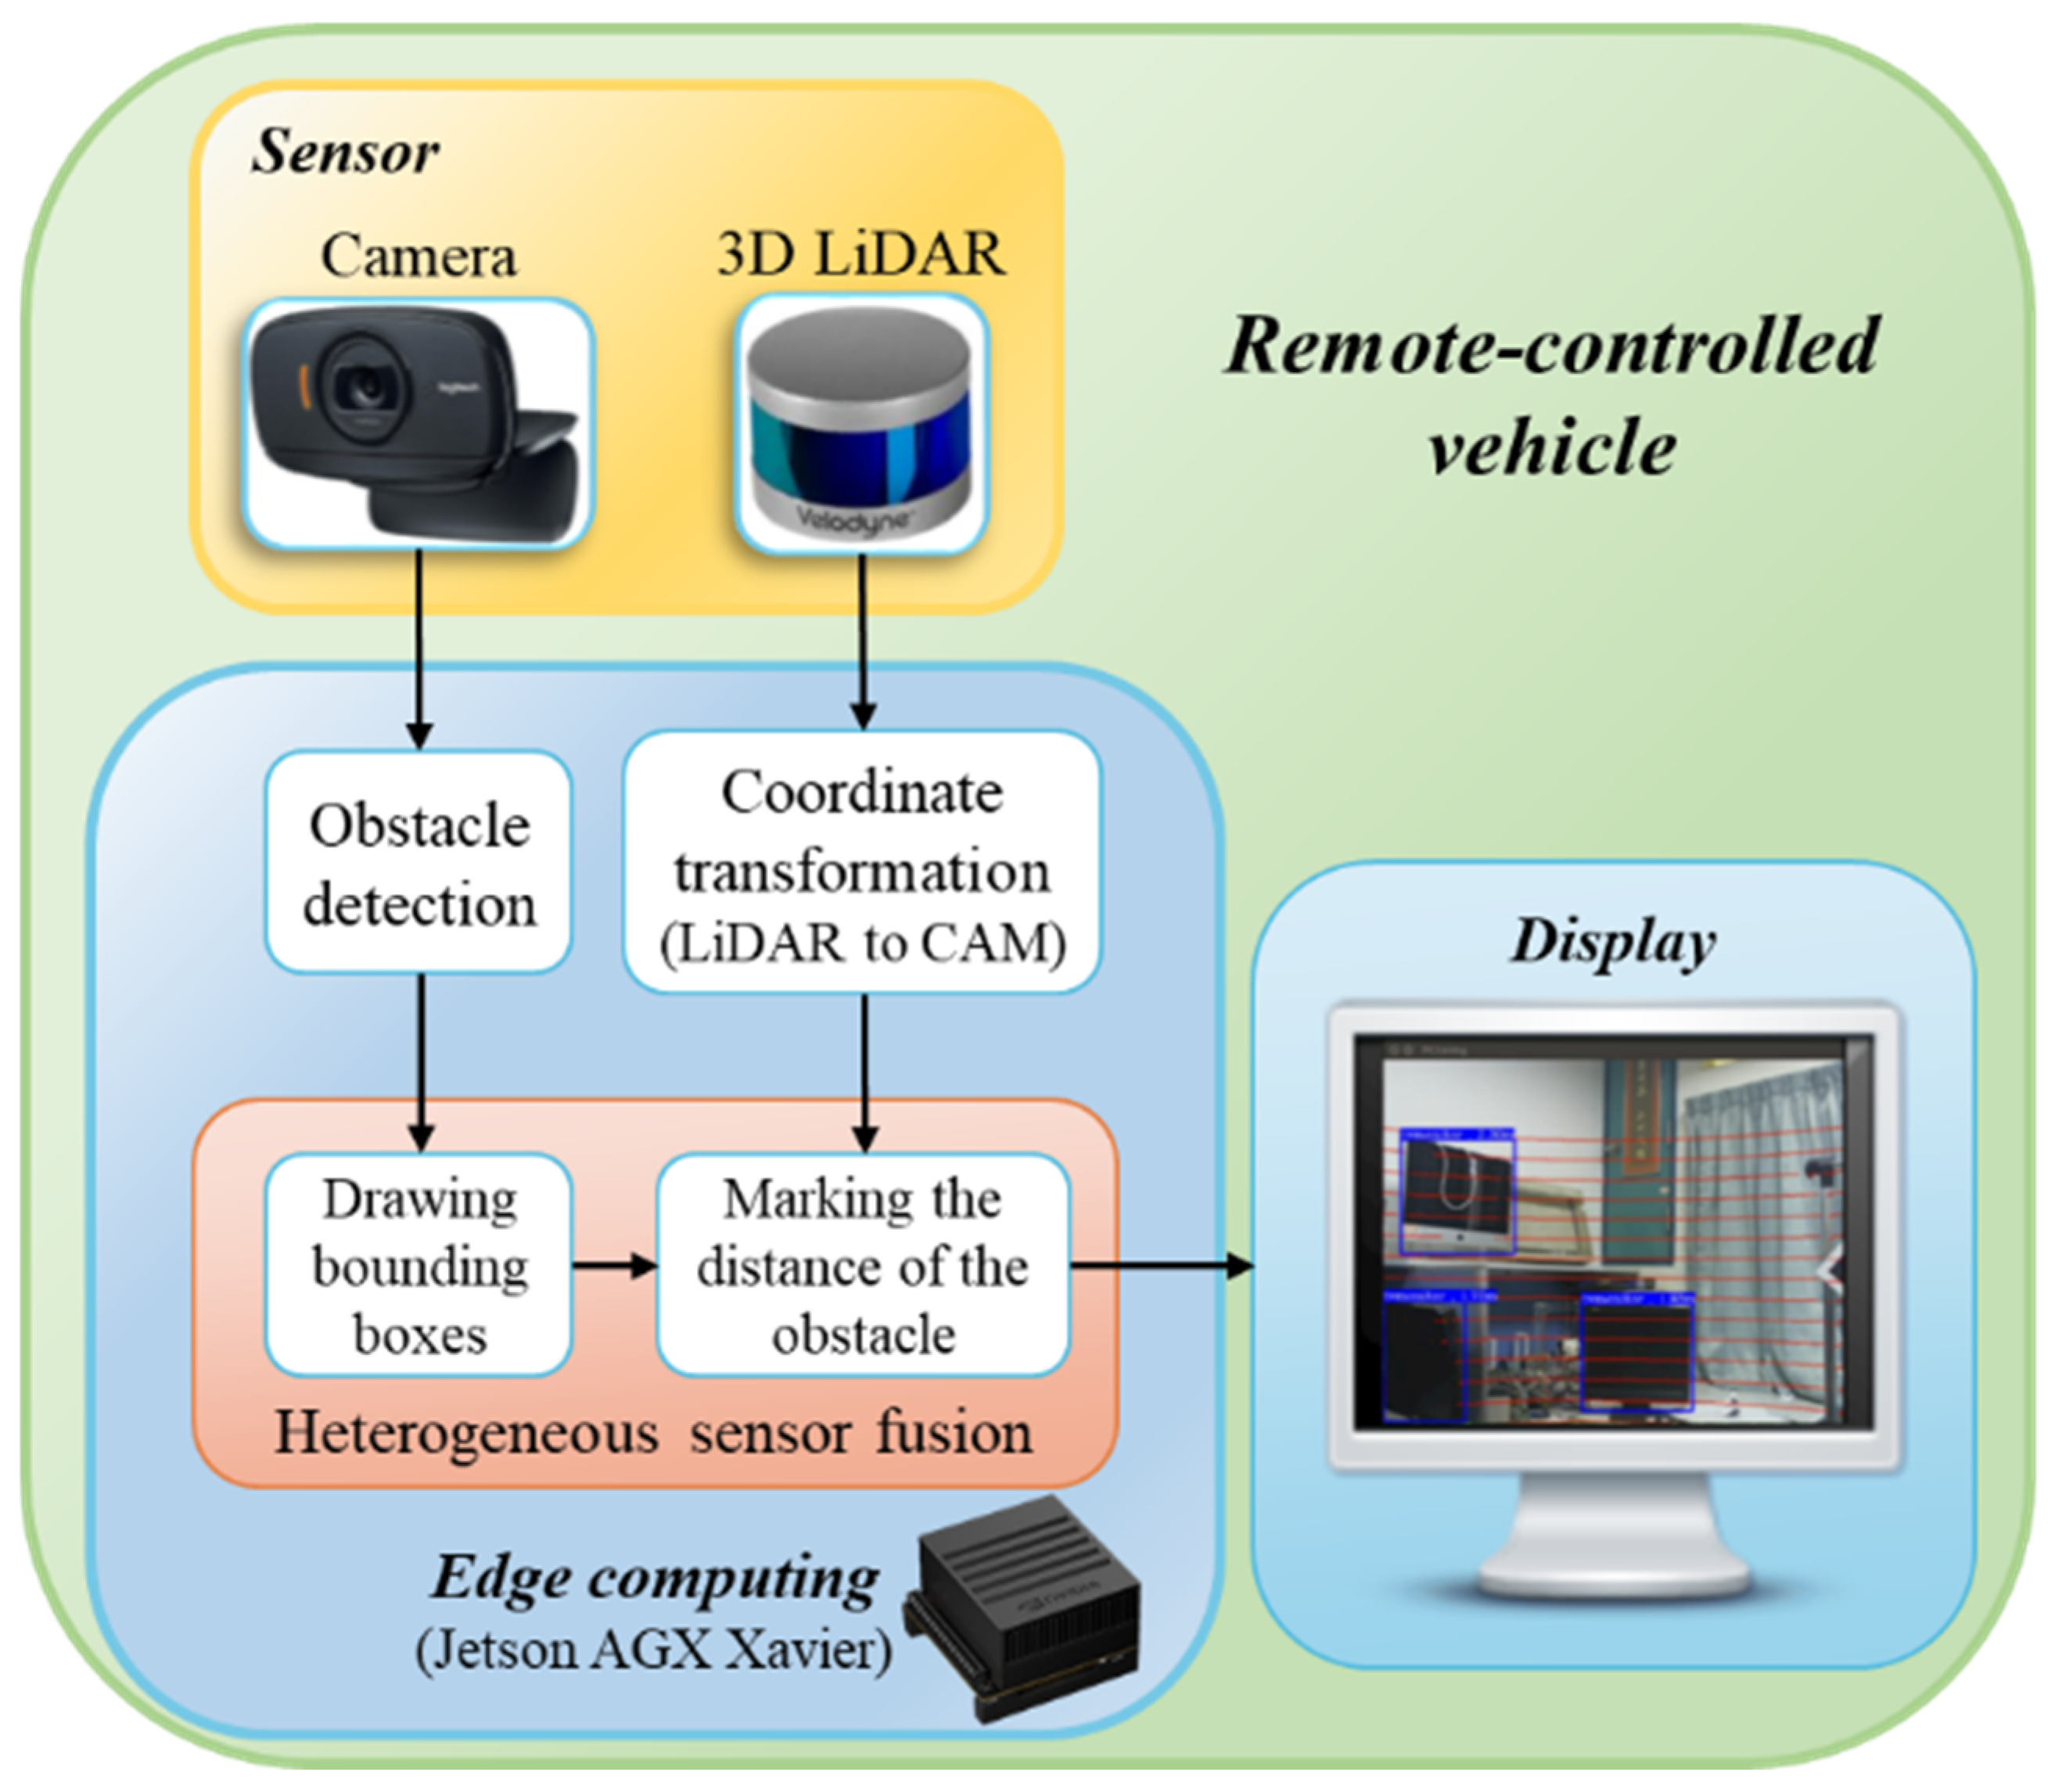
3.1. Heterogeneous Sensor Fusion

(A) Camera calibration: To project the 3D point cloud of LiDAR onto the 2D image, we must first obtain the mathematical model of the camera projection. Camera calibration is the process of finding the projection matrix that converts world coordinates to image coordinates. To find the correlation between the three-dimensional geometric position of a point on an object in real space and its corresponding point in the image, establishing a geometric model of the camera is necessary [24]. The world coordinates are converted to camera coordinates using the camera’s external parameter matrix and projected onto the 2D image using the camera’s internal parameter matrix. The projection process is shown in Figure 3.
The homogeneous coordinate representation of the mathematical model of the camera under ideal imaging circumstances is shown in Equation (1) [25],
u v 1 = K R | t X Y Z 1 = f x 0 c x 0 f y c y 0 0 1 r 11 r 12 r 13 t x r 21 r 22 r 23 t y r 31 r 32 r 33 t z X Y Z 1
where u and v are the coordinates of the image plane (unit: pixels) and K is the camera’s internal parameter matrix. [ R | t ] is the transformation matrix that converts from world coordinates to camera coordinates, which includes the rotation matrix R and the translation matrix t . ( X , Y , Z ) are the world coordinates. The internal reference matrix contains the vertical and horizontal offset of the image origin to the centre of the aperture c x , c y , as well as the focal lengths f x , f y . The conversion from world coordinates ( X , Y , Z ) to camera coordinates ( x c , y c , z c ) can be separately written in form of Equation (2),
x c y c z c = R X Y Z + t
The conversion from camera coordinates to image coordinates ( u , v ) is shown in Equations (3) and (4), where z c 0 .
u = f x × x c   /   z c + c x
v = f y × y c   /   z c + c y
An ideal pinhole camera has no lens; thus there is no distortion occurs. However, an actual camera needs a lens and an image sensor; hence, radial distortion and tangential distortion will occur, and they can be corrected using Equations (5) and (6) [25],
x c = x c z c 1 + k 1 r 2 + k 2 r 4 + k 3 r 6 + 2 p 1 x c z c y c z c + p 2 r 2 + 2 x c z c 2
y c = y c z c 1 + k 1 r 2 + k 2 r 4 + k 3 r 6 + p 1 r 2 + 2 y c z c 2 + 2 p 2 x c z c y c z c
where r 2 = x c z c 2 + y c z c 2 , k 1 ,   k 2 and k 3 are the distortion coefficients of radial distortion, and p 1 , p 2 are the distortion coefficients of tangential distortion. After correcting the distortion, the original image coordinates ( u , v ) are corrected using Equations (7) and (8).
u = f x × x c + c x
v = f y × y c + c y
(B) LiDAR-Camera Calibration: To find the transformation between LiDAR and the camera, we need to use two sets of 3D points that correspond to each other. The camera image provides one set of 3D points, and the other is the LiDAR 3D point cloud. Finding the corresponding correspond between these sets of points yields [ R | t ] . The camera can only provide 2D RGB images; thus, to generate 3D information using the camera, our research uses ArUco Markers as AR labels [26]. Figure 4 is a schematic of ArUco Markers. The green grid lines in the figure represent the internal 5 × 5 coded area, and the red grid lines represent the outer border. The grid lines serve as indicators, and the actual labels do not have grid lines.
The position of the camera can be estimated using the ArUco Markers. The markers show the 3D positional relationship between the camera and the markers, which then shows the positional relationship with the calibration plate. Then, we stick the label on a rectangular piece of cardboard that act as a calibration board. If the size of the calibration board and the position of the ArUco Markers are known, the positions of the four corners of the board can be calculated. The label can provide the conversion between the centre of the label and the camera. The corner points of the board are converted using the coordinate system of ArUco Markers to the camera’s coordinate system. These corner points will be used as 3D points in the camera. The 3D point correspondence of LiDAR can be found by detecting the edges of the calibration plate and using Random Sample Consensus (RANSAC) to fit the edges to find the corners. After obtaining the 3D points of LiDAR and the camera, the conversion between the two coordinate systems can be found by iterating the closest point. The function for finding the conversion is shown in Equation (9) [13],
R ,   t = a r g m i n R S O 3 , t 3 R P + t Q 2
where 2 is the 2-norm, P = P 1 , P 2 , , P n is the point cloud of LiDAR, Q = Q 1 , Q 2 , , Q n is the point cloud of the camera and R and t are rotation and the translation matrix that converts LiDAR coordinates to camera coordinates, respectively. S O 3 indicates rotating in a 3D space and 3 represents three dimensions.
(C) Real-time Data Fusion: Using the camera’s internal parameters, the projection matrix and the transformation matrix from LiDAR coordinates to the camera coordinates, the LiDAR 3D point cloud can be projected onto the 2D image. The projection formula is shown in Equation (10),
P t x P t y P t z = K R | t T L 2 C X L i D A R Y L i D A R Z L i D A R 1
where ( P t x , P t y , P t z ) is the coordinate after projecting the 3D point cloud onto the image, T L 2 C is the transformation matrix from LiDAR coordinates to camera coordinates and ( X L i D A R , Y L i D A R , Z L i D A R ) is the original coordinate on the 3D point cloud. Because ( P t x , P t y , P t z ) is not the actual image coordinates after the projection, according to the characteristics of homogeneous coordinates, if all the values of this coordinates are multiplied by a nonzero real number, the coordinate will represent the same point. Therefore, to find the actual coordinates after the 3D point cloud is projected onto the image in 2D, both P t x and P t y can be simply divided by P t z , yielding the projection coordinates ( u P t , v P t ), as shown in Equations (11) and (12),
u P t = P t x / P t z
v P t = P t y / P t z

3.2. YOLOv4-Tiny Network

(A) Network architecture: Our research utilises the YOLOv4-Tiny [23] network for obstacle recognition. As a detection network, its main purpose is to reduce the complexity of the network and improve the efficiency of computations to achieve real-time computing. The architecture comprises 21 convolutional layers, 11 routing layers, 3 pooling layers, one upsampling layer and two prediction layers. The YOLOv4-Tiny architecture diagram is shown in Figure 5. The CBLR block in the figure is composed of convolution, batch normalise and the Leaky Relu activation function. The CL block is composed of convolution and the linear activation function.
(B) Bounding Boxes: YOLOv4-Tiny draws a bounding box upon detecting an object. Each bounding box contains the center point of the bounding box ( b x , b y ), width ( b w ), height ( b h ) and category ( C ), as shown in Figure 6.
For ease of system integration, this research uses darknet_ros as the YOLO execution environment. Three topics will be published in darknet_ros: the number of detected objects found_object, the bounding box matrix bounding_boxes and the image with the bounding boxes drawn detection image; only the first two are actually used in this research. The bounding box matrix contains the data of multiple bounding boxes. YOLO may simultaneously detect one or more targets and integrate the data of multiple bounding boxes into the topic to enable other systems to obtain the prediction data easily. The data structure is shown in Figure 7. Data provided by bounding box is different from the original bounding box drawn by YOLOv4-Tiny, which directly provides the centre point, width and height of the box. Instead, it provides the upper left corner (xmin, ymin) and lower right corner (xmax, ymax) coordinates of the bounding box in the image.

3.3. Detecting Distance of Obstacles Ahead

A drawback of using 3D LiDAR to detect an object’s distance is that a single object may correspond to multiple points. The distance of each point may be different owing to changes in the object’s surface profile or environmental interference. To find the corresponding points of the object, this research uses the bounding box information obtained in the previous section as the basis. Points within the bounding box are selected as the corresponding points of the object, and the distance of the object can be determined by checking these points.
(1)Minimum point in box: We check for all points within the bounding box and find the one with the minimum value as the distance, as shown in Equation (13),
D = min 0 i n P D i  
where D is the distance to the object, P D is the matrix of all points within the bounding box, i indicates the index of a point and n is the total number of points within the bounding box.
In an obstacle anti-collision system, if the point with the minimum value in the bounding box is used as the object distance, the surface protrusion of the obstacle need not be considered because the possible first impact point (the closest point) of the obstacle is detected. However, this method is also more susceptible to environmental interference. YOLOv4-Tiny can detect objects as normal even when the background or the object is slightly obscured. However, these slight environmental interferences could result in LiDAR detecting an incorrect point within the bounding box. This means that the detected point is not the actual distance to the object. The area more susceptible to interference is the periphery of the bounding box. To solve this problem, this research uses the centre point and boundaries of the bounding box as the basis and shrinks the detection range of the bounding box towards the centre. This greatly reduces the background and peripheral interference and minimises the effects of distortion, thus yielding more accurate distances.
(2) Medium point in box: Environmental interferences can usually be solved by shrinking the detection range of the bounding box, but interferences in the centre of the box remain unsolved. Another problem is that smaller objects and objects further away may be undetectable once the detection range shrinks. This research uses a second method, sorting all points within the bounding box and choosing the medium point as the object distance. We use the bubble sort algorithm, as shown in Equation (14),
P D = s o r t P D  
where P D is the matrix of all points within the bounding box, s o r t ( ) is the ascending bubble sort algorithm that sorts values from small to big and P D is the ordered matrix after sorting. The medium point is chosen using Equation (15),
D = P D n + 1 2 ,                                               i f   n   i s   o d d   n u m b e r . 1 2 P D n 2 + P D n + 1 2 ,                               i f   n   i s   e v e n   n u m b e r .  
where D is the distance to the object and n is the total number of points within the bounding box.
The advantage of using the medium point within the bounding box lies is that it is unaffected by environmental interference and is able to find the real distance of most objects. However, this distance might not be the shortest distance to the object. Table 1 shows the differences between using the minimum point and medium point, each with its own advantages and best use-cases.

4. Results

4.1. Steps and Goals of the Experiment

In this research, we use the Velodyne VLP-16 and the Logitech HD Webcam C525 as sensors and the NVIDIA Jetson AGX Xavier as the edge computing platform. First, we find the rigid body transformation between the two sensors through 3D–3D point matching. Then, we project the 3D point cloud image onto the 2D image and write the programme with the ROS Package to achieve real-time processing. We also tested the hardware resource occupancy in each power mode when the completed system is executed on Jetson AGX. Finally, we performed a dynamic test on the actual road. Figure 8 shows the steps of the experiment conducted in this research and the goal of each step.

4.2. Calibration

In order to achieve the fusion of image and 3D point cloud data, it is necessary to correct the camera and 3D LiDAR to find out the conversion relationship between the two data. Before performing the joint calibration of LiDAR and the camera, we obtain the internal parameters and projection matrix of the C525 camera through the Camera_Calibration toolkit in ROS. Figure 9 shows the internal parameters and projection matrix of the C525. This maps to Equation (1) camera internal matrix and camera external matrix in preparation for joint correction.
Next, we prepare the calibration board with the ArUco Markers and suspend it. Figure 10 shows the suspension of the calibration board and size markings. In the figure, L and W represent the length and width of the calibration board, respectively, and BL and BW represent the distance between the ArUco Markers and the edge of the calibration board, respectively. Finally, M represents the side length of the ArUco Markers. Table 2 shows the detailed specifications of the three calibration plates used in this research.
We start the joint calibration after obtaining the camera internal parameters and projection matrix and preparing the calibration plate. This research focuses on using two and three calibration plates to calibrate and compare the results. Figure 11 shows the four windows during joint calibration: (a) shows the raw image of the camera; (b) is the ArUco Markers detection window; (c) is the point cloud image filtered by reflection intensity and initially aligned with the camera coordinate system; and (d) is the point cloud image where the edge is manually selected. The green frame is the manual boundary, and points within the selected boundary will turn red while the rest will remain blue. When calibrating, we start from the calibration board on the left, starting from the upper left edge and finishing selecting the four edges in clockwise order. Then, we select the next calibration board.
Using the LiDAR-Camera Calibration method proposed in A. Dhall etc. [13], a calibration plate with Augmented Reality (AR) graphics is used to make the 2D image also provide 3D information and mark the four edges of the plate on the 3D point cloud map through the manual box selection method. The iterative closest point is used to find the correspondence between the two point clouds. The transformation matrix will align the two point clouds by minimizing the Euclidean distance between the corresponding points. After the conversion relationship is obtained, in order to project the 3D point cloud onto the image, in addition to the relationship between the two, the internal parameters of the camera and its projection matrix are required.
Figure 12 is the result of using two calibration plates. Average transformation is the transformation matrix that converts LiDAR coordinates to camera coordinates. During calibration, the distance between the sensor and the calibration plate is approximately 110 cm, and the calibration plate should occupy as much space as possible in the camera’s field of view.
When using three calibration plates, for the camera’s and LiDAR’s fields of view to accommodate three calibration plates simultaneously, the distance between the sensor and calibration plate must be increased to 134 cm, and fewer VLP-16 laser rays scan each calibration plate. This reduces the number of point clouds on the edges. Figure 13 shows the calibration results of using three calibration plates. The Root Mean Square Error (RMSE) of the final conversion is approximately thrice than that when using two calibration plates, and the deviation in the actual final projection is also more obvious.

4.3. Combining the Instant Point Cloud and Image

After the LiDAR and the camera are jointly calibrated, the transformation matrix between the two can be obtained. The 3D point cloud of the LiDAR can be instantly projected onto the 2D image of the camera using the ROS Package designed in our research. Figure 14 and Figure 15 show the projection results using the transformation matrix obtained via the joint calibration. The color of the points in the figures represents the distances. The nearer a point, the redder it becomes, and the further away, the greener it becomes. In Figure 15, three calibration plates are used to obtain the transformation matrix. Compared with Figure 14, the deviation of the projection of Figure 15 is more obvious. Therefore, points cannot be accurately projected onto the correct position.

4.4. Recognition and Measuring the Distance of Obstacles Present Ahead

For recognising obstacles present ahead, the image input size is 640 × 480 pixels and the total number of YOLOv4-Tiny categories is 80. In our experiment, we use the weights provided by the official weight file. Then, we find the distance to the object using the information given by the bounding box. Figure 15 uses the minimum point in 100% of the bounding box. This method ensures that we find the shortest distance between the sensor and the object but is more susceptible to environmental interferences. In the obstacle anti-collision system, the point with the smallest distance within the bounding box is used as the target distance. This system avoids bulges and the unevenness of the obstacle to detect the first point of collision of the obstacle, and it has the most straightforward and fastest computations. However, this method affects distance detection when two objects overlap. For example, in Figure 16, the chair interfered with the human body, resulting in an inaccurate distance.
Figure 17 uses the medium point within the bounding box to measure distance. Compared with using the minimum point within the bounding box, which is easily affected by overlapping objects, the size of the bounding box can be ignored when using the median points within the bounding box to ensure that the measured distance is focused on the correct object. In other words, interferences within the bounding box can be avoided, but the result could be wrong if the object is smaller or further away or too few points are present within the bounding box.
Figure 18 shows the same use of the middle point in the bounding box to measure the distance in the indoor multi-person environment can also be a good way to find the object to identify the bounding box and distance.
Figure 19 shows the results of the actual dynamic test on the road. The effective detection distance of LiDAR is 100 m, and the detection error is less than 3 cm. Within 10 m, the average obstacle detection accuracy of YOLOv4-Tiny dynamic detection can surpass 70%. Through this experiment, it can be concluded that the system proposed in this article can be applied to the ever-changing environment on the road.
Figure 20 shows the identification of people and vehicles in road tests. Figure 21 shows the real-time recognition effect for dynamic objects and the frame rate is up to 56.3. Through this experiment, it can be concluded that the system proposed in this article can be applied to the ever-changing environment on the road.

4.5. Edge Computing Platform Performance Test

In this paper, in order to simulate the posture state of the vehicle, a remote-controlable mobile vehicle is composed of a European aluminum extrusion type as the skeleton, and all the sensors, edge computing platforms, displays and power supplies are installed here, and the parts that cannot be directly installed, this paper uses 3D printing technology to print suitable fixed parts to complete the assembly, and the assembled mobile vehicle is shown in Figure 22. Remotely controlled mobile carrier.
NVIDIA Jetson AGX Xavier provides seven power modes. The mode with the best performance is MAXN. Our research uses GPU computing with YOLOv4-Tiny, and the rest uses CPU computing with Jetson AGX. We also utilize Jetson stats tools to monitor the usage of resources. Table 3 shows the CPU and GPU usage status during the execution of the system and the operating speed of YOLOv4-Tiny in each power mode.
In modes 0, 3 and 4, the system is in a relatively stable state. In other modes, the resource occupancy fluctuates between close to full load and close to idle. During this fluctuation, the system is slower and lags. Taking mode 6 as an example: the GPU usage is much lower than that of other modes, but other systems are on the edge of collapsing and cannot perform the tasks they are supposed perform. Mode 1 is completely unable to run the system. Only mode 0 (MAXN), mode 3 (30 W ALL) and mode 4 (30 W 6core) can efficiently run the system. Mode 0 and mode 3 use all eight cores for computation, and the main difference lies in the difference in computing performance caused by different core clocks. Mode 4 uses six cores and is slightly inferior to the first two in terms of smoothness. With respect to the speed to YOLOv4-Tiny, mode 0 (MAXN) performs the best, with an average of 60 fps and a maximum of approximately 80 fps.

5. Discussion and Perspective

This research aims to use heterogeneous sensor fusion using 3D Light Detection and Ranging (LiDAR) and cameras, combined with an object recognition system and a ranging system. However, many different sensors need to be used in autonomous vehicles. It is expected that more sensors of different properties can be added in the future, so as to realize a more perfect self-driving sensing system.
This paper only identifies the obstacles in front of the vehicle, but the self-driving vehicle needs to grasp the surrounding environmental conditions at the same time, and the VLP-16 used in this system has a 360° field of view. Therefore, in the future, we can use a large field of view of the ring lens, or use the image stitching technology to integrate the field of view of multiple cameras, so that the sensing range of the system is no longer confined to the front of the vehicle, but can grasp the environmental information 360° in all directions. In addition to expanding the original field of view, sensors of other properties can also be added, such as infrared, ultrasonic and millimeter wave radar, so that the system can be more adapted to different environments.

6. Conclusions

Our research uses edge computing as a basis to design an obstacle recognition system that can also measure the distance between the sensor and the obstacle. Our research has two main parts: heterogeneous sensor fusion and obstacle recognition and ranging. We use 3D–3D point matching for heterogeneous sensor fusion to find the rigid body transformation between the 3D LiDAR and the camera. First, we use the camera to detect the calibration plate attached with ArUco Markers to obtain the 3D points in the camera coordinates. Then, we compare those points with the point cloud in the LiDAR coordinates and select the four edges of the calibration plate. The, we iteratively use the closest point to find the transformation matrix between the two sensors. Finally, we use the transformation matrix, camera internal parameters and projection matrix to project the point cloud onto the 2D image. YOLOv4-Tiny is used as the obstacle recognition network. Its lightweight architecture and high computing speed are suitable for hardware with limited performance such as edge computing platforms. For measuring distances, once the object is detected and a boundary box is drawn, we use the ‘minimum point within the bounding box’ and the ‘median point within the bounding box’ to determine the distance of the object.
Our research constructed this system on an edge computing platform, making it an offline, independent and instant computing system. We put this system on a moving vehicle and conducted a final test on the road. Experiment results show that even with an edge computing platform with limited computational capacity, the system reaches 60 fps, above 70% accuracy and a margin of error less than 3 cm using the YOLOv4-Tiny network. This proves that the system proposed in this study can be applied to the ever-changing environment on the road. However, this system is currently imperfect; more sensors of different properties can be added in future work to increase the sensing field of view and the robustness of the overall system.

Author Contributions

Conceptualization, P.-Y.C. and H.-Y.L.; methodology, N.-S.P.; software, J.-B.H.; validation, P.-Y.C., H.-Y.L., N.-S.P. and J.-B.H.; formal analysis, J.-B.H.; resources, N.-S.P.; data curation, H.-Y.L.; writing—original draft preparation, P.-Y.C.; writing—review and editing, H.-Y.L.; visualization, N.-S.P.; supervision, J.-B.H.; All authors have read and agreed to the published version of the manuscript.

Funding

This work was supported by the Ministry of Science and Technology, Taiwan, under contract number MOST 110-2221-E-167- 034-, from 1 August 2021–31 July 2022.

Institutional Review Board Statement

Not applicable.

Informed Consent Statement

Informed consent was obtained from all subjects involved in the study.

Data Availability Statement

Not applicable.

Conflicts of Interest

The authors declare no conflict of interest.

Abbreviations

ADASAdvanced Driver Assistance Systems
AEBAutonomous Emergency Braking
AIArtificial Intelligence
CNNConvolutional Neural Networks
FCWForward Collision Warning
FIRFar Infrared
HPCHigh-Performance Computing
IoTInternet of Things
LiDARLight Detection and Ranging
RANSACRandom Sample Consensus
RMSERoot Mean Square Error
ROSRobot Operating System
SAESociety of Automotive Engineers
SLAMSimultaneous Localization And Mapping
SSDSingle Shot MultiBox Detector
YOLOYou Only Look Once

References

  1. How Self-Driving Cars Work: Sensor Systems. UDACITY. 2021. Available online: https://www.udacity.com/blog/2021/03/how-self-driving-cars-work-sensor-systems.html (accessed on 2 January 2022).
  2. Safety-Relevant Guidance for On-Road Testing of SAE Level 3, 4, and 5 Prototype Automated Driving System (ADS)-Operated Vehicles. SAE International. 2019. Available online: https://www.sae.org/standards/content/j3018_201909/ (accessed on 5 January 2022).
  3. Fildes, B.; Keall, M.; Bos, N.; Lie, A.; Page, Y.; Pastor, C.; Pennisi, L.; Rizzi, M.; Thomas, P.; Tingvall, C. Effectiveness of Low Speed Automous Emergency Braking Realworld Rear-end Crashes. Accid. Anal. Prev. 2015, 81, 24–29. [Google Scholar] [CrossRef] [PubMed]
  4. Artificial Intelligence: A killer App for Edge Computing. STL Partners. 2019. Available online: https://stlpartners.com/edge_computing/artificial-intelligence-a-killer-app-for-edge-computing/ (accessed on 1 October 2021).
  5. ROS-Robot Operating System. ROS. 2013. Available online: https://www.ros.org (accessed on 15 April 2020).
  6. What Is Simultaneous Localization and Mapping. Nvidia. 2019. Available online: https://blogs.nvidia.com/blog/2019/07/25/what-is-simultaneous-localization-and-mapping-nvidia-jetson-isaac-sdk/ (accessed on 23 May 2021).
  7. YOLO ROS: Real-Time Object Detection for ROS. Github. 2018. Available online: https://github.com/leggedrobotics/darknet_ros (accessed on 14 August 2022).
  8. Kallhammer, J.-E.; Eniksson, D.; Granlund, G.; Felsberg, M.; Moe, A.; Johansson, B.; Wiklund, J.; Forssen, P.-E. Near Zone Pedestrian Detection using a Low-Resolution FIR Sensor. In Proceedings of the 2007 IEEE Intelligent Vehicles Symposium, Istanbul, Turkey, 13–15 June 2007; pp. 339–345. [Google Scholar]
  9. Yi, D.; Joo, J.; Piao, Z.; Jin, H.; Kim, S.C. Ultrasound-based Obstacle Detection System for Vehicles under Interference Environment. In Proceedings of the IEEE 2019 25th Asia-Pacific Conference on Communications (APCC), Ho Chi Minh City, Vietnam, 6–8 November 2019; pp. 95–98. [Google Scholar]
  10. Autopilot. Tesla. 2016. Available online: https://www.tesla.com/autopilot (accessed on 16 August 2021).
  11. Google’s Autonomous Car Takes To The Streets. IEEE SPECTRUM. 2010. Available online: https://spectrum.ieee.org/automaton/robotics/artificial-intelligence/googles-autonomous-car-takes-to-the-streets (accessed on 9 July 2020).
  12. The Different Types of Sensor Fusion: Complementary, Competitive, and Cooperative. Networking Embedded Systems. 2011. Available online: https://netwerkt.wordpress.com/2011/03/30/the-different-types-of-sensor-fusion-complementary-competitive-and-cooperative/ (accessed on 7 January 2022).
  13. Dhall, A.; Chelani, K.; Radhakrishnan, V.; Krishna, K.M. LiDAR-Camera Calibration using 3D-3D Point correspondences. arXiv 2017, arXiv:1705.09785. [Google Scholar]
  14. Nowicki, M.R. Spatiotemporal Calibration of Camera and 3D Laser Scanner. IEEE Robot. Autom. Lett. 2020, 5, 6451–6458. [Google Scholar] [CrossRef]
  15. Girshick, R.; Donahue, J.; Darrell, T.; Malik, J. Rich Feature Hierarchies for Accurate Object Detection and Semantic Segmentation. In Proceedings of the 2014 IEEE Conference on Computer Vision and Pattern Recognition, Columbus, OH, USA, 23–28 June 2014; pp. 580–587. [Google Scholar]
  16. Girshick, R. Fast R-CNN. In Proceedings of the 2015 IEEE International Conference on Computer Vision (ICCV), Santiago, Chile, 7–13 December 2015; pp. 1440–1448. [Google Scholar]
  17. Ren, S.; He, K.; Girshick, R.; Sun, J. Faster R-CNN: Towards Real-Time Object Detection with Region Proposal Networks. IEEE Trans. Pattern Anal. Mach. Intell. 2017, 39, 1137–1149. [Google Scholar] [CrossRef] [PubMed]
  18. He, K.; Gkioxari, G.; Dollár, P.; Girshick, R. Mask R-CNN. In Proceedings of the 2017 IEEE International Conference on Computer Vision (ICCV), Venice, Italy, 22–29 October 2017; pp. 2980–2988. [Google Scholar]
  19. Liu, W.; Anguelov, D.; Erhan, D.; Szegedy, C.; Reed, S.; Fu, C.Y.; Berg, A.C. SSD: Single Shot MultiBox Detector. In Computer Vision and Pattern Recognition; Springer: Berlin, Germany, 2016. [Google Scholar]
  20. Redmon, J.; Divvala, S.; Girshick, R.; Farhadi, A. You Only Look Once: Unified, Real-Time Object Detection. In Proceedings of the 2016 IEEE Conference on Computer Vision and Pattern Recognition (CVPR), Las Vegas, NV, USA, 27–30 June 2016; pp. 779–788. [Google Scholar]
  21. Redmon, J.; Farhadi, A. YOLO9000: Better, Faster, Stronger. In Proceedings of the IEEE Conference on Computer Vision and Pattern Recognition (CVPR), Honolulu, HI, USA, 21–26 July 2017; pp. 6517–6525. [Google Scholar]
  22. Redmon, J.; Farhadi, A. YOLOv3: An Incremental Improvement. arXiv 2018, arXiv:1804.02767. [Google Scholar]
  23. Bochkovskiy, A.; Wang, C.-Y.; Liao, H.-Y.M. YOLOv4: Optimal Speed and Accuracy of Object Detection. arXiv 2020, arXiv:2004.10934. [Google Scholar]
  24. Camera Resectioning. Wikipedia. 2020. Available online: https://en.wikipedia.org/wiki/Camera_resectioning. (accessed on 3 January 2022).
  25. Camera Calibration and 3D Reconstruction. OpenCV. 2020. Available online: https://docs.opencv.org/2.4/modules/calib3d/doc/camera_calibration_and_3d_reconstruction.html. (accessed on 1 February 2022).
  26. Romero-Ramirez, F.J.; Muñoz-Salinas, R.; Medina-Carnicer, R. Speeded up detection of squared fiducial markers. Image Vis. Comput. 2018, 76, 38–47. [Google Scholar] [CrossRef]
Figure 1. System architecture.
Processes 10 01876 g001
Figure 2. Mind Map.
Figure 2. Mind Map.
Processes 10 01876 g002
Figure 3. Projection process.
Processes 10 01876 g003
Figure 4. ArUco Markers diagram.
Processes 10 01876 g004
Figure 5. YOLOv4-Tiny architecture diagram.
Processes 10 01876 g005
Figure 6. Bounding boxes drawn using YOLOv4-Tiny.
Processes 10 01876 g006
Figure 7. Data structure for bounding boxes and bounding box.
Processes 10 01876 g007
Figure 8. Steps and goals of the experiment.
Processes 10 01876 g008
Figure 9. C525 Internal parameters and projection matrix.
Processes 10 01876 g009
Figure 10. Suspension of the calibration boards and size markings.
Processes 10 01876 g010
Figure 11. Four windows during joint calibration.
Processes 10 01876 g011
Figure 12. Results of using two calibration plates.
Processes 10 01876 g012
Figure 13. Results of using three calibration plates.
Processes 10 01876 g013
Figure 14. Projection result of using two calibration boards.
Processes 10 01876 g014
Figure 15. Projection result of using three calibration boards.
Processes 10 01876 g015
Figure 16. Measuring distance using the minimum point within the bounding box.
Processes 10 01876 g016
Figure 17. Measuring distance using the medium point within the bounding box.
Processes 10 01876 g017
Figure 18. Distance measurement for multi-person environments.
Processes 10 01876 g018
Figure 19. Road test results.
Processes 10 01876 g019
Figure 20. Road testing of people and vehicles.
Processes 10 01876 g020
Figure 21. Instant dynamic vehicle environment testing.
Processes 10 01876 g021
Figure 22. Remotely controlled mobile carrier.
Processes 10 01876 g022
Table 1. Using the minimum point and the medium points within the bounding box: a comparison.
Minimum Point in BoxMedium Point in Box
Computation ComplexityLowHigh
Acquires the minimum distance?YesPossibly
Solves Environmental Interferences?SlightlyYes
Best Use-casesAnti-collision systemsFinding an object’s real distance
Table 2. Specifications of the three calibration boards.
ArUco MarkersID 51, ID 461, ID 718
Board Size
L30
W30
BL2.3
BW2.3
M13.5
Unit: cm.
Table 3. Jetson AGX tests for each power mode.
Power ModeCPU Average UsageThe Number of CPU Working CoresGPU Average UsageYOLOv4-Tiny FPS
0 (MAXN)53.3% (2.3 GHz)8>77% (1.4 GHz)60
1 (10 W)××××
2 (15 W)100% (1.2 GHz)4>95% (675 MHz)22
3 (30 W ALL)72.5% (1.2 GHz)8>80% (905 MHz)40
4 (30 W 6core)82% (1.4 GHz)6>80% (905 MHz)35
5 (30 W 4core)95.8% (1.8 GHz)4>88% (905 MHz)32
6 (30 W 2core)100% (2.1 GHz)2>50% (905 MHz)20
7 (15 W DESKTOP)98% (2.2 GHz)4>95% (675 MHz)24
Publisher’s Note: MDPI stays neutral with regard to jurisdictional claims in published maps and institutional affiliations.

