
Comprehensive Analysis and Targeting of Distillation Integrated into Overall Process Considering Operating Pressure Change

School of Chemical Engineering and Technology, Xi’an Jiaotong University, No. 28, Xianning West Road, Xi’an 710049, China
*
Author to whom correspondence should be addressed.
Processes 2022, 10(9), 1861; https://doi.org/10.3390/pr10091861
Submission received: 30 August 2022
/
Revised: 9 September 2022
/
Accepted: 10 September 2022
/
Published: 15 September 2022
(This article belongs to the Special Issue Research on Process System Engineering)
Abstract
:Distillation is important to chemical processes but it is energy intensive, and its optimization is of great significance to energy savings and emissions reduction. Varying the operating pressures of distillation columns could assist heat integration of distillation columns into the overall process, thereby reducing energy consumption. However, influences of varying column pressures on the energy profiles of the overall process have not been systematically analyzed in previous studies. This paper presents an insightful analysis of heat integration of distillation into the overall process considering the change of operating pressure. Firstly, effects of changing the operating pressure of a distillation column on its own utility requirements and the related process streams are studied. Next, such effects are graphically represented and incorporated into the grand composite curve (GCC). The change tendencies of the GCC, pinch temperature, and total utility consumption are analyzed and presented. On this basis, rules to identify the best operating pressure that minimize the overall energy consumption are proposed. A continuous reforming unit in a petrochemical enterprise is quantitatively analyzed to verify the obtained rules. The result indicates that the hot utility of the overall process can be reduced by 758 kW when the column pressure is lowered by 260 kPa.
1. Introduction
Distillation is an indispensable and important unit operation in chemical processes, whose energy consumption accounts for more than 40% of the entire chemical industry [1]. Distillation also has a certain impact on global energy consumption [2]. At the same time, distillation is the most widely used separation technology at present [3], which can achieve 95% of the substance separation [4] and has a great impact on process sustainability. Therefore, the optimization of distillation can effectively reduce energy consumption and production costs, and it is also beneficial to mitigating global climate change.
In a general distillation column, high-grade heat is supplied via the reboiler and waste heat is removed from the condenser. The importance of optimizing distillation columns has been well recognized by scholars. The main methods include adjusting the operating conditions of the column (reflux ratio, column pressure, etc.) [5], improving the feed state [6], adding the intermediate reboiler and condenser [7], multi-effect distillation [8], heat pump-assisted distillation [9], thermally coupled distillation [10,11], distillation sequence synthesis [12], etc. These methods can all effectively reduce the energy consumption and result in a more efficient operation overall.
As an indispensable unit operation in the chemical process, heat integration of the distillation column into the overall process should also be considered comprehensively [13]. In the early 1980s, Linnhoff et al. [14] proposed a tool based on heat flow cascade in which the pinch concept is applied in order to design the distillation system flexibly. They concluded that the basic principle for placement of a distillation column is not across the pinch of the heat exchanger network. Based on the grand composite curve (GCC) of the background process, the position of the distillation column could be easily analyzed to ensure the optimal energy performance of the overall process [15]. Bandyopadhyay [16] proposed two schemes of adding side reboilers/condensers and preheating the feed to achieve heat integration of the distillation column and background process. Sun et al. [17] adopted three innovative approaches—resequencing, repiping, and adding heat exchangers for crude distillation units—which reduced the heat transfer across the pinch in the heat exchanger network. Kravanja et al. [18] investigated the heat integration of biochemical devices under process modifications regarding to the heat loads and temperature levels. Yang et al. [19] changed the pinch temperature of background process by setting the heat pump reasonably, thereby changing the relative position of distillation column to the background process, which allowed for better heat integration. Zhang et al. [20] used the GCC to investigate the effects of mixing two cold streams with different compositions to form a minimum azeotrope on the heat exchanger network and energy consumption.
The above works are based on pinch technology or graphical methods. Mathematical programming approaches are also used to study the heat integration of the distillation column and heat exchanger network. Aggarwal et al. [21] proposed a general superstructure that allowed heat integration between condensers and reboilers of different distillation columns which resulted in an optimal heat integrated distillation sequence. Wang et al. [22] studied the synthesis and optimization of separation sequences and their heat exchanger network through an improved genetic algorithm. Lashkajani et al. [23] proposed an algorithm to model the separation system and design the heat exchanger network for an olefin separation process. The energy savings of an aromatics plant with distillation columns, reactors, and a heat exchanger network was realized by establishing the process model via artificial neural networks and the heat exchanger network model, including streams with phase changes [24]. The mathematical programming approach is a typical black-box technique. Although many formulas or software can be used for multi-objective and multi-parameter optimization to obtain the optimal results, it is difficult to understand the specific operation process and principles of unit operations in chemical processes [25]. Therefore, industrial application of mathematical programming approaches is limited.
In the industry, ambient mediums (e.g., water and air) are the most preferred cold utilities, whose temperatures change seasonably. Adjusting the operating pressures of distillation columns is widely used to guarantee sufficient temperature difference in condensers while saving energy, which is simple and has little impact on the equipment layout. Linnhoff et al. [14] moved the distillation column lying across the pinch to above or below the pinch by changing the operating pressure. Van et al. [26] solved the problem of the total inefficiency in a two-column cryogenic air separation unit by adjusting the column pressure. Fei et al. [27] optimized a double-column process with the minimum total annual cost as the objective function to determine the optimal operating pressure. In these studies, influences of varying the operating pressures on distillation columns are considered only. However, in a practical chemical process, the outlet streams of distillation columns are often worked as process streams to participate in the heat exchanger network. At this time, changing the column pressure also impacts the related process streams. Pyrgakis et al. [28] used a mixed integer linear programming formulation to integrate a multiple-effect distillation system into the overall process, which could detect the interaction of the number, pressures, and feed split fractions of multiple-effect distillation with the background process to ensure maximum energy saving. Zhang et al. [29] analyzed the effects of increasing the column pressure on the heat exchanger network using the cold and hot composite curves, but the resulting changes in the heat loads and temperatures of the distillation column were not considered. Although adjusting the column pressure has been mentioned in the above publications, its influences on the distillation column and the heat exchanger network are investigated separately. To the best of our knowledge, none of existing publications analyze the changes in the energy profile of the overall process as a result of adjusting the column pressure and provide insights on such changes.
This work intuitively reveals the insights of varying the column pressure in the heat integration of the distillation column into overall process. The situation where the distillation column lies across the pinch is considered. Firstly, changes of temperatures and heat loads of the reboiler, the condenser, and the related process streams caused by varying the column pressure are studied in the T-H diagram. Next, we account for these changes to investigate the influences on the GCC and pinch temperature, so that the best operating pressure can be identified to minimize utility consumption. Finally, an industrial process is studied to verify the obtained rules. This paper only analyzes the situation of lowering the column pressure, and for the opposite situation, the analysis method is similar.
Novel contributions of this work can be summarized as below:
- A comprehensive analysis for heat integration of distillation into the overall process.
- The rules to identify the best operating pressure of a distillation column.
The rest of this paper is organized as follows. Section 2 analyzes the impacts of lowering distillation column pressure on the overall process in the GCC diagram and presents the identification of the best operating pressure. Qualitative analysis is then verified by an industrial process studied in Section 3. The last section concludes the work of this paper and suggests future research directions.
2. Impacts of Lowering Distillation Column Pressure
2.1. Streams Related to a Distillation Column
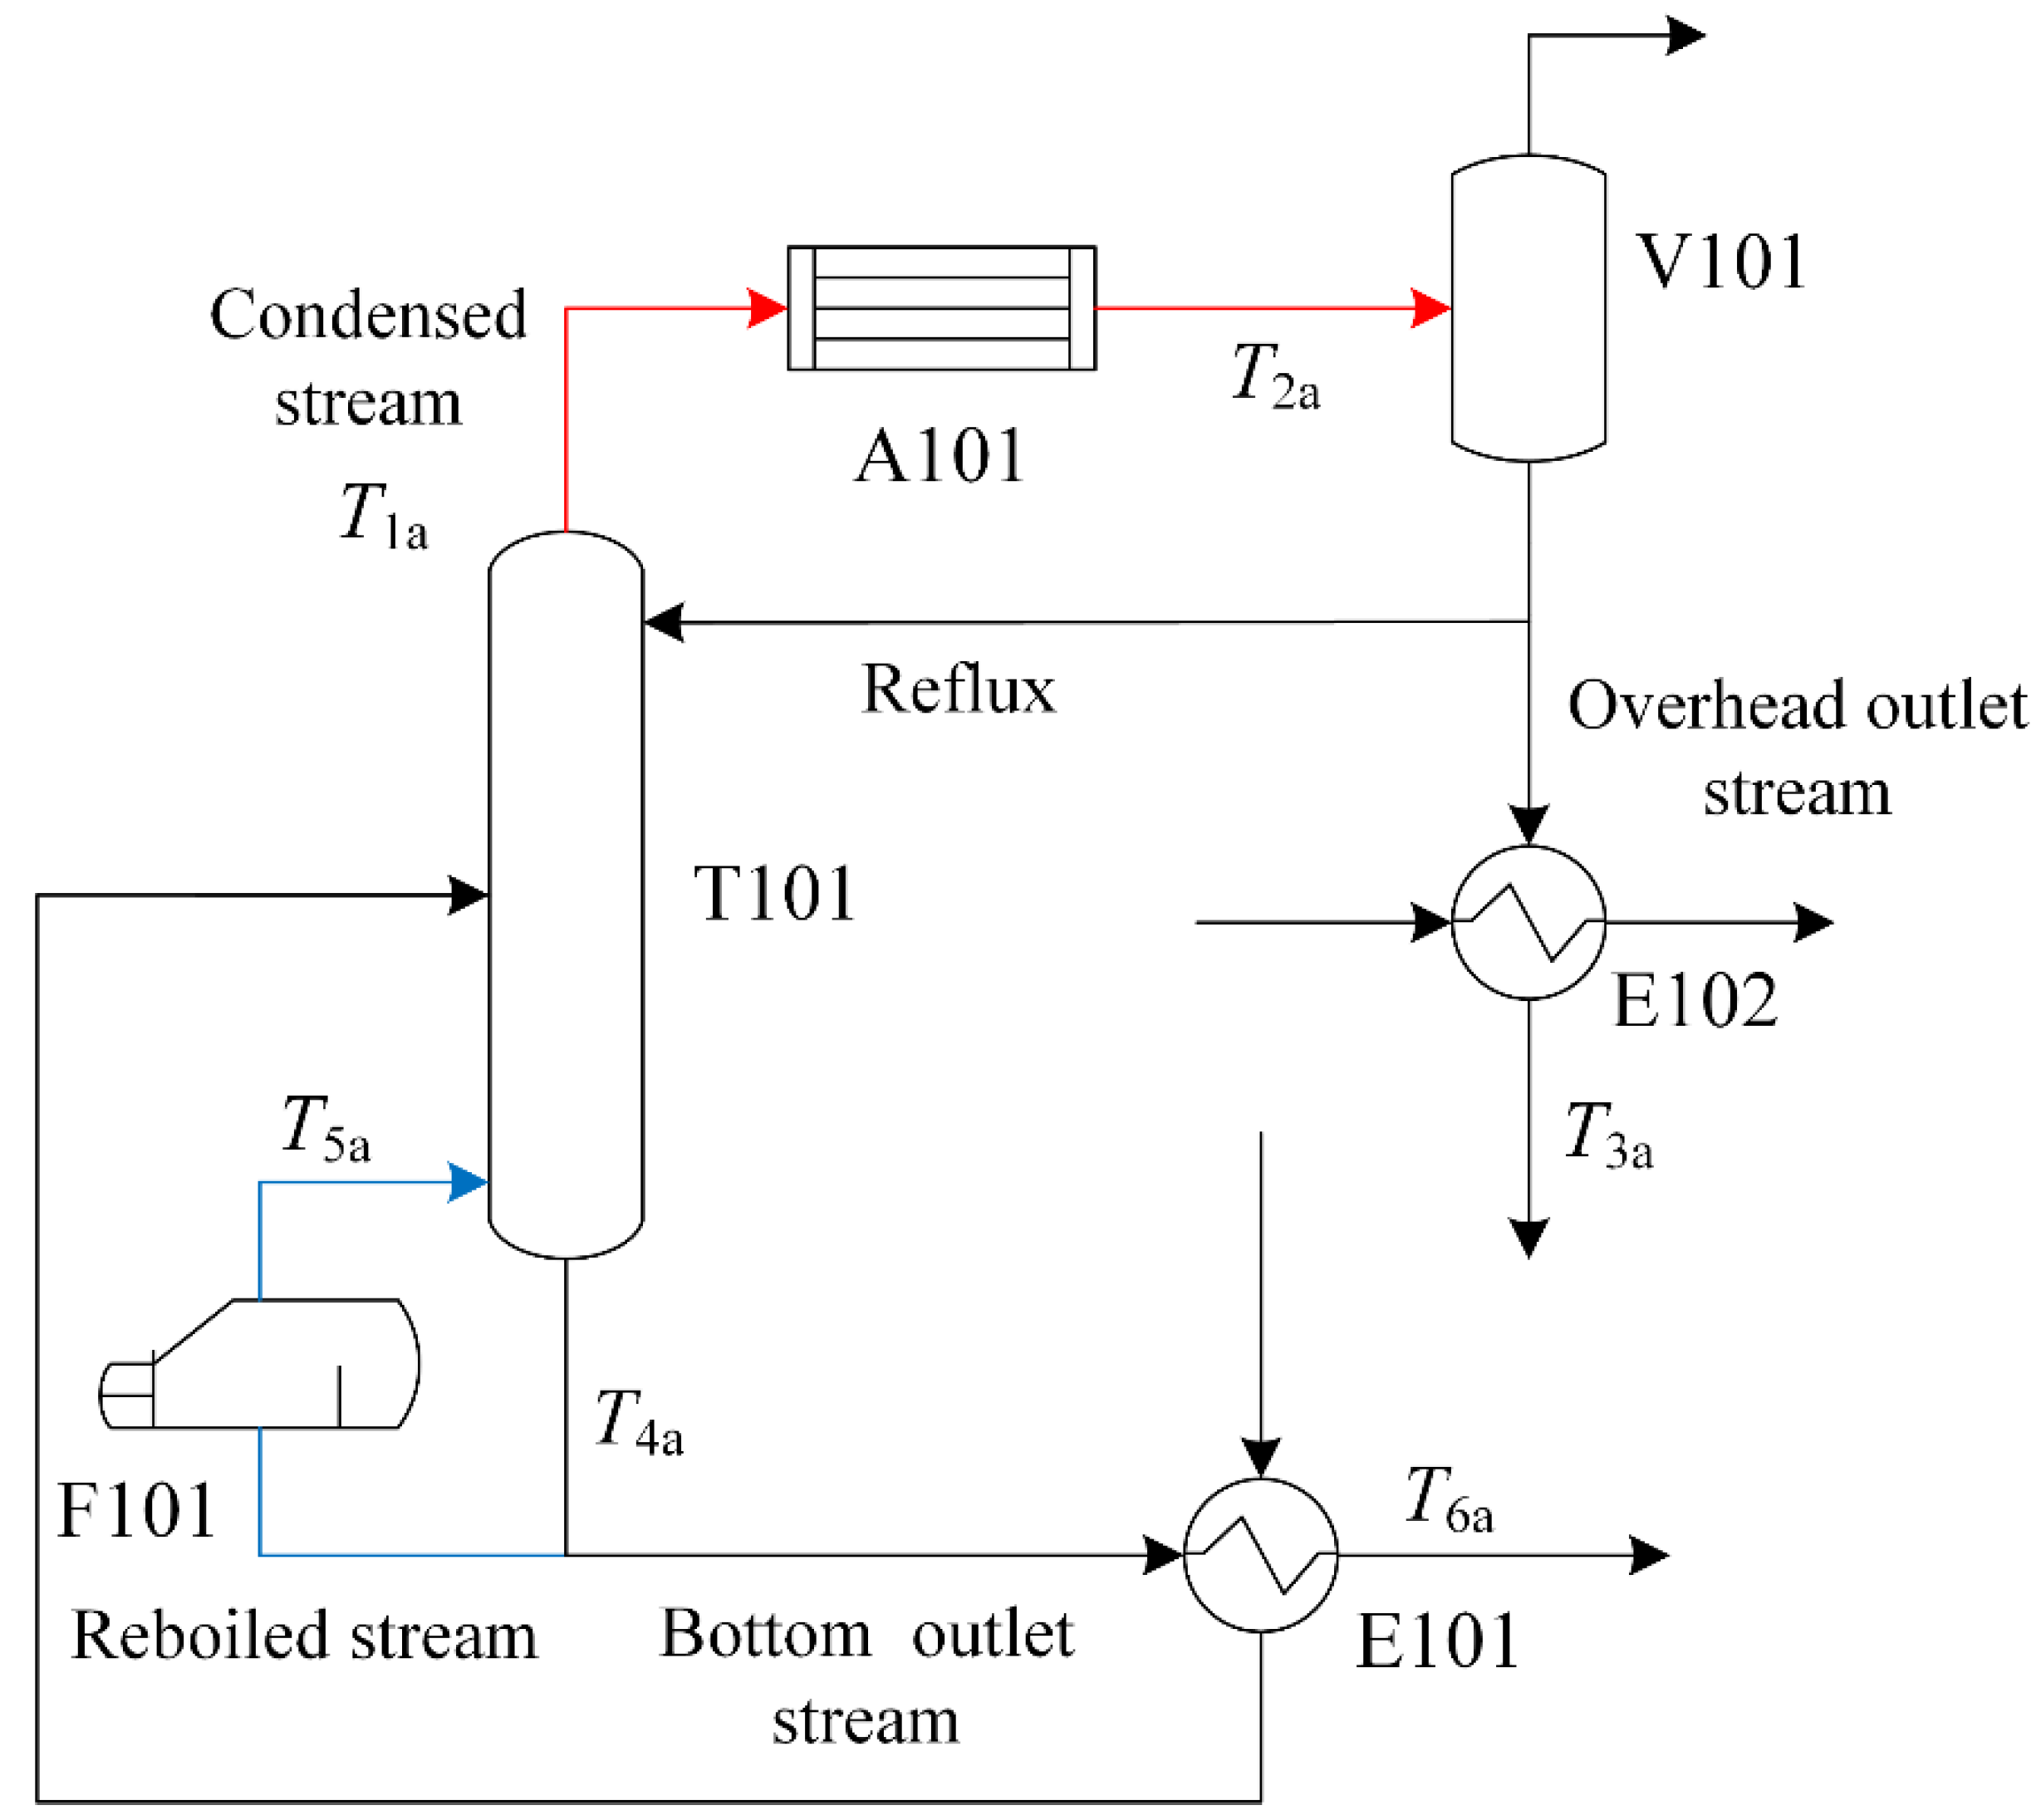
Figure 1 shows the part of a distillation column in a continuous reforming unit of a petrochemical enterprise. The top vapor stream of the distillation column enters the condenser and is condensed. Then, a part of the condensate is output as the distillate and participates in the process heat exchange, and the rest is refluxed to the distillation column. Similarly, a part of the liquid stream at the bottom is vaporized in the reboiler and returns to the distillation column. The rest is discharged as the residue and participates in the process heat exchange as well. As shown in Figure 1, the condensed stream is a heat source, with an initial temperature of T1a, and a final temperature of T2a. Assuming that there is no temperature and pressure changes in the reflux tank, the initial temperature of the overhead outlet stream is equal to T2a, and the final temperature is T3a. Note that this stream can be either a heat source or a heat sink, depending on its final temperature. At the bottom of the distillation column, the reboiled stream is a heat sink, whose initial temperature is T4a and final temperature is T5a. The initial temperature of the bottom outlet stream is also T4a, and the final temperature is T6a. Furthermore, its character in the heat exchanger network depends on the final temperature T6a. When the operating pressure of the distillation column is lowered, the temperatures of T1a, T2a, T4a, and T5a decrease. Considering the overall process, the shape of the GCC is changed and the pinch location may be moved, which will be detailed below.
2.2. Changes of GCC and Pinch Temperature
As mentioned above, the overhead and bottom outlet streams may act as heat sources or heat sinks in the heat exchanger network. For a distillation column across the pinch of the overall process, the reboiler is located above the pinch and the condenser is located below the pinch. There are four cases regarding to the two streams in the heat exchanger network, which are a heat source below the pinch and a heat sink above the pinch, two heat sources, two heat sinks, as well as a heat sink below the pinch and a heat source above the pinch. For the heat exchanger network, it is assumed that the minimum temperature difference for heat transfer is ΔTmin, the pinch location is labeled as point P, and the minimum hot and cold utilities are QH,min and QC,min, respectively. The GCC’s temperature is the shifted temperature, plus 0.5 ∆Tmin for cold streams and minus 0.5 ∆Tmin for hot streams. Excepting special statements, all temperatures mentioned in this paper are shifted temperatures.
The GCCs of heat exchanger networks can be divided into two cases: with or without ‘heat pockets’. On the GCC, a ‘heat pocket’ means that there is a local heat source above the pinch or a local heat sink below the pinch. Since the heat source and the heat sink in a ‘heat pocket’ can be matched with each other, the ‘heat pocket’ can be eliminated. Therefore, in order to simplify the problem, ‘heat pockets’ are not considered in this paper.
2.2.1. Case 1: A Heat Source below the Pinch and a Heat Sink above the Pinch
The heat loads of the condenser and reboiler are mainly derived from the latent heat during phase transition, so the temperature changes of the condensed stream and the reboiled stream are small. In the T-H diagram, the segments representing the condensed stream and the reboiled stream are relatively flat, as shown by segments ef and ab in Figure 2a. Consistent with the GCC, the slope of a heat source is negative and that of a heat sink is positive.
Firstly, a qualitative analysis of the GCC above the pinch is performed. In Figure 2a, the reboiled stream is represented by segment ab, whose initial temperature is T4 and final temperature is T5. The bottom outlet stream is represented by segment cd, whose initial temperature is T4 and final temperature is T6. When the operating pressure of the distillation column is lowered, the reboiled stream changes from ab to a’b’, whose initial temperature is reduced to T4* and final temperature is reduced to T5*. The bottom outlet stream changes from cd to c’d’, whose initial temperature is also reduced to T4*, while the final temperature remains unchanged. It can be seen that two new segments—aa’ and cc’—appear in interval [T4*, T4]. The total increased heat load of heat sinks in this temperature interval equals the sum of aa’ and cc’, which is represented by segment a1c1, as shown in Figure 2a. After adding the heat sink a1c1 to the original GCC, the hot utility in this temperature interval increases by Q1, and the changed GCC is shown by the dotted line in interval [T4*, T4] in Figure 2b. Since the changed GCC in this temperature interval moves away from the vertical axis, the pinch temperature cannot be changed by reductions in the initial temperature of the reboiled stream and the bottom outlet stream. Moreover, segment bb’ does not exist in interval [T5*, T5]. The heat sink bb’ should be deducted from the original GCC. The hot utility in this temperature interval decreases by Q2. The changed GCC is shown by the dotted line in this temperature interval in Figure 2b, which moves close to the vertical axis. It means that the decrease in the final temperature of the reboiled stream may change the pinch temperature.
When Q2 is less than Q1, the pinch temperature remains unchanged, and the hot utility increases. When Q2 is equal to Q1, both the pinch temperature and the hot utility remain unchanged. When Q2 is greater than Q1, the heat flux at point H1 that corresponds to T5* on the changed GCC needs further analysis, where three situations exist: (1) when (Q2 − Q1) is less than QB, the heat flux at H1 is still greater than zero, and the pinch temperature remains unchanged; (2) when (Q2 − Q1) equals QB, the heat flux at H1 is equal to zero, which means that a new pinch point is formed and the GCC shows two pinch points; (3) when (Q2 − Q1) is greater than QB, the heat flux at H1 is negative, indicating that the heat exchanger network is not feasible. In order to make the heat exchanger network feasible, the input of hot utility needs to be increased. In other words, the heat flux at H1 becomes zero by shifting the changed GCC horizontally to the right by ∆QS1 (∆QS1 = Q2 − Q1 − QB). This means that the heat flux at the original pinch is no longer zero but ∆QS1. Point H1 becomes a new pinch point, and the pinch temperature increases. All three situations result in a reduction in the hot utility. According to the above analysis, the new hot utility can be expressed by Equation (1).
Secondly, a qualitative analysis is performed for the GCC below the pinch. In Figure 2a, segment ef represents the condensed stream, whose initial temperature is T1 and final temperature is T2. Segment gh represents the overhead outlet stream, whose initial temperature is T2 and final temperature is T3. After the column pressure is lowered, the condensed stream changes from ef to e’f’, whose initial temperature decreases to T1* and final temperature decreases to T2*. The overhead outlet stream changes from gh to g’h’, whose initial temperature decreases to T2*, while the final temperature remains unchanged. As shown in Figure 2a, segment ee’ does not exist in interval [T1*, T1]. After the segment ee’ is deducted from the original GCC, the cold utility in this temperature interval decreases by Q3, and the changed GCC moves close to the vertical axis. This means that the reduction in the initial temperature of the condensed stream may change the pinch temperature. In interval [T2*, T2], the segment ff’ is included while segment gg’ should be excluded. The difference between the heat loads of these two heat sources is the net heat load change in this temperature interval, which is represented by segment f1g1 in Figure 2a. After the heat source f1g1 is added to the original GCC, the cold utility in interval [T2*, T2] increases by Q4, and the changed GCC moves away from the vertical axis. Therefore, decreases of both the final temperature of the condensed stream and the initial temperature of the overhead outlet stream cannot change the pinch temperature.
When Q3 is less than QG that corresponds to the heat flux at T1* on the original GCC, the pinch temperature remains unchanged, and the new cold utility depends on the value of Q3 and Q4. If Q3 is less than Q4, is greater than QC,min. If Q3 is equal to Q4, the cold utility is unchanged. If Q3 is greater than Q4, is less than QC,min. When Q3 is equal to QG, two pinch points occur, and the change of the new cold utility is the same to the above, depending on Q3 and Q4. When Q3 is greater than QG, the heat flux at D1 is negative, indicating that this heat exchanger network is infeasible. Similarly, the input of the cold utility should be increased. The heat flux at D1 should be zero by shifting the changed GCC horizontally to the right by ∆QS2 (∆QS2 = Q3 − QG) and the heat flux at the original pinch point is ∆QS2. Meanwhile, point D1 becomes a new pinch point, which means that the pinch temperature is decreased. The change of the cold utility depends on the value of QG and Q4, and the specific result is the same to the above. A summary of the changes of both pinch point and utility for different situations is shown in Table 1. It can be concluded that could be given by Equation (2) after lowering the operating pressure of distillation column.
The above analysis is only a qualitative analysis of GCC changes above or below the pinch. The following two points should be noticed when considering the overall GCC changes:
- (1)
- If the heat flux of a point above the pinch is negative that increases the pinch temperature, the cold utility is also increased after moving the GCC to the right. If the heat flux of a point below the pinch is negative that decreases the pinch temperature, the hot utility is also increased after moving the GCC to the right. The utility increment is equal to the offset value of the GCC.
- (2)
- If there exist two points with negative heat fluxes above and below the pinch point, the heat fluxes of these two points should be compared. The point with the smaller heat flux becomes the new pinch point. The offset value of the GCC is equal to the absolute value of the heat flux at this point.
2.2.2. Case 2: Two Heat Sources
When the overhead and bottom outlet streams are both heat sources, the representations of the condensed stream ef and the overhead outlet stream gh below the pinch in the T-H diagram are the same to those in Figure 2. The difference exists regarding the reboiled stream ab and the bottom outlet stream cd above the pinch, which represent a heat sink and a heat source, respectively. Although their actual initial temperatures are the same, the shifted temperatures differ by ∆Tmin, as shown in Figure 3. At this time, the initial temperature of the bottom outlet stream cd is T7, and the final temperature is T6. After lowering the operating pressure, the GCC changes from ABCIPDEF to A1B1C1I1PD1E1F1. The changes of the GCC below the pinch is the same to those in Table 1, which is not repeated here. The main content of this section is a qualitative analysis of the GCC changes above the pinch.
After lowering the operating pressure, the variation of the GCC above the pinch point consists of three parts, as shown in Figure 3. In interval [T7*, T7], segment cc’ does not exist. That is, the heat source cc’ in this temperature interval should be deducted from the original GCC. Segment aa’ exists in interval [T4*, T4], meaning that the heat sink aa’ should be added in the original GCC. In interval [T5*, T5], segment bb’ does not exist and should be deducted from the original GCC. As shown in Figure 3, the changed GCC in interval [T5*, T5] moves close to the vertical axis, which may change the pinch temperature. Both the pinch temperature and hot utility are jointly affected by the changes of the above points, and the detailed analysis is given as follows.
When Q2 is less than (Q1 + Q5), the pinch temperature remains unchanged, while the hot utility increases. When Q2 is equal to (Q1 + Q5), both the pinch temperature and the hot utility remain unchanged. When Q2 is greater than (Q1 + Q5), the heat flux at H1 should be further analyzed, which includes three situations. If Q2 − (Q1 + Q5) is less than QB, the pinch temperature remains unchanged. If Q2 − (Q1 + Q5) is equal to QB, two pinch points appear. If Q2 − (Q1 + Q5) is greater than QB, the heat flux at H1 is negative, indicating that the heat exchanger network is infeasible. Thus, the input of hot utility needs to be increased. The heat flux at H1 should be zero by shifting the changed GCC horizontally rightward by ∆QS3 (∆QS3 = Q2 − (Q1 + Q5) − QB), which means that the heat flux at the original pinch point is not zero but ∆QS3. Then, point H1 becomes a new pinch point, and the pinch temperature increases. The above three situations result in a reduction in the hot utility. A summary of the variation of both pinch point and hot utility for each situation is shown in Table 2. It can be deduced that can be represented by Equation (3) after the column pressure is lowered.
2.2.3. Case 3: Two Heat Sinks
When the overhead and bottom outlet streams are both heat sinks, representations of the reboiled stream ab and the bottom outlet stream cd above the pinch in the T-H diagram are the same as those in Figure 2. Below the pinch, the actual final temperature of the condensed stream ef is the same to the actual initial temperature of the overhead outlet stream gh, while the two streams in this section represent one heat source and one heat sink, respectively. Therefore, when temperatures are shifted, the final temperature of segment ef differs from the initial temperature of segment gh by ∆Tmin, as shown in Figure 4. At this time, the initial temperature of the overhead outlet stream is T8, and the final temperature is T3. As a result, the GCC changes from ABCPJDEF to A1B1C1PJ1D1E1F1 after the column pressure is lowered. The changes of the GCC above the pinch are the same as those in Section 2.2.1, and the conclusion remains unchanged, as shown in Table 1. The variation of the GCC below the pinch is analyzed qualitatively in this section.
The variation of the GCC below the pinch consists of three parts, as shown in Figure 4. Segments gg’ and ff’ occur in interval [T8*, T8] and [T2*, T2], respectively, and thus they should be added to the original GCC. In interval [T1*, T1], segment ee’ does not exist and should be deducted from the original GCC. It can be seen from Figure 4 that the changed GCC in both intervals [T8*, T8] and [T1*, T1] moves close to the vertical axis, which may change the pinch temperature. For convenience, the pinch point that may appear in interval [T8*, T8] is called the first pinch point, and the possible pinch point in interval [T1*, T1] is called the second pinch point in this section. When judging whether the pinch temperature is changed, it is necessary to judge whether the first pinch point or the second pinch point occurs successively. The detailed analysis is as follows.
When Q6 is less than QK that corresponds to the heat flux at T8* on the original GCC, the first pinch point does not appear. On this basis, the presence of the second pinch point needs to be analyzed. If (Q3 + Q6) is less than QL corresponding to the heat flux at T1* on the original GCC, the pinch temperature does not change. If (Q3 + Q6) is equal to QL, the second pinch point occurs, that is, two pinch points. If (Q3 + Q6) is greater than QL, the heat flux at D1 is negative. The changed GCC should be shifted rightward by ∆QS5 so that the heat flux at D1 becomes zero (∆QS5 = Q3 + Q6 − QL). At this time, point D1 becomes the new pinch point, and the pinch temperature is decreased.
When Q6 is equal to QK, the heat flux at J1 is zero. However, whether it eventually becomes a pinch point should be analyzed in combination with the change of point D1. If (Q3 + Q6) is less than QL, the heat flux at D1 is greater than zero. At this time, two pinch points (the original pinch point and the first pinch point) appear on the GCC. If (Q3 + Q6) is equal to QL, there are three pinch points on the GCC. If (Q3 + Q6) is greater than QL, point D1 becomes a new pinch point (the second pinch point), and the pinch temperature is decreased.
When Q6 is greater than QK and (Q3 + Q6) is less than or equal to QL, the heat flux at J1 is negative. The heat flux at J1 becomes zero by shifting the changed GCC rightward by ∆QS4 (∆QS4 = Q6 − QK). At this point, point J1 is the new pinch point (the first pinch point), and the pinch temperature is reduced. When Q6 is greater than QK and (Q3 + Q6) is greater than QL, the pinch position needs to be determined by analyzing the heat fluxes of points J1 and D1. If ∆QS4 is greater than ∆QS5, the heat flux at J1 is less than the heat flux at D1. The changed GCC should be shifted rightward by ∆QS4 until the heat flux at J1 is zero. At this time, point J1 is the new pinch point (the first pinch point), and the pinch temperature is reduced. If ∆QS4 is equal to ∆QS5, two pinch points (the first pinch point and the second pinch point) occur on the GCC. If ∆QS4 is less than ∆QS5, the changed GCC should be shifted to the right by ∆QS5. At this time, point D1 is the new pinch point (the second pinch point), and the pinch temperature is decreased.
The variation of both pinch point and cold utility for each situation is summed up in Table 3. If the pinch temperature remains unchanged, it can be deduced that can be calculated according to Equation (4). The variation of cold utility depends on the values of (Q6 + Q3) and Q4.
If the pinch temperature changes, can be represented by Equation (5). At this time, ∆QS4 and ∆QS5 also affect the variation of cold utility.
2.2.4. Case 4: A Heat Sink below the Pinch and a Heat Source above the Pinch
As shown in Figure 5, when the overhead outlet stream is a heat sink below the pinch and the bottom outlet stream is a heat source above the pinch, representations of the reboiled stream ab and the bottom outlet stream cd above the pinch in the T-H diagram are the same as those in Figure 3. The representations of both the condensed stream ef and the overhead outlet stream gh below the pinch in the T-H diagram are the same to those in Figure 4. In Figure 5, the initial temperatures of segment ab and segment cd differ by ∆Tmin, and the final temperature of segment ef and the initial temperature of segment gh differ by ∆Tmin. After lowering the operating pressure, the GCC changes from ABCIPJDEF to A1B1C1I1PJ1D1E1F1. The variation of the GCC above the pinch is the same as that in Section 2.2.2, while the variation of the GCC below the pinch is the same to that in Section 2.2.3. Therefore, the summaries that can be drawn from the GCC variation caused by column pressure reduction are the same as those in Table 2 and Table 3, and thus not repeated in this section.
2.3. Identify the Best Operating Pressure
Based on the analyses for Cases 1 and 2, we can find that the bottom outlet stream always increases the hot utility consumption after lowering the operating pressure, no matter whether it is a heat source or a heat sink above the pinch point. Besides, from Equations (1) and (3), it can be deduced that the maximum saving of heat is constrained by QB, i.e., the heat flux on the GCC corresponding to the final temperature (T5) of the reboiled stream. Therefore, in order to minimize the hot utility, the operating pressure should be lowered to make the heat flux at T5 become zero. In other words, a new pinch point occurs at T5. At this time, all streams related to the distillation column lie below the new pinch point, so lowering the operating pressure does not affect the hot utility.
Below the pinch, the overhead outlet stream also shows the same effect on the cold utility, no matter whether it is a heat source or a heat sink. The overhead outlet stream always decreases the cold utility after lowering the operating pressure, which benefits the energy saving and is different from the bottom outlet stream. From Equations (2) and (5), it can be found that there is no constant point on the GCC to constrain the maximum saving of cold utility. Point G in Figure 2 and points K and L in Figure 4 are determined by the lowered operating pressures, which means that the new pinch points change along with lowering the operating pressure. When a new pinch point occurs, lowering the operating pressure continuously may further reduce the cold utility consumption. Nevertheless, because of the offset values (i.e., ∆QS2, ∆QS4, and ∆QS5), the hot utility consumption increases. There exists a trade-off between the cold utility and hot utility when lowering the operating pressure.
In addition to the GCC, the distillation operation itself should be considered. It is generally recognized that lowering the operating pressure makes separation easier. In terms of the reboiler, lowering the operating pressure means a lower reboiling temperature, which provides a larger temperature difference or requires hot utility with a lower grade. However, as for the condenser, a lower condensing temperature means a smaller temperature difference or requires cold utility with a higher grade. In the industry, the ambient cold utility (cooling water, air, etc.) is often preferred. The lowest operating pressure is limited by the cold utility used with the minimum temperature difference for heat transfer.
3. Case Study
In this section, a continuous reforming unit of a petrochemical enterprise in China is quantitatively analyzed to verify the obtained results in Section 2.
3.1. Process Description and Pinch Analysis
Figure 6 shows the partial flowsheet of the continuous reforming process. The naphtha feed passes through the shell sides of heat exchangers E102 and E105 to be heated by the two bottom outlet streams of columns T101 and T102, and enters distillation column T101. The light components with trace water and hydrogen sulfide pass through heat exchanger E104 and air cooler A102 at the overhead, then enter the reflux tank (V106). Most of the gasoline at the bottom enters the reboiler (F102), 50% of which becomes vapor and returns to the bottom. The rest is output as the feed for the naphtha fractionation column (T102) after heat exchange in the tube side of E105. Herein, the impacts of lowering the operating pressure of distillation column T101 on the pinch temperature and utility consumption of the entire unit are studied. It is assumed that lowering the operating pressure only affects the temperatures and heat loads of the condenser, reboiler, and process streams related to column T101, while other streams remain constant. The minimum temperature difference for heat exchange (ΔTmin) is taken as 10 °C.
In Figure 6, there are eight hot streams and six cold streams, whose data are shown in Table 4. With ΔTmin = 10 °C, the GCC of the heat exchanger network is made as shown in Figure 7. The pinch temperature is identified as 90.5 °C (95.5 °C for hot streams and 85.5 °C for cold streams). The minimum consumptions of heat and cold utilities are 19,320.1 kW and 8255.4 kW, respectively.
3.2. Effects of Lowering Operating Pressure
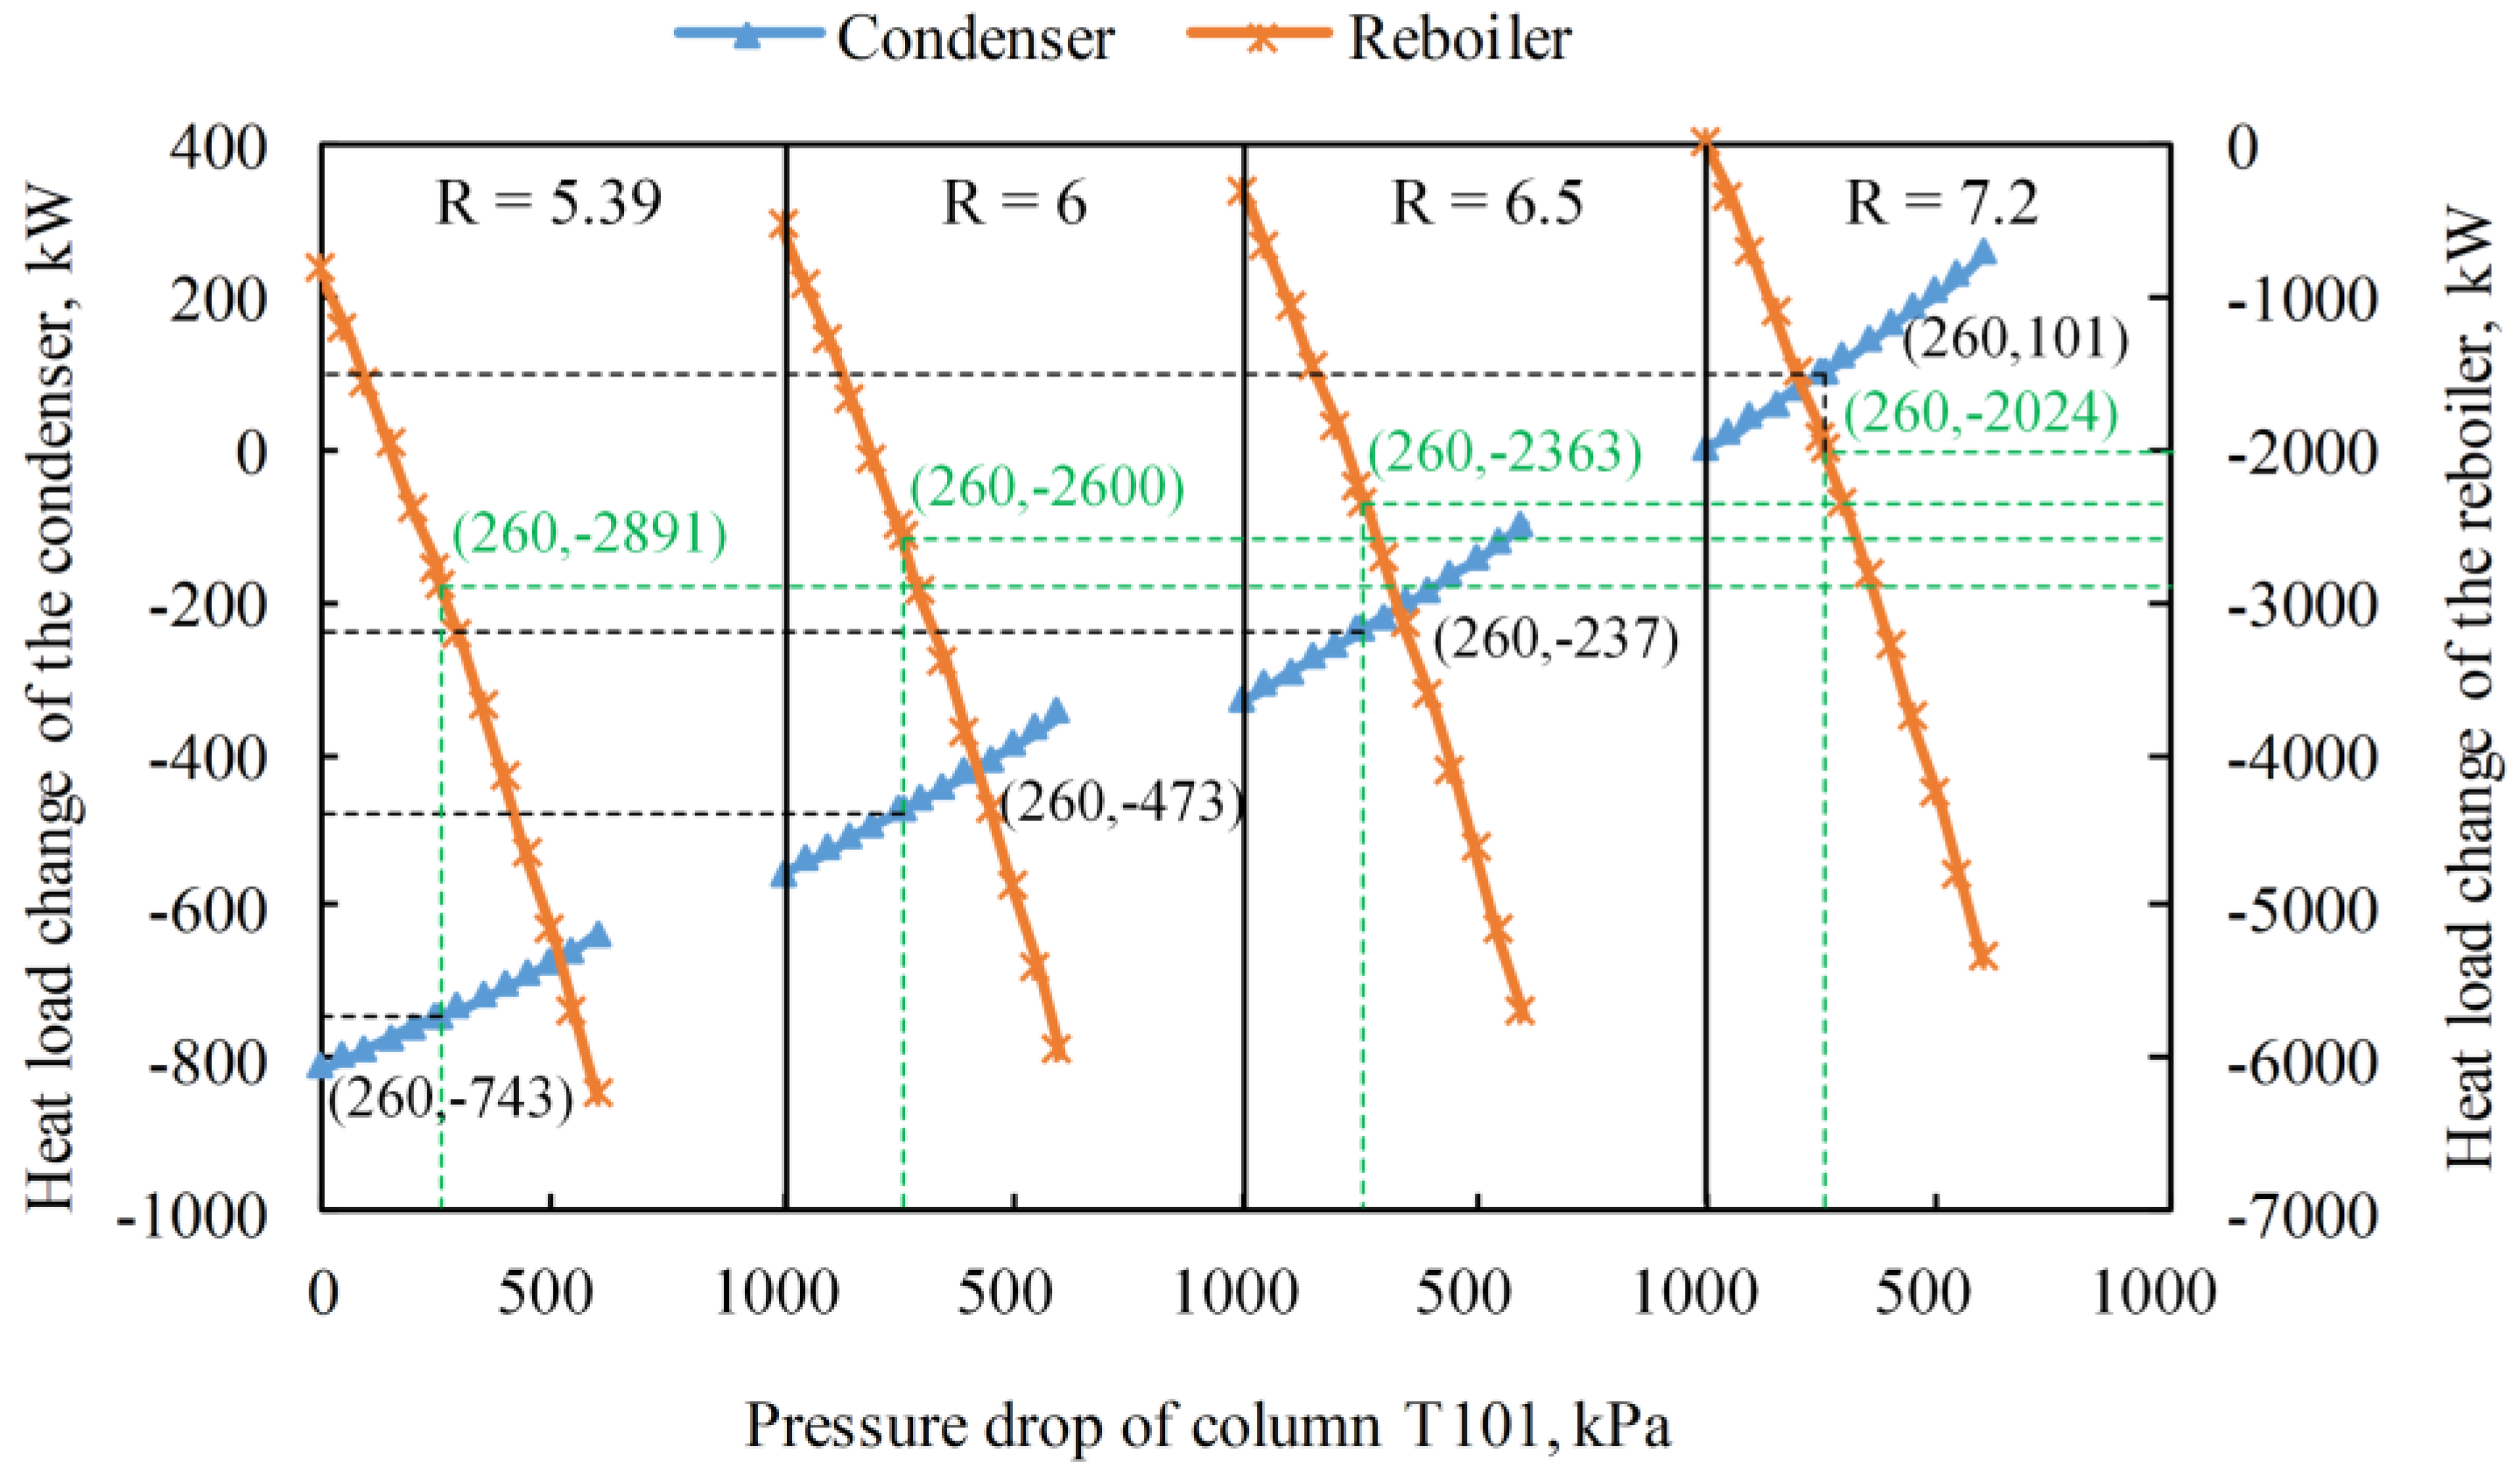
The two columns are simulated in Aspen HYSYS V10, with parameters shown in Table 5. The property method is selected as Grayson Streed, because it is recommended for systems with hydrogen. The current operating pressure of column T101 is 1187 kPa at the top and 1241 kPa at the bottom. The current reflux ratio is 7.2. Consider a winter scenario, wherein the cooling water has an initial temperature of 20 °C. Due to ΔTmin = 10 °C, the lowest outlet temperature of the condenser is 30 °C. Through simulation of column T101 in Aspen HYSYS V10, the effects of lowering operating pressure on the temperatures and heat loads of condenser and reboiler are shown in Figure 8. It can be seen that lowering the column pressure increases the heat load of the condenser but decreases that of the reboiler. The condenser outlet temperature reaches 30 °C when the operating pressure is lowered by 260 kPa. At this point, temperatures and heat loads of the condensed stream H8, the reboiled stream C2, and the bottom outlet stream H3, are shown in Table 6. Note that shifted temperatures are used to match the GCC.
According to stream data in Table 4, the reboiled stream C2 is a heat sink above the pinch, which is included in curve BC; the bottom outlet stream H3 is a heat source above the pinch and locates in curve IM; the condensed stream H8 is a heat source below the pinch and included in curve DE, as shown in Figure 7. Since the overhead outlet stream does not participate in the heat exchanger network, it is not considered in this analysis. Meanwhile, since the initial temperature of the hot stream H3 is lowered, the heat load is insufficient to heat cold stream C4 from the initial temperature to the final temperature. In order to avoid the influence of cold stream C4 on column T101, steam condensate H5 in this unit is used to preheat the low temperature section of stream C4 so that the inlet and outlet temperatures of cold stream C4 remain unchanged.
Firstly, the portion of the GCC above the pinch that includes reboiled stream C2 and bottom outlet stream H3 is extracted from Figure 7 for analysis. Due to the large temperature span of the vertical axis above the pinch, only the GCC in the temperature interval [150 °C, 290 °C] is selected in order to clearly show the GCC variations, as shown in Figure 9. It is noteworthy that the shape of GCC in the remaining temperature intervals above the pinch keeps unchanged. From Table 6, it can be seen that the initial temperature of hot stream H3 decreases from 203.5 °C to 194.3 °C, and the final temperature remains unchanged. The heat load of this stream reduces by 1266 kW. The hot stream H3 does not exist in interval [194.3 °C, 203.5 °C]. That is, the heat load of the original GCC increases by 1266 kW in this temperature interval and the changed GCC moves away from the vertical axis. The initial temperature of cold stream C2 decreases from 213.5 °C to 204.3 °C, and the final temperature decreases from 226.1 °C to 211.1 °C. The heat load of this stream reduces by 2024 kW. The cold stream C2 appears in interval [204.3 °C, 211.1 °C] instead of interval [213.5 °C, 226.1 °C]. As a result, the GCC moves close to the vertical axis, as the final GCC shown in Figure 9. The above analysis shows that the change of the hot utility is ∆QH = 1266 − 2024 = −758 kW. In Figure 9, the heat flux at the final temperature of the reboiled stream on the original GCC (QB) is equal to 12,454.93 kW, which is greater than 758 kW. Therefore, the final GCC above the original pinch point does not form a new pinch point.
Next, the portion of the GCC below the pinch containing condensed stream H8 is extracted from Figure 7 for analysis, as shown in Figure 10. After lowering the operating pressure, the initial temperature of hot stream H8 decreases from 64.1 °C to 54.4 °C, and the final temperature decreases from 33.7 °C to 25 °C. The heat load of this stream increases by 102 kW. Hot stream H8 exists in interval [25 °C, 33.7 °C] instead of interval [54.4 °C, 64.1 °C]. The variation of cold utility (∆QC) is equal to 102 kW, increasing by 102 kW. The heat flux of point L (QL) corresponding to the changed initial temperature (54.4 °C) of the condensed stream on the original GCC is equal to 5340.7 kW. The reduction in the heat load caused by the decrease in the initial temperature of the condensed stream is 2147.8 kW, which is less than 5340.7 kW. Therefore, the GCC variation below the pinch does not cause a change in the pinch position as well.
To sum up, after lowering the operating pressure of column T101 by 260 kPa, the total cold utility increases by 102 kW while the total hot utility decreases by 758 kW. The pinch position remains unchanged. Since steam is more expensive than cooling water, the best operating pressure is 927 kPa at the overhead and 981 kPa at the bottom. The temperature of cold utility is the bottleneck for further energy saving instead of the GCC. The quantitative results meet the qualitative summaries in Section 2.
3.3. Comparison and Discussion
The existing studies on changing the column pressure in the coupling optimization of distillation column and heat exchanger network can be divided into two categories. The first is that only the influence of column pressure variation on the distillation column is considered [14,26,27]. According to the quantitative analysis in Section 3.2, the heat load of the condenser increases by 102 kW, while that of the reboiler decreases by 2024 kW. The energy reduction in the reboiler is much greater than that in the overall process of 758 kW. The second is that the changes of process streams are considered only while ignoring the heat load changes of condenser and reboiler [28,29]. From Section 3.2, it can be seen that lowering the column pressure increases the hot utility by 1266 kW, which is not conducive to saving energy and contrary to the result of the overall process. This work comprehensively considers the influences of the condenser, reboiler, and process streams on the overall energy performance, which is more in line with the practice.
In addition to the operating pressure, the reflux ratio is also important to the energy consumption of a distillation column. Since lowering the operating pressure makes separation easier, it introduces a possibility of reducing the reflux ratio for further energy savings. From Figure 11, it can be found that the influence of changing the reflux ratio on the temperatures of the condenser and reboiler can be neglected. Figure 12 shows the heat load changes of condenser and reboiler with different reflux ratios and operating pressures. When the reflux ratio reduces, the heat loads of condenser and reboiler decreases. However, reducing the reflux ratio makes separation worse. With the aid of Aspen HYSYS V10, the lowest reflux ratio is found as 5.39 with the operating pressure of 927 kPa at the overhead and 981 kPa at the bottom. At this point, the heat load of the reboiler is reduced by 2891 kW and the heat load of the condenser is reduced by 743 kW. Above the pinch, the change of hot utility is ∆QH = 1266 − 2891 = −1625 kW. Namely, the hot utility is decreased by 1625 kW, which is less than QB (12,454.93 kW). Below the pinch, the heat load reduction at 54.4 °C is 1973.7 kW, which is also less than QL (5340.7 kW). As a result, the pinch position remains unchanged.
4. Conclusions
In this paper, heat integration of distillation into the overall process considering operating pressure change is comprehensively studied for energy saving purposes. A graphical method is used to analyze the variation of GCC and pinch position, which also shows the insights in such variation. A continuous reforming unit of a petrochemical enterprise is taken as a case study, where the lowest operating pressure of a distillation column is identified. The hot utility is reduced by 758 kW but the cold utility is increased by 102 kW. The effect of reducing the reflux ratio is also studied for further energy saving. The following conclusions are drawn:
- (1)
- Above the pinch point, no matter whether the bottom outlet stream is a heat source or a heat sink, it always increases the hot utility if lowering the operating pressure. At this point, when the decrease in hot utility caused by the reboiled stream is greater than the increase caused by the bottom outlet stream, the total hot utility of the overall process can be reduced.
- (2)
- Below the pinch point, no matter whether the overhead outlet stream is a heat source or a heat sink, it always reduces the cold utility. In this case, when the increase in cold utility caused by the condensed stream is less than the decrease caused by the overhead outlet stream, the total cold utility of the overall process can be reduced. When the overhead outlet stream is a heat source, at most one new pinch point occurs. When it is a heat sink, two new pinch points may occur.
- (3)
- When the pinch temperature remains unchanged, the changes of GCC and utilities above and below the pinch point are independent from each other.
- (4)
- When the pinch temperature changes, the subsections of GCC above and below the pinch point are interactional. The heat and cold utilities of the overall process are affected by the offset value of GCC.
This paper systematically studied the heat integration of distillation into the overall process considering operating pressure changes, which is more in line with practical operation. The obtained insights and rules could provide theoretical guides to the industry. However, only the energy-saving benefit is considered in this paper, instead of the number, areas, and capital cost of heat exchangers. The economic analysis and optimization of the overall process should be studied in future work.
Author Contributions
Conceptualization, W.D. and X.F.; methodology, M.Y.; software, W.D.; validation, W.D., M.Y. and X.F.; formal analysis, W.D.; investigation, W.D.; resources, M.Y. and X.F.; data curation, W.D.; writing—original draft preparation, W.D.; writing—review and editing, M.Y.; visualization, M.Y.; supervision, M.Y. and X.F.; project administration, X.F.; funding acquisition, X.F. All authors have read and agreed to the published version of the manuscript.
Funding
This work was supported by The National Natural Science Foundation of China (grant no. 21736008).
Acknowledgments
The authors gratefully acknowledge the funding support by The National Natural Science Foundation of China.
Conflicts of Interest
The authors declare no conflict of interest.
References
- Fang, J.; Cheng, X.; Li, Z.; Li, H.; Li, C. A review of internally heat integrated distillation column. Chin. J. Chem. Eng. 2019, 27, 1272–1281. [Google Scholar] [CrossRef]
- Markowski, M.; Alabrudzinski, S.; Storczyk, S. Heat and mass exchanger model for hybrid heat integrated distillation systems (HHIDiS). Appl. Therm. Eng. 2020, 174, 115249. [Google Scholar] [CrossRef]
- Walk, M.; Hamacher, J.; Downs, J.J.; Miller, S.M.; Owens, S.; Eldridge, R.B. Validation of Differential Temperature Control for a Dividing Wall Distillation Column. Ind. Eng. Chem. Res. 2021, 60, 1341–1355. [Google Scholar] [CrossRef]
- García-García, J.C.; Marmolejo-Correa, D.; Cárdenas-Guerra, J.C.; Morales-Rodriguez, R. Exergy Analysis of an Extractive Distillation Column for Reducing Energy Consumption in a Bioethanol Production Process. Comput. Aided Chem. Eng. 2018, 43, 513–518. [Google Scholar]
- Zhang, S.; Luo, Y.; Ma, Y.; Yuan, X. Simultaneous optimization of nonsharp distillation sequences and heat integration networks by simulated annealing algorithm. Energy 2018, 162, 1139–1157. [Google Scholar] [CrossRef]
- Manyele, S. Analysis of the effect of feed composition and thermal conditions on distillation plant performance using a computer model. J. Chem. Eng. Mater. Sci. 2021, 12, 40–63. [Google Scholar]
- Yang, J.; Yang, M.; Feng, X.; Wang, Y. A Hybrid Method for Integration of Heat Pump Assisted Distillation System with Intermediate Reboiler/condenser. Comput. Aided Chem. Eng. 2020, 48, 1861–1866. [Google Scholar]
- An, R.; Chen, S.; Hou, S.; Zhu, Y.; Li, C.; Zhu, X.; Liu, R.; An, W. Simulation and design of a heat-integrated double-effect reactive distillation process for propylene glycol methyl ether production. Chin. J. Chem. Eng. 2022, in press. [CrossRef]
- Wang, N.; Ye, Q.; Chen, L.; Zhang, H.; Zhong, J. Application of heat pump technology to recover 1,4-dioxane and acetonitrile from wastewater via triple-column distillation. Appl. Therm. Eng. 2021, 190, 116802. [Google Scholar] [CrossRef]
- Zin, R.M.; Abidin, M.A.; Shahruddin, M.Z. Energy Analysis and Remixing Effect of Thermal Coupling Petlyuk Column for Natural Gas Liquid (NGL) Fractionation Train. Int. J. Renew. Energy Dev. 2021, 10, 459–469. [Google Scholar] [CrossRef]
- Caballero, J.A.; Grossmann, I.E. Optimal synthesis of thermally coupled distillation sequences using a novel MILP approach. Comput. Chem. Eng. 2014, 61, 118–135. [Google Scholar] [CrossRef]
- Caballero, J.A.; Javaloyes-Anton, J.; Labarta, J.A. Structural Considerations in Zeotropic Distillation Sequences with Multiple Feeds. Comput. Chem. Eng. 2021, 154, 107475. [Google Scholar] [CrossRef]
- Smith, R. Chemical Process Design and Integration, 2nd ed.; John Wiley & Sons Inc.: Chichester, UK, 2005. [Google Scholar]
- Linnhoff, B.; Dunford, H.; Smith, R. Heat integration of distillation columns into overall processes. Chem. Eng. Sci. 1983, 38, 1175–1188. [Google Scholar] [CrossRef]
- Smith, R.; Linnhoff, B. The Design of Separators in the Context of Overall Processes. Chem. Eng. Res. Des. 1988, 66, 195–228. [Google Scholar]
- Bandyopadhyay, S. Thermal Integration of a Distillation Column Through Side-Exchangers. Chem. Eng. Res. Des. 2007, 85, 155–166. [Google Scholar] [CrossRef]
- Sun, M.; Fu, D.; Sun, L. Heat exchanger network retrofit for optimization of crude distillation unit using pinch analysis. China Pet. Process. Petrochem. Technol. 2021, 23, 31–40. [Google Scholar]
- Kravanja, P.; Modarresi, A.; Friedl, A. Heat integration of biochemical ethanol production from straw—A case study. Appl. Energy 2013, 102, 32–43. [Google Scholar] [CrossRef]
- Yang, M.; Feng, X.; Liu, G. Heat integration of heat pump assisted distillation into the overall process. Appl. Energy 2016, 162, 1–10. [Google Scholar] [CrossRef]
- Zhang, D.; Li, Y.; Sun, H.; Liu, G. Energy recovery enhancement of heat exchanger network by mixing and azeotrope formation—ScienceDirect. Chem. Eng. Sci. 2020, 228, 115992. [Google Scholar] [CrossRef]
- Aggarwal, A.; Floudast, C.A. Synthesis of heat integrated nonsharp distillation sequences. Comput. Chem. Eng. 1992, 16, 89–108. [Google Scholar] [CrossRef]
- Wang, K.; Qian, Y.; Yuan, Y.; Yao, P. Synthesis and optimization of heat integrated distillation systems using an improved genetic algorithm. Comput. Chem. Eng. 1998, 23, 125–136. [Google Scholar] [CrossRef]
- Lashkajani, K.H.; Ghorbani, B.; Amidpour, M.; Hamedi, M.H. Superstructure optimization of the olefin separation system by harmony search and genetic algorithms. Energy 2016, 99, 288–303. [Google Scholar] [CrossRef]
- Liu, Y.; Yang, M.; Zhao, L.; Du, W.; Zhong, W.; Qian, F. Simultaneous Optimization and Heat Integration of an Aromatics Complex with a Surrogate Model. Ind. Eng. Chem. Res. 2021, 60, 3633–3647. [Google Scholar] [CrossRef]
- Fan, Y.; Ye, Q.; Cen, H.; Chen, J.; Liu, T. Design and optimization of reactive distillation processes for synthesis of isopropanol based on self-heat recuperation technology. Chem. Eng. Res. Des. 2019, 147, 171–186. [Google Scholar] [CrossRef]
- Van, D.; Kjelstrup, S. Improving the Heat Integration of Distillation Columns in a Cryogenic Air Separation Unit. Ind. Eng. Chem. Res. 2011, 50, 9324–9338. [Google Scholar]
- Zhao, F.; Xu, Z.; Zhao, J.; Wang, J.; Hu, M.; Li, X.; Zhu, Z.; Cui, P.; Wang, Y.; Ma, Y. Process design and multi-objective optimization for separation of ternary mixtures with double azeotropes via integrated quasi-continuous pressure-swing batch distillation. Sep. Purif. Technol. 2021, 276, 119288. [Google Scholar] [CrossRef]
- Pyrgakis, K.A.; Ioannis, K.P.; Kokossis, A.C. A MILP Transshipment Model to Integrate and Re-Engineer Distillation Columns into Overall Processes. Comput. Aided Chem. Eng. 2015, 37, 2015–2020. [Google Scholar]
- Zhang, D.; Liu, G. Integration of heat exchanger network considering the pressure variation of distillation column. Appl. Therm. Eng. 2017, 116, 777–783. [Google Scholar] [CrossRef]
Figure 1.
Distillation column and related streams.

Figure 2.
Variation of streams and the grand composite curve (GCC) for Case 1: (a) Variations of the streams; (b) Variation of GCC.
Figure 2.
Variation of streams and the grand composite curve (GCC) for Case 1: (a) Variations of the streams; (b) Variation of GCC.
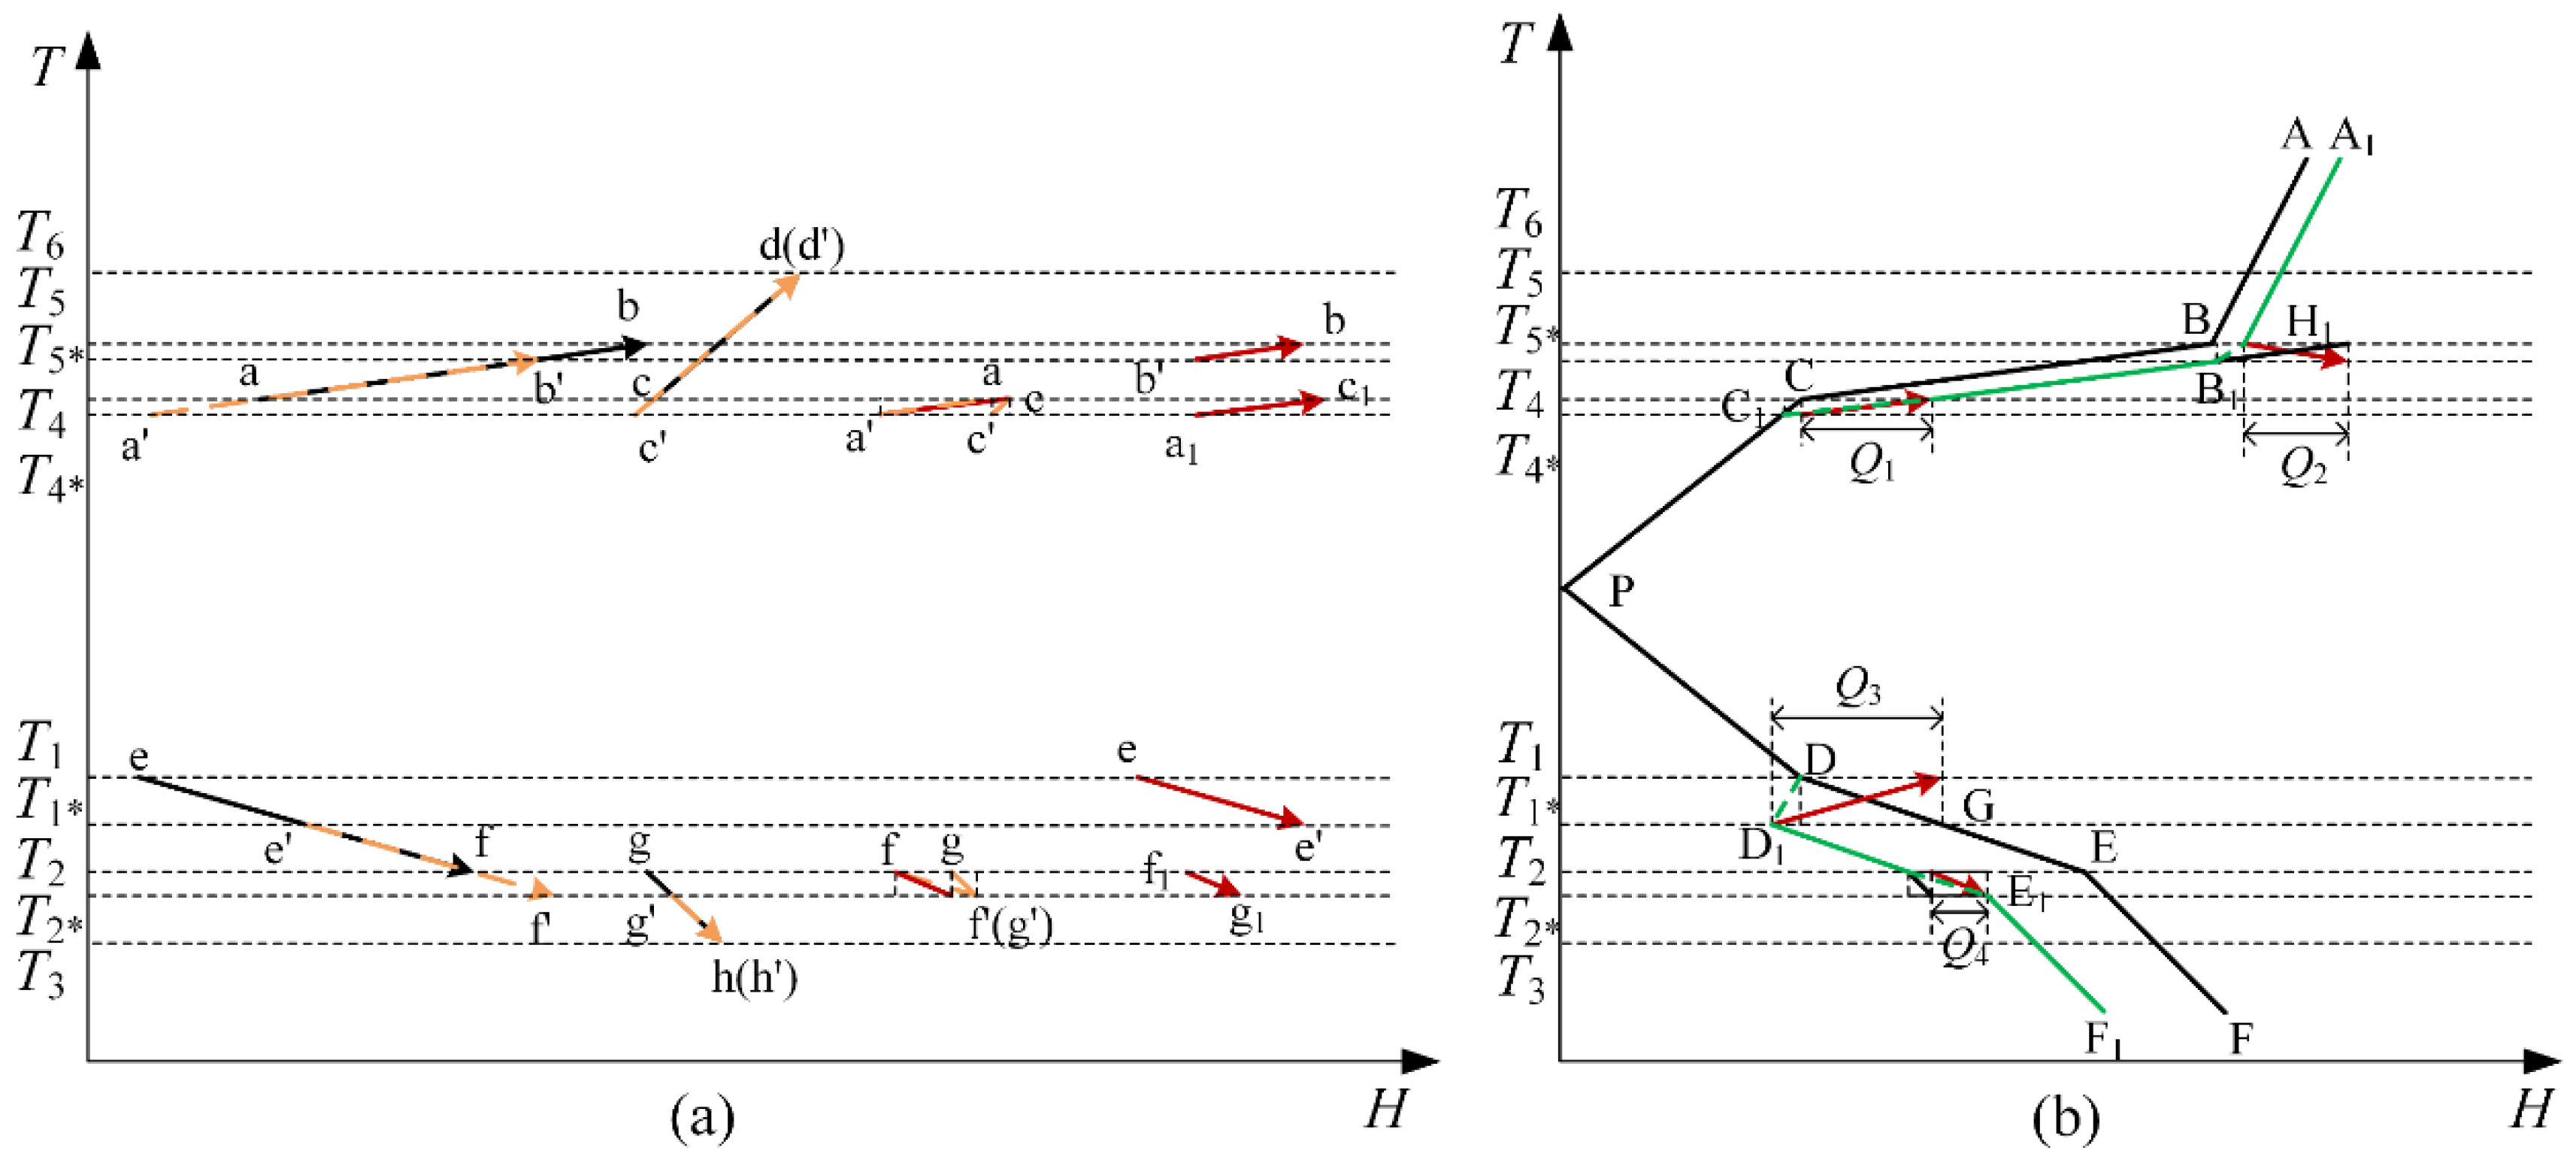
Figure 3.
Variation of GCC for Case 2.
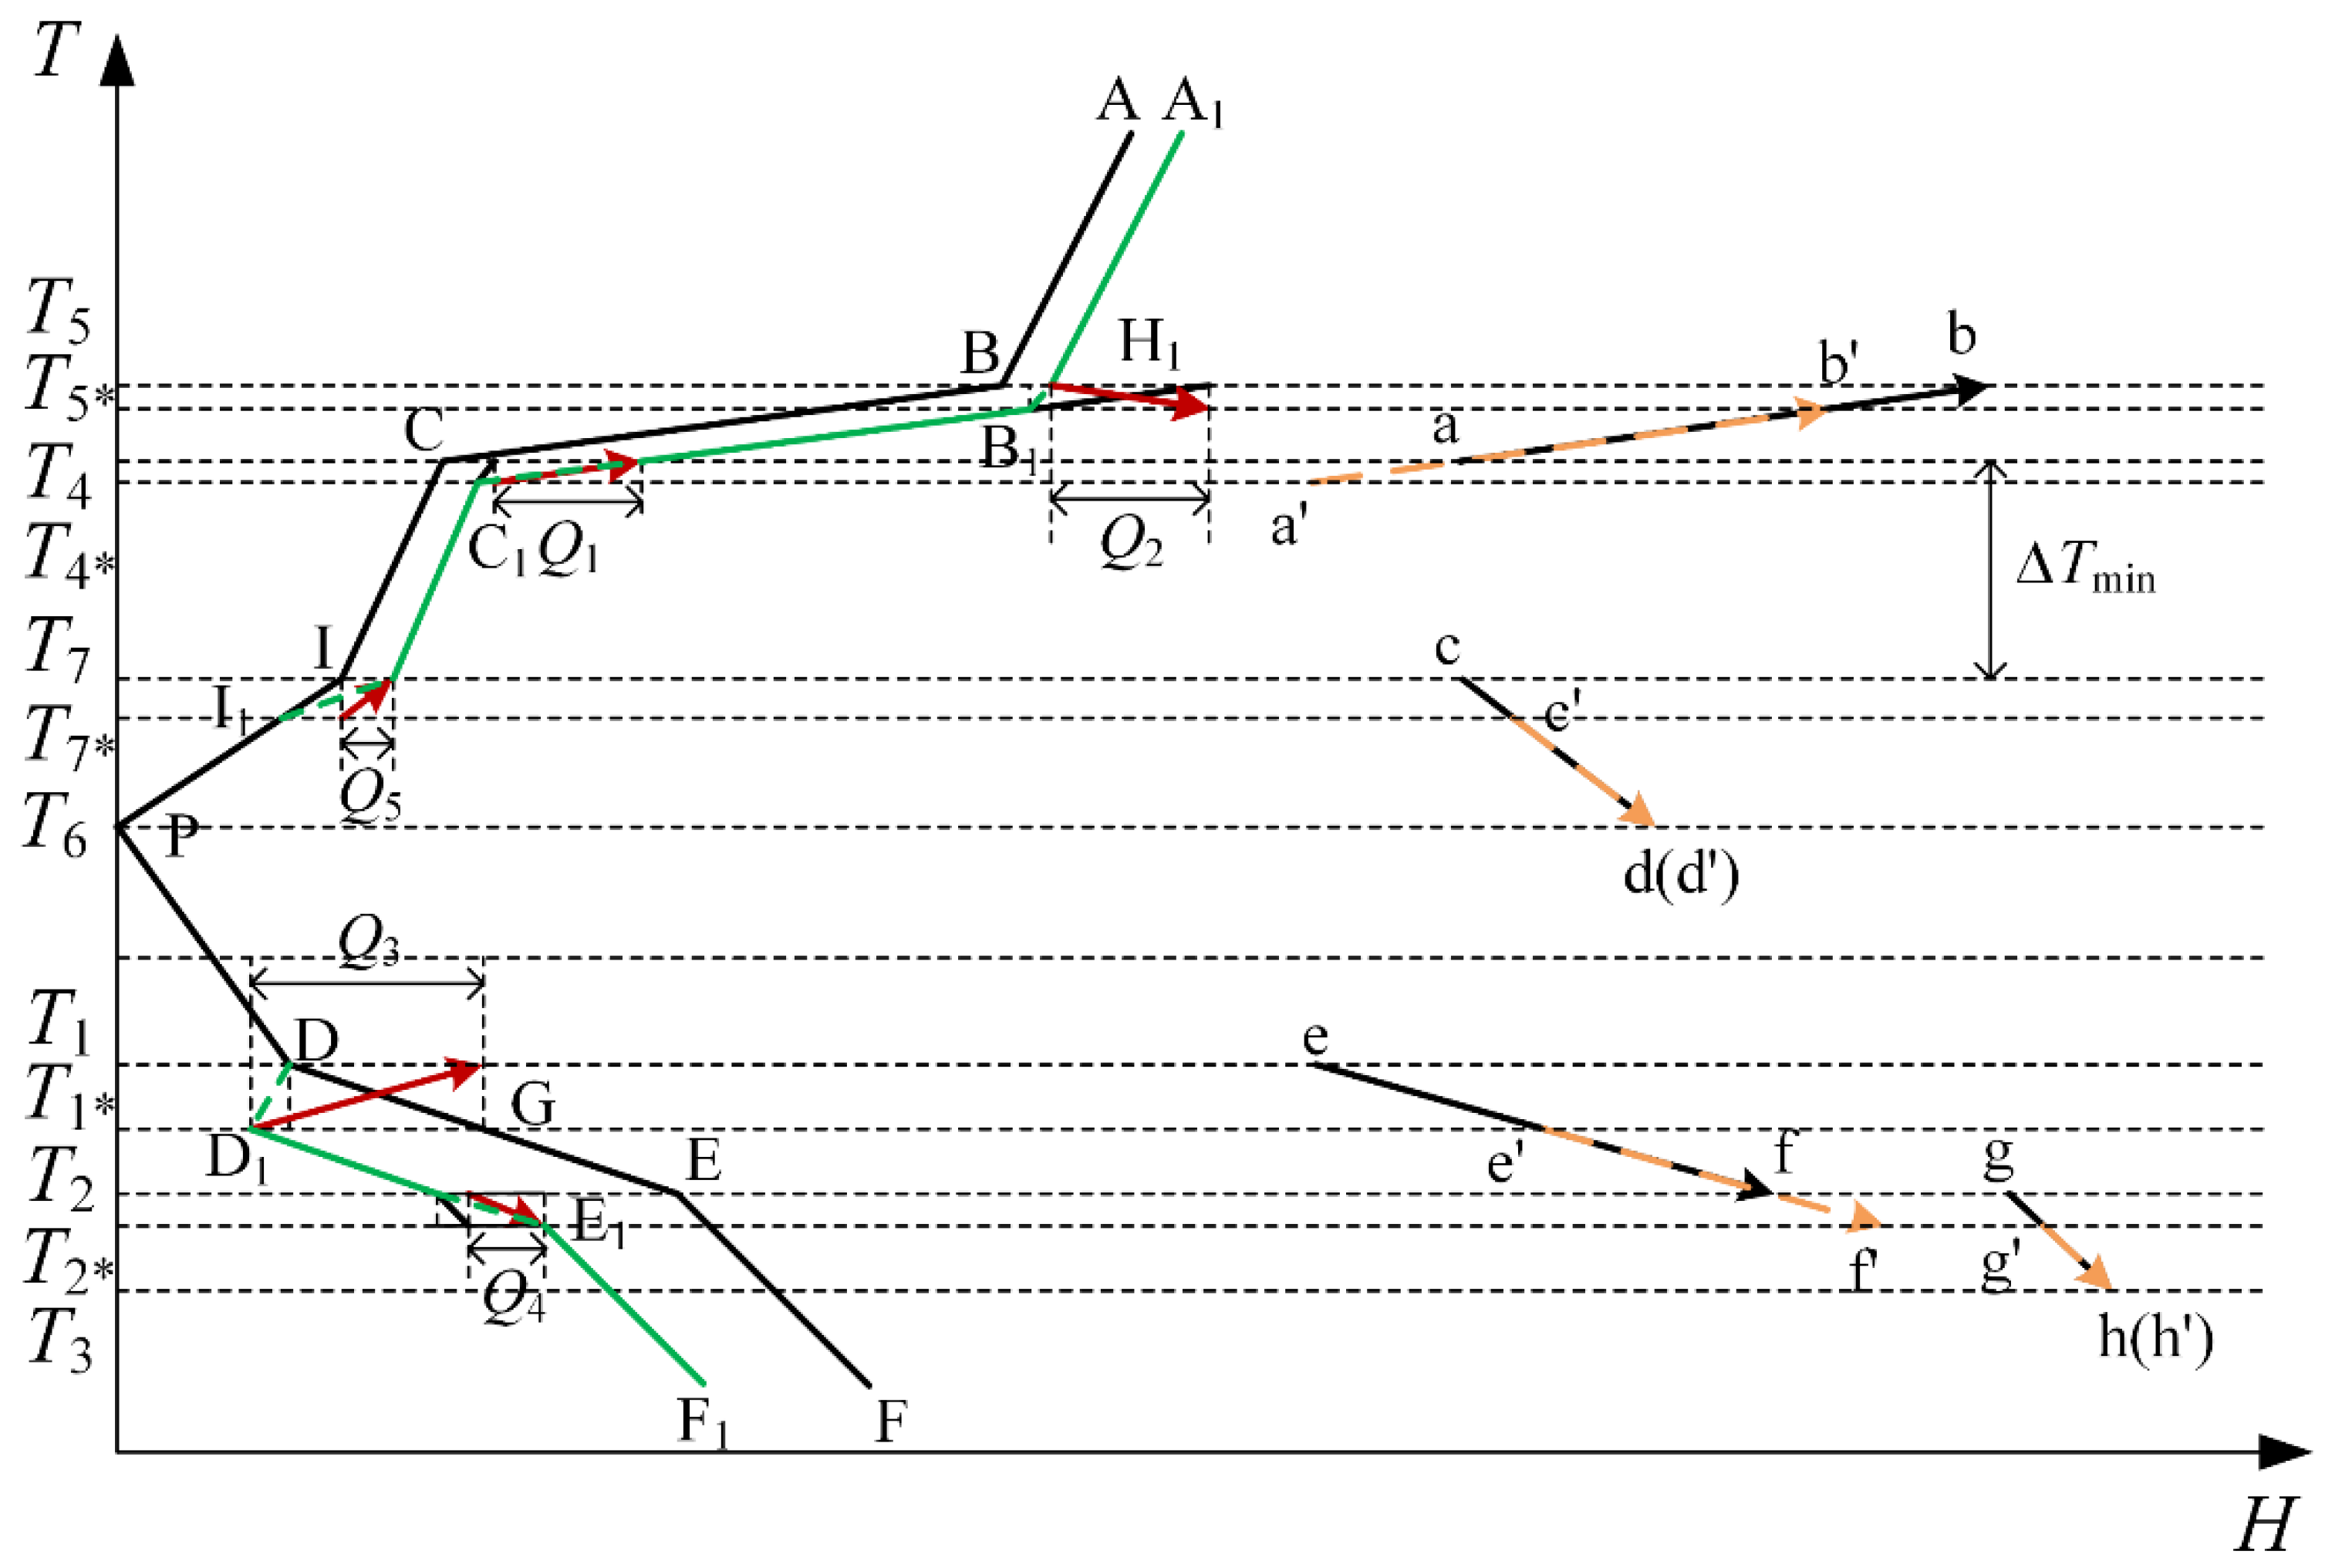
Figure 4.
Variation of GCC for Case 3.

Figure 5.
Variation of GCC for Case 4.

Figure 6.
Partial flowsheet of the continuous reforming process.

Figure 7.
GCC of the heat exchanger network.
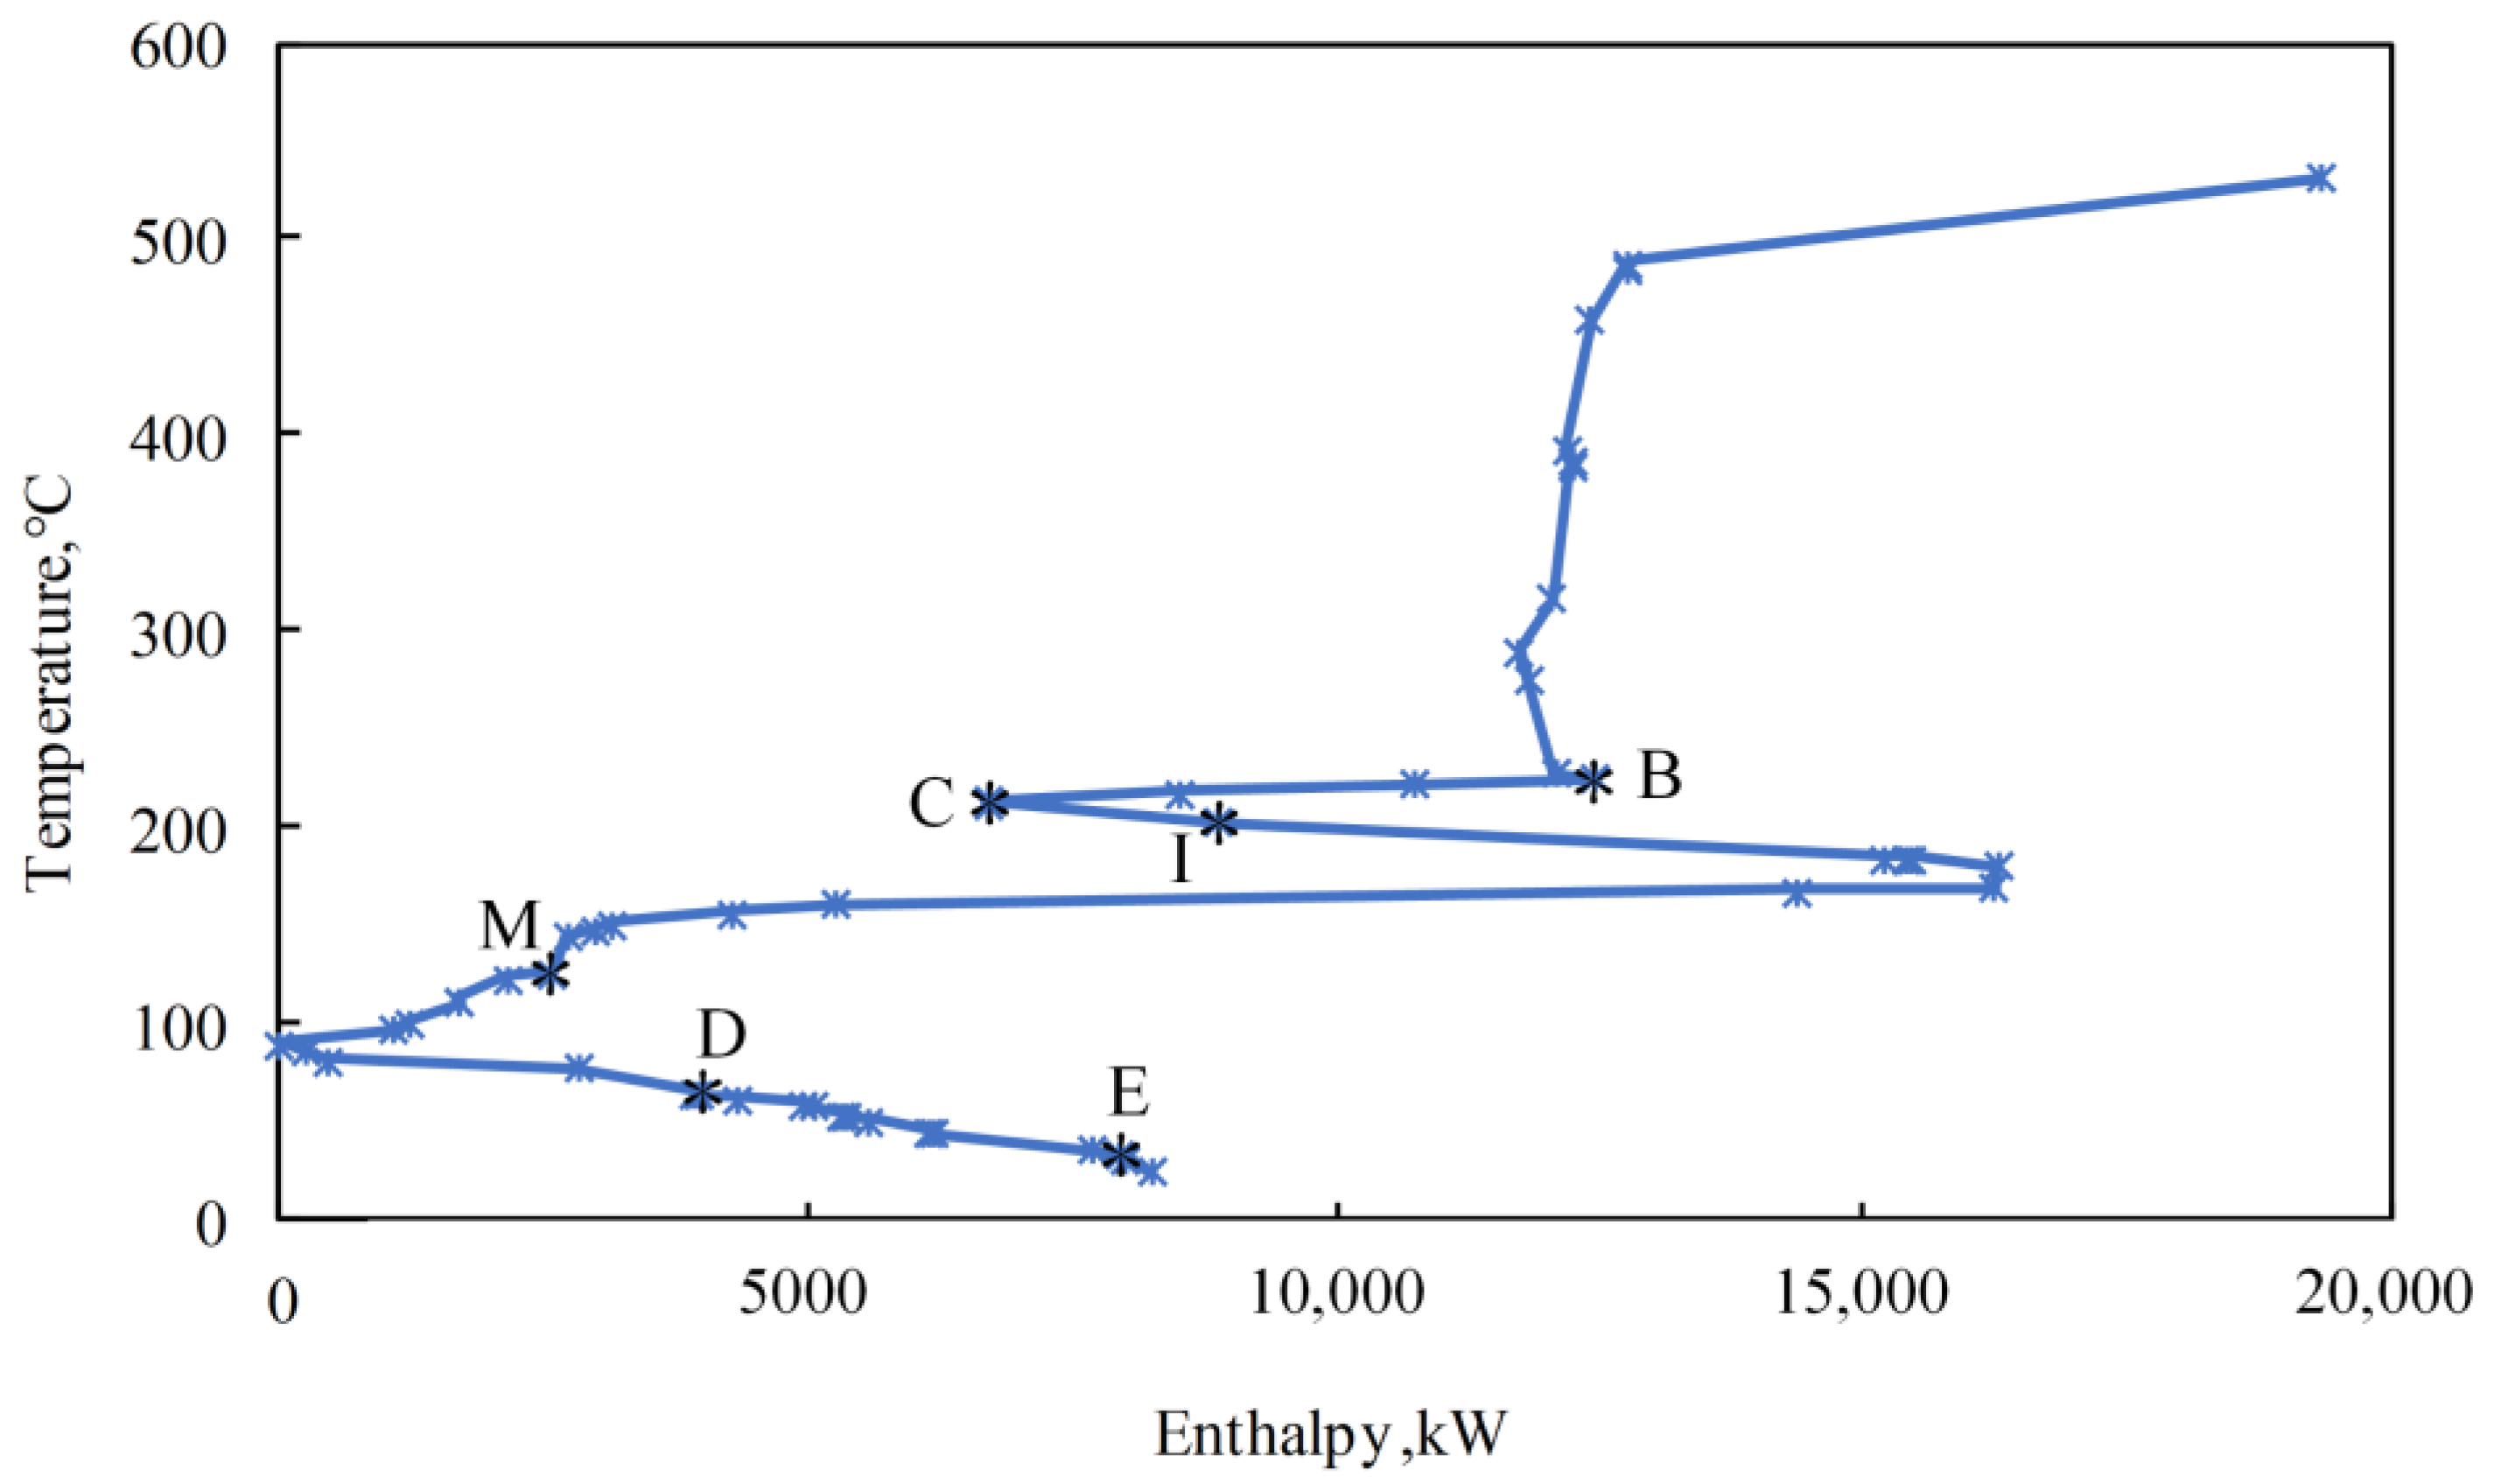
Figure 8.
Temperatures and heat load changes of condenser and reboiler after lowering operating pressure.
Figure 8.
Temperatures and heat load changes of condenser and reboiler after lowering operating pressure.

Figure 9.
Variation of GCC above the pinch.
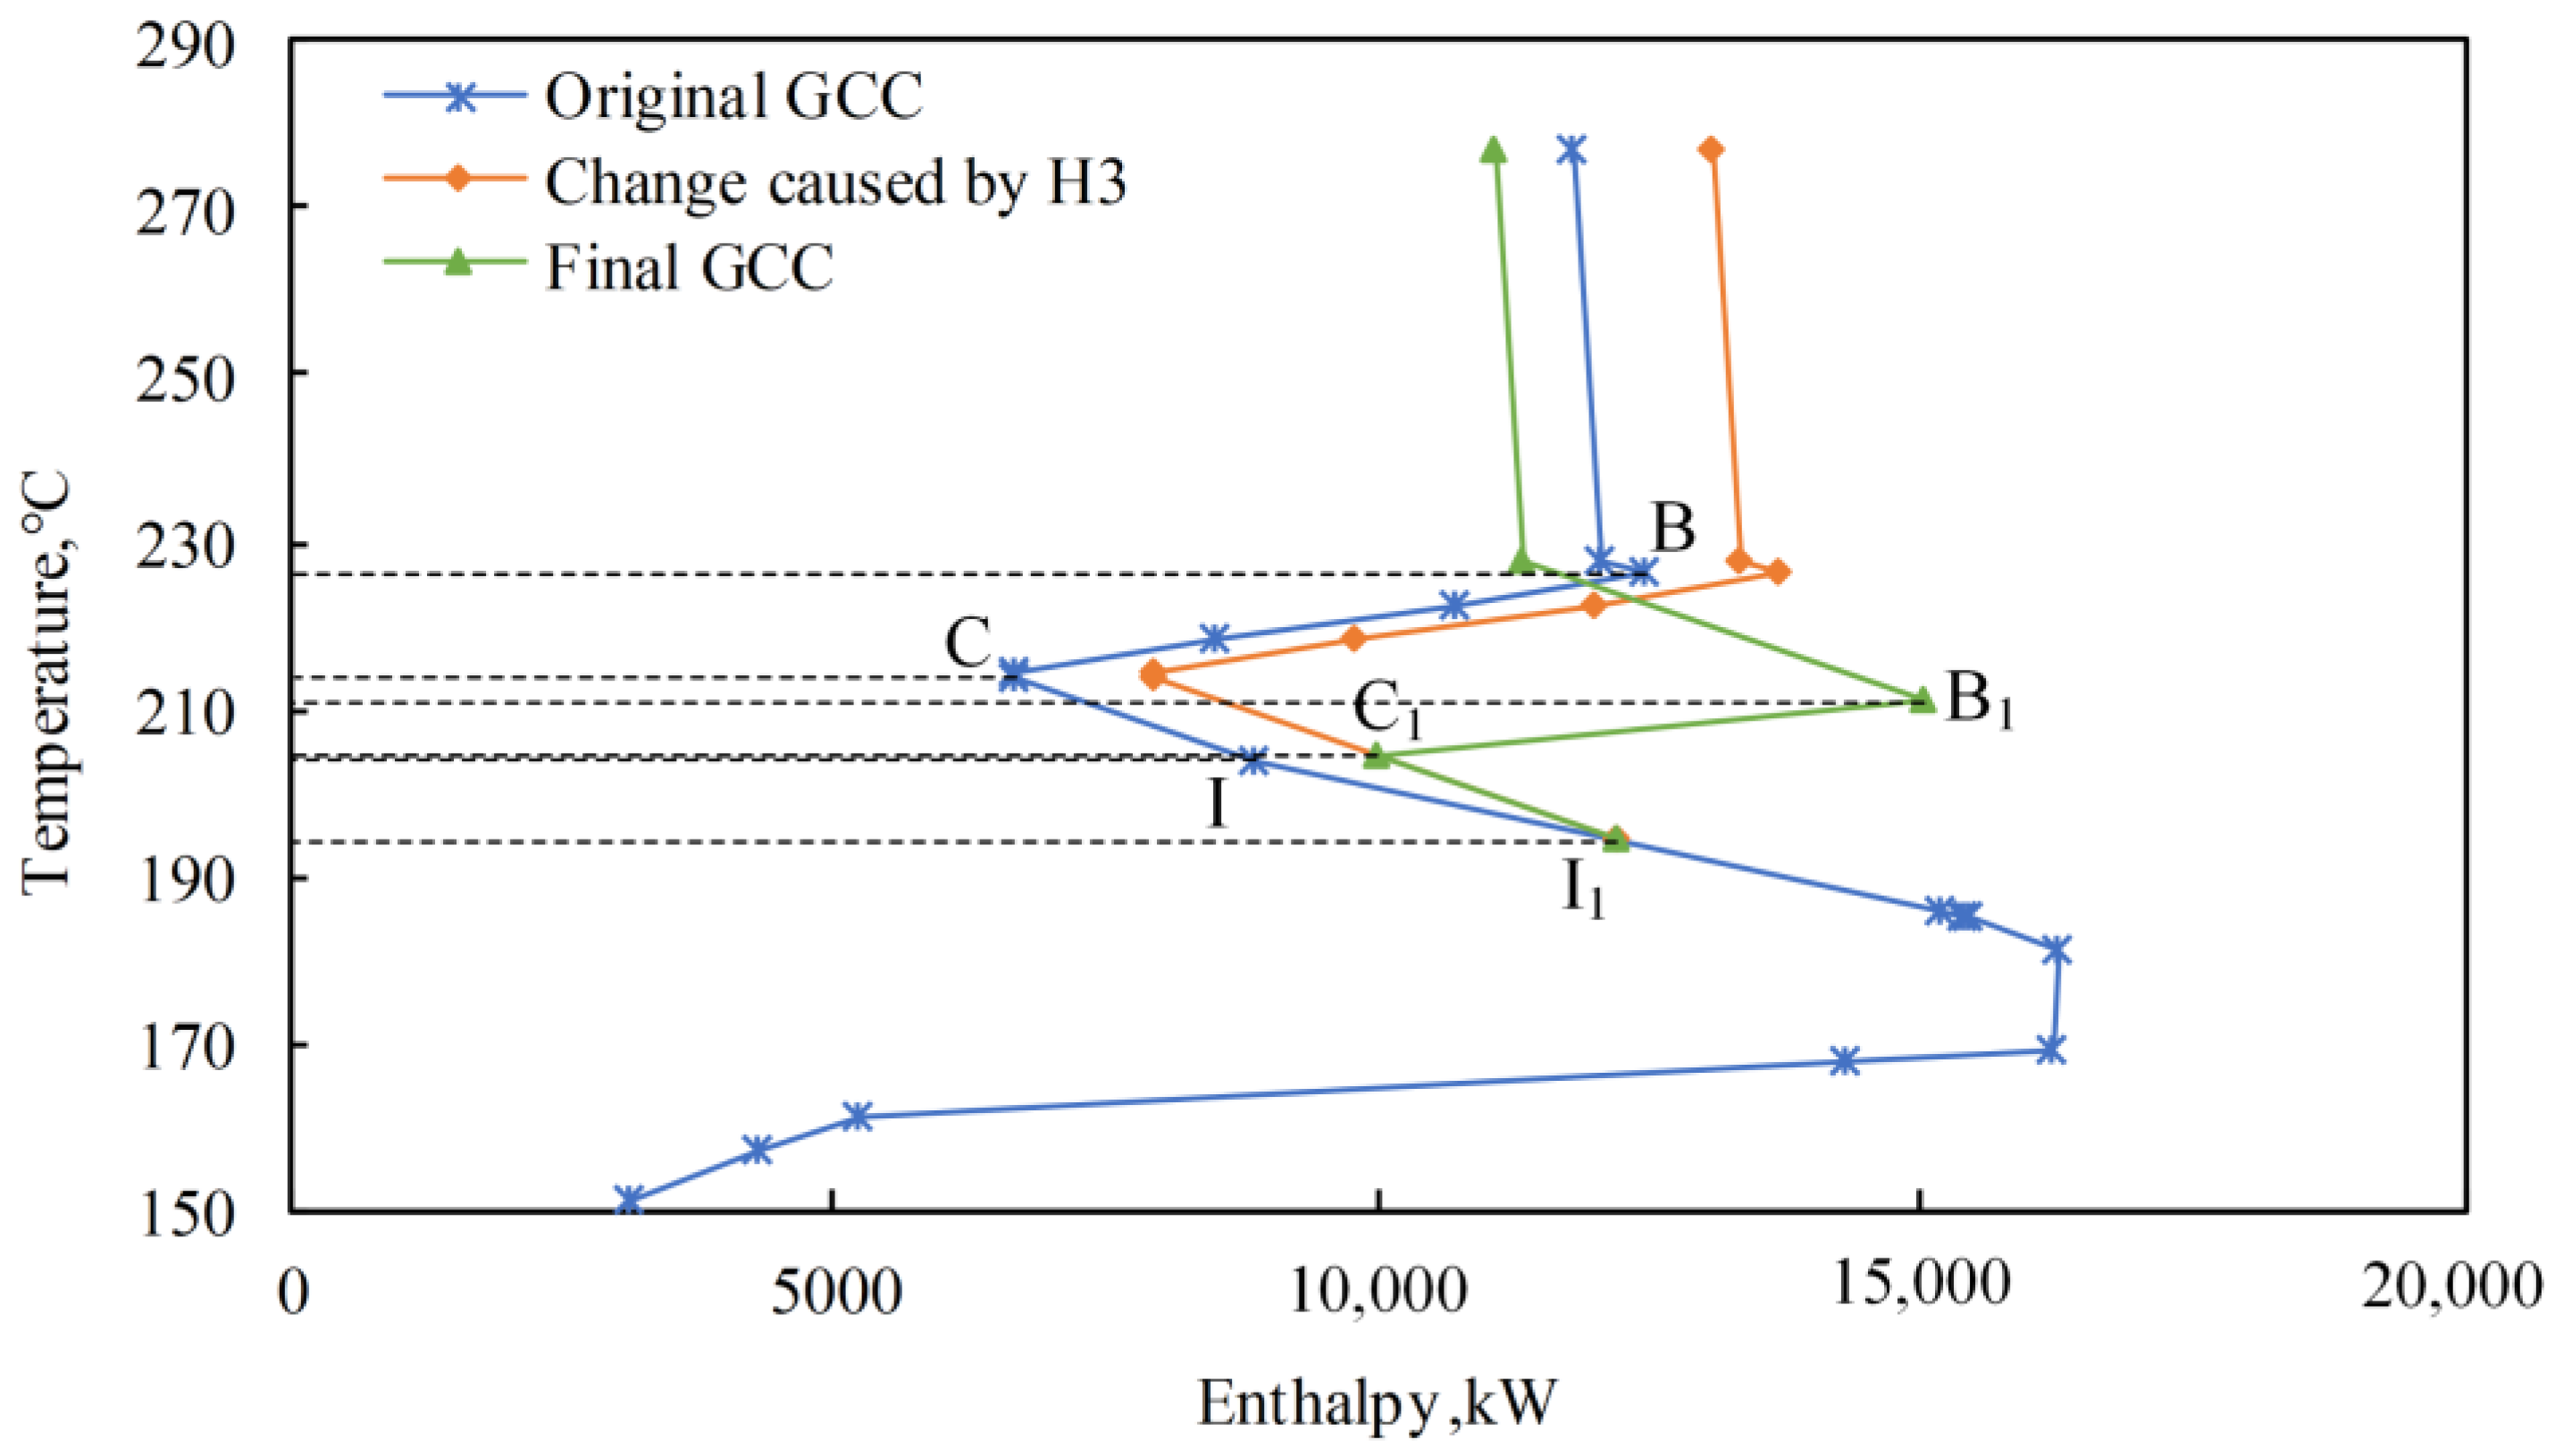
Figure 10.
Variation of GCC below the pinch.

Figure 11.
Condenser and reboiler outlet temperatures under different reflux ratios and operating pressures.
Figure 11.
Condenser and reboiler outlet temperatures under different reflux ratios and operating pressures.
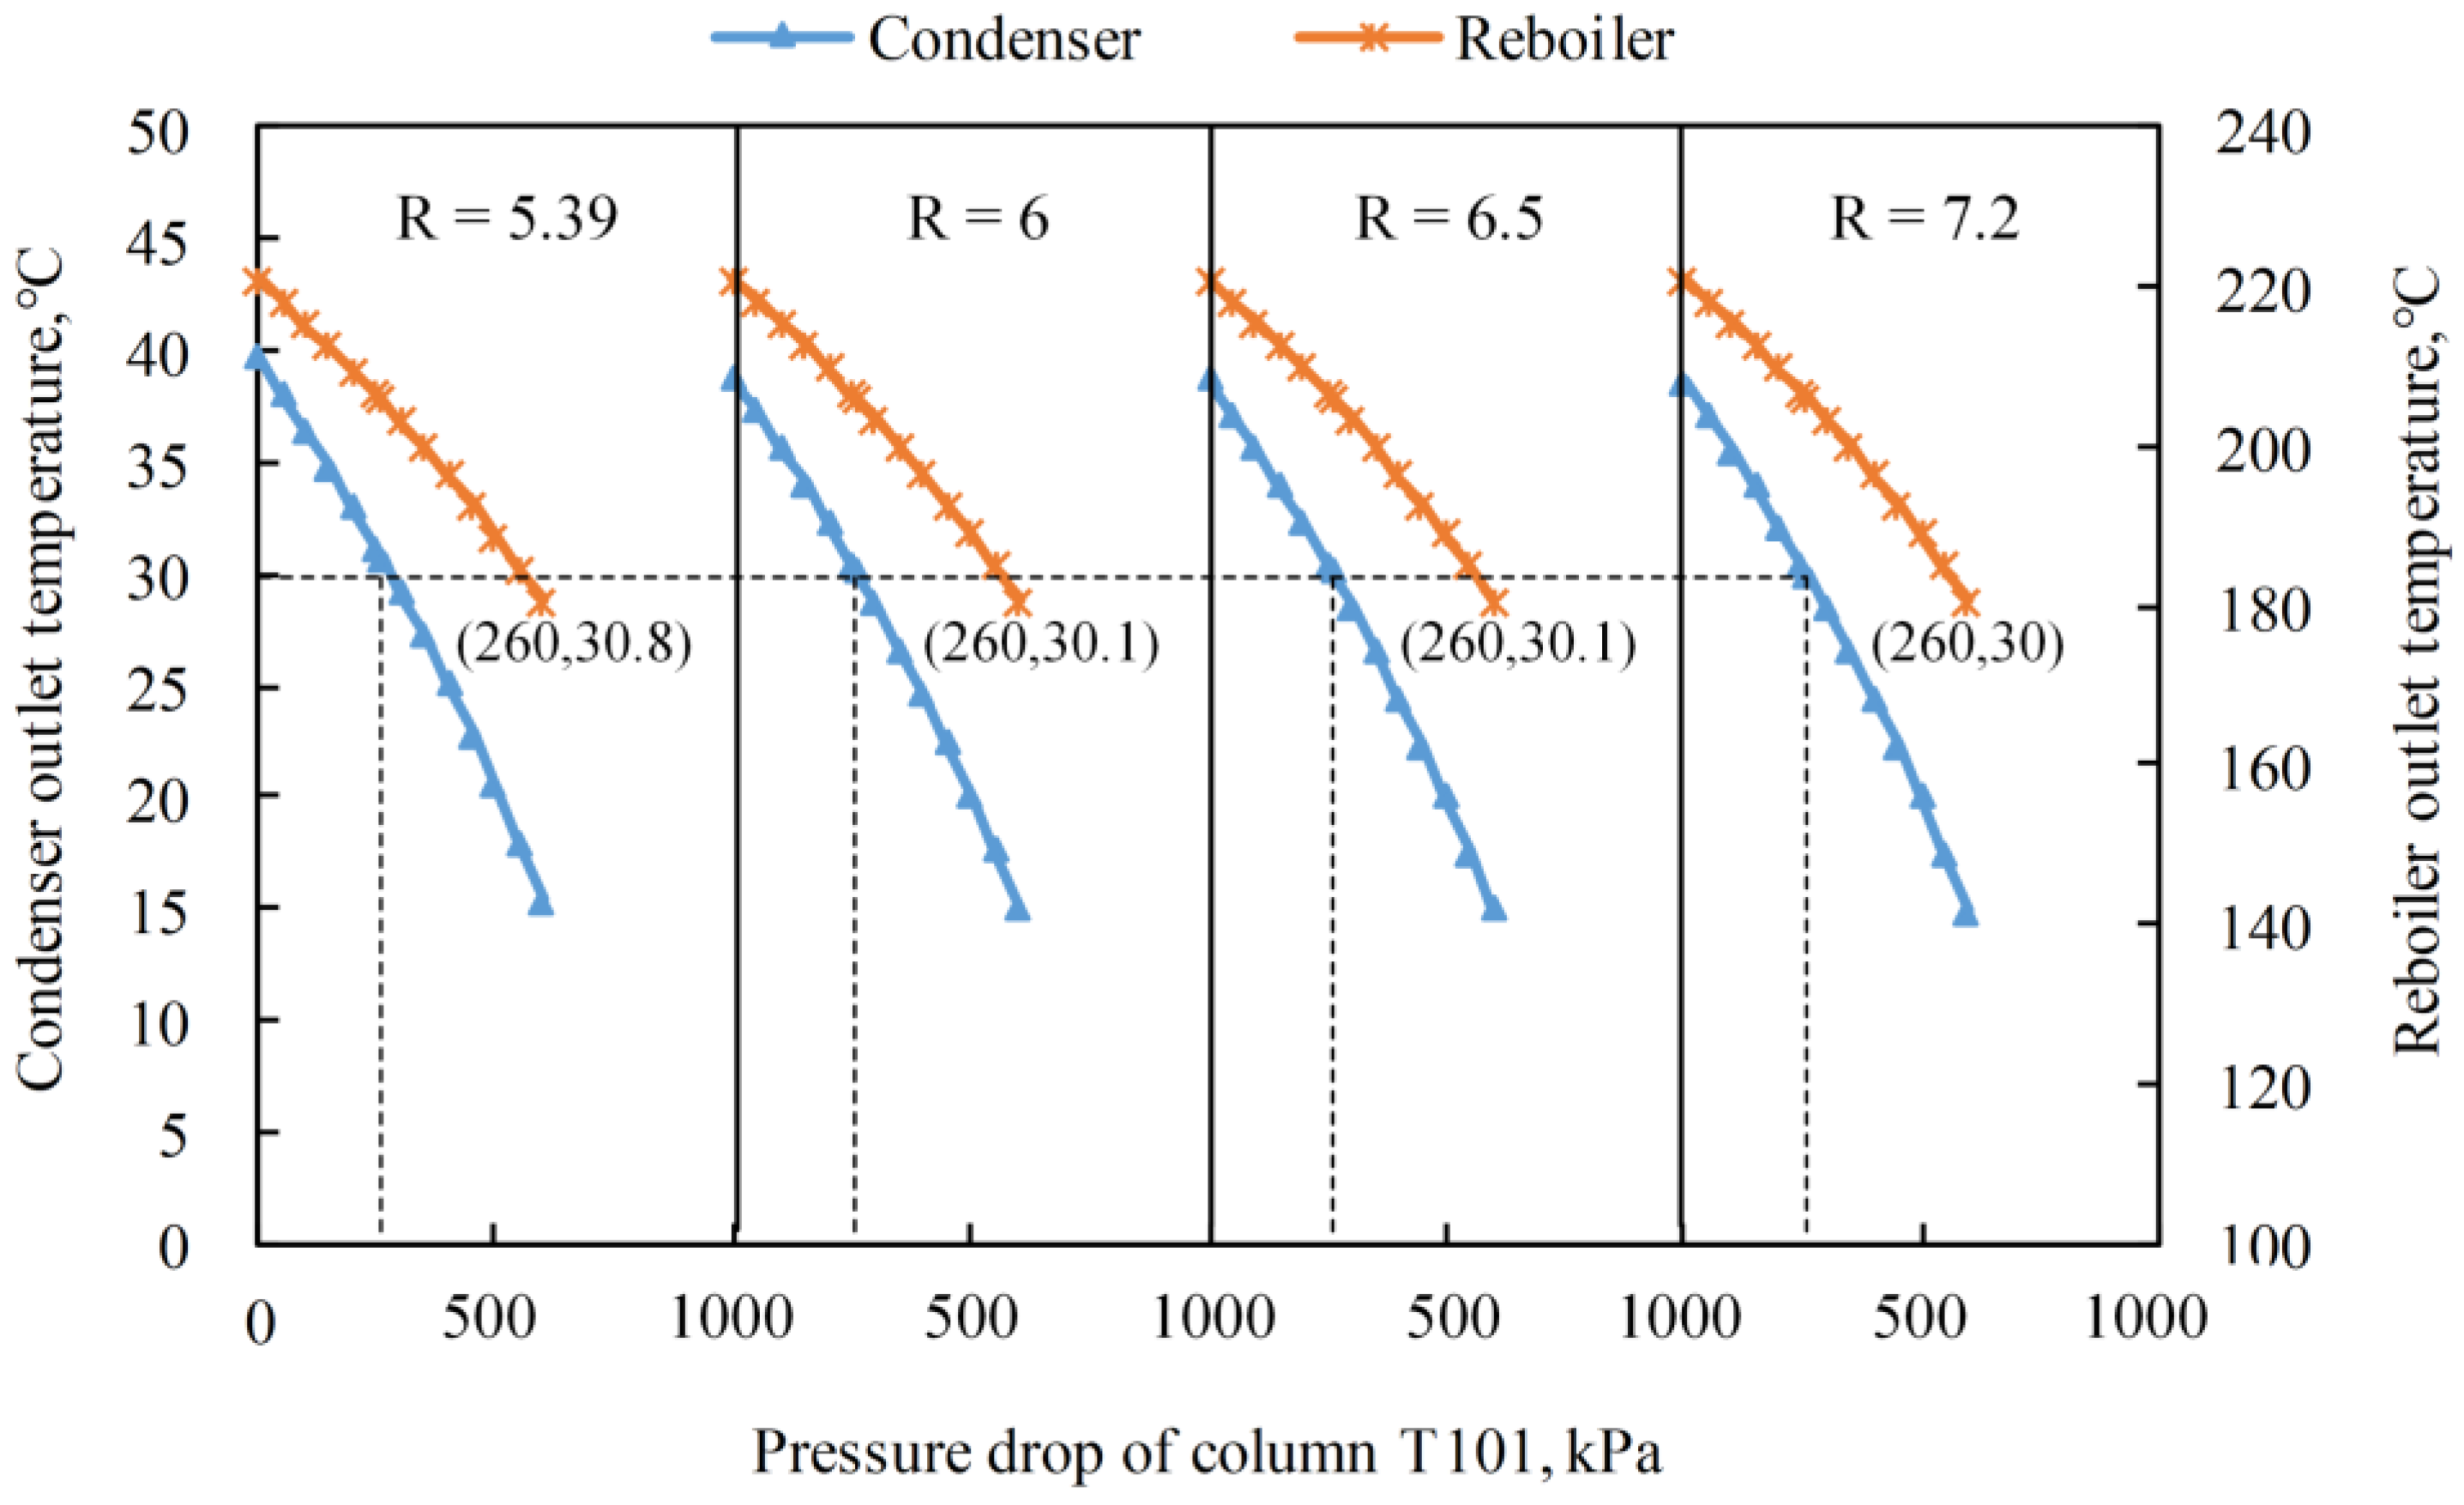
Figure 12.
Heat load changes of condenser and reboiler under different reflux ratios and operating pressures.
Figure 12.
Heat load changes of condenser and reboiler under different reflux ratios and operating pressures.

Table 1.
Changes of the pinch temperature and utilities for Case 1.
| Location | Variations of Heat Flux at Each Point | Pinch Temperature | Variations of Utilities |
|---|---|---|---|
| Above the pinch | Q2 < Q1 | Unchanged | (increase) |
| Q2 = Q1 | Unchanged | (unchanged) | |
| Q2 > Q1 and Q2 − Q1 < QB | Unchanged | (decrease) | |
| Q2 > Q1 and Q2 − Q1 = QB | Double pinch points | ||
| Q2 > Q1 and Q2 − Q1 > QB | Raised | (decrease) | |
| Below the pinch | Q3 < QG | Unchanged | |
| Q3 = QG | Double pinch points | ||
| Q3 > QG | Reduced |
Table 2.
Changes of the pinch temperature and hot utility for Case 2.
| Location | Variations of Heat Flux at Each Point | Pinch Temperature | Variations of Hot Utility |
|---|---|---|---|
| Above the pinch | Q2 < Q1 + Q5 | Unchanged | (increase) |
| Q2 = Q1 + Q5 | Unchanged | (unchanged) | |
| Q2 > Q1 + Q5 and Q2 − (Q1 + Q5) < QB | Unchanged | (decrease) | |
| Q2 > Q1 + Q5 and Q2 − (Q1 + Q5) = QB | Double pinch points | ||
| Q2 > Q1 + Q5 and Q2 − (Q1 + Q5) > QB | Raised | (decrease) |
Table 3.
Changes of the pinch temperature and cold utility for Case 3.
| Location | Variations of Heat Flux at Each Point | Pinch Temperature | Variations of Cold Utility | |
|---|---|---|---|---|
| Below the pinch | Q6 < QK and Q3 + Q6 < QL | Unchanged | ||
| Q6 < QK and Q3 + Q6 = QL | Double pinch points (the original and the second) | |||
| Q6 < QK and Q3 + Q6 > QL | Reduced (the second pinch point) | |||
| Q6 = QK and Q3 + Q6 < QL | Double pinch points (the original and the first) | |||
| Q6 = QK and Q3 + Q6 = QL | Three pinch points | |||
| Q6 = QK and Q3 + Q6 > QL | Reduced (the second pinch point) | |||
| Q6 > QK and Q3 + Q6 < QL | Reduced (the first pinch point) | |||
| Q6 > QK and Q3 + Q6 = QL | ||||
| Q6 > QK and Q3 + Q6 > QL | ∆QS4 > ∆QS5 | Reduced (the first pinch point) | ||
| ∆QS4 = ∆QS5 | Double pinch points (the first and the second) | |||
| ∆QS4 < ∆QS5 | Reduced (the second pinch point) | |||
Table 4.
Stream data of the heat exchanger network.
| Stream Number | Heat Exchanger | Initial Temperature/°C | Final Temperature/°C | Heat Load/kW |
|---|---|---|---|---|
| H1 | E–201 | 493.4 | 117.0 | 58,300 |
| H2 | E–202 | 490.8 | 190.0 | 42 |
| H3 | E–105 | 208.5 | 132.3 | 9914 |
| H4 | E–102 | 156.3 | 102.6 | 6031 |
| H5 | E–100 | 150.0 | 70.0 | 4692 |
| H6 | A–201 | 117.2 | 42.0 | 7863 |
| H7 | A–103 | 87.4 | 30.5 | 4052 |
| H8 | E–104 | 69.1 | 59.4 | 2152 |
| A–102 | 59.4 | 38.7 | 1376 | |
| C1 | E–201 | 85.5 | 453.9 | 58,300 |
| F–201 | 453.9 | 525.9 | 11,070 | |
| C2 | F–102 | 208.5 | 221.1 | 8539 |
| C3 | E–202 | 27.0 | 180.6 | 42 |
| C4 | E–102 | 48.7 | 102.0 | 6031 |
| E–105 | 102.0 | 179.8 | 9914 | |
| C5 | F–103 | 156.3 | 164.4 | 9437 |
| C6 | E–104 | 40.0 | 58.0 | 2152 |
Table 5.
Parameters and specifications of the two columns.
| T101 | T102 | ||
|---|---|---|---|
| Number of Stages | 40 | 40 | |
| Feed location | 21 | 21 | |
| Feed | Naphtha | Gasoline | |
| Overhead product | Light components | Light naphtha | |
| Bottom product | Gasoline | Refined naphtha | |
| Product specifications | Overhead liquid | C5 ≤ 3.0 vol% | C4 ≤ 12.5 wt % C6 ≤ 45 wt % benzene ≤ 3.6 wt % |
| Overhead waste gas | H2S ≤ 0.1 vol% | - | |
| Bottom product | - | Initial boiling point in 85–89 °C | |
Table 6.
Comparison of relevant stream data before and after lowering the operating pressure of column T101 by 260 kPa.
Table 6.
Comparison of relevant stream data before and after lowering the operating pressure of column T101 by 260 kPa.
| Stream Number | Change | Initial Temperature/°C | Initial Temperature on the GCC/°C | Final Temperature/°C | Final Temperature on the GCC/°C | Pressure/kPa | Heat Load/kW |
|---|---|---|---|---|---|---|---|
| H3 | Before | 208.5 | 203.5 | 132.3 | 127.3 | 1241 | 9914 |
| After | 199.3 | 194.3 | 132.3 | 127.3 | 981 | 8648 | |
| H8 | Before | 69.1 | 64.1 | 38.7 | 33.7 | 1187 | 3528 |
| After | 59.4 | 54.4 | 30.0 | 25.0 | 927 | 3630 | |
| C2 | Before | 208.5 | 213.5 | 221.1 | 226.1 | 1241 | 8539 |
| After | 199.3 | 204.3 | 206.1 | 211.1 | 981 | 6515 |
Publisher’s Note: MDPI stays neutral with regard to jurisdictional claims in published maps and institutional affiliations. |
© 2022 by the authors. Licensee MDPI, Basel, Switzerland. This article is an open access article distributed under the terms and conditions of the Creative Commons Attribution (CC BY) license (https://creativecommons.org/licenses/by/4.0/).
Share and Cite
MDPI and ACS Style
Duan, W.; Yang, M.; Feng, X. Comprehensive Analysis and Targeting of Distillation Integrated into Overall Process Considering Operating Pressure Change. Processes 2022, 10, 1861. https://doi.org/10.3390/pr10091861
AMA Style
Duan W, Yang M, Feng X. Comprehensive Analysis and Targeting of Distillation Integrated into Overall Process Considering Operating Pressure Change. Processes. 2022; 10(9):1861. https://doi.org/10.3390/pr10091861
Chicago/Turabian StyleDuan, Wenting, Minbo Yang, and Xiao Feng. 2022. "Comprehensive Analysis and Targeting of Distillation Integrated into Overall Process Considering Operating Pressure Change" Processes 10, no. 9: 1861. https://doi.org/10.3390/pr10091861
Note that from the first issue of 2016, this journal uses article numbers instead of page numbers. See further details here.