Article

Entropy Flow Analysis of Thermal Transmission Process in Integrated Energy System Part II: Comparative Case Study

1
School of Energy and Power Engineering, Shandong University, Jinan 250061, China
2
Optics & Thermal Radiation Research Center, Shandong University, Qingdao 266237, China
3
School of Electrical Engineering, Shandong University, Jinan 250061, China
*
Author to whom correspondence should be addressed.
Processes 2022, 10(9), 1719; https://doi.org/10.3390/pr10091719
Submission received: 10 August 2022 / Revised: 24 August 2022 / Accepted: 26 August 2022 / Published: 29 August 2022

Abstract

:
The dynamic characteristics of thermal energy play an important role of multi-scale coupling among heterogeneous energy sources in integrated energy systems (IES). In Part I, for the purpose of accurately describing the dynamic processes of thermal energy transmission, the theoretical approach and models were proposed and verified by numerical simulation. In this part, an innovative analytical method based on entropy flow was derived on the basis of theory developed in Part I, which can assess the quantity and quality of thermal transport. A comparative case study indicates that the change trend of entropy flow of each node is consistent with the change of available power, but independent of temperature. The node entropy flow is increased compared with the algebraic sum of branch entropy flow, which reflects the phenomenon of entropy generation in the mixing process; while the change of available power is just the opposite. This means the irreversible entropy generation at the node leads to loss of the available thermal power. Therefore, it is more accurate to describe the dynamic thermal transmission process on the scale of entropy. This proves the effectiveness of the models proposed in Part I as well as the methods in this part from the perspective of application.

1. Introduction

Multi energy complementarity is a typical feature of integrated energy systems (IES). As an important part of IES, the dynamic transmission characteristics of thermal energy are the key bridge to building a coupling relationship among heterogeneous energy sources such as heat, electricity, cold, gas, etc. [1,2,3]. However, various energy forms have different properties and differences in capacity, resistance, delay and other aspects, even far from each other, which leads to difficulties in the unified description of multi energy. Therefore, it is particularly important to seek a parameter or scale and its corresponding method that can comprehensively describe or simplify the differences in the properties of heterogeneous energy [4].
The research method for IES planning and operation is based on the modeling and analysis of a coupled multi energy network, and the consistency scale of different energy forms is the basis of the modeling and analysis [5]. In recent years, many scholars have performed research on the parameter comparison, energy unification and energy network theory for a variety of heterogeneous energies and established many diverse models to describe this problem from different perspectives. Among them, the idea of thermoelectric analogy has been developed. Weedy [6], Capizzi et al. [7] and Hao et al. [8] conducted circuit analogy for heat exchange systems, and successfully used the circuit method to analyze the heat resistance, heat capacity and thermal transmission characteristics of the heating system. Several researchers [9,10,11] proposed the energy flow model of the thermal system and established the overall transport model of energy in the electric thermal integrated energy system. Chen et al. [12,13,14,15] and Feng et al. [16] further proposed the concept of entransy (thermal potential) on the basis of thermoelectric analogy, and they revealed the constitutive relationship of the basic elements in a thermal system from the perspective of thermal transport driving force and resistance. Martinez-Mares et al. [17] applied circuit analogy to the components of a natural gas network, and the corresponding transfer function was derived. In general, the analogy method can better describe similar physical phenomena with strong linearization, but it is unable to solve the problems such as nonlinearity and volume delay.
Throughout the three main energy networks of electricity, heat and gas in IES, the transport characteristics of thermal energy network are the most complex. The central heating network is the main form of thermal energy transport, especially for building heating and residential heating all over the world. For a long time, many scholars have studied the thermal transport characteristics of heating network based on analysis or numerical methods in order to obtain approximate results comparable to the circuit. Chen et al. [18,19] and Lan et al. [20] used the finite element method to discretize the partial differential equations into algebraic equations by considering the dynamic characteristics of the heat network or based on thermoelectric analogy or entropy analysis, and the corresponding field data are solved iteratively by combining the definite solution conditions. Chen et al. [21] proposed the unit characterization method to describe thermal flow. However, the analysis models established by the above two methods are very complex, which is not conducive to forming an algebraic matrix standardized network equation compared to circuit. Recently, Chen, Sun and Zhang et al. [21,22,23,24,25,26] have conducted in-depth research on the unification of heterogeneous multi energy networks of integrated energy systems from the perspective of the essence of energy expression, the generalization of circuit laws, or the deduction method from “field” to “path”. Based on the essence of energy, Zhang et al. [22], Wu et al. [23] and Chen et al. [24] defined the energy network formed by the interconnection of multiple energy transmission lines and established the basic theory and network equation of the energy network. Their idea is mainly based on the state postulate, the energy postulate and the energy axiom. Based on the generalized expression method of energy and the unified description of the general transfer process, the generalized transfer equation of the energy pipeline was derived, and the generalization of Kirchhoff’s law in the electric network was applied to the modeling of energy networks. The effectiveness of their work was verified by the calculation of the existing mature electric network and fluid network models. Further, the author extended the relevant theories to the modeling and analysis of time-varying networks and achieved good results. Chen et al. [25] proposed and established the generalized circuit analysis theory for multi energy system by referring to the ideas of “matrix” and “external port equivalence” in power system analysis, converting the complex internal information of heterogeneous energy network to equivalent boundary conditions. Yang et al. [26] applied the deduction method from “field” to “path” in circuit theory to gas path and thermal path and derived the energy path model and theory based on the differential equation describing the physical phenomenon. The verification example showed that the computational efficiency of their model had been improved significantly.
From the existing research, although the unified method and model for multiple energy sources have made great progress, the transport characteristics of heterogeneous energy sources are still mainly described by their relatively independent parameters. At present, no clear energy consistency scale has been proposed. To address this, a generalized entropy flow model was suggested in Part I. It can be applied to the quantity and quality analysis of thermal energy transportation of heating supply using water as working medium, and it is expected to be extended in application to other heat transfer fluids (HTF) and different branches in IES such as electric power and gas. In Part I, the equivalent distributed and lumped parameter models based on theoretical analysis were established to describe the features of heat loss and transmission delay during thermal transport; these have already been proved by numerical simulation and verification procedure. In this part, an innovative analytical method based on entropy flow was derived to evaluate the thermal power and loss in heating supply pipelines on the basis of the theoretical approach developed in Part I, which can assess the quantity and quality of thermal transport effectively. Comparative cases based on a 32-node network in Bali and a 41-node network in China were studied to further validate the practical application of the proposed models and methods.

2. Theoretical Approach of Entropy Analysis

2.1. Entropy Analysis and Distribution Parameter Model

The concept of entropy first comes from thermodynamics. In 1865, Clausius named a newly discovered state function entropy and defined it as [27]:
d S = d Q T R
where T is the thermodynamic temperature of the object or substance; dQ is the heat added to a substance in the entropy increase process or heat exchanged between objects; and the subscript “R” indicates that changes caused during the heating process are reversible. If the process is irreversible, “IR” represents the subscript instead, i.e.,:
d S > d Q T I R
Combining the above two formulas it is expressed as the famous Clausius inequality:
d S d Q T
Closely related to the concept of entropy is the essence of the second law of thermodynamics or explained by the principle of entropy generation as follows.
d S 1 = d Q T 1 d S 2 = d Q T 2 d S = d S 1 + d S 2 > 0
where S1 and S2 represent the changes of entropy for high temperature objects (T1) and low temperature objects (T2), respectively.
Based on the analysis above, the concept of entropy flow, entropy transport and distributed parameter model were introduced and deduced, as shown in Equations (5)–(7).
S ˙ = Φ T r
where,   S ˙ is the entropy flow in unit of W/K, Φ is the heat flow rate of heat exchange between the system and the external surrounding, and Tr is the temperature of the heat source.
S ˙ g = 1 T 2 T 1 T 2 S ˙ 1 T s = T 1 T 2 2 T 2 + T 2
where T s is the temperature of heat source and S ˙ g is the entropy flow rate.
C s d T i 1 d t = m ˙ c ln T i 1 ln T i T i 1 T e R s + m ˙ 3 8 f Δ l d 5 π ρ 3 T i 1 T i = T i 1 e 1 m ˙ c m ˙ 3 8 f Δ l d 5 π ρ 3 T i 1 T i 1 T e R s C s d T i 1 d t R s , l o s s = T i 1 T i S ˙ i 1 T i 1 T e R t T i 1
where C s is the specific entropy capacity to describe the relationship between temperature and specific entropy; c and ρ are the specific heat capacity and density of the working fluid, respectively; d and f are the diameter and friction coefficient of the pipe, respectively; m ˙   is the mass flow in units of kg/s; the subscript i and e represent the count of time and the ambient condition, respectively; R t   is the thermal resistance and the subscript t refers to time; R s , l o s s is the loss entropy resistance while Rs is the branch entropy resistance.

2.2. Improved Lumped Parameter Model

The equations of the distributed parameter model are very complicated and not convenient for numerical modeling and analysis especially for large-scale pipe network, although it is more accurate for calculation. From the PDE (partial differential equation) describing the flow of heating the working medium, an improved lumped parameter model which has the advantages of being a simple model and easy expansion, has been established based on entropy flow analysis in Part I. The Laplace integral transformation was used to eliminate the time term of the PDE equations, which simplifies the equation solving process and facilitates the following analysis. Finally, results of the model are given in the form of Equations (8) and (9) as follows:
T 2 t = T 1 t ρ A l m ˙ T e exp k l c m ˙ + T e
S ˙ 2 t = c m ˙ ln exp S ˙ 1 t ρ A m ˙ l c m ˙ 1 exp k l c m ˙ + 1
The equations above show the functional relationship between the variation of the outlet parameters   T 2 , S ˙ 2   and the inlet parameters   T 1 , S ˙ 1 , which essentially gives the approach to characterize the thermal transmission processes by temperature and generalized entropy flow. Where k is the heat loss coefficient; l and A are the length and the cross-sectional area of the pipe, respectively. Please refer to Part I for the specific calculation process and the meaning of other parameters.

3. Energy Quality Analysis of Heating Network

Traditional definitions of energy efficiency only take into account changes in the quantity of energy but ignore differences in the quality of energy [6]. For the transfer of thermal energy, the working medium with high temperature has a higher ability to perform work, that is, energy quality is higher. However, the quantitative relationship of available energy cannot be obtained directly by using temperature as a general scale or criterion. According to the first law of thermodynamics, the energy of the system is conserved during transmission. In addition, it can be seen from engineering practice that when working fluids have the same quantity of energy in different states, their application value in technology is not equal.
Under the ideal condition, the heat dissipation through the pipe wall to the outside environment is zero, that is, the pipe wall is adiabatic. Thus, the total heat carried by the working fluid is a constant value, but the entropy of the system increases continuously with the flow and mixing of the working fluid at different temperatures in the pipe network, consequently the energy quality decreases. In terms of the amount of energy in total, energy is a constant value because of energy conservation, the consumption of available energy cannot be evaluated. Therefore, this section mainly focuses on the relationship analysis between energy quantity and quality in the actual thermal transfer process.
A certain amount of energy E   includes two parts, available E av and unavailable   E nav :
E = E av + E nav
For the working medium with temperature T w and mass flux of m, when the ambient temperature is T e , the maximum available energy is:
E av = m c T w T e T e ln T w T e
Then the available thermal power at the heating network node is:
P av = m ˙ c T w T e T e S ˙
where the first term on the right of Equation (12) represents the total thermal power and the second term represents the technically unavailable thermal power.
For a pipe section considering heat exchange with the environmental surroundings, the temperature and entropy flow at the inlet are   T 1 and S ˙ 1 , and the temperature and entropy flow at the outlet are   T 2 and S ˙ 2 respectively. From the pipe inlet to the outlet node, the reduction of available power is calculated as:
P loss = P av 1 P av 2 = c m ˙ T 1 T 2 T e S ˙ 1 S ˙ 2
For the heating supply pipe system with steady output of thermal energy, each node in the pipe network can be regarded as a constant temperature heat source to some extent. Therefore, combined with the above derivation, the total thermal power at the node can be expressed as:
P T = m ˙ i c T w , i T e
Therefore, the available thermal power will be:
P av , T = m ˙ i c T w , i T e T e S ˙ i
The schematic diagram of heating supply network nodes distribution is described as in Figure 1, where thermal energy flows with working medium in a heating supply system. The thermal power at node 1 and node 2 can be easily obtained as:
P 1 = m ˙ 13 c T w , 1 T e P 2 = m ˙ 23 c T w , 2 T e
The working fluid flowing from node 1 and node 2 are mixed at node 3. The mixing process of two working fluids at different temperatures will lead to entropy increase and loss of available power.
According to the first and second laws of thermodynamics, the following relationships exist between the enthalpy of inlet and outlet:
m ˙ 13 m ˙ 13 + m ˙ 23 h 1 + ( 1 m ˙ 13 m ˙ 13 + m ˙ 23 ) h 2 = h 3
where h1 and h2 are the specific enthalpy of the working medium at node 1 and node 2, respectively, while h3 is the specific enthalpy of the working medium at node 3. H ˙ 1 , H ˙ 2 and H ˙ 3 are the enthalpy of the working medium at nodes 1, 2 and 3, respectively. Let the proportional coefficient satisfy the following relationship:
x = m ˙ 13 / m ˙ 13 + m ˙ 23
then Equation (17) will be simplified as:
x c T 1 + 1 x c T 2 = c T 3
The specific entropy of node 3 is calculated as:
s 3 = c ln T 3 273.15 = c ln x T 1 + 1 x T 2 273.15
The entropy increase of the mixing process will be:
Δ S ˙ = m ˙ 3 s 3 x m ˙ 3 s 1 1 x m ˙ 3 s 2
Considering the calculation of specific entropy:
s = c ln T 273.15
Equation (21) can be rewritten as:
Δ S ˙ = m ˙ 3 c ln x T 1 1 x T 2 x ln T 1 1 x ln T 2
The relationship between the mass flow at node 3 and at nodes 1 and 2 is:
m ˙ 3 = m ˙ 13 + m ˙ 23
According to the principle of entropy generation expressed in Equations (3) and (4), obviously,
m ˙ 3 s 3 m ˙ 13 s 1 + m ˙ 23 s 2
That is Δ S ˙ 0 . Therefore, the conservation of energy is satisfied at net nodes, but the entropy of heat flow among nodes is not conserved.
The loss of available energy at node 3 can be calculated by the Gouy–Stodla formula, i.e., the loss of available power can be determined by entropy increase and ambient temperature.
P loss = T e Δ S ˙
Then, the entropy flow flowing into node 4 is:
S ˙ 4 = m ˙ 34 m ˙ 3 c ln x T 1 + 1 x T 2 273.15
Similarly, the entropy flow flowing into node 5 can be calculated as:
S ˙ 5 = m ˙ 35 m ˙ 3 c ln x T 1 + 1 x T 2 273.15
Based on the entropy flow analysis, this section describes the calculation method of available heat power and its loss when heat energy passes through the mixed nodes of pipeline and network. The available thermal power of the working medium decreases gradually along the flow direction due to the heat exchange from the pipe wall to the environment, and the thermal power loss can be calculated by Equation (13). The thermal fluids from different branches and different states are mixed at the node, and the mixing process of the thermal fluids at the node of the network is a typical entropy increasing process. Equations (23) and (28) indicate the calculation method of the node entropy increase and the entropy flow into the node. It can be seen that entropy flow can be used to calculate the available thermal power during transmission processes and evaluate the quality of thermal energy transmission.

4. Case Study and Discussion

4.1. Case I: Bali 32-Node Heat Grid

4.1.1. Case Description

This case is a 32-node heating grid model in Bali [28]. The structure of heating supply is shown in Figure 2. The 32-node heating network is a low temperature circular central heating network supplied by three co-generation units. Heat flows from heat source two along the main flow path N1–N2–N5–N11–N13–N14–N19–N22–N25–N28–N31–N7–N5. Among them, N5, N11 and N22 are mixed nodes, where multiple thermal streams converge and then flow into each load node.

4.1.2. Case Calculation Results

The lumped parameter model with temperature–entropy flow as intensity and extensive properties is used to establish a 32-node heat supply network, and the energy loss and the variation of energy quality in the thermal energy transport of the heat supply network node are analyzed. The inlet temperature of heat source one and heat source three is 343.15 K (70 °C), the water supply temperature of heat source two is 363.15 K (90 °C), and the ambient temperature is taken as 278.15 K (5 °C). The relevant geometric dimensions, system parameters and the calculation results of outlet temperature and entropy flow of each branch pipe are listed in Table 1.

4.1.3. Entropy Analysis and Discussion

Figure 3 shows the relationship between temperature and entropy flow at various nodes along the main flow path. From node N1 to N25, the temperature decreases in steps. This is because the water supply temperature of heat source two is higher than that of heat source one and heat source three. At node N5 the working fluid flows into the branch pipeline P6, and at node N11 the working fluid flows into the branch pipeline P32, so that the temperature of the main pipeline decreases in steps. Between node N11 and N22, because there is no hot working medium with different temperatures entering, while only the branch is diverted, and the temperature of the working medium changes steadily. It can be considered that the temperature drop at this time is caused by heat dissipation. Identically, the temperature drop at node N19 to N25 is also caused by the confluence of working medium.
It can be intuitively seen that the entropy flow change of each node is different from the temperature, which is related to the energy quality and consistent with the change trend of the available power as shown in Figure 4. This reflects the flow information of the pipe network node and the change of the energy quality. It is more accurate to take entropy as a scale to describe the thermal transfer process. Figure 4 shows the available thermal power of each node on the main pipeline of the heating network calculated under the entropy scale. As the heat dissipates into the environment, the available thermal power decreases and the energy quality declines gradually. Comparing the change curve of the supply water temperature in Figure 3 with the change curve of the available power in Figure 4, the temperature is different from the change of the available thermal power, so it is not completely accurate to scale the energy quality by temperature. From node N1 to N25, the working fluid temperature decreases gradually due to the thermal transfer loss and mixing, and the change of available heat power decreases as a whole, but the dynamic characteristics slightly varies at different ranges. Among them, the available power of node N5 to N11 has a significant increase, which is due to the influx of hot working fluid from heat source three, the increase of working fluid flow and total thermal power. From node N22 to N31, it is in the upstream direction, so the thermal power shows an upward trend, and then from node N31 to N7, it is in the downstream direction, and the available power decreases. To sum up, the calculation of available thermal power based on entropy scale not only considers the working medium temperature, but also needs to consider the mass flow and ambient temperature, which can more accurately quantify the change of thermal energy. Through the calculation of entropy flow, the change of energy quality of each node in the heating network can be seen intuitively in a quantitative way, and the operation of the heating network can be controlled accurately, which is beneficial to the optimization of heating supply network.
Nodes N5, N11 and N22 are mixed nodes in the heating network, and two hot working fluids from different heat sources converge at these nodes. Table 2 lists the relevant thermodynamic parameters of these three nodes, including the entropy flow, available power and heat, etc. before and after the fluid confluence. The parameter before confluence is the algebraic sum of the data at the outlet of the confluence branch, where the heat of the working medium is calculated according to Equation (14). It can be seen that the node entropy flow is increased compared with the algebraic sum of each branch entropy flow, which reflects the entropy increase phenomenon in the mixing process. At the same time, the available thermal power of the node is reduced compared with the algebraic sum of the available thermal power of the working medium of each branch, which verifies that the irreversible entropy generation at the node leads to the loss of available thermal power. It can also be seen intuitively from the table that the heat (power) before and after the confluence is the same, so the heat calculated by the temperature cannot reflect the change of energy quality. In summary, the energy before and after the confluence is conserved, the entropy is not conserved, and the change of thermal parameters meets the energy quality theory of the heating network in this paper.

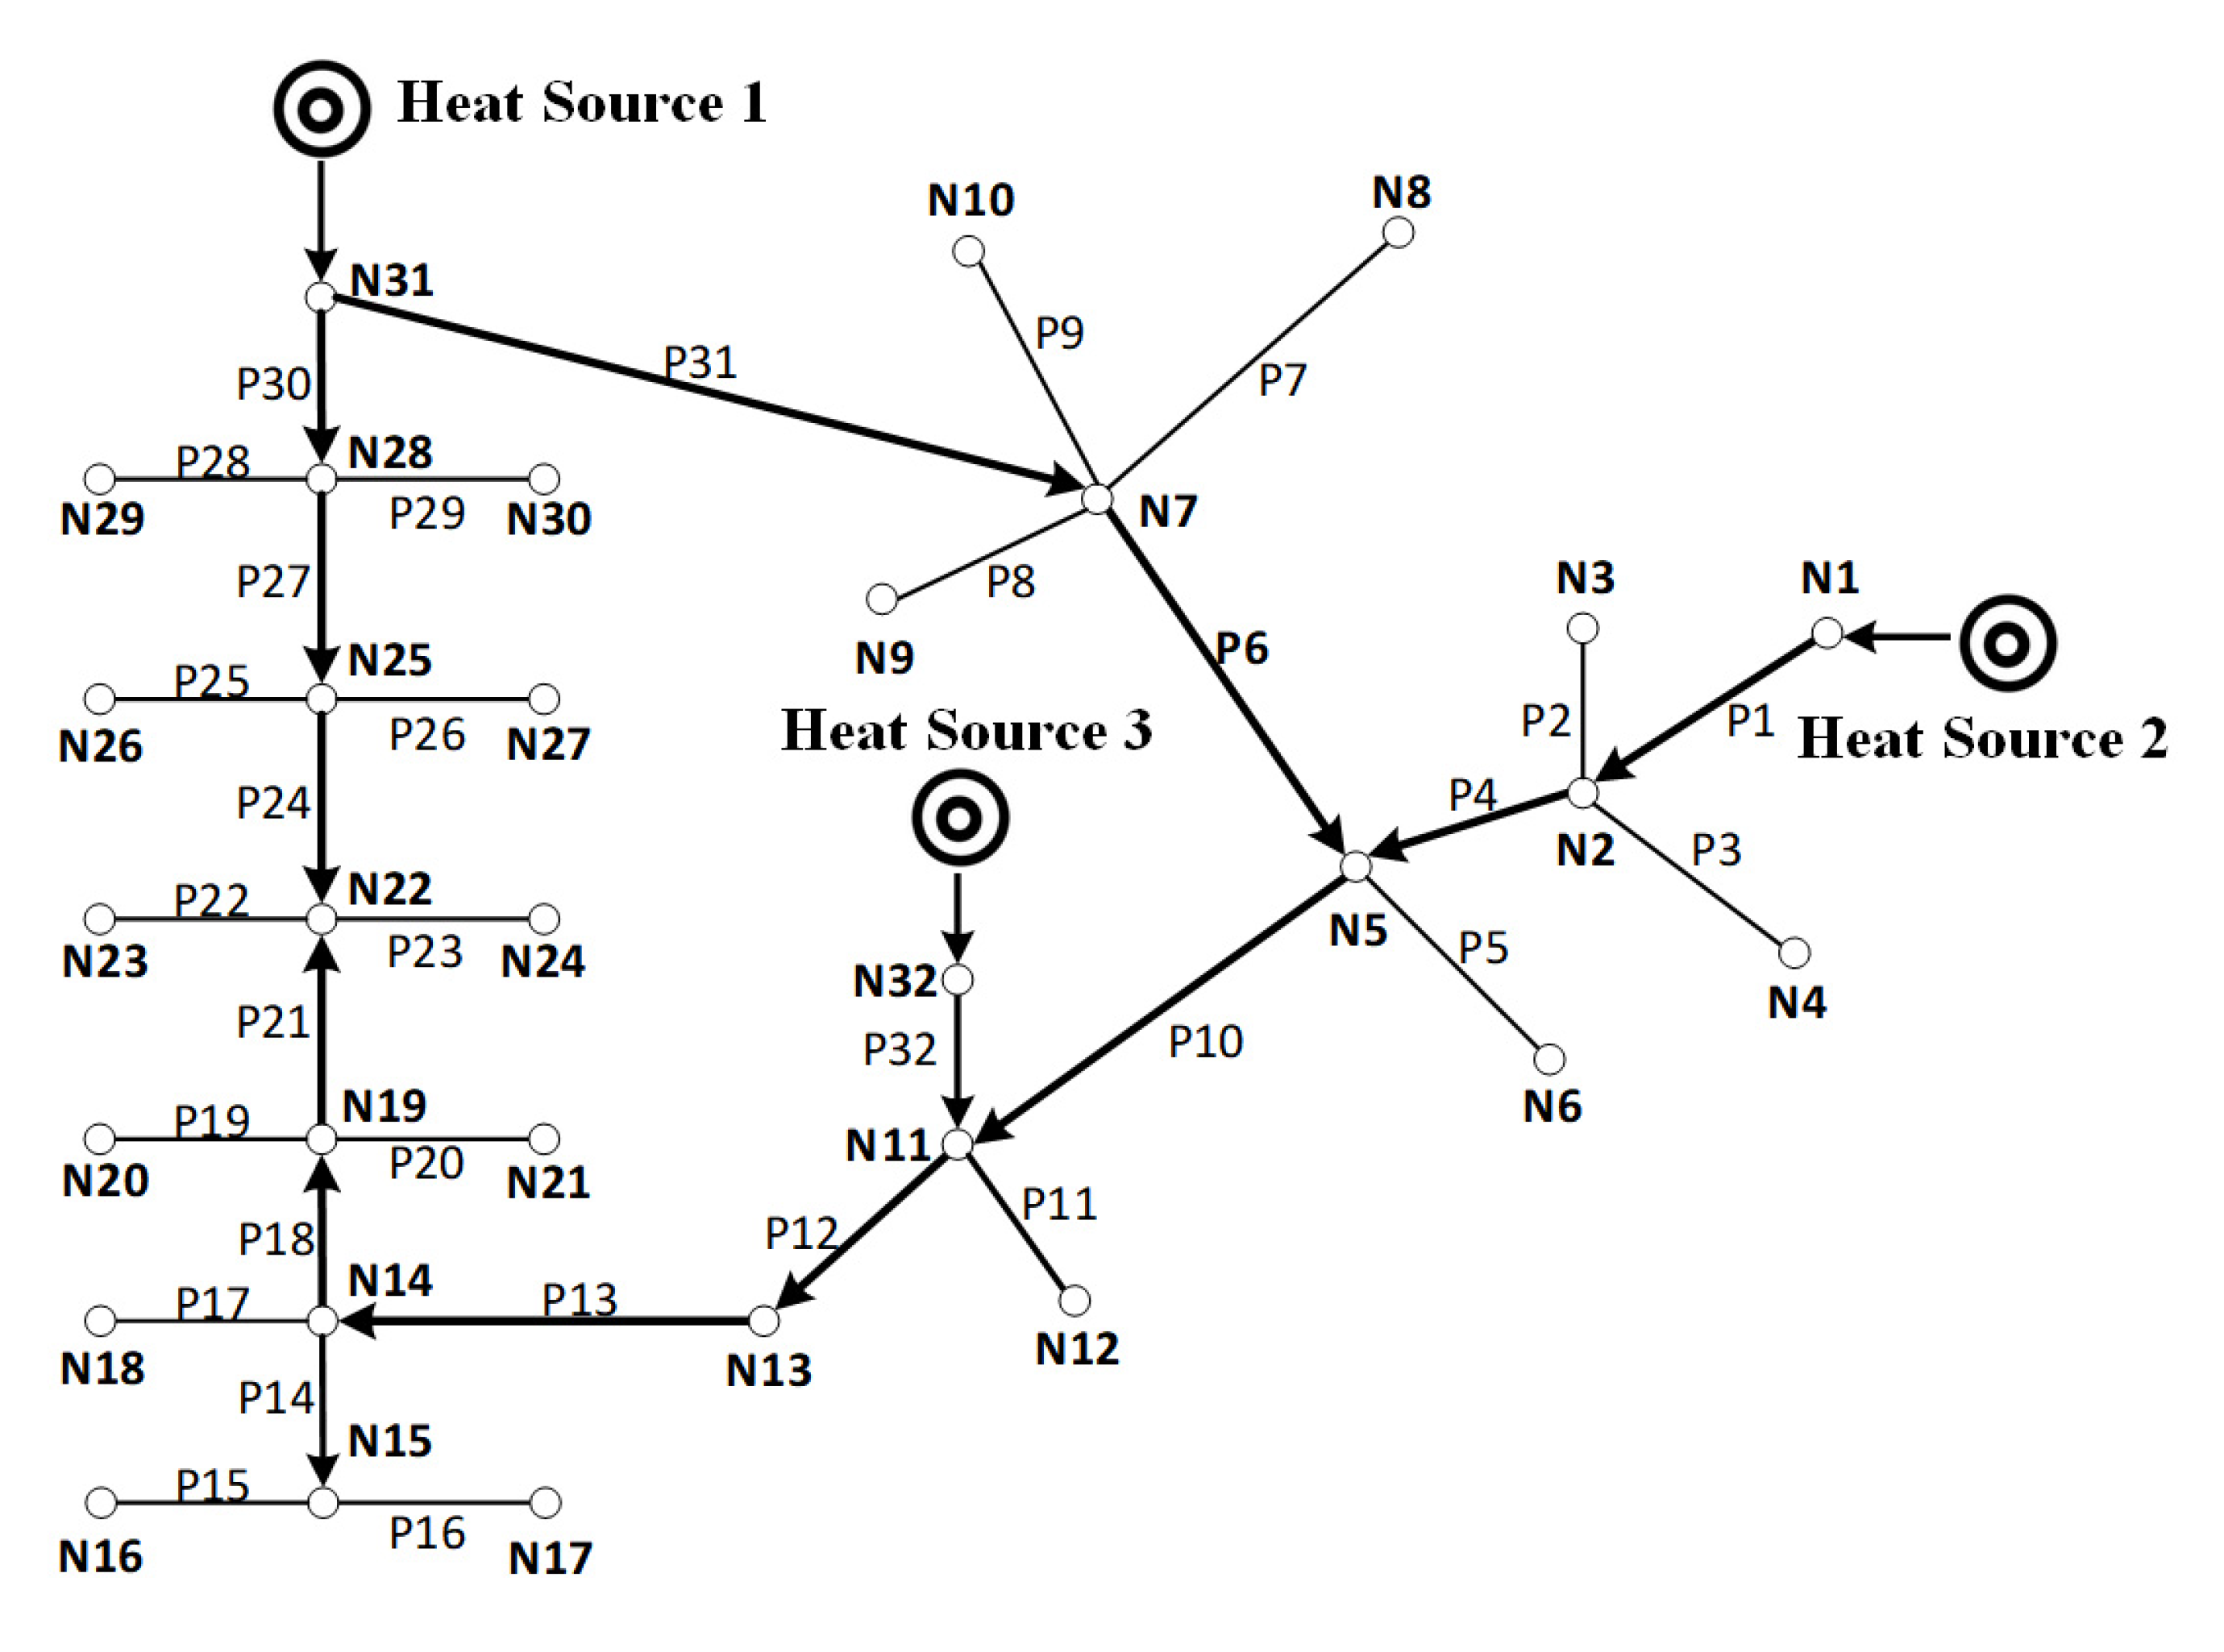
4.2. Case II: China 41-Node Heat Network

4.2.1. Case Description

For comparison, a 41-node heating network model in a region of northeast China was studied. This is a relatively large-scale heat supply system. The structure of the model in this case is shown in Figure 5 [29].
The 41-node heat supply network is also a low-temperature annular central heating network supplied by three co-generation units like the 32-node heat grid in Bali. The heat flow starts from heat source one and flows along the main process route: N1–N2–N3–N6–N8–N10–N12–N15–N16–N18–N20–N23–N25–N26–N30–N40–N39–N37–N36–N34–N12. The nodes of N15, N18, N30 and N36 are mixed nodes, where multiple thermal mass flows converge and then flow into each load node.

4.2.2. Case Calculation Results

The 41-node heating supply network model is established by using the pipeline lumped parameter model proposed in Part I, with temperature and entropy flow as the intensity and extension properties. The energy loss and variation of energy quality in the transmission process of heating supply network nodes are analyzed. The inlet temperatures of heat source one and heat source three are both 343.15 k (70 °C), the temperature of heat source two is 363.15 k (90 °C), and the ambient temperature is also taken as 278.15 k (5 °C). The pipe parameters and calculation results of each branch in this case have been listed in Table 3 for reference.

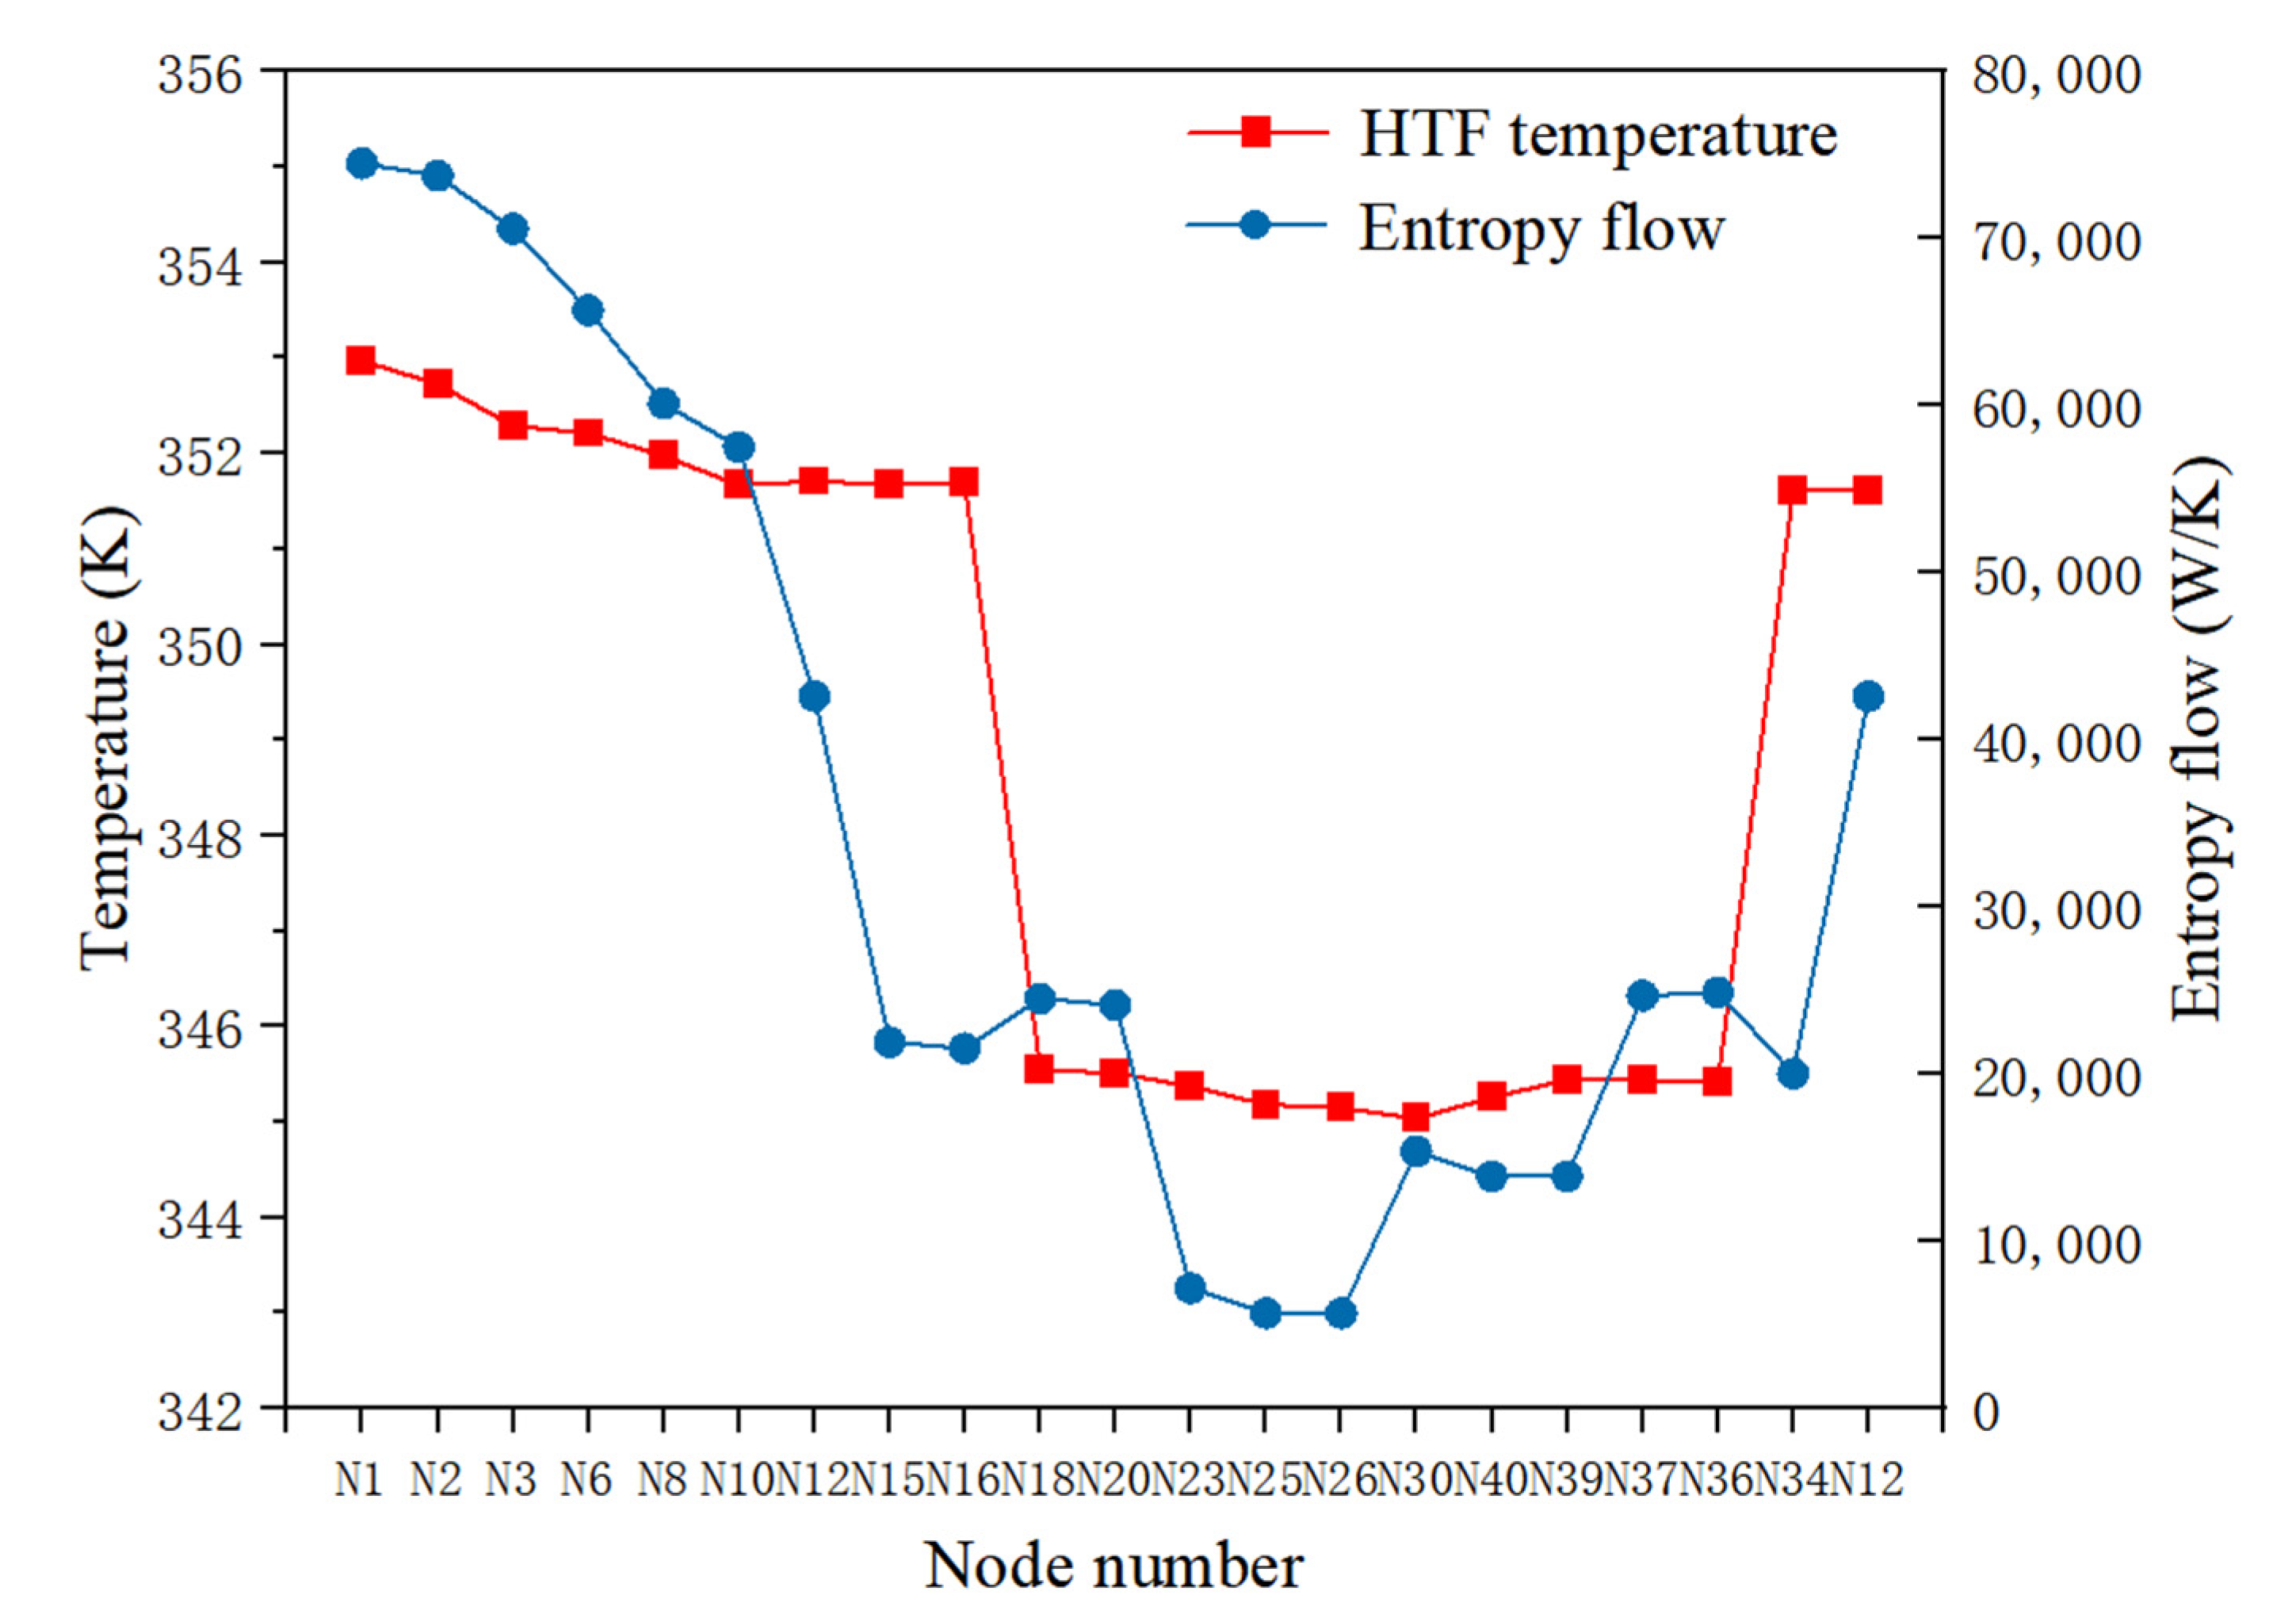
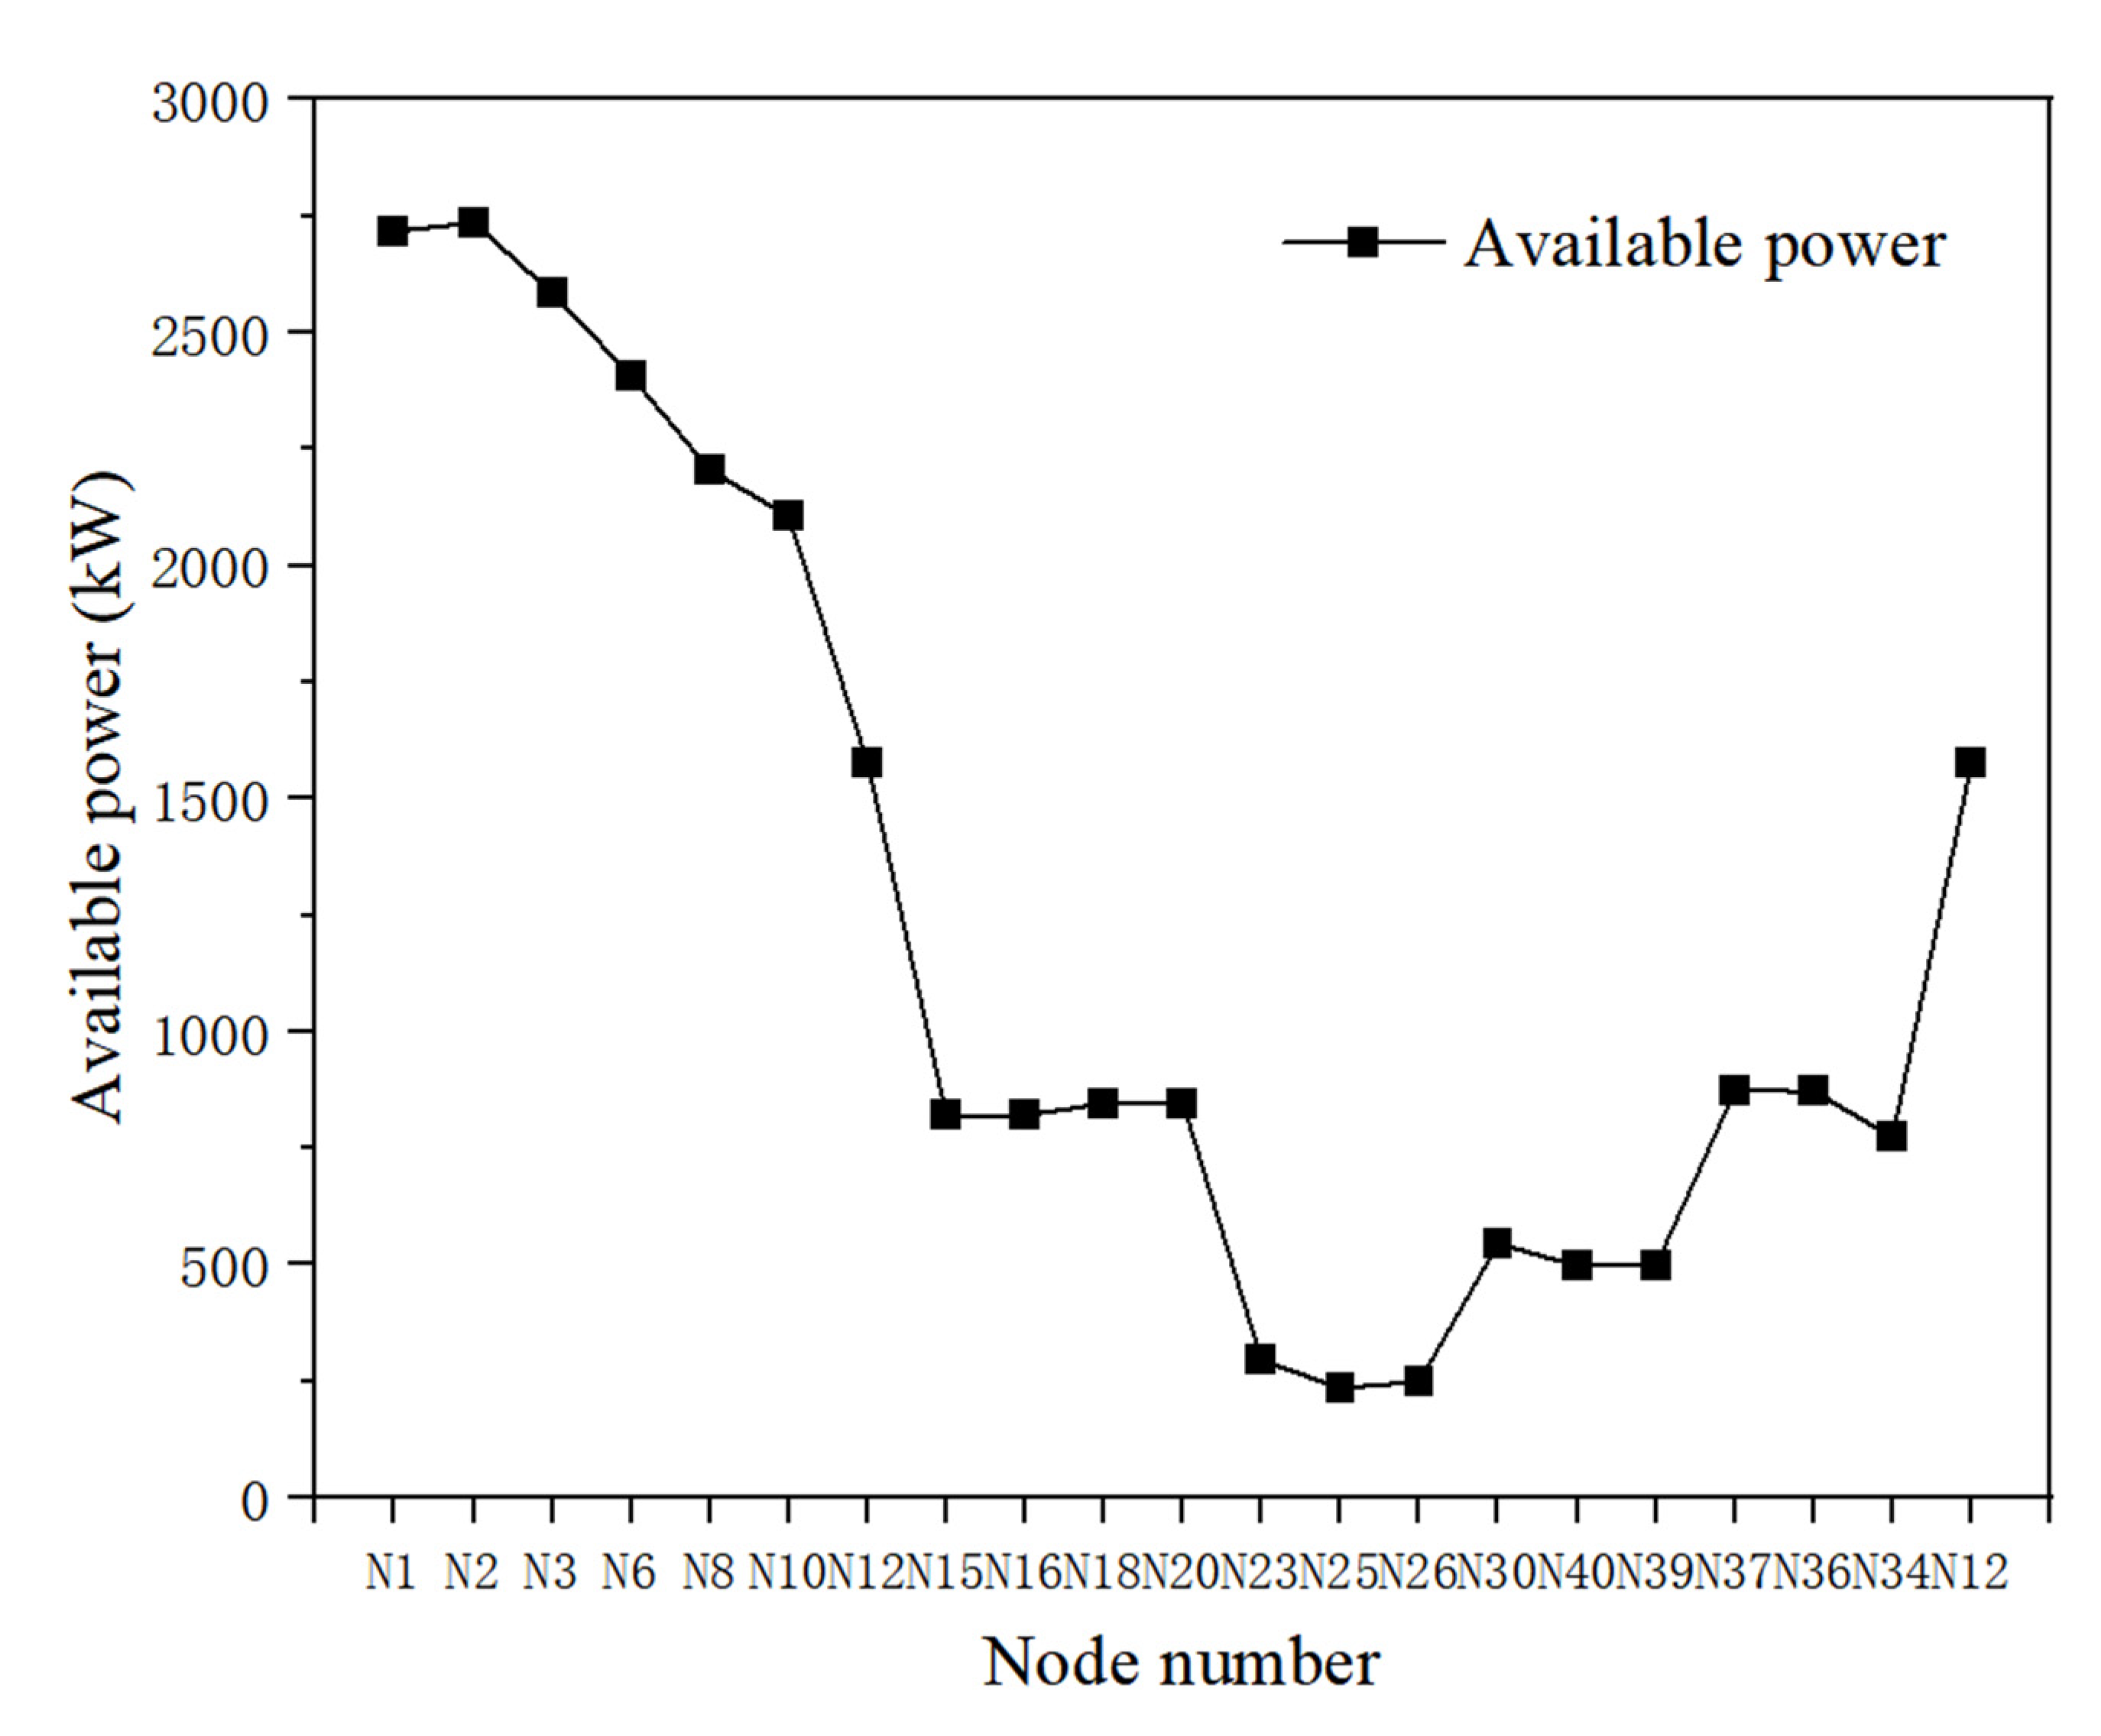
4.2.3. Entropy Analysis

The variation trend of temperature and entropy flow at each node on the main flow path is shown in Figure 6. First, the temperature from node N1 to N16 gradually decreases, which is caused by the heat transfer loss along the pipe wall. Then, the temperature from node N16 to N18 drops rapidly because the low-temperature heat flow of heat source two flows into the main path. Thus, the temperature after the confluence decreases in a step manner in the figure. Between node N18 and N26, since there is no thermal medium with large temperature difference flowing in, the temperature of the working medium is stable. The temperature drop at this time is mainly caused by heat dissipation. The gradual increase in the temperature of node N30 to N36 is due to the countercurrent direction of the working medium flow. In addition, the rapid temperature rise from node N36 to N34 is also caused by the fluid confluence.
Similar to the results in Case I, the trend for entropy flow change of each node is different from temperature change, but consistent with the change trend of the available power in Figure 7, which shows the available thermal power of each node on the main pipeline of the heating network calculated by the entropy analysis. That is to say, the entropy flow is related to the energy quality, and it is more accurate to use the entropy flow to scale the heat transfer process. As the heat dissipates into the environment, the available thermal power decreases and the energy quality declines gradually. The change curve of the supply water temperature and available power are obviously different from each other. This fully shows that entropy flow can better describe energy quality than temperature. From node N1 to N26, the temperature of the working medium decreases gradually due to the transmission heat loss and mixing, with a slight dynamic change of available thermal power. The inflow of heat source two causes the increase of the available power from nodes N26 to N30, and the total thermal power increases with the increase of working medium flow. In the process of thermal transmission, the available power of some nodes such as N40, N39 and N34 decrease, which indicates that the available power is a function of multiple factors such as mass flow and temperature.
Nodes N15, N18, N30 and N36 are mixed nodes in the heating network, and two branch thermal masses from different heat sources converge at these nodes. Table 4 lists the related thermodynamic parameters of these four nodes, including the entropy flow, available power and heat before and after the node confluence. The heat of the working medium is calculated according to Equation (14). It can be seen that the node entropy flow is increased compared with the algebraic sum of each branch entropy flow, which implies there is an entropy increase in the mixing process. While the available thermal power of the node is reduced compared with the algebraic sum of each branch, which reflects that the irreversible entropy generation at the node leads to the loss of available thermal power. From Table 4, it is clear to see that the heat before and after the confluence is conserved, but the entropy is increased, simultaneously accompanied by the decline of available thermal power. This suggests that entropy flow is more suitable for evaluating energy quality than temperature property.

5. Conclusions

For the purpose of evaluating the thermal energy quality in the process of thermal transmission of heating supply and verifying the theoretical approach proposed in Part I, an innovative analytical method based on entropy flow was derived, and comparative cases were studied to prove the effectiveness of lumped parameter model from the perspective of application in this part. The conclusions are as follows:
(1)
An innovative analytical method based on entropy flow was derived on the basis of theory developed in Part I, which can effectively assess the quantity and quality of thermal transport. It is used to study the cases combined with the lumped parameter model, and the achieved evaluation results for thermal parameters and processes are in good agreement with the energy quality theory of the heating network in both cases adopted in this paper.
(2)
In both cases, it can be intuitively seen that the entropy flow change of each node is different from the temperature, which is related to the energy quality and consistent with the change trend of the available power. This reflects the flow information of the pipe network node and the change of the energy quality. As the heat dissipates into the environment, the available thermal power decreases and the energy quality declines gradually. Although Case II based on China 41-node heating network is a relatively larger scale heating supply system than Case I based on Bali 32-node heating grid, the consistent results for both show the effectiveness of the proposed calculation method in this part.
(3)
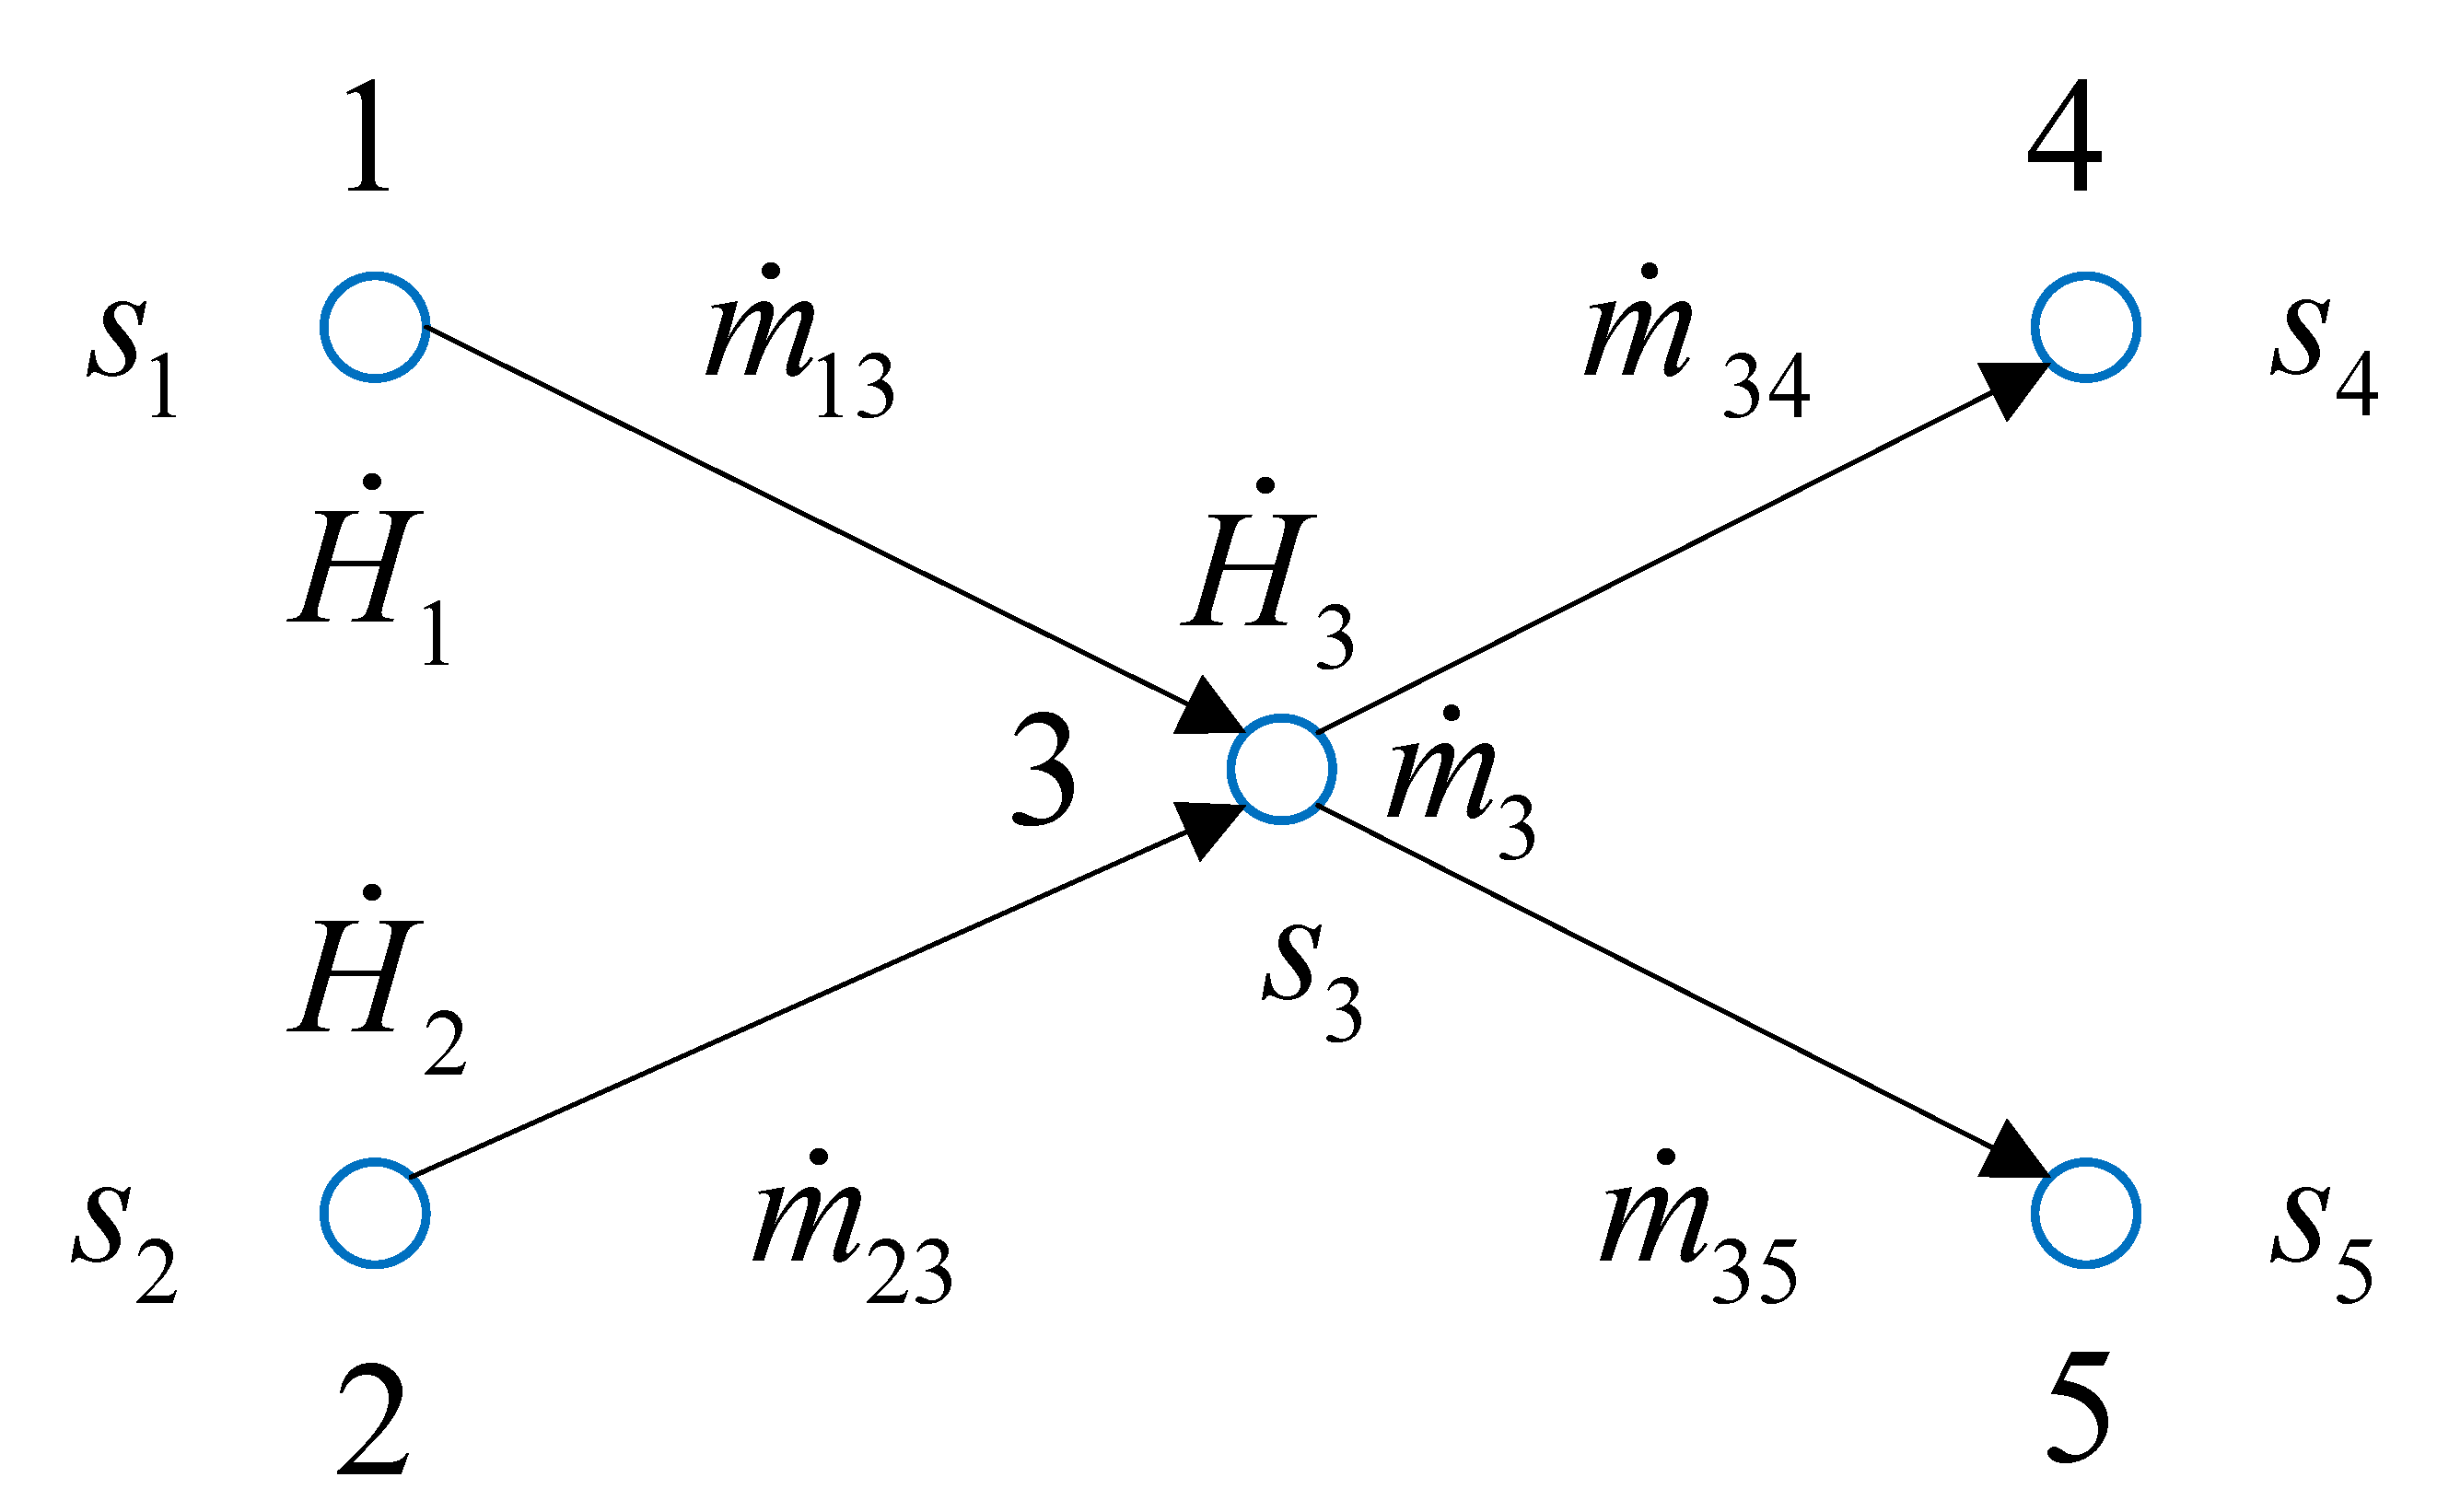
The comparative case study shows that the variation trend of entropy flow at each node is consistent with the variation of available power but is independent of temperature. Compared with the algebraic sum of the branch entropy flow, the node entropy flow increases, which reflects the entropy generation phenomenon in the mixing process. The change in available power is the opposite. This means that irreversible entropy generation at nodes leads to a loss of available thermal power. Therefore, it is more accurate to describe the dynamic heat conduction process on the entropy scale.

Author Contributions

Conceptualization, C.C., J.W. and C.L.; methodology, C.C. and J.W.; validation, J.W.; formal analysis, J.W. and C.L.; investigation, C.C., J.W. and Z.Y.; resources, J.H.; data curation, J.C. and J.W.; writing—original draft preparation, C.C.; writing—review and editing, Z.Y., J.C. and J.H.; visualization, H.Z.; supervision, J.H.; project administration, H.Z.; funding acquisition, H.Z. All authors have read and agreed to the published version of the manuscript.

Funding

This research was funded by National Key R&D Program of China, grant number 2018YFA0702200 and the National Natural Science Foundation of China, grant number 51706124.

Conflicts of Interest

The authors declare no conflict of interest.

References

  1. Duquette, J.; Rowe, A.; Wild, P. Thermal performance of a steady state physical pipe model for simulating district heating grids with variable flow. Appl. Energy 2016, 178, 383–393. [Google Scholar] [CrossRef]
  2. Wu, J.Z.; Yan, J.Y.; Jia, H.J.; Hatziargyriou, N.; Djilali, N.; Sun, H.B. Integrated Energy Systems. Appl. Energy 2016, 167, 155–157. [Google Scholar] [CrossRef]
  3. Bagherian, M.A.; Mehranzamir, K. A comprehensive review on renewable energy integration for combined heat and power production. Energy Convers. Manag. 2020, 224, 113454. [Google Scholar] [CrossRef]
  4. Leontaris, G.K.; Tracas, N.D. Unified models at intermediate energy scales and Kaluza-Klein excitations. Phys. Lett. B 1999, 470, 84–89. [Google Scholar] [CrossRef]
  5. Li, J.Y.; Li, D.X.; Zheng, Y.F.; Yao, Y.P.; Tang, Y.S. Unified modeling of regionally integrated energy system and application to optimization. Int. J. Elec. Power 2022, 134, 107377. [Google Scholar] [CrossRef]
  6. Weedy, B.M. The Analogy between Thermal and Electrical Quantities. Electr. Pow. Syst. Res. 1988, 15, 197–201. [Google Scholar] [CrossRef]
  7. Capizzi, G.; Lo Sciuto, G.; Cammarata, G.; Cammarata, M. Thermal transients simulations of a building by a dynamic model based on thermal-electrical analogy: Evaluation and implementation issue. Appl. Energy 2017, 199, 323–334. [Google Scholar] [CrossRef]
  8. Hao, L.; Xu, F.; Chen, Q.; Wei, M.S.; Chen, L.; Min, Y. A thermal-electrical analogy transient model of district heating pipelines for integrated analysis of thermal and power systems. Appl. Therm. Eng. 2018, 139, 213–221. [Google Scholar] [CrossRef]
  9. Palsson, H.; Larsen, H.V.; Ravn, H.F.; Bohm, B.; Zhou, J. Equivalent Models of District Heating Systems. 1999. Available online: https://www.researchgate.net/publication/256732635 (accessed on 1 July 2022).
  10. Sun, Q.Y.; Dong, Q.Y.; You, S.; Li, Z.B.; Wang, R. A unified energy flow analysis considering initial guesses in complex multi-energy carrier systems. Energy 2020, 213, 118812. [Google Scholar] [CrossRef]
  11. Tian, H.; Zhao, H.R.; Liu, C.Y.; Chen, J.; Wu, Q.W.; Terzija, V. A dual-driven linear modeling approach for multiple energy flow calculation in electricity-heat system. Appl. Energy 2022, 314, 118872. [Google Scholar] [CrossRef]
  12. Chen, Q.; Guo, Z.Y. Entransy Theory and Its Application to Heat Transfer Analyses in Porous Media. Int. J. Nonlinear Sci. Num. 2010, 11, 11–22. [Google Scholar] [CrossRef]
  13. Chen, Q. Entransy dissipation-based thermal resistance method for heat exchanger performance design and optimization. Int. J. Heat Mass Transf. 2013, 60, 156–162. [Google Scholar] [CrossRef]
  14. Chen, Q.; Liang, X.G.; Guo, Z.Y. Entransy theory for the optimization of heat transfer—A review and update. Int. J. Heat Mass Transf. 2013, 63, 65–81. [Google Scholar] [CrossRef]
  15. Chen, Q.; Guo, Z.Y.; Liang, X.G. Closure to “Discussion of ‘Entransy is Now Clear”. J. Heat Transf. 2014, 136, 095502. [Google Scholar] [CrossRef]
  16. Feng, H.J.; Chen, L.G.; Xie, Z.H.; Sun, F.R. Constructal entransy dissipation rate minimization of a rectangular body with nonuniform heat generation. Sci. China Technol. Sci. 2016, 59, 1352–1359. [Google Scholar] [CrossRef]
  17. Martinez-Mares, A.; Fuerte-Esquivel, C.R. A Unified Gas and Power Flow Analysis in Natural Gas and Electricity Coupled Networks. IEEE Trans. Power Syst. 2012, 27, 2156–2166. [Google Scholar] [CrossRef]
  18. Chen, L.G.; Xiao, Q.H.; Feng, H.J. Constructal Optimizations for Heat and Mass Transfers Based on the Entransy Dissipation Extremum Principle, Performed at the Naval University of Engineering; a Review. Entropy 2018, 20, 74. [Google Scholar] [CrossRef]
  19. Chen, Q.; Fu, R.H.; Xu, Y.C. Electrical circuit analogy for heat transfer analysis and optimization in heat exchanger networks. Appl. Energy 2015, 139, 81–92. [Google Scholar] [CrossRef]
  20. Lan, T.; Strunz, K. Modeling of the Enthalpy Transfer Using Electric Circuit Equivalents: Theory and Application to Transients of Multi-Carrier Energy Systems. IEEE Trans. Energy Convers. 2019, 34, 1720–1730. [Google Scholar] [CrossRef]
  21. Chen, B.B.; Sun, H.B.; Yin, G.X.; Wu, W.C.; Guo, Q.L.; Chen, Y.W.; Pan, Z.G.; Wang, B. Energy circuit theory of integrated energy system analysis (II): Hydraulic circuit and thermal circuit. Proc. CSEE 2020, 40, 2133–2142, 2393. (In Chinese) [Google Scholar]
  22. Zhang, W.Y.; Chui, S.T. A generalized equivalent circuit theory for the electric and magnetic resonances of metallic wire networks. J. Appl. Phys. 2009, 105, 113121. [Google Scholar] [CrossRef]
  23. Wu, G.F.; Huang, F.Q.S.; Gu, Z.T. A more in-depth understanding of entropy by drawing analogy between thermodynamics and electricity. J. Univ. Shanghai Sci. Technol. 2019, 41, 307–312. [Google Scholar]
  24. Chen, H.Y.; Wen, J.Z.; Wang, Z.Y.; Yang, X. Transfer laws and equations of energy networks. J. Xi’an Jiaotong Univ. 2014, 48, 66–76. [Google Scholar]
  25. Chen, H.Y.; Ming, L.I.; Qiu, M.; Hailin, G.E.; Huang, L. Modeling and analysis of time-varying energy network. Sci. Sin. Technol. 2019, 49, 243–254. [Google Scholar] [CrossRef]
  26. Yang, J.W.; Zhang, N.; Kang, C.Q. Analysis Theory of Generalized Electric Circuit for Multi-energy Networks-Part One Branch Model. Autom. Electr. Power Syst. 2020, 44, 21–32. [Google Scholar]
  27. Bejan, A. The equivalence of maximum power and minimum entropy generation rate in the optimization of power plants. ASME J. Energy Resour. Technol. 1996, 118, 98–101. [Google Scholar] [CrossRef]
  28. British Standards Institution. District Heating and District Cooling Pipe Systems; Terms and definitions, 1 online resource (26 pages); British Standards Institution: London, UK, 2019. [Google Scholar]
  29. Yang, J.W.; Zhang, N.; Botterud, A.; Kang, C.Q. On An Equivalent Representation of the Dynamics in District Heating Networks for Combined Electricity-Heat Operation. IEEE Trans. Power Syst. 2020, 35, 560–570. [Google Scholar] [CrossRef]
Figure 1. Schematic diagram of heating supply network node distribution.
Processes 10 01719 g001
Figure 2. Bali 32-node heat grid model.
Processes 10 01719 g002
Figure 3. Water supply temperature and entropy flow of typical nodes in Case I.
Processes 10 01719 g003
Figure 4. Available thermal power of typical nodes in Case I.
Processes 10 01719 g004
Figure 5. China 41-node heating grid model.
Processes 10 01719 g005
Figure 6. Water supply temperature and entropy flow of typical nodes in Case II.
Processes 10 01719 g006
Figure 7. Available thermal power of typical nodes in Case II.
Processes 10 01719 g007
Table 1. Pipe parameters and calculation results of each branch in Case I.
Pipe NumberMass Flow/
(kg/s)
Pipe Length/
(m)
Pipe Diameter/
(mm)
Heat Loss
Coefficient/
(W/m K)
Outlet
Temperature/
(K)
Outlet Entropy Flow/
(W/K)
P14.79362.844640.960.321352.624639.92
P20.45362.04432.620.210351.81431.58
P30.61362.53585.750.210352.25584.70
P43.74362.753612.190.327352.513611.15
P50.74357.65672.360.189347.47671.34
P60.88342.02633.060.236331.82632.02
P71.30342.47944.770.210332.26943.73
P80.65342.41472.680.210332.23471.63
P90.66341.82475.750.210331.49474.72
P103.87358.573557.630.327348.423556.58
P111.64352.521391.820.210342.261390.77
P124.48352.573792.690.327342.393791.64
P134.48352.443785.780.278342.113784.73
P141.60352.351351.910.219342.031350.87
P150.80351.93671.000.189341.60669.95
P160.80351.86672.210.189341.71671.17
P170.54351.71448.710.189341.54447.66
P182.34352.361976.530.278342.201975.49
P190.54351.64449.100.189341.48448.07
P200.54351.64449.170.189341.40448.13
P211.27352.241067.200.236342.021066.16
P220.71350.48583.910.189340.30582.88
P230.71350.59583.140.189340.25582.10
P240.15341.89109.570.236331.57108.54
P250.65342.41472.660.189332.20471.62
P260.65342.46472.390.189332.23471.35
P271.46342.931064.370.210332.611063.33
P280.65342.68471.300.189332.43470.25
P290.65342.64471.440.189332.34470.40
P302.75343.042015.220.321332.822014.17
P313.50342.842552.640.321332.602551.61
P322.25342.771636.940.321332.551635.91
Table 2. Related thermodynamic parameters of typical heating network nodes Case I.
Pipe Network NodeNode Branch Before Confluence (Branch) After Confluence (Node)
Branch Total Entropy Flow
(W/K)
Total Available Power of Branch
(W)
Total Branch Heat
(W)
Node Entropy Flow
(W/K)
Node Available Power
(W)
Node Heat
(W)
N5P4, P6 4239.25139,130.781,299,398.82 4204.36137,323.621,299,398.82
N11P32, P10 5193.57153,131.471,560,946.33 5201.60155,241.581,560,946.33
N22P21, P24 1138.7728,926.54315,013.16 1139.0228,416.96315,013.16
Table 3. Pipe parameters and calculation results of each branch in Case II.
Pipe NumberMass Flow/
(kg/s)
Pipe Length/
(m)
Pipe Diameter/
(mm)
Heat Loss
Coefficient/
(W/m K)
Outlet
Temperature/
(K)
Outlet Entropy Flow/
(W/K)
P176.265328.0012000.20887352.6873,903.07
P23.375650.005000.20898346.673124.86
P372.907664.0011000.20878352.1670,314.53
P43.201461.004000.20888350.223115.92
P51.401099.007000.20884349.331396.46
P668.312588.0011000.20879352.0465,786.65
P75.822357.0011000.20883350.655595.91
P862.491793.0011000.20880351.9260,115.09
P92.64405.003500.20881351.412623.74
P1059.844514.7611000.20880351.7157,383.01
P1115.40532.002500.20889351.5814,822.13
P1244.44967.006000.20881351.6442,599.03
P130.7885.006000.21014351.16845.09
P141.5697.006000.21016351.401588.42
P1521.0836.006000.21025351.6420,262.31
P1622.70244.106000.21014351.6621,814.40
P174.07144.003000.21015351.413990.23
P1818.63781.506000.21015351.3817,887.94
P198.93175.0010000.21011332.766641.28
P2027.55388.009000.21010345.3424,447.43
P2115.8892.003500.21011345.4114,126.30
P223.69115.003500.21011345.273357.47
P237.99228.4510000.21010345.237150.14
P241.38204.002500.21011344.821307.08
P256.61419.2010000.21010345.145919.76
P266.61109.0012000.21010345.015915.23
P270.78225.142500.21012344.05781.91
P280.79145.002000.21011344.32791.48
P293.07813.202000.21025344.172773.02
P301.96334.0012000.21010344.431812.31
P3117.66816.8012000.2101344.9315,614.83
P3214.37491.005000.21011344.8412,705.33
P333.29415.5011000.21009354.742872.43
P3421.0051.006000.21014361.8920,093.27
P351.6452.00900.21014361.771563.35
P3619.361445.389000.21013361.6118,466.90
P378.911486.5310000.21012342.696490.05
P3828.2894.006000.21012355.6424,989.97
P3912.57250.005000.21012355.5711,101.94
P4015.70329.005000.21012355.5713,864.95
P4115.7090.005000.21012355.5513,861.37
P4215.70694.505000.21014355.4013,833.73
Table 4. Related thermodynamic parameters of typical heating network nodes Case II.
Pipe Network NodeNode Branch Before Confluence (Branch) After Confluence (Node)
Branch Total Entropy Flow
(W/K)
Total Available Power of Branch
(kW)
Total Branch Heat
(kW)
Node Entropy Flow
(W/K)
Node Available Power
(kW)
Node Heat
(kW)
N15P15, P35 20,714.62825.457515.36 21,901.92819.057515.36
N18P18, P19 24,237.23854.588716.71 24,513.13845.568716.71
N30P30, P42 15,376.39551.035483.22 15,376.36543.695483.22
N36P36, P37 24,876.91876.538115.87 24,886.45871.828115.87
Publisher’s Note: MDPI stays neutral with regard to jurisdictional claims in published maps and institutional affiliations.

