Article

Experimental Analysis of Wind Pressure Characteristics in a Reduced-Scale Model of a Slab-Shaped High-Rise Building at Different Inflow Conditions with Various Wind Flow Directions

1
Fujian Provincial Key Laboratory of Wind Disaster and Wind Engineering, Xiamen University of Technology, Xiamen 361024, China
2
School of Environmental Science and Engineering, Xiamen University of Technology, Xiamen 361024, China
*
Author to whom correspondence should be addressed.
Processes 2022, 10(8), 1645; https://doi.org/10.3390/pr10081645
Submission received: 29 June 2022 / Revised: 10 August 2022 / Accepted: 13 August 2022 / Published: 18 August 2022

Abstract

:
Wind resistance is one of the most important safety targets for high-rise buildings, especially slab-shaped ones with relatively large length–width ratios. In this study, the characteristics of wind pressure on a reduced-scale model of a slab-shaped high-rise building were analyzed experimentally. The experiment was conducted using the DTC Initium electronic scanning pressure measurement system in the wind tunnel at the Xiamen University of Technology, China. The spatial distribution and time-frequency characteristics of the wind pressure signals were analyzed with various wind flow directions under uniform and boundary-layer inflow conditions. The results show that both of the inflow conditions and the wind directions have significant influences on the magnitude and distribution characteristics of the wind pressure on the building surfaces. The wavelet transform-based analysis shows that the wind pressure on the building surfaces presents obvious intermittent characteristics, with the instantaneous energies pulsating intensively in the time-frequency domain, illustrating the unsteady nature of the wind pressure loads on the building. The influence and risk of the unsteady pulsating pressure loads should be considered when evaluating the wind-resistant performances of this type of building.

1. Introduction

The number of high-rise buildings with complex shapes is increasing worldwide due to the improvement of construction technology. It is worth emphasizing that these kinds of buildings are all wind-sensitive structures, so wind resistance design is one of the important indexes for their structural safety. However, if the unique appearances of these high-rise buildings are ignored and unified standards are directly applied, the wind-effect estimation for these buildings will not be accurately and effectively guided [1,2]. According to the national standards for the structural design of high-rise buildings [3], wind loads for high-rise buildings exceeding a certain height and with special shapes should be determined with a wind tunnel test. Specifically, the wind tunnel test is a method where model tests are conducted under the artificial atmospheric boundary layer, and it is considered an effective mean to reflect the wind loads of high-rise buildings with complicated facades.
A study on a super high-rise building with a complex shape in Chengdu [4] revealed that the building is greatly affected by the shape; moreover, the wind pressure distribution over part of the facade surface is different from the value specified in the guidelines. Yang [5] undertook an error analysis by comparing the values of the load standard with the numerical results for a super high-rise building and found that the size coefficients in the load standard are more conservative than the simulation results. Therefore, it is necessary to conduct unique experimental analyses for high-rise buildings with specific appearances, as well as exploit wind load characteristics; for instance, finding the regions with peak pressure (such as the peak negative zone) [6], investigating detailed influences of wind on buildings (such as the wind directions or surrounding terrain conditions) [7], and clarifying the dominant wind pressure [8].
The above studies give a deeper understanding of the particularity of wind resistance performance in particular buildings. In recent decades, conventional analytical methods for wind resistance studies for the prediction of the gust response in a turbulent flow field have been based on quasi-steady and linear assumptions, such as averaging the signal using the Fourier transform. This method needs to average the signal across the whole time history and ignores the transient effect of the wind pressure signal. In addition to paying attention to the time-average characteristics of wind loads on building surfaces, it has been shown that nonlinear and time-domain analyses for unsteady aerodynamic characteristics over time have become necessary; for instance, wavelet analysis.
Since Grossmann and Morlet [9] first proposed the concept of wavelet analysis in the 1980s, it has become a popular research topic in the fields of science and engineering. The wavelet transform can overcome the dilemma of resolution selection in the time domain and frequency domain (Torrence and Compo [10]). The wavelet transform has also been used as a powerful tool for non-stationary signal analysis in wind engineering [11,12,13,14]. In 1991, Yamada [15] applied the wavelet method to atmospheric turbulence data from over more than two decades. Similar work was also conducted by Zeldin et al. [16], who addressed the simulation of random fields on a wavelet basis. In order to analyze the influence of incoming flow on wind loads, Hajj et al. [17,18,19] carried out wavelet analysis on the relationship between the far-field wind speed and building surface pressure, demonstrating the intermittency of wind pressure fluctuation, which could not be obtained using frequency-domain approaches. Similarly, Dunyak [20] described a method using the wavelet transform to detect coherent structures in the wind field. In 2011, Zhao et al. [21] conducted a study on the signal of non-stationary wind pressure using the wavelet method for analysis and concluded that the signal energy is mostly distributed at low frequencies. Such research continued and, in 2018, Wang et al. [22] investigated the non-stationary characteristics of recorded typhoons at the Sutong Bridge site based on the wavelet transform, obtaining the evolutionary power spectral densities and providing reference values for wind effect analysis on the long-span bridge. It was found that the turbulence of the incoming flow ultimately affects the wind loads on the building surface.
For non-stationary wind loads, Pettit et al. [23] applied the wavelet transform to the time history of local extreme wind pressure on a roof and then obtained the probability density function with instantaneous pressure values. Huang et al. [24] used wavelet transforms to analyze the wind pressure pulsation characteristics on the surface of a single-sided, curved canopy and identified the energy distribution of the wind pressure on the curved canopy in different frequency bands. Based on wavelet coherence, Le et al. [25,26,27] studied the influences of flow separation along a structure’s width, frequency, and breakage on pressure coherence and presented a comparison of turbulent coherence and pressure coherence. In a study by Shen et al. [28], the coherence of wind-induced pressure fluctuation was analyzed based on the wavelet transform. The wavelet transform has been increasingly widely used over time. This approach has been followed by several researchers. In 2018, Jin [29] proposed a hybrid decomposition in which wavelet packet decomposition was employed to reduce the intermittency of the wind pressure. In a recent study, a novel method called extended empirical wavelet transformation (EEWT) was presented by Karimpour et al. [30], and the results showed the capability of the approach to identify transient information. In studies concerned with instantaneous characteristics, the wavelet transform has been the main tool used for frequency-domain analysis. In particular, for high-rise buildings with special shapes, in addition to average wind load analysis, it is necessary to use wavelet analysis to study the instantaneous characteristics of wind pressure.
In this study, a wind tunnel analysis of the distribution characteristics of wind pressure on a slab-shaped high-rise building was conducted because of the obvious length–width ratio. An analysis of the time-domain distribution characteristics of the measured wind pressure on the building based on the wavelet transform was deployed to circumvent the problems presented by frequency-domain analysis. The contents of this article are arranged as follows; first, the wind tunnel test of the building pressure is introduced and the distribution of the average wind pressure coefficient on the building surface is discussed. Then, the time-frequency characteristics of the wind pressure coefficients are calculated and analyzed using the wavelet analysis method. A summary is provided in the final part. Through this paper, references for the study of the wind load distribution characteristics of slab-shaped structures can be provided.

2. Experimental Setting

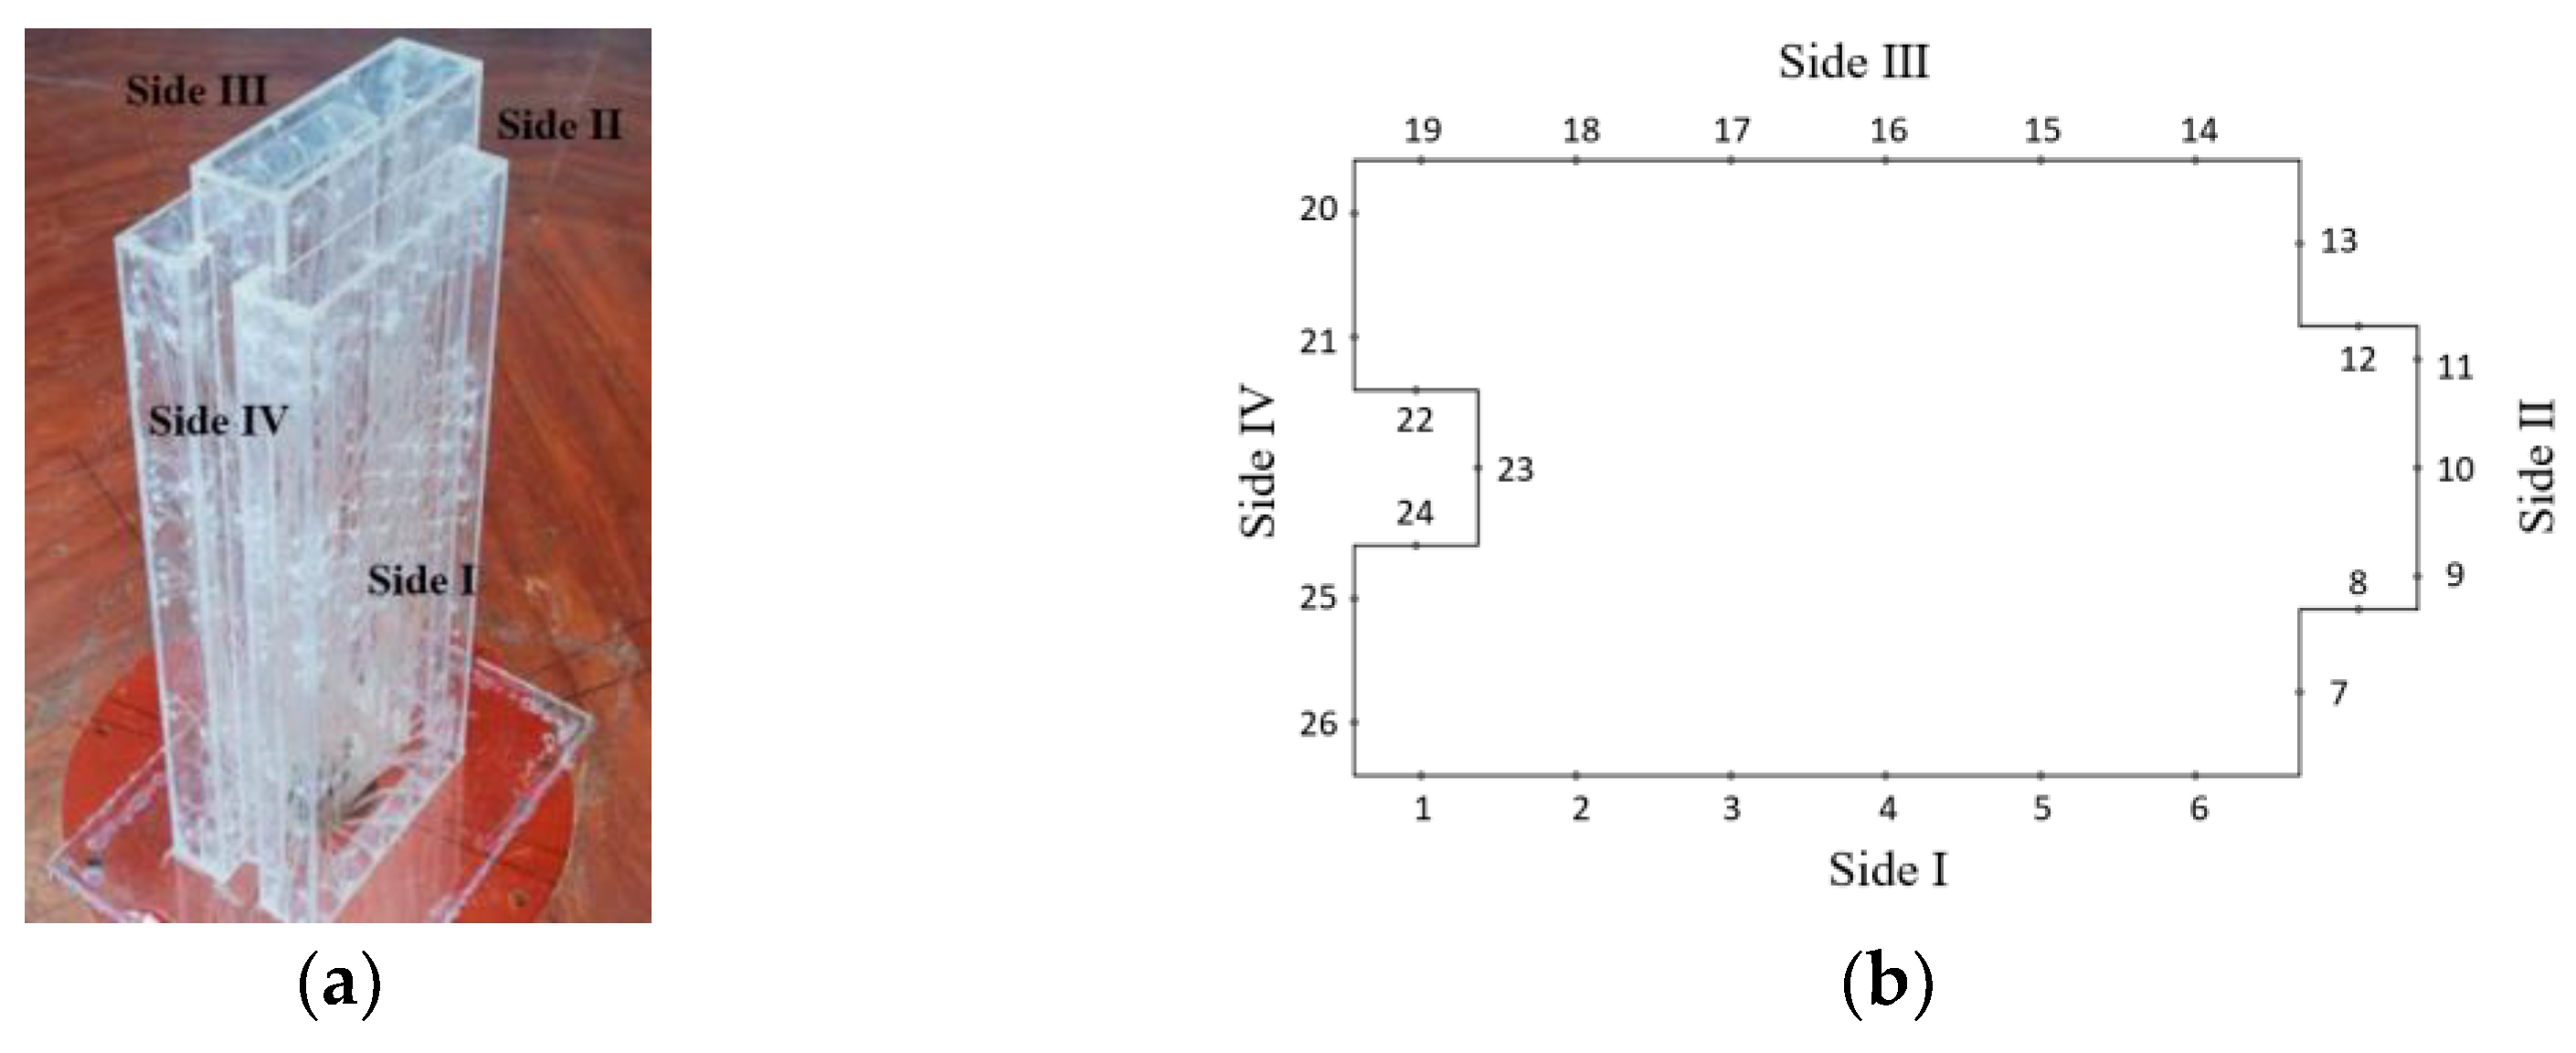
2.1. Experimental Model
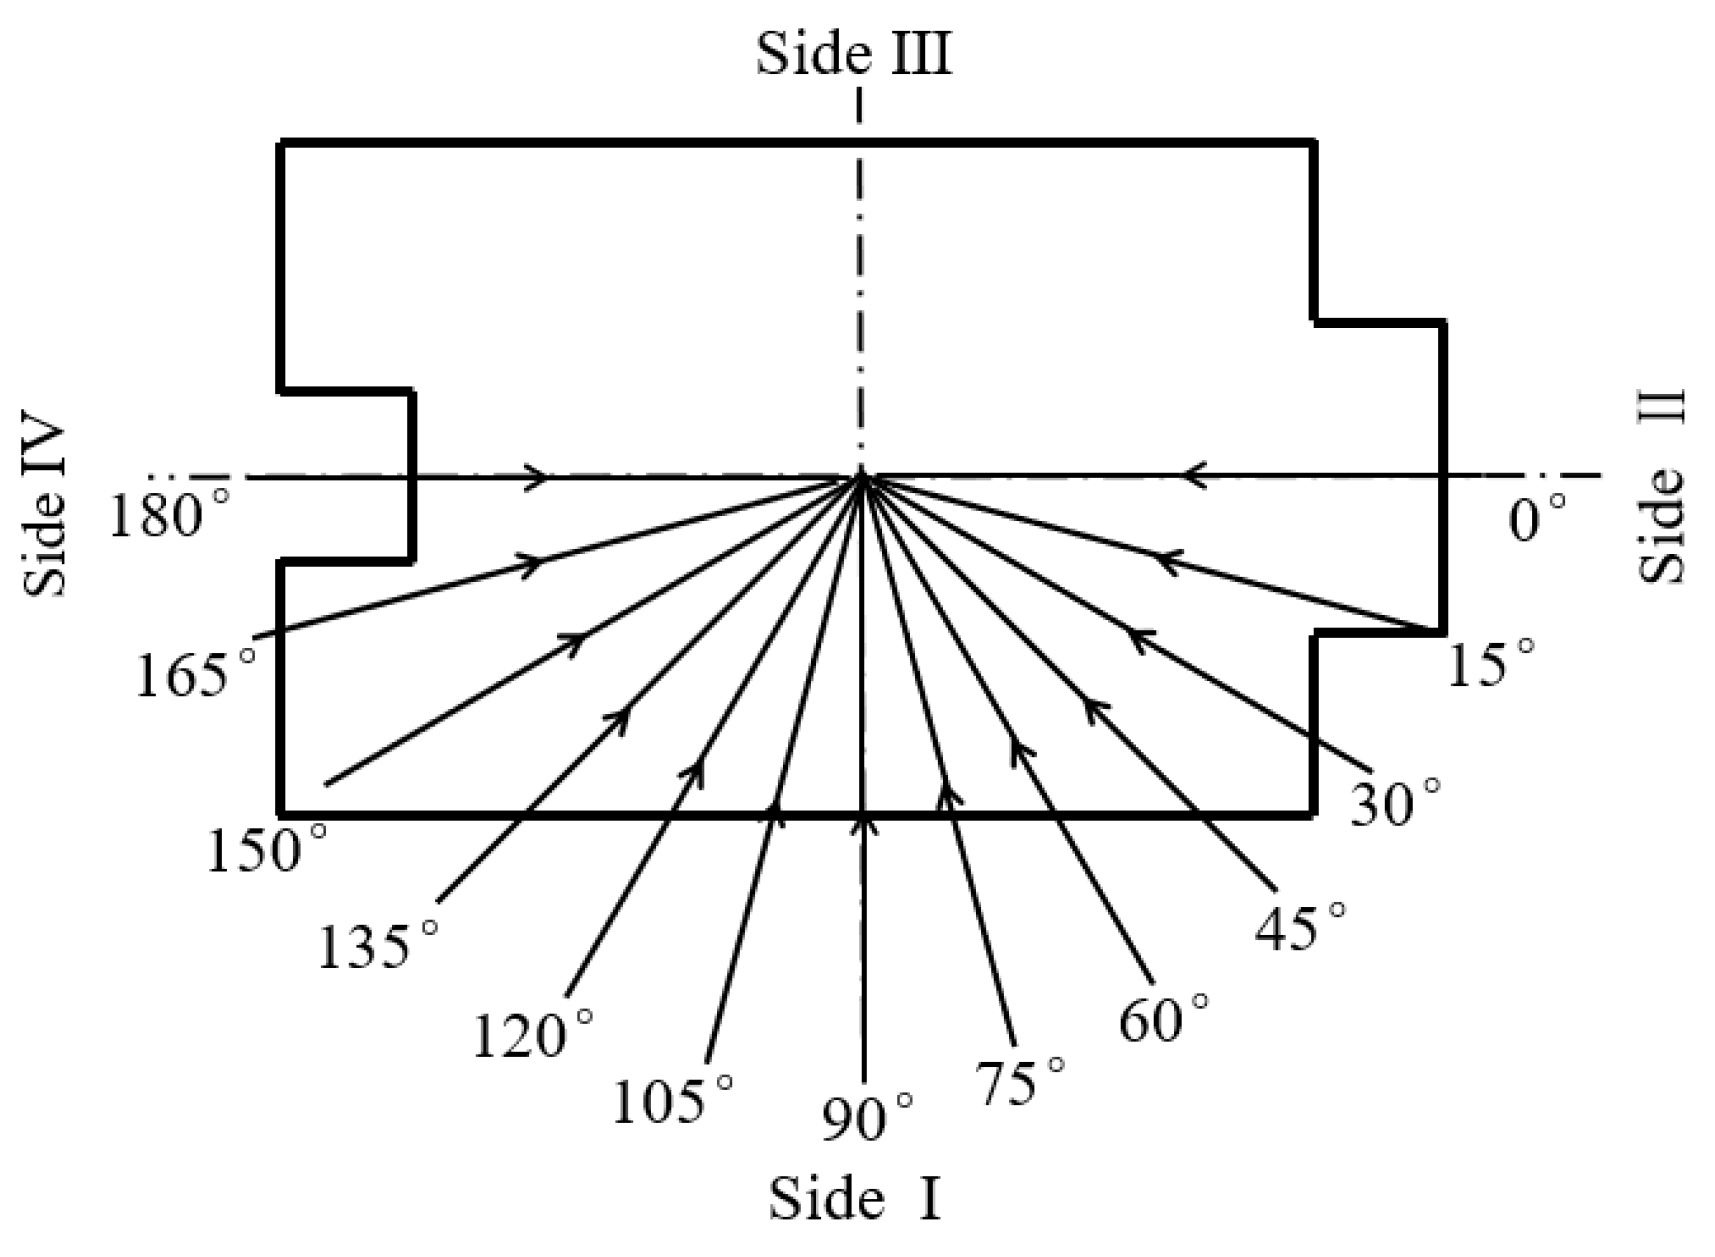
The test was carried out in the wind tunnel laboratory. The test model was fabricated according to the scale ratio of 1:150, the total height of the building is 118 cm and the model was made of 3.7 mm acrylic sheets to ensure its stiffness (see Figure 1a).
The layout of the measuring points on the building surfaces was arranged in detail (364 points in total), and the points were named as horizontal layers A–H and vertical lines 1–26, as shown in Figure 1b,c. Furthermore, the DTC Initium electronic scanning pressure measurement system was adopted for wind pressure testing with simultaneous time histories. The DTC system consists of the main engine and several multichannel pressure-measuring modules. The modules are connected with pressure measuring holes set on the surfaces of the test model through PVC pipes. The wind pressure signals are collected and then converted into voltage signals, which are finally received and analyzed by the main engine of the system terminal.

2.2. Test Cases

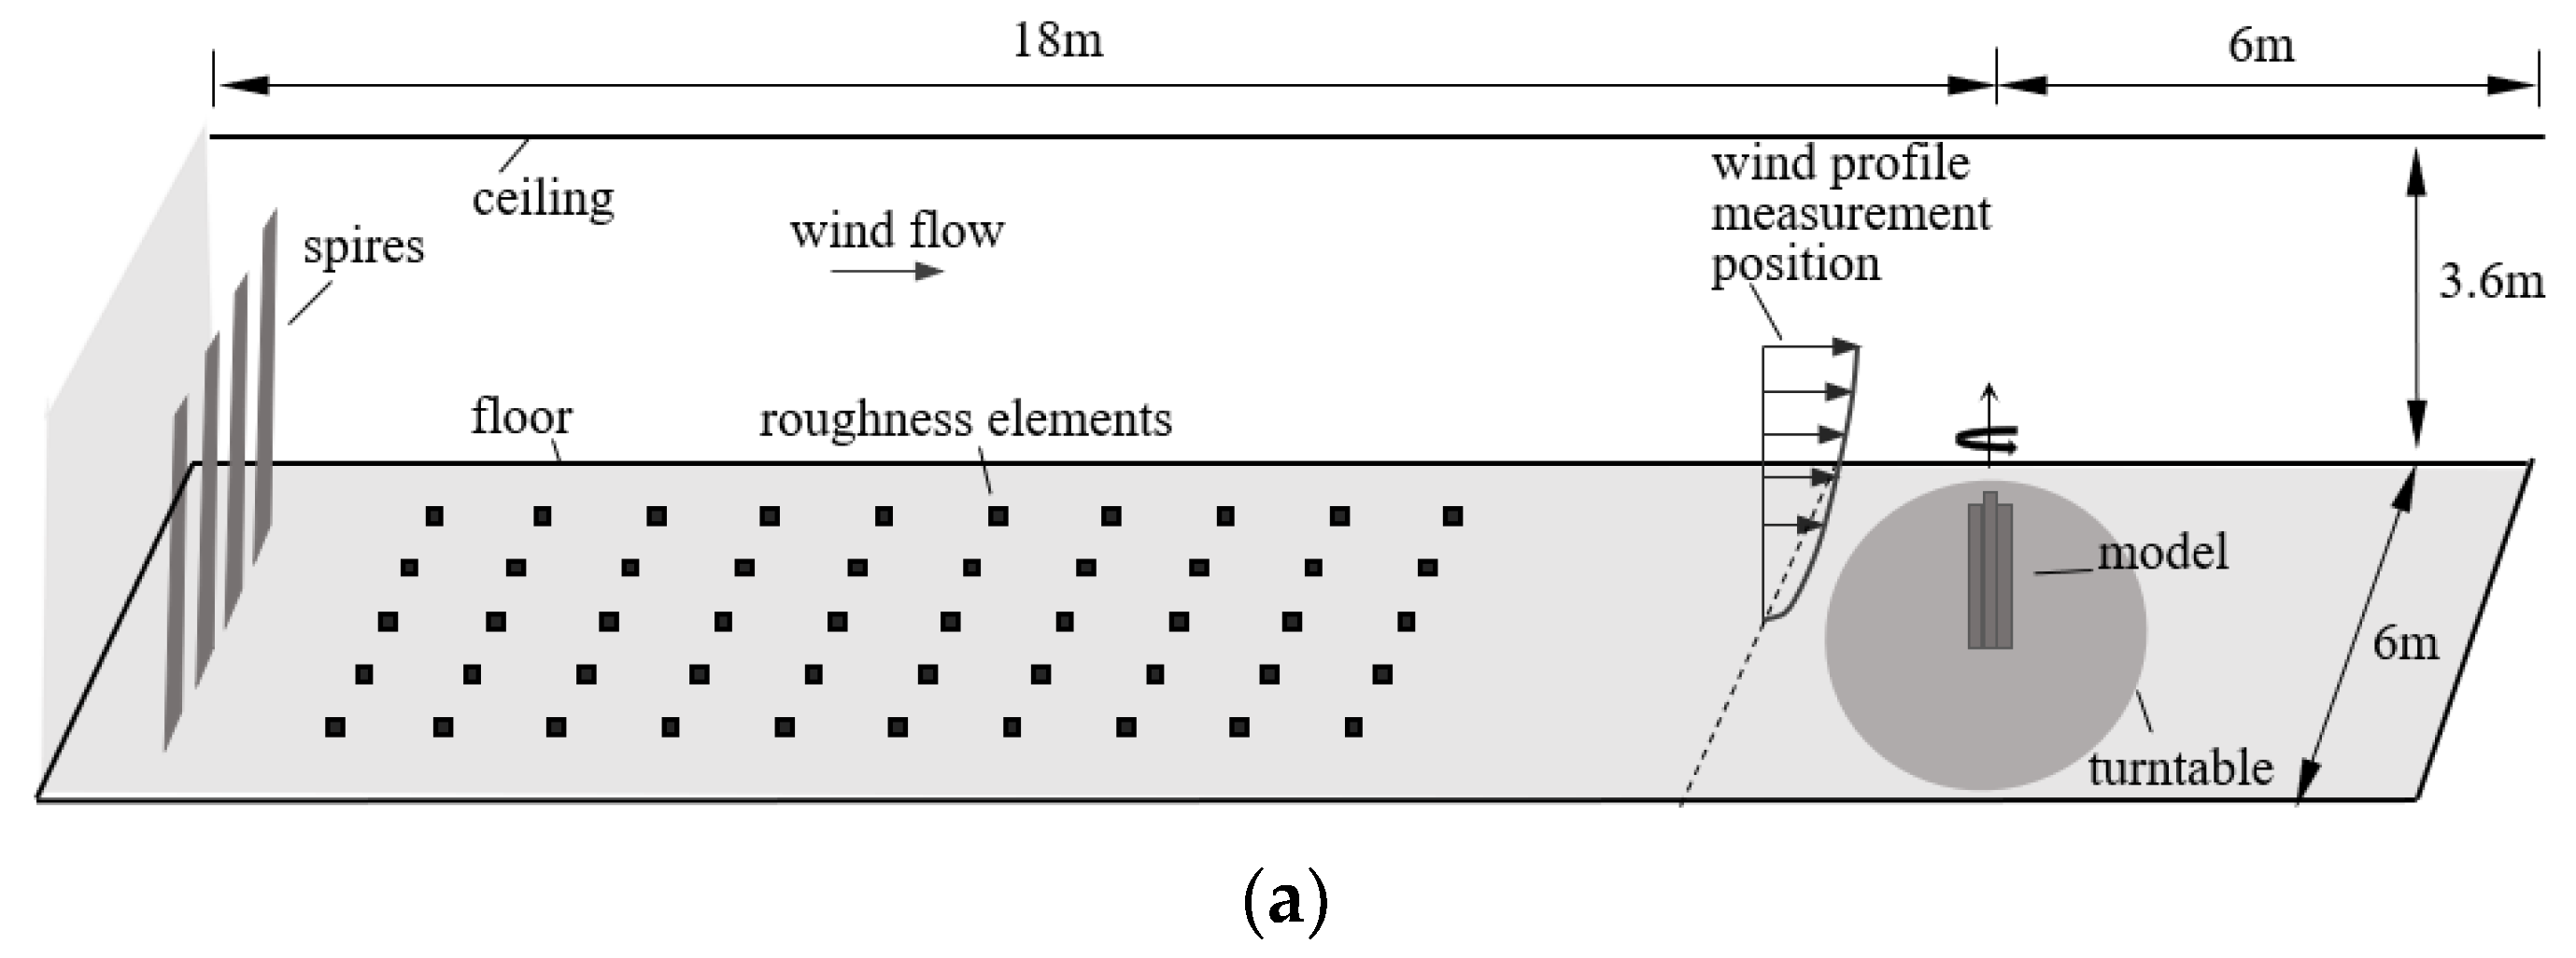
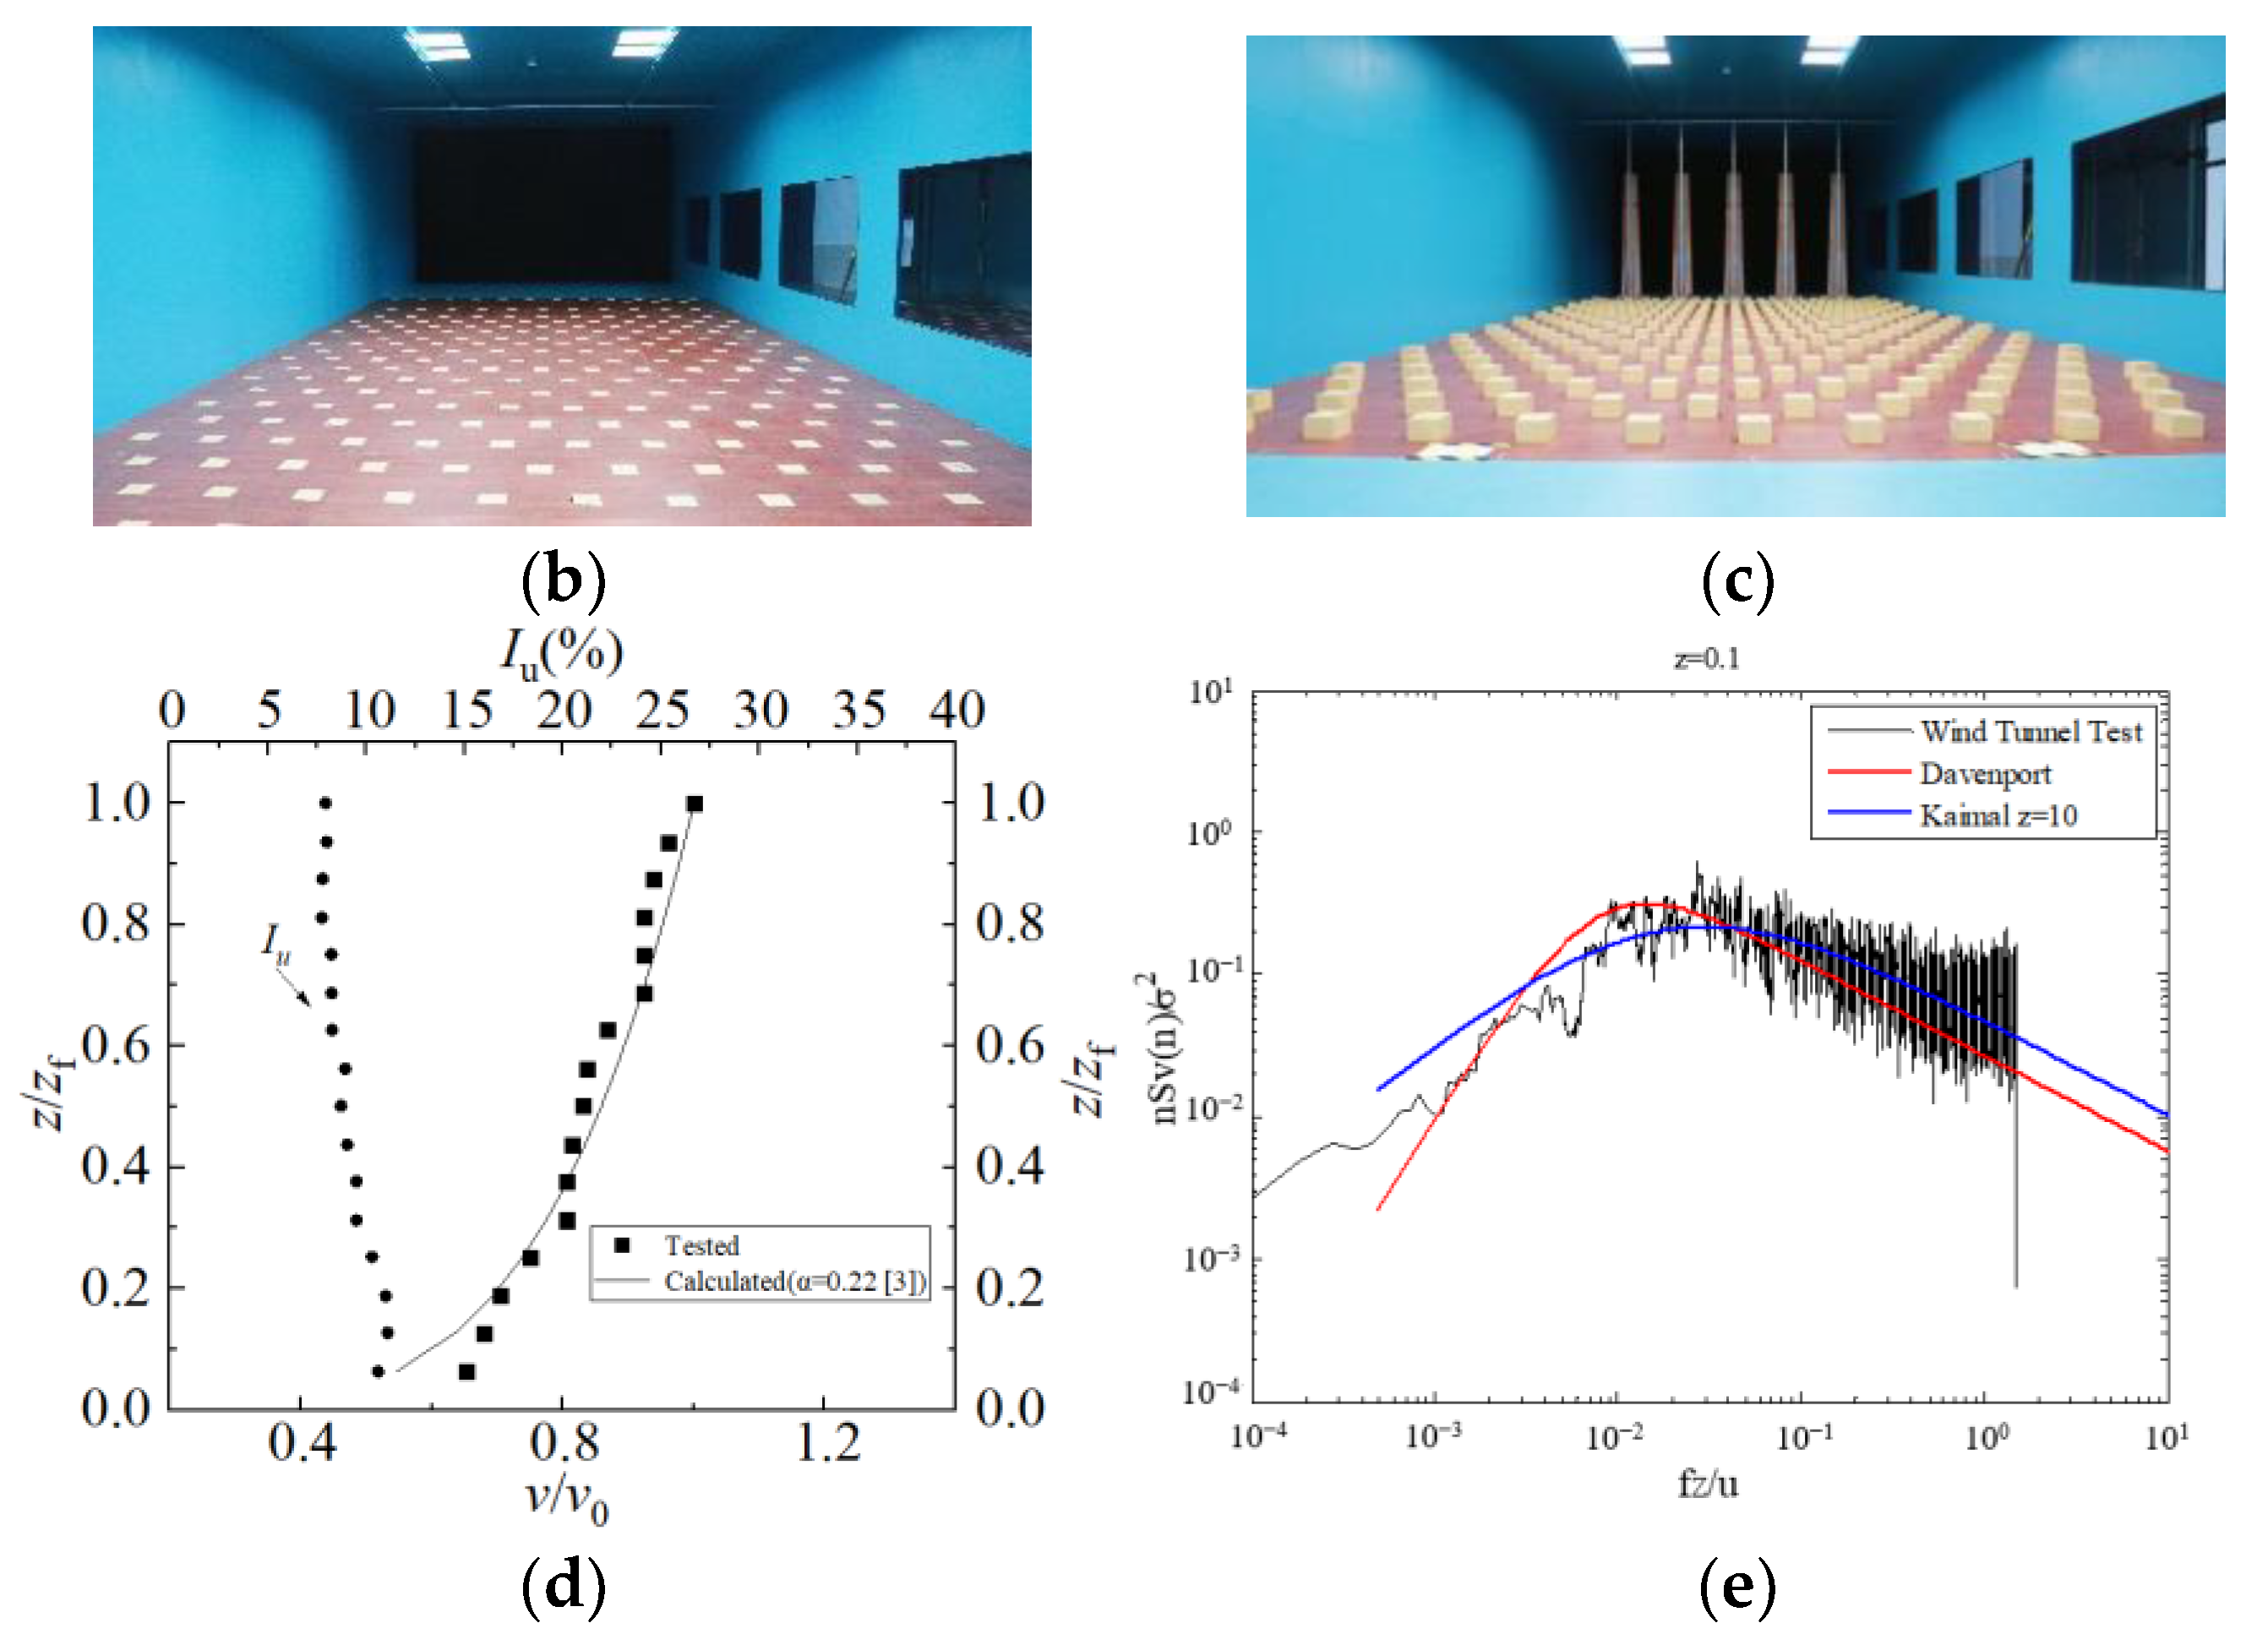
2.2.1. Wind Field in the Wind Tunnel

Figure 2 depicts the detailed arrangement of the wind tunnel. The test section has a length of 24 m, width of 6 m and height of 3.6 m. By turning the bottom turntable, the upper building model could be turned horizontally to change the wind direction angle. In this study, two different inflow conditions were considered. The spires and surface roughness elements were arranged upstream to simulate the atmosphere boundary layer required by the national building structure load code in the first condition [3] (see Figure 2a,c) but not in the uniform flow condition (see Figure 2b). The spires are 24 cm wide at the top and 48 cm wide at the bottom, with a total height of 280 cm. The size of the cubic roughness elements is 25 cm.
The average wind speed profile of the boundary layer can be reflected by an exponential law [3], and it is shown in Figure 2 together with the turbulence intensity profile. The wind speed profile was calculated as follows:
u z = u 0 ( z z f ) α
where uz is the mean wind speed at height z; u0 is the mean wind speed on the top of the boundary layer; zf is the thickness of the boundary layer; and α is the roughness index (α = 0.22 [3]).

2.2.2. Test Scheme

The sampling frequency of the wind pressure on the building in this test was 330 Hz, the sampling time was 90 s and the total length of the samples at each measuring point was 29,700. A total of 352 measurement points were used simultaneously in this model test.
As the structure was uniaxially symmetric, the wind directions in the test were only measured every 15° within the range from 0° to 180°, as shown in Figure 3. When the airflow was perpendicular to surface II, the direction angle was defined as 0°. The specific test conditions were designed considering the influence of the wind field [31], as shown in Table 1, and the uniform incoming flow was defined as UF and the boundary layer incoming flow was defined as BL.

3. Results

This section presents the results with regard to two aspects of the wind pressure: the time-average and time-domain characteristics of the wind pressure coefficients. The analysis of the time-average characteristics of the wind pressure coefficient is mainly based on the comparisons between two different inflow conditions.

3.1. Time-Average Wind Pressure Coefficients

3.1.1. Distribution of Mean Wind Pressure Coefficient with Height

Figure 4 shows the variation in the average wind pressure coefficients Cpmean with the increasing height of the building sides (I–IV) under the uniform flow (UF) and turbulent boundary layer (BL) inflow conditions at a wind direction angle of 90° (the wind direction definition can be found in Figure 3). In Figure 4, the legends represent different vertical lines on each side; the graphs in Figure 4a–d present the Cpmean with uniform incoming flow (UF), while the graphs in Figure 4e–h present the Cpmean with boundary layer incoming flow (BL). The wind speed measured at the height of the building was used as the reference for the calculation of the Cpmean coefficient.
(a)
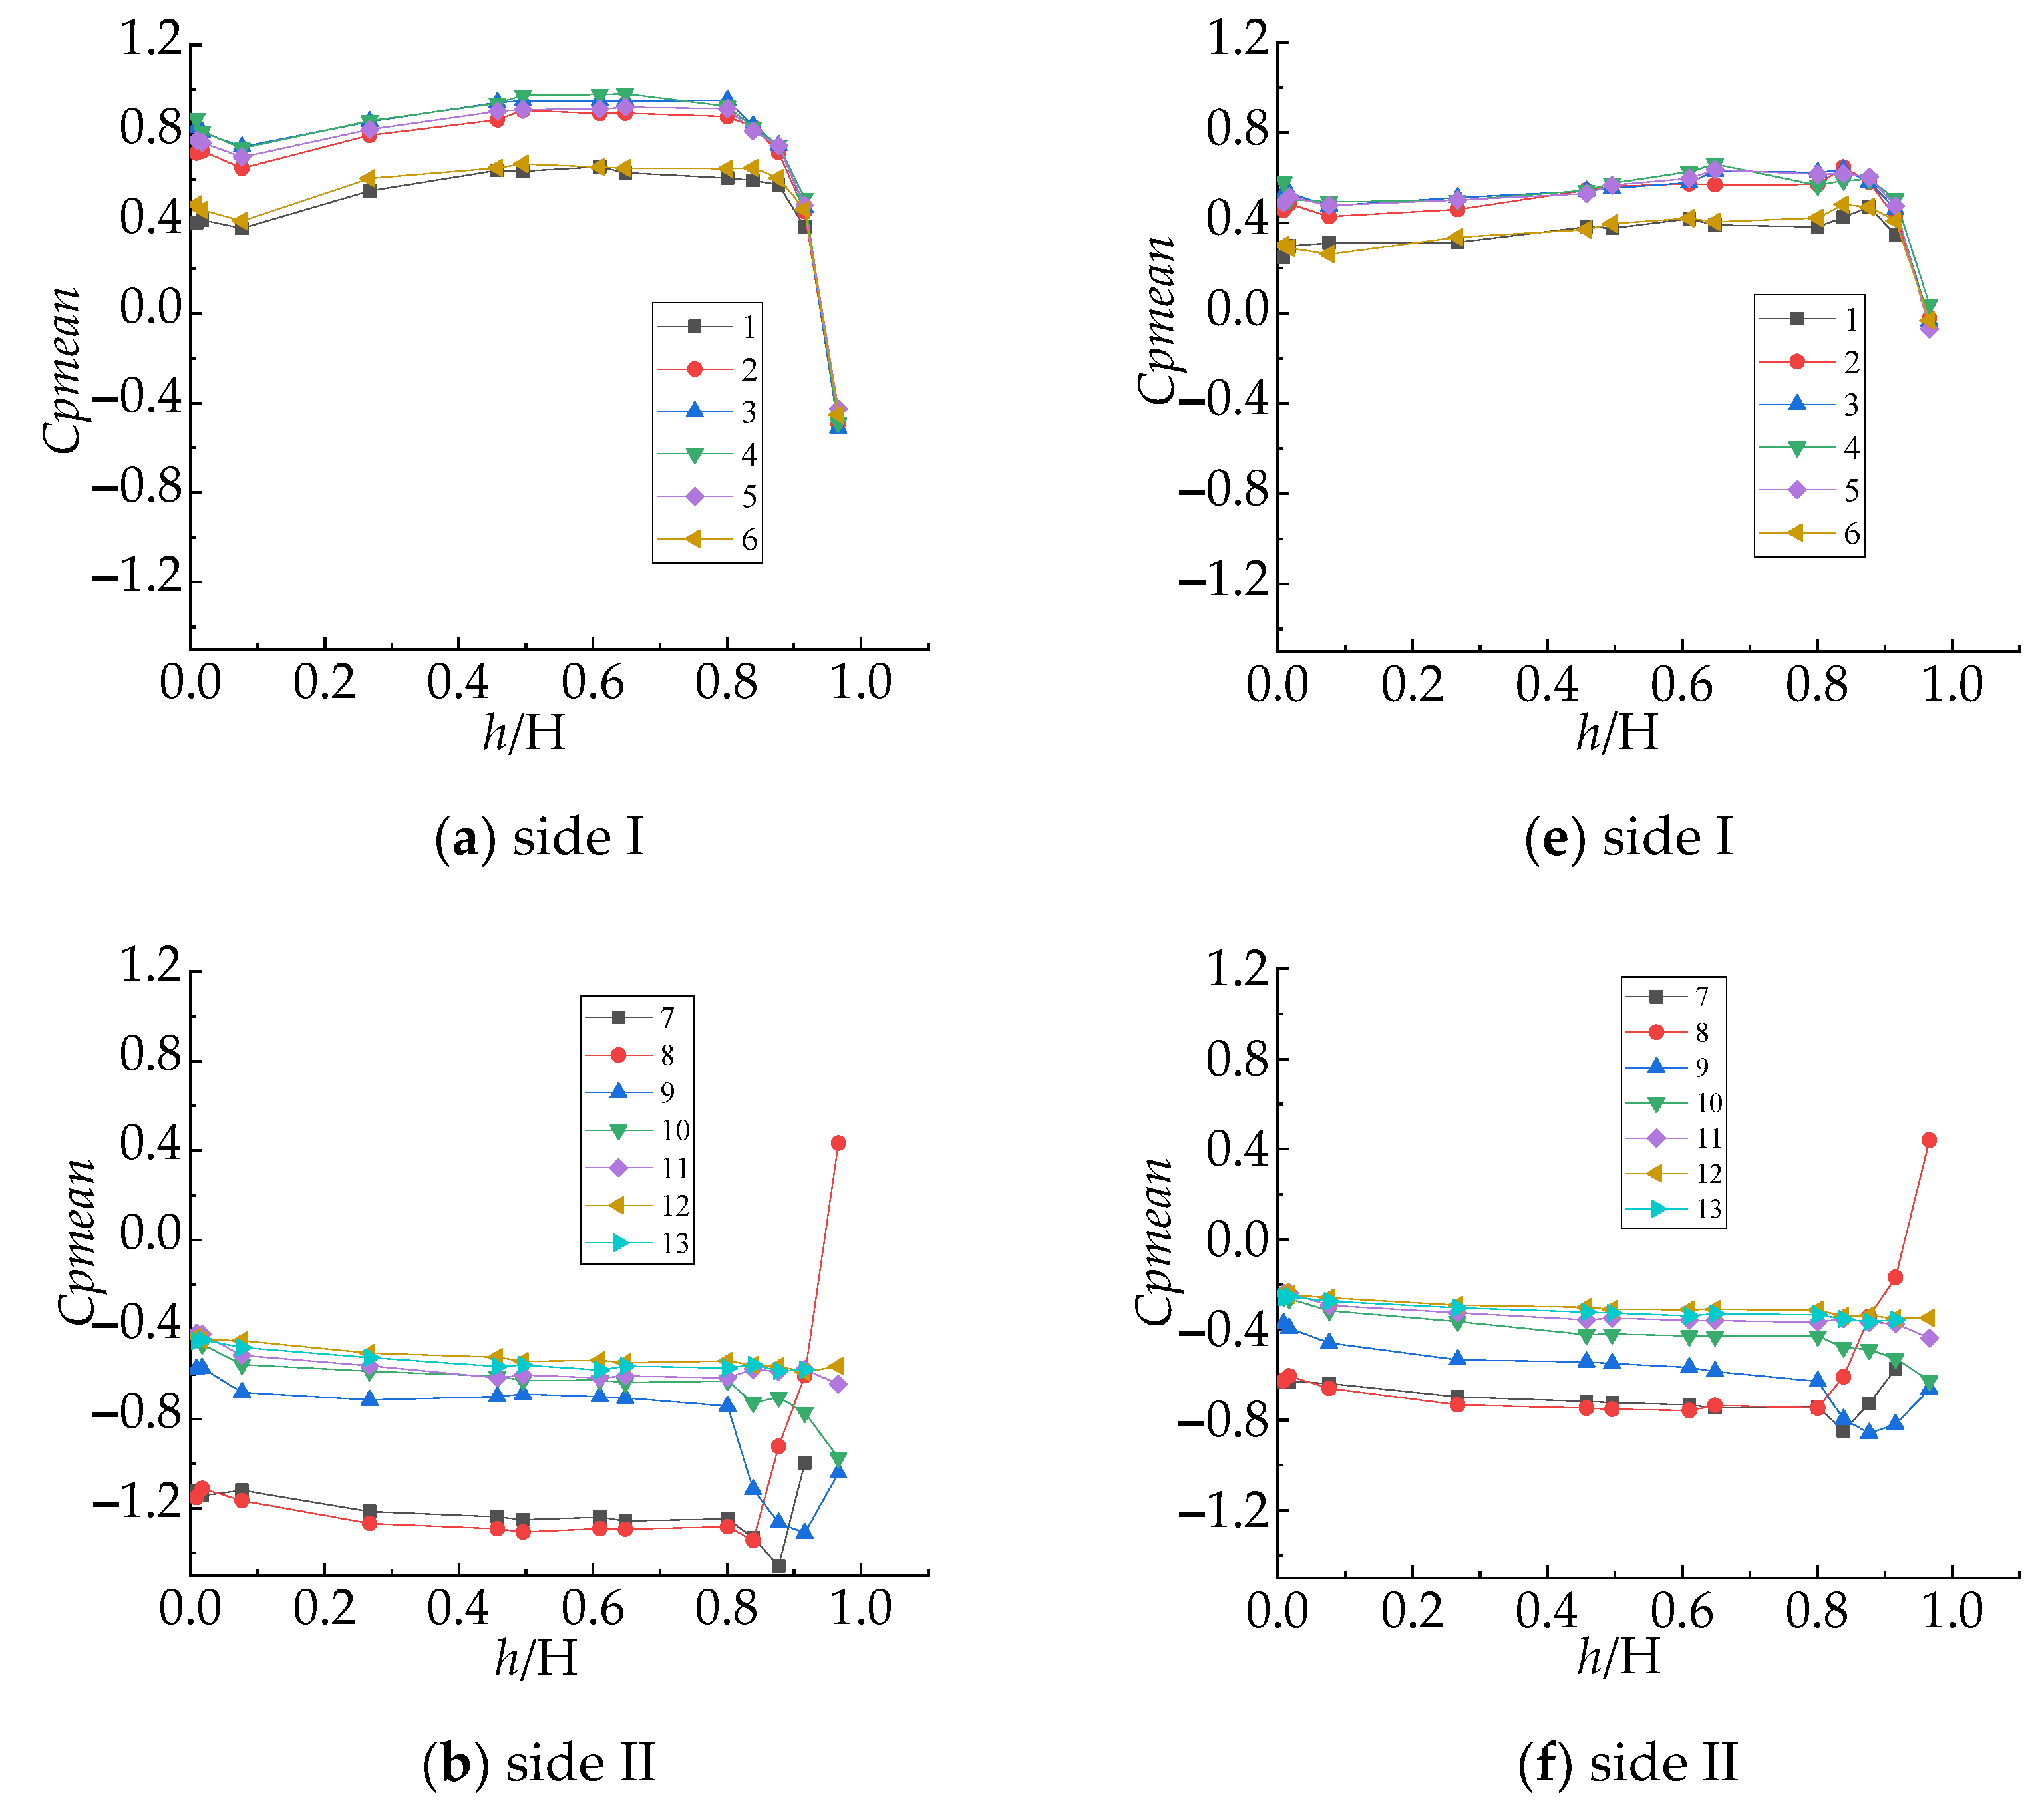
In Figure 4, comparing the average wind pressure coefficients Cpmean between the uniform flow and the boundary layer flow, the Cpmean value under the uniform flow field is generally slightly higher than that under the influence of the boundary layer flow, indicating that the effect of the regional wind environment in which the building is located cannot be ignored;
(b)
When focusing on the wind pressure coefficient of the building facades, it is found that the average wind pressure coefficients for the windward area (side I) show positive values (except the top point at layer N), and the highest measurements are found in the upper-middle part of building and gradually decrease along both sides. The average wind pressure coefficients of the measuring points for lines 1 and 6 are significantly lower than those for the middle measuring points (lines 2–5), both in the uniform flow and the boundary layer flow. The measuring points on the top floor of the building reflect negative pressures, indicating that the roof airflow is separated and that vortexes might occur;
(c)
The measurement values for sides II–IV are determined by negative pressure and the values are evenly distributed with the increasing height without significant differences. However, influenced by the concave and convex shape of the building, lines 7 and 8 contribute the maximum negative wind pressure on the building surface, while the values of lines 25 and 26 at the symmetrical position are more moderate.

3.1.2. Distribution of Mean Wind Pressure Coefficient in the Horizontal Planes

Representative horizontal layers of measurement points were selected (layers A, D, E, H, L, and N) (see Figure 5). Due to the symmetrical nature of the building, only the average wind pressure distribution characteristics with wind directions from 0° to 180°, an increment of 90° and wind speed of 10 m/s are presented in this section (see Figure 6).
(a)
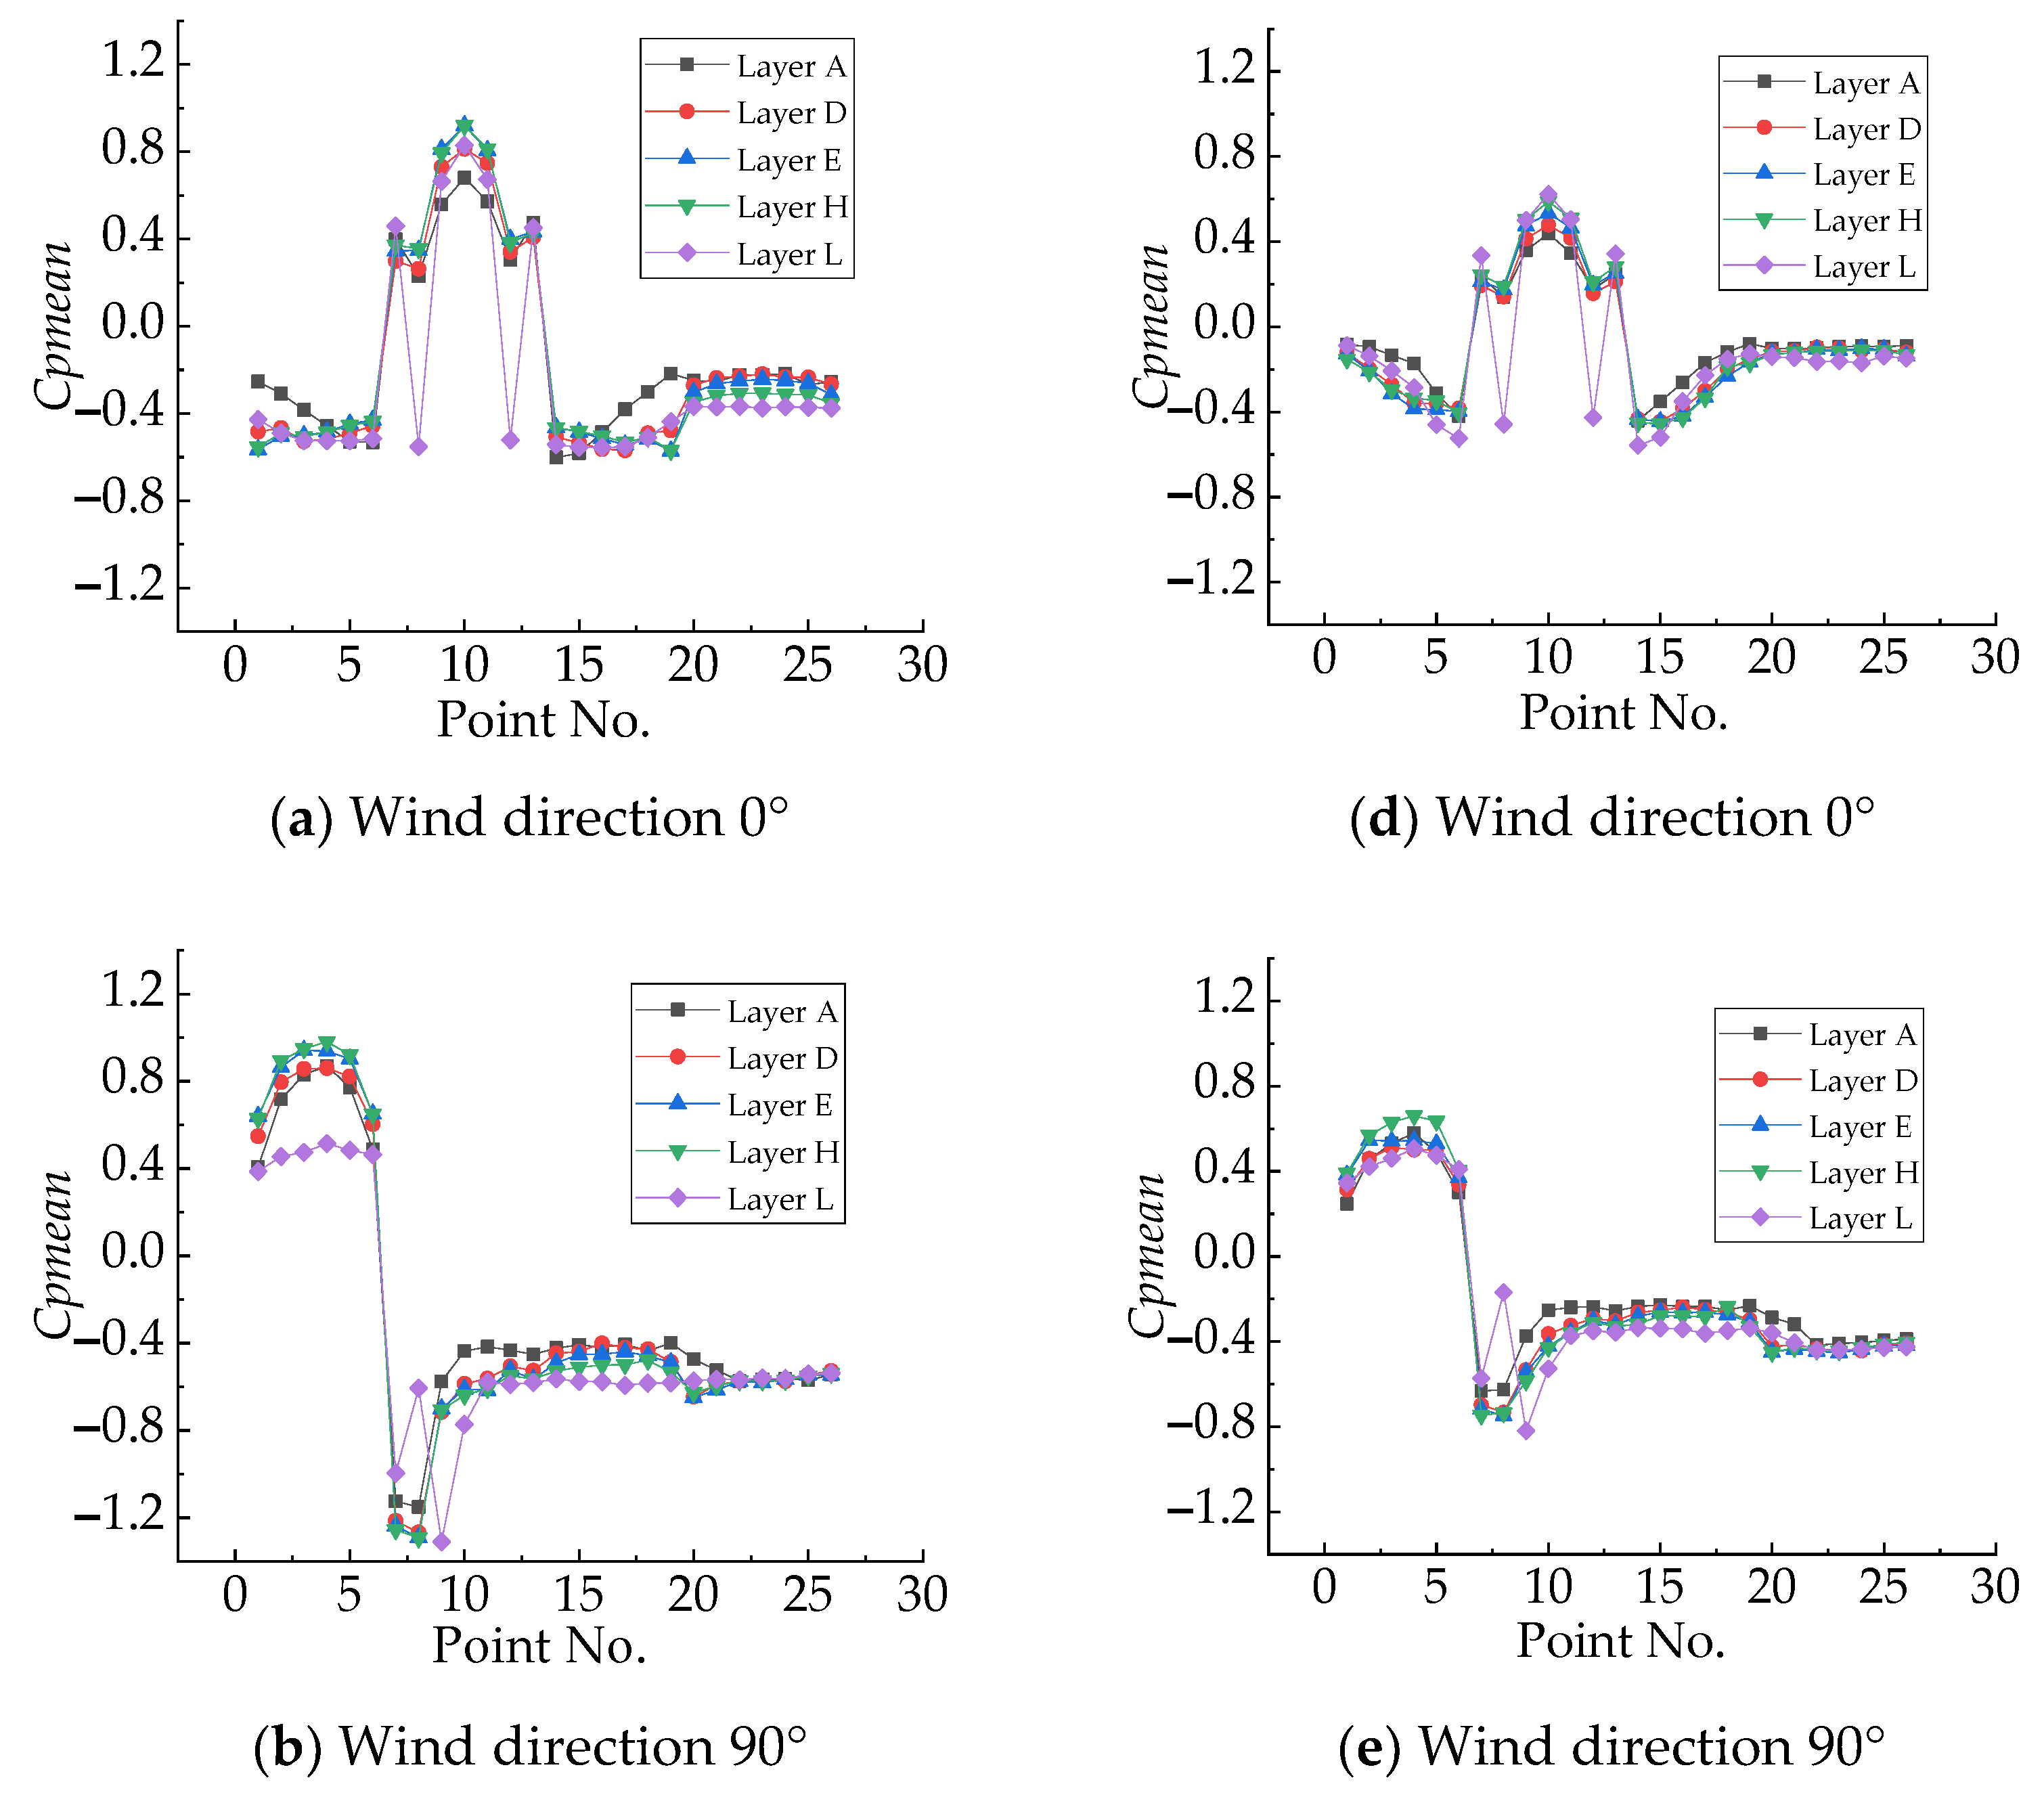
Due to the existence of concave and convex areas in the building itself, the wind pressure distribution is different from that in conventional buildings. For example, when the wind direction angle is 0°, the curve of the top layer shows an obvious trend of jumping from positive pressure to negative pressure at points 8 and 12 (see Figure 6a,b). Based on the evaluation of the flow phenomenon around the building, the reason could be that, when the wind crosses the roof, as it is hindered by the raised part of the roof, the incoming wind blows across the roof more urgently, which causes obvious suction toward the 8 and 12 positions on the top layer;
(b)
Under both the uniform and the turbulent boundary layer inflow conditions, the overall trends for all working conditions are basically the same, but a discrepancy in the wind pressure data between these two inflow conditions could still be observed. For example, when the wind direction angle is 0°, the wind pressure values for the five horizontal layers selected in the uniform flow inflow condition (Figure 6a) are basically higher than the values in the boundary layer condition (Figure 6d). Furthermore, it is found that the maximum positive value occurs at point 10 on layers E and H in both Figure 6a,d, but the deviation reaches up to 0.2, which is a large gap for the wind pressure coefficient. Through the investigation of all the situations in Figure 6, the maximum deviation between these two inflow conditions is found to be close to 0.5, which appears at point 9 on layer L (see Figure 6b,e);
(c)
The maximum wind pressure coefficient on the windward side appears at the height of 2/3 H (layer H).

3.2. Instantaneous Wind Pressure Coefficients

The time-history variation in wind pressure collected under the boundary layer inflow condition were analyzed with the wavelet transform based on the wavelet package provided by Torrence and Compo [10].
Four locations on layer H (points 4, 10, 16, and 23 located at the four facades of the building, as shown in Figure 5, marked by triangles) were selected to represent the wind pressure features in the time domain, which are shown in Figure 7. The wind pressure time series of these four points were determined as the first step, followed by the corresponding diagram of the wavelet power spectra (defined and normalized by Liu et al. [32] and shown using different colors in the contour plots). First of all, the wavelet power spectra are distributed locally and intermittently in the time-frequency domain, showing chaotic states with obvious fringe-like patterns. The fringe-like patterns indicate the discontinuity and sudden-change features of the instantaneous wind pressure energy with time. Furthermore, the chaotic states are mainly concentrated in a low frequency band, and most of them appear in the range from 0 to 50 Hz. These characteristics demonstrate the unsteady and low-frequency nature of the wind pressure.
To obtain more detailed data on the unsteady and low-frequency nature of the wind pressure on the building, the time-power and frequency-power characteristics of point 23 on layer H with a wind direction of 90° (Figure 8a) were investigated, as shown in Figure 8b,c.
The global averaged wavelet power spectra are depicted in Figure 8b. This figure shows the distribution of the average wavelet power spectra over the entire time span in the frequency domain. We can see that the dominant frequency, the peak of the curve, is around 3 Hz, which is basically the same as the range reported by [33]. The scaled, averaged wavelet power spectra are depicted in Figure 8c; this figure demonstrates the distribution of scale-weighted average wavelet power spectra over the entire scale span in the time domain and can be used to measure the global intensity of the pressure pulsations over time. It can be seen that the wavelet power spectrum pulsates intensively over time. This indicates that the energy of the unsteady pressure loads changes rapidly in a short time span.

4. Discussion

This study investigates the wind pressure coefficient characteristics in a reduced-scale model of a slab-shaped high-rise building and provides a new understanding of the unsteady wind pressure characteristics of the building under different inflow conditions with various wind directions.
(a)
The distribution of the wind pressure coefficients of the building model is affected by the inflow condition. It is found that the average wind pressure coefficients in the uniform incoming condition are generally larger than those in the inflow condition with a turbulent boundary layer, which is close to the reality. The average deviation between these two inflow conditions is found to be nearly 0.15. However, because the uniform inflow condition is easy to realize, the results for some studies adopting the uniform inflow condition are bound to be different from the real situation. Therefore, in the study of the wind resistance characteristics of buildings, the incoming flow conditions must be confirmed and defined correctly.
Furthermore, the influence of the different wind directions on the wind loads cannot be ignored either. For the slab-shaped building with significant concave and convex shapes involved in this study, there is a huge pressure gradient on the windward side with different wind directions; that is, the wind pressure decreases sharply over a short distance range until a relatively large negative pressure appears. This phenomenon is relatively rare in existing reports. The remarkable pressure gradients can cause further damage, which should also be paid attention to. It is best to conduct an all-wind-directions study.
(b)
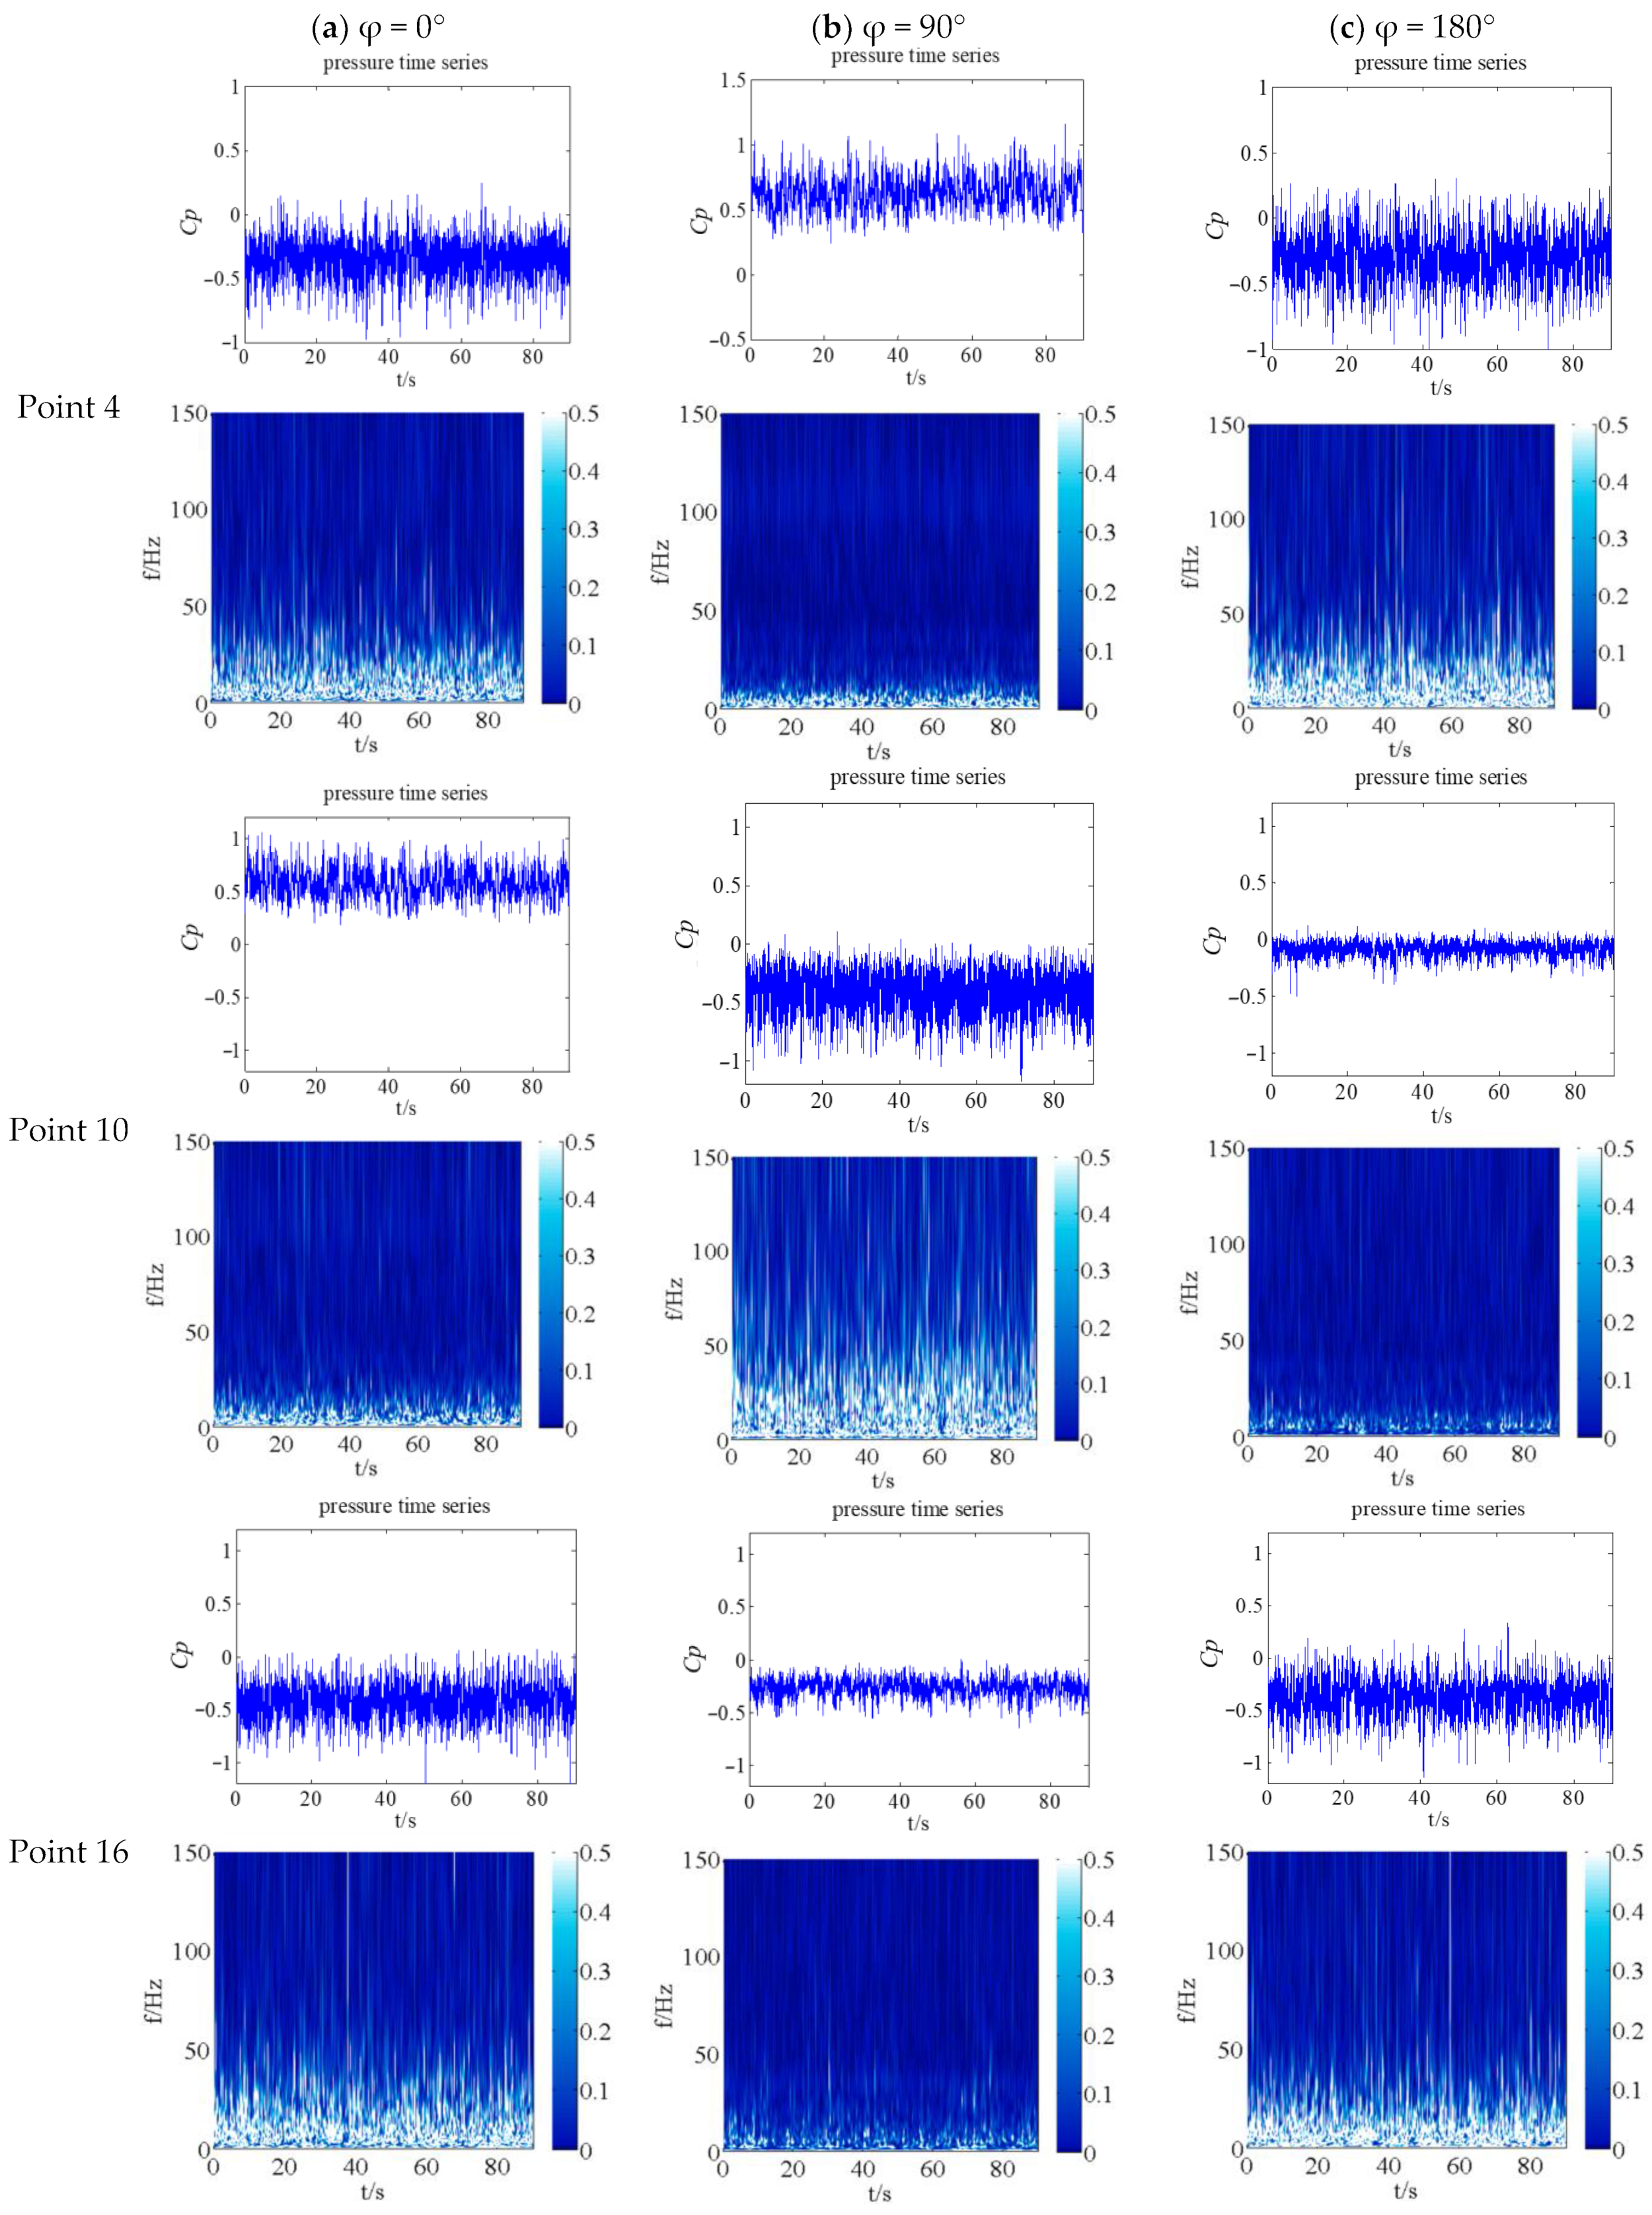
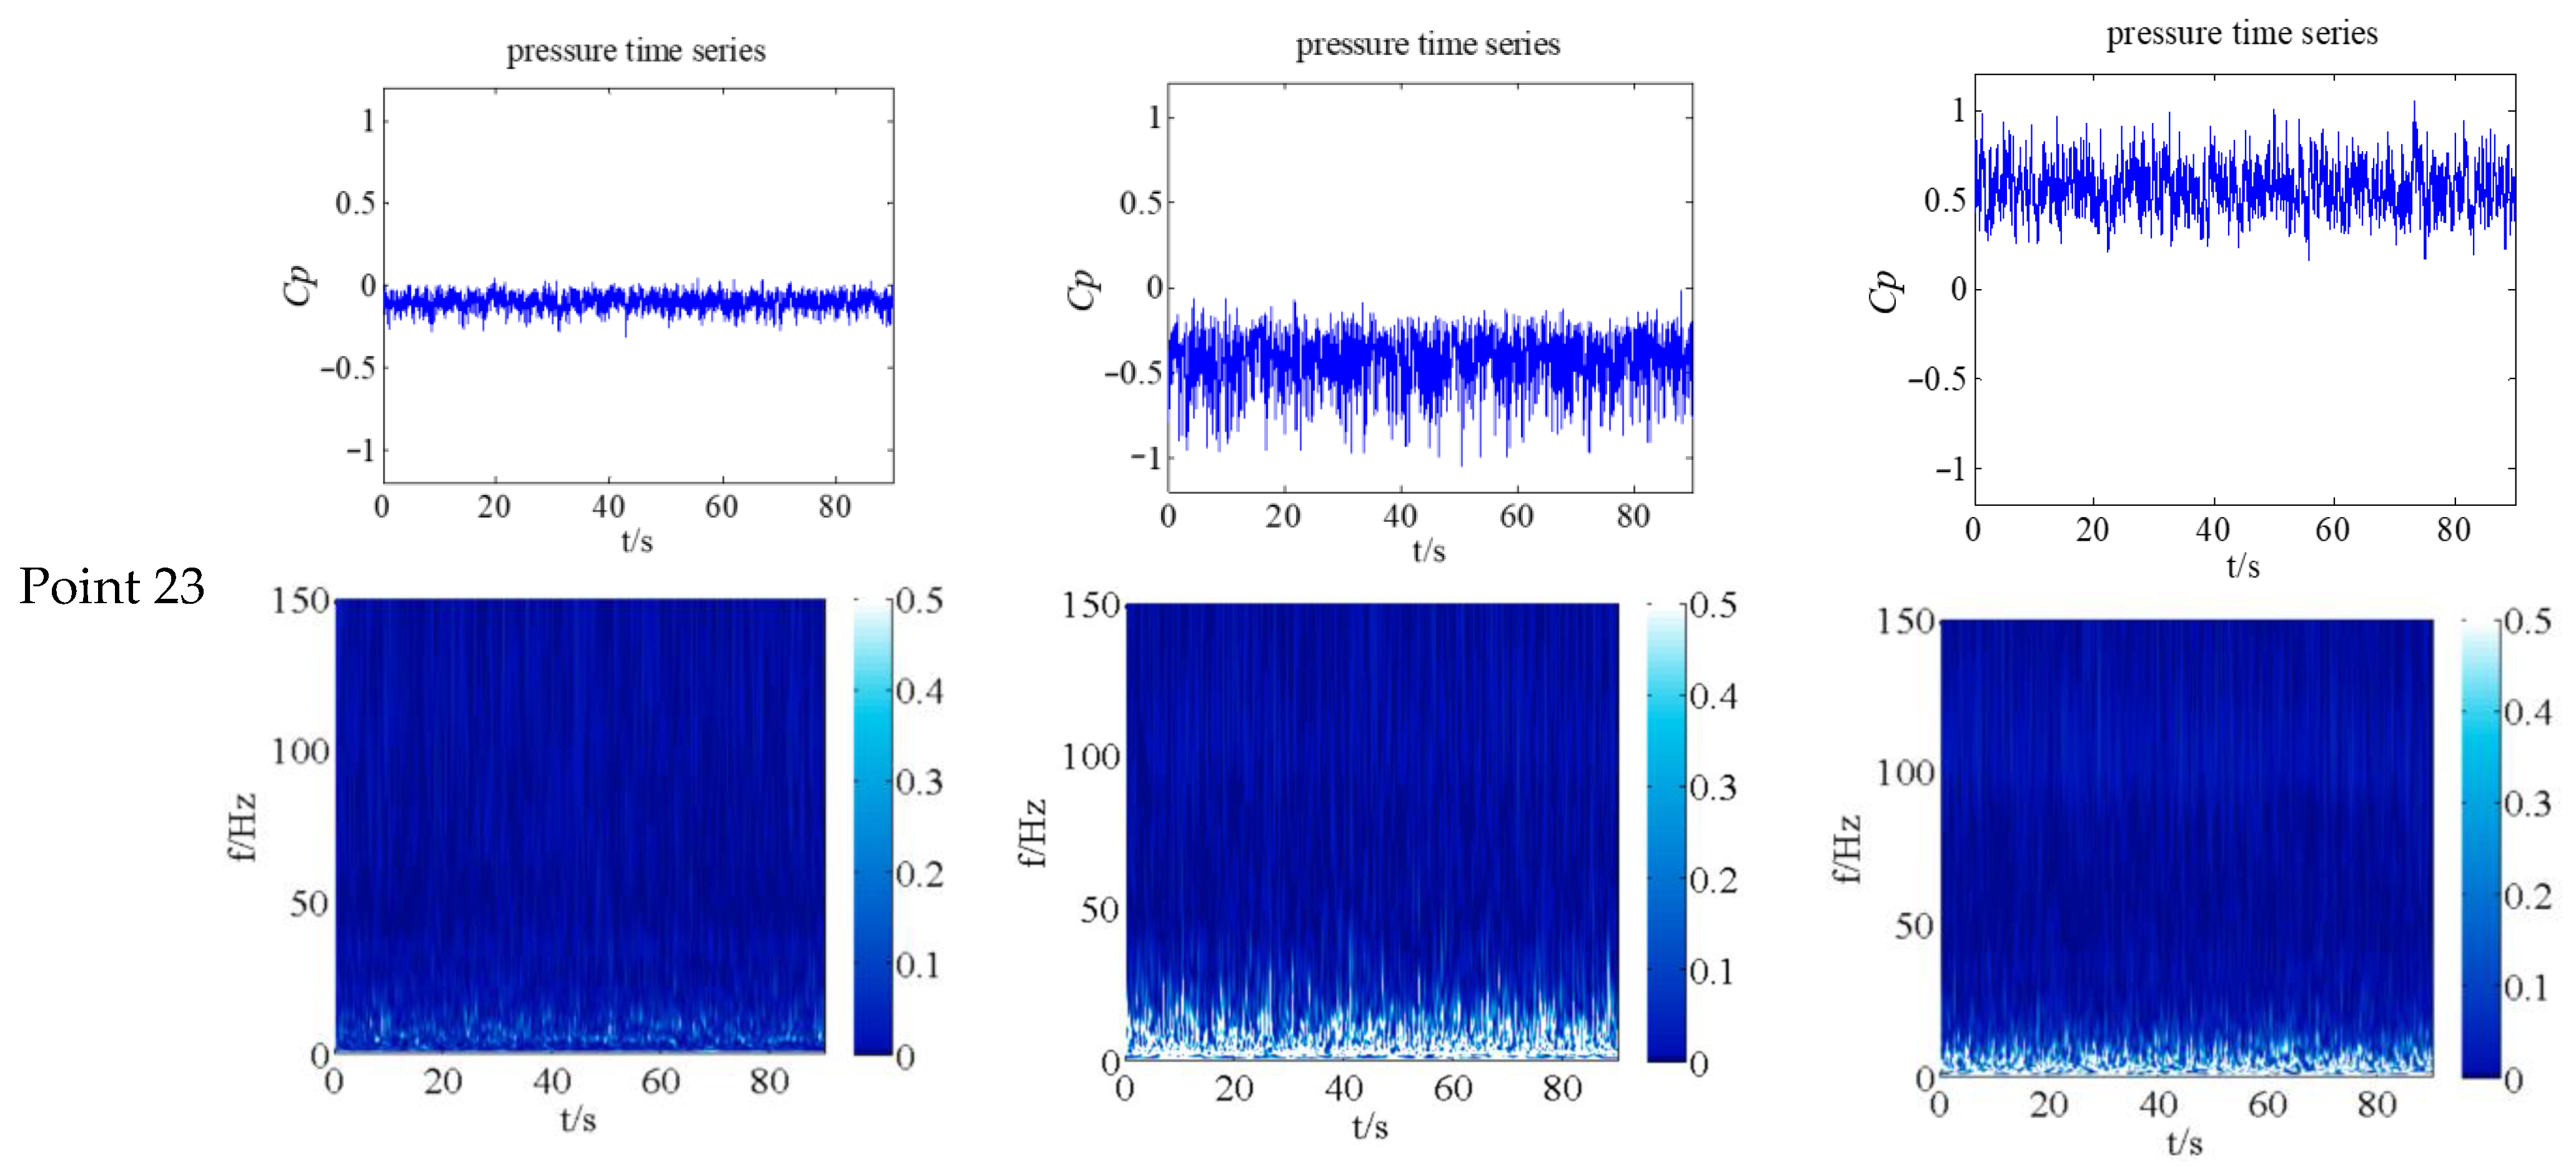
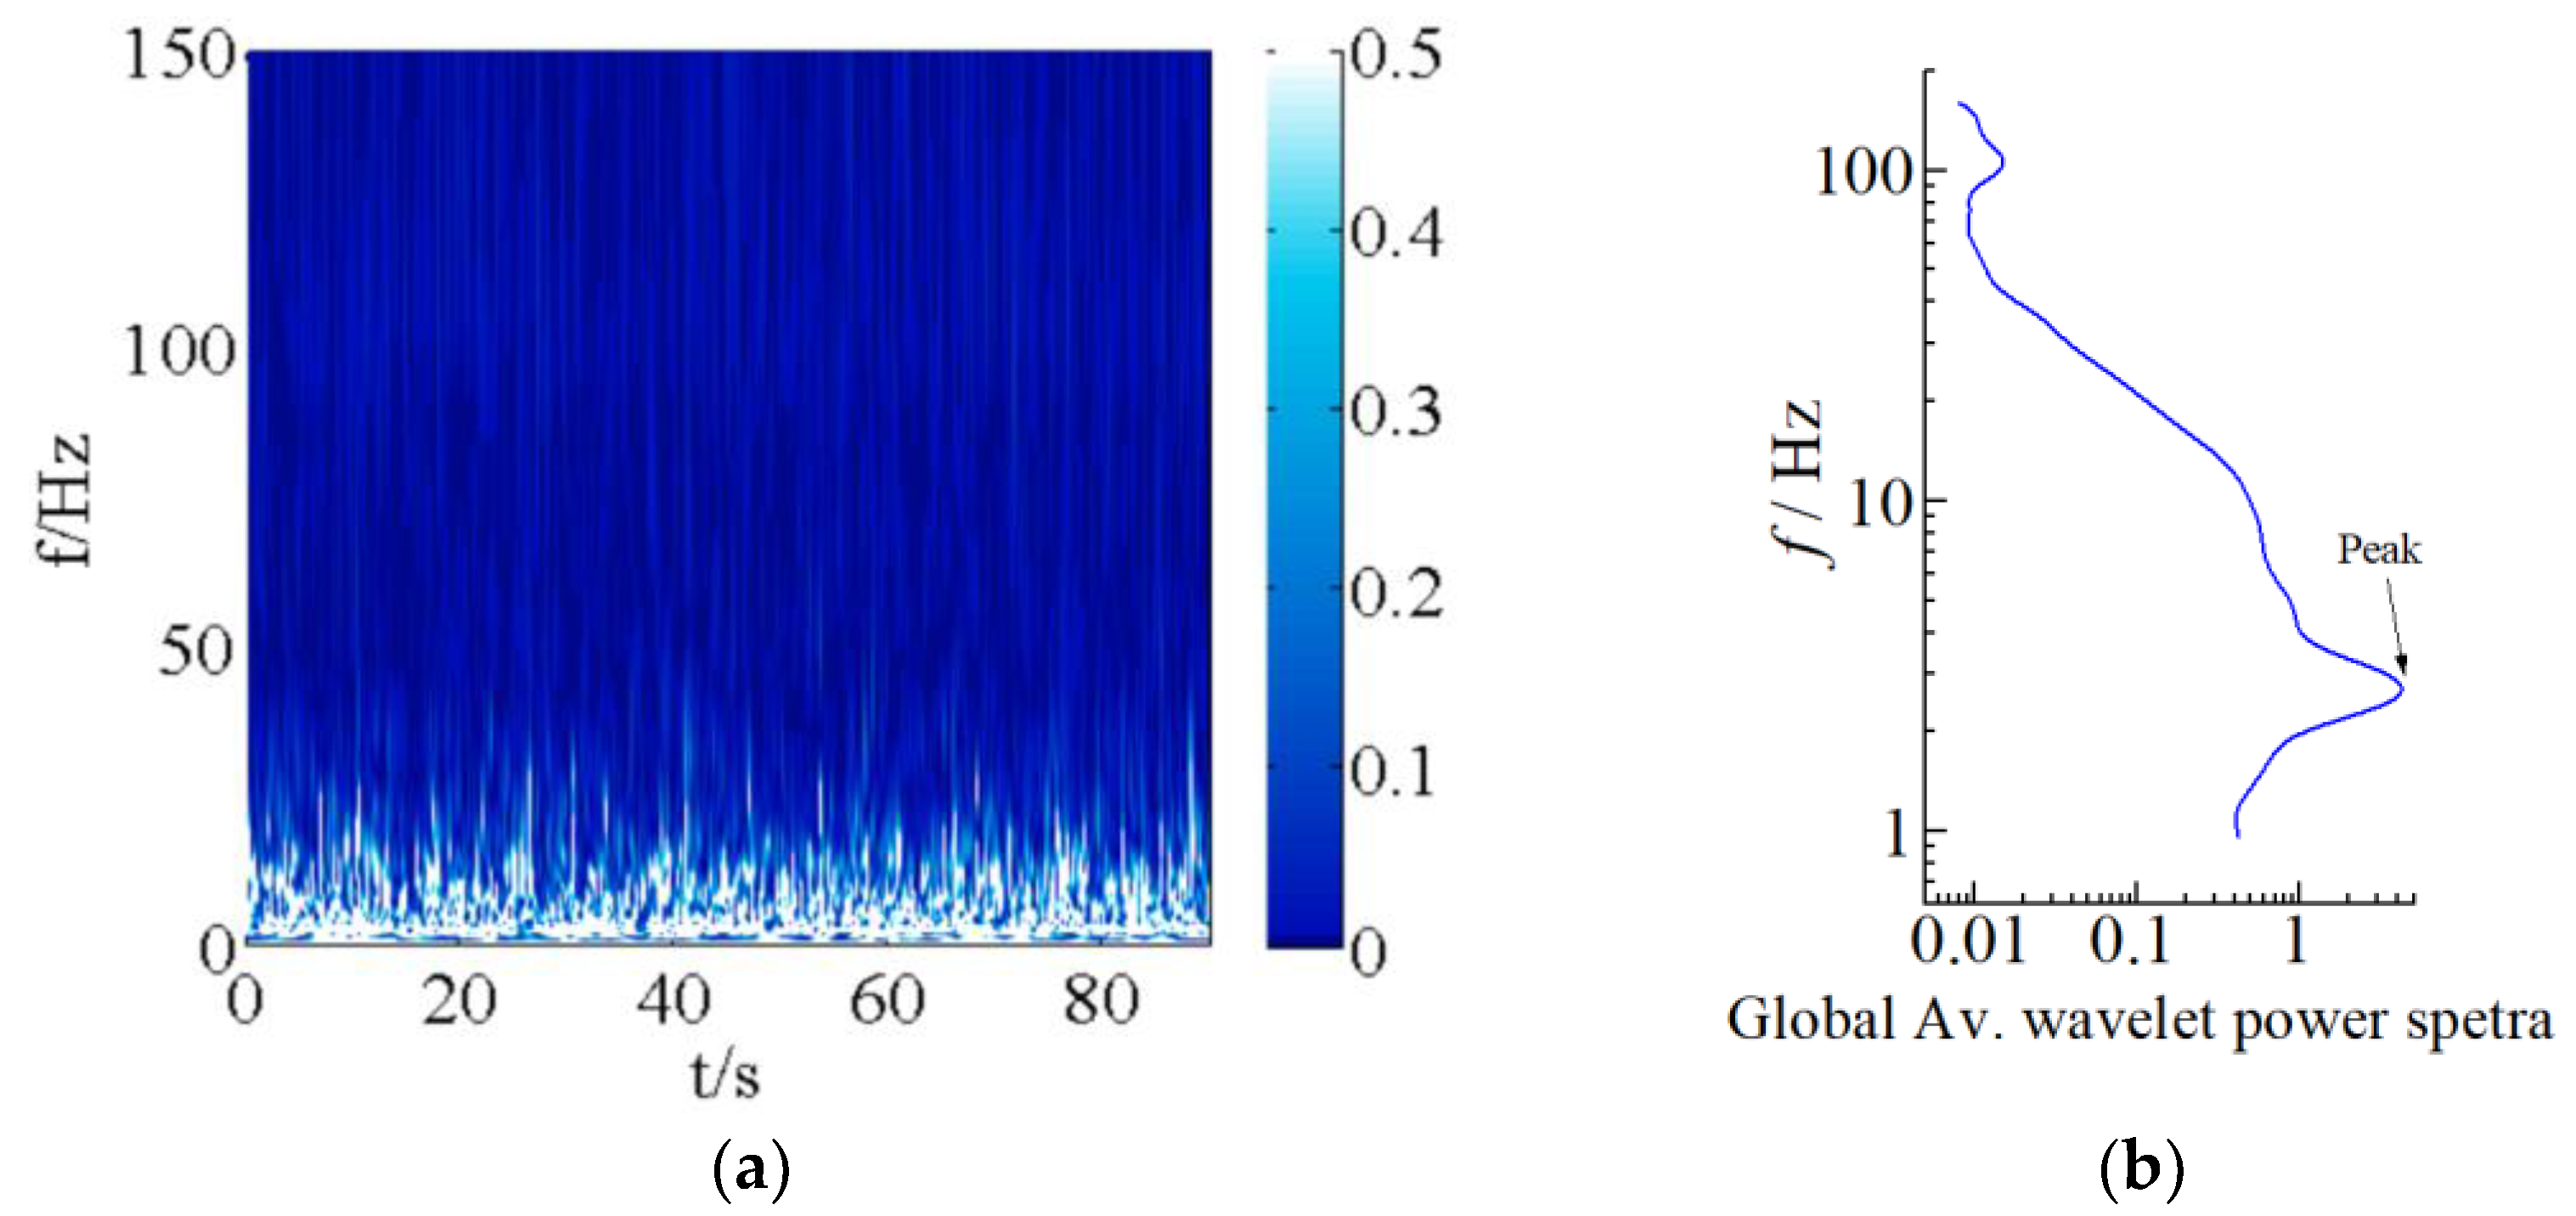
The wind pressure acting on the building surface shows significant unsteady pulsating characteristics with a low dominant frequency. The dominant frequency of the wind pressure fluctuation was obtained using wind power spectra analysis and is roughly 3 Hz. Moreover, compared to the calculated values for first-order natural frequencies of different building structures based on empirical formulas [3] (14.89 Hz for a masonry structure; 3.99 Hz for a reinforced concrete frame structure; 15.69 Hz for a reinforced concrete shear structure), it can be seen that the dominant frequency of the rigid building model is very similar to the empirical values, especially the frequency of the reinforced concrete frame structure. Extending this finding to actual engineering, this phenomenon would trigger the wind-induced vibration of the structure. Accurate estimation of wind pressure pulsation characteristics is the premise of research on the wind-induced vibrations of structures and the guarantee of wind safety calculations.
(c)
The DTC Initium electronic scanning pressure measurement system, a high-precision system with a resolution of ± 0.003%FS, was adopted in the research, ensuring the accuracy of the measurement results to a large extent. However, there are still some factors that have to be considered in the test, such as the accuracy of the wind incoming flow, errors in testing location markings on the building surfaces, and so on.

5. Conclusions

A wind pressure test on a reduced-scale model of a high-rise and slab-shaped building was carried out in this study. The study aims to explore the wind load characteristics of the building with various wind flow directions under uniform and boundary-layer inflow conditions, and the following conclusions can be drawn:
(a)
The influence of inflow conditions around the building on the wind pressure cannot be ignored. The wind pressure on the building under these two conditions varies obviously, and the boundary layer inflow condition can be recommended in comparison to the uniform inflow condition. The wind incoming condition should be accurately evaluated when wind resistance design is undertaken;
(b)
Attention should be paid to the influence of the building shape on the wind pressure distribution. When there are obvious concave and convex surfaces in the architectural design, as in the building in this study, a remarkable pressure gradient appears and relatively large negative wind pressure occurs even on the windward sides. This also highlights the significance of conducting the research on the impact of different wind directions;
(c)
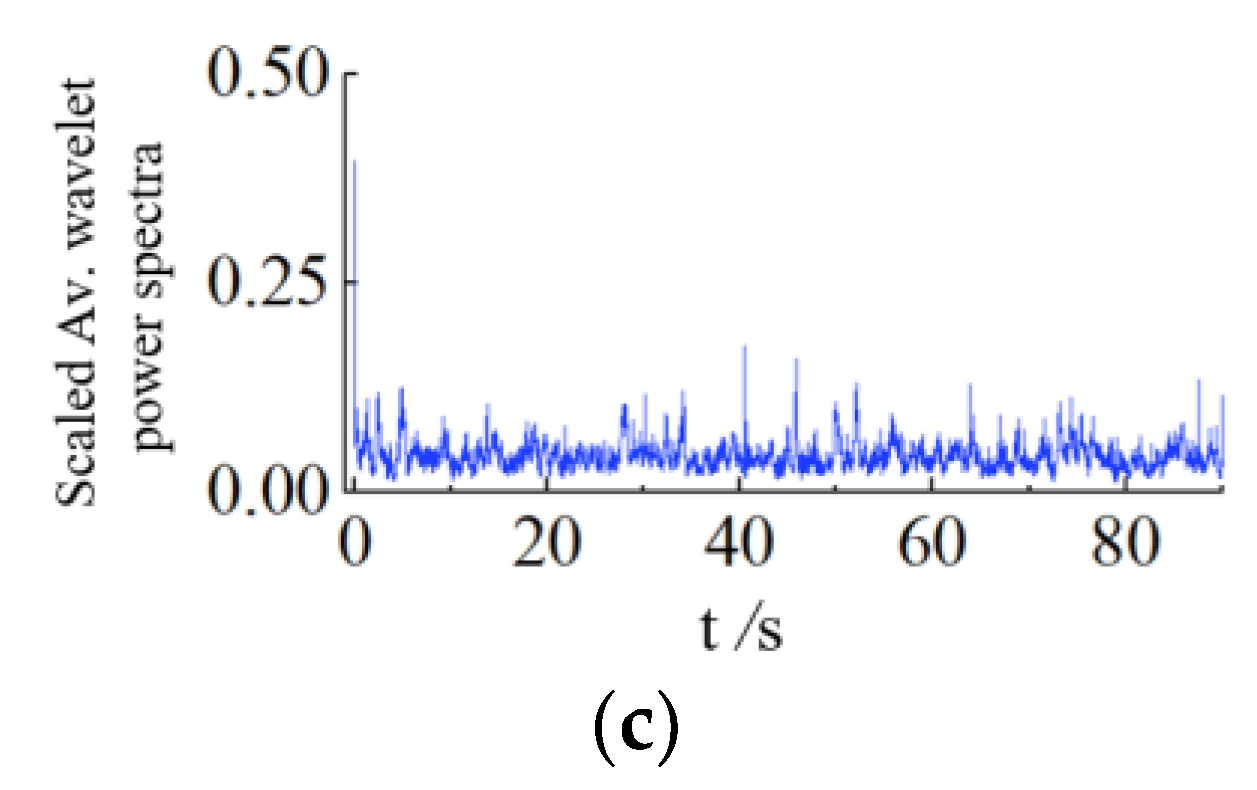
The wind pressure pulsates intensively, with the instantaneous pulsating energy changing significantly. This shows the unsteady nature of the wind loads acting on the building. Furthermore, the pulsations occur in the low-frequency band (0–50 Hz) and the global dominant frequency is found to be about 3 Hz. These characteristics may cause wind-induced structural vibration and should be considered during the design of buildings.
To sum up, this work quantitatively discusses the influence of different wind field conditions on the pressure loads of a building and provides a new understanding of the unsteady wind pressure characteristics of the building. To further investigate the mechanism behind the unsteady characteristics, more detailed flow visualization measurements should be carried out in future work.

Author Contributions

Conceptualization and methodology, Q.C.; software, X.Z.; validation, Q.C.; formal analysis, X.Z.; data management, X.Z.; writing—original draft preparation, Q.C.; writing—review and editing, Q.C. and X.Z. All authors have read and agreed to the published version of the manuscript.

Funding

The authors would like to acknowledge with great gratitude the support of the National Science Foundation of China (grant number: 52178510), Natural Science Foundation of Fujian Province (grant number: 2022J011254), the Young Teachers’ Education Science Research Project of Fujian (grant number: JAT190649), and the Scientific Research Projects of Xiamen University of Technology (grant number: XPDKQ18042).

Institutional Review Board Statement

Not applicable.

Informed Consent Statement

Not applicable.

Acknowledgments

Thanks to Torrence and Compo for sharing the Wavelet software, which is available at URL: http://paos.colorado.edu/research/wavelets/, accessed on 29 June 2022.

Conflicts of Interest

The authors declare no conflict of interest.

References

  1. Hunt, A. Wind-tunnel measurements of surface pressures on building models at several scales. J. Wind Eng. Ind. Aerodyn. 1982, 10, 137–163. [Google Scholar] [CrossRef]
  2. Zhang, J.W.; Li, Q.S. Wind tunnel test and field measurement study of wind effects on a 600m high-super-tall building. Struct. Des. Tall Spec. Build. 2017, 26, e1385. [Google Scholar] [CrossRef]
  3. GB 50009-2012; Load Code for the Design of Building Structures. China Building Industry Press: Beijing, China, 2012.
  4. Wu, X.; Li, Q.S.; Li, Y. Test on surface wind pressure distributions and wind load characteristics for complex shape high-rise building. J. Archit. Civ. Eng. 2014, 1, 76–82. [Google Scholar]
  5. Yang, C. Study on Characteristic of High-Rise Buildings Wind Load with Numerical Simulation of Wind Tunnel. Master’s Thesis, Huazhong University of Science and Technology, Wuhan, China, 2016. [Google Scholar]
  6. Li, H. Experimental study on wind pressure of tall building. J. Exp. Mech. 2000, 2, 157–162. [Google Scholar]
  7. Li, Q.S.; Fu, J.Y.; Xiao, Y.Q.; Li, Z.N.; Ni, Z.H.; Xie, Z.N.; Gu, M. Wind tunnel and full-scale study of wind effects on China’s tallest building. Eng. Struct. 2006, 28, 1745–1758. [Google Scholar] [CrossRef]
  8. Li, Q.S.; Li, Y.G.; Zhi, L.H. Experimental study on wind pressure distribution characteristics of typical high-rise residential buildings. J. Hunan Univ. (Nat. Sci. Ed.) 2011, 4, 14–19. [Google Scholar]
  9. Grossmann, A.; Morlet, J. Decomposition of hardy functions into square integrable wavelets of constant shape. SIAM J. Math. Anal. 1984, 15, 723–736. [Google Scholar] [CrossRef]
  10. Torrence, C.; Compo, G.P. A practical guide to wavelet analysis. Bull. Am. Meteorol. Soc. 1998, 79, 61–78. [Google Scholar] [CrossRef]
  11. Geurts CP, W.; Hajj, M.R.; Tieleman, H.W. Continuous wavelet transform of wind and wind-induced pressures on a building in suburban terrain. J. Wind Eng. Ind. Aerodyn. 1998, 74–76, 609–617. [Google Scholar] [CrossRef]
  12. Gurley, K.R.; Kareem, A. First- and higher-order correlation detection using wavelet transforms. J. Eng. Mech. 2003, 2, 188–201. [Google Scholar] [CrossRef]
  13. Kareem, A.; Kijewski, T. Time-frequency analysis of wind effects on structures. J. Wind Eng. Ind. Aerodyn. 2002, 90, 1435–1452. [Google Scholar] [CrossRef]
  14. Li, H.N.; Yi, T.H.; Wang, G.X. Wavelet analysis and its application in structural wind engineering. J. Vib. Shock. 2008, 9, 11–16. [Google Scholar]
  15. Yamada, M.; Ohkitani, K. Orthonormal wavelet analysis of turbulence. Fluid Dyn. Res. 1991, 8, 101–115. [Google Scholar] [CrossRef]
  16. Zeldin, B.A.; Spanos, P.D. Random field representation and synthesis using wavelet bases. J. Appl. Mech. 1996, 63, 946. [Google Scholar] [CrossRef]
  17. Hajj, M.R.; Tieleman, H.W. Application of wavelet analysis to incident wind in relevance to wind loads on low-rise structure. Trans. ASME 1996, 128, 874–876. [Google Scholar] [CrossRef]
  18. Hajj, M.R.; Jordan, D.A.; Tieleman, H.W. Analysis of atmospheric wind and pressures on a low-rise building. J. Fluids Struct. 1998, 12, 537–547. [Google Scholar] [CrossRef]
  19. Jordan, D.A.; Hajj, M.R.; Tieleman, H.W. Wavelet analysis of the relation between atmospheric wind and pressure fluctuations on a low-rise building. J. Wind Eng. Ind. Aerodyn. 1997, 69, 647–655. [Google Scholar] [CrossRef]
  20. Dunyak, J.; Gilliam, X.; Peterson, R.; Smith, D. Coherent gust detection by wavelet transform. J. Wind Eng. Ind. Aerodyn. 1998, 77–78, 467–478. [Google Scholar] [CrossRef]
  21. Zhao, Y.; Cao, S.; Wu, Y.; Yukio, T.; Ozono, S. Comparison of several non-stationary methods for analysis of time history of non-stationary wind pressure. J. China Civ. Eng. 2011, 44, 51–57. [Google Scholar]
  22. Wang, H.; Xu, Z.; Teng, W.; Mao, J. Evolutionary power spectral density of recorded typhoons at Sutong Bridge using harmonic wavelets. J. Wind Eng. Ind. Aerodyn. 2018, 177, 197–212. [Google Scholar] [CrossRef]
  23. Pettit, C.L.; Jones, N.P.; Ghanem, R. Detection and simulation of roof-corner pressure transients. J. Wind Eng. Ind. Aerodyn. 2002, 90, 171–200. [Google Scholar] [CrossRef]
  24. Huang, X.; Gu, M. Wavelt analysis of pressure fluctuations on cantilevered arc roofs. J. Tongji Univ. (Natl. Sci.) 2008, 36, 586–591. [Google Scholar]
  25. Le, T.; Matsumoto, M.; Shirato, H. Spanwise coherent structure of wind turbulence and induced pressure on rectangular cylinders. Wind Struct. 2009, 12, 441–455. [Google Scholar] [CrossRef]
  26. Le, T.; Caracoglia, L. Rectangular prism pressure coherence by modified Morlet continuous wavelet transform. Wind. Struct. 2015, 20, 661–682. [Google Scholar] [CrossRef]
  27. Le, T.H.; Tamura, Y.; Matsumoto, M. Spanwise pressure coherence on prisms using wavelet transform and spectral proper orthogonal decomposition based tools. J. Wind Eng. Ind. Aerodyn. 2011, 99, 499–508. [Google Scholar] [CrossRef]
  28. Shen, J.; Li, C. Wavelet analysis for coherence of full-scale measured wind pressure on a super tall building. J. Vib. Shock. 2010, 29, 162–168. [Google Scholar]
  29. Jin, M.; Li, C. Non-Stationary Wind pressure prediction based on a hybrid decomposition algorithm of wavelet packet decomposition and variational mode decomposition. IOP Conf. Ser. Earth Environ. Sci. 2018, 189, 52038. [Google Scholar] [CrossRef]
  30. Karimpour, A.; Rahmatalla, S. Extended empirical wavelet transformation: Application to structural updating. J. Sound Vib. 2021, 500, 116026. [Google Scholar] [CrossRef]
  31. Hnaien, N.; Hassen, W.; Kolsi, L.; Mesloub, A.; Alghaseb, M.A.; Elkhayat, K.; Abdelhafez, M.H.H. CFD Analysis of Wind Distribution around Buildings in Low-Density Urban Community. Mathematics 2022, 10, 1118. [Google Scholar] [CrossRef]
  32. Liu, Y.G.; Liang, X.S.; Weisberg, R.H. Rectification of the bias in the wavelet power spectrum. J. Atmos. Ocean. Technol. 2007, 24, 2093–2102. [Google Scholar] [CrossRef]
  33. Ye, F.; Gu, M. Frequency characteristics of wind pressure on super-tall buildings. J. Tongji Univ. 2006, 34, 285–290. [Google Scholar]
Figure 1. Arrangement of test points on the building model: (a) high-rise building model; (b) horizontal layer of the building; (c) four facades of the building.
Processes 10 01645 g001aProcesses 10 01645 g001b
Figure 2. Wind fields in the wind tunnel: (a) Schematic diagram of the wind tunnel (b) uniform inflow condition in the wind tunnel without rough elements or wedges; (c) atmospheric boundary layer flow condition in the wind tunnel with rough elements and wedges; (d) wind speed profile and the turbulence intensity profile in the wind tunnel; (e) turbulent wind power spectrum of the incoming flow in the wind tunnel.
Processes 10 01645 g002aProcesses 10 01645 g002b
Figure 3. Schematic diagram of wind direction angle in the wind tunnel test.
Processes 10 01645 g003
Figure 4. Variations in the average wind pressure coefficient Cpmean for building surfaces with increasing height. (ad) Uniform flow (UF); (eh) boundary layer (BL) (φ = 90°, v = 10 m/s).
Processes 10 01645 g004aProcesses 10 01645 g004b
Figure 5. (a) Horizontal layers in three-dimensional diagram; (b) point No. at each horizontal layer (taking layer H as an example).
Processes 10 01645 g005
Figure 6. Variations in average wind pressure coefficient Cpmean for building surfaces with changing wind directions: (ac) uniform flow (UF); (df) boundary layer (BL).
Processes 10 01645 g006aProcesses 10 01645 g006b
Figure 7. Morlet wavelet transform of wind pressure time-history in the boundary layer flow: (a) φ = 0°; (b) φ = 90°; (c) φ = 180°.
Processes 10 01645 g007aProcesses 10 01645 g007b
Figure 8. Wavelet power spectra over time-frequency (point 23 on layer H with a wind direction of 90°). (a) Wavelet transform of point 23; (b) global averaged spectrum of (a) in frequency domain; (c) scaled averaged spectrum of (a) in time domain.
Processes 10 01645 g008aProcesses 10 01645 g008b
Table 1. Test cases.
Inflow Condition in the Wind TunnelWind Speeds
v (m/s)
Wind Directions φ
UF100°, 15°, 30°, 45°, 60°, 75°, 90°, 105°,
BL120°, 135°, 150°, 165°, 180°
UF, uniform incoming flow; BL, boundary layer incoming flow.
Publisher’s Note: MDPI stays neutral with regard to jurisdictional claims in published maps and institutional affiliations.

