Article

Determination of Gas Extraction Borehole Parameters in Fractured Zone on ‘Borehole in Place of Roadway’ Based on RSM-GRA-GA

1
Key Laboratory of Deep Coal Resource, Ministry of Education of China, China University of Mining & Technology, Xuzhou 221116, China
2
School of Mines, China University of Mining & Technology, Xuzhou 221116, China
3
Production Technology Department, Shanxi Lu’an Mining Group Cilinshan Coal Industry Co., Ltd., Changzhi 046000, China
*
Authors to whom correspondence should be addressed.
Processes 2022, 10(7), 1421; https://doi.org/10.3390/pr10071421
Submission received: 4 July 2022 / Revised: 14 July 2022 / Accepted: 18 July 2022 / Published: 21 July 2022

Abstract

:
Large-diameter gas extraction borehole is considered an effective method by which to realize coal mine methane exploitation and outburst prevention. Efficient gas extraction can be achieved by selecting the right borehole parameters. In this paper, by comparing several conventional objective weighting methods, the PCA was used to assign the weights to the research indices, the optimization objective was reduced from multi-dimensional to one-dimensional with the help of the gray correlation analysis. The study of gas extraction effect under different borehole parameters based on the response surface model. Numerical simulations were used to analyze the mixed volume of gas extraction, the pure volume of extraction and the concentration in the upper corner after extraction under different schemes. Finally, a genetic algorithm degree model was used to solve the solution and determine the optimal arrangement of borehole parameters. The study shows that (1) the weight shares of borehole stratum, borehole diameter and borehole spacing were 0.385, 0.285 and 0.33, respectively, in the reduced dimensional analysis of the PCA. (2) Using the results of improved gray correlation analysis as a comprehensive evaluation value to measure the effect of gas extraction, the optimal range of the model was 28–30 m borehole level, 190–210 mm borehole diameter and 5.5–6.5 m borehole spacing. (3) Using the genetic algorithm to solve the model, we obtained the borehole layer 28.79 m, borehole diameter 199.89 mm, borehole spacing 5.76 m. The borehole gas extraction effect was good under this parameter. The extraction mixed volume was 129.8 m3/min, the extraction pure volume was 9.16 m3/min, the upper corner concentration was 0.52%, and the prediction accuracy of the model was 97.8%.

1. Introduction

Gas has always been one of the major safety hazards in coal mines. According to incomplete statistics, China’s mines with the threat of gas disasters account for about one-third of the number of coal mines and total production capacity in China [1,2,3,4]. China’s high gas content and coal and gas outburst mines are numerous and widely distributed, totaling more than 3200, and mainly located in the southwest and central east of China. Using borehole to extract gas is the main way of underground gas disaster management and coal bed methane development in coal mines [5,6,7]. The use of boreholes for gas extraction has the advantages of flexible form, low cost, wide adaptability, and it can realize the advantages of simultaneous construction of boreholes and coal mine production, etc., and it has occupied the main mine gas extraction management mode in recent years [8,9]. Reasonable gas extraction borehole can significantly reduce the concentration of gas in the coal seam and the upper corner, which is important for the prevention and control effect of coal and gas outburst [10,11,12]. It is confirmed that with better borehole construction technology, large-diameter extraction borehole can replace the high drainage tunnel and bottom drainage tunnel to control gas, forming a ‘borehole in place of roadway’ gas efficient extraction management mode.
Based on the selection of reasonable parameters of gas extraction borehole, through the study of overburden development, breakage distance, ‘O’ circle and other factors, and the upper corner gas concentration, extraction concentration and other indicators [13,14,15], many scholars at home and abroad have proposed the corresponding methods. An, FH [16] et al. conducted a study on directional borehole for gas extraction from the upper and lower adjacent layers, which broadened the scope of application of directional borehole. Cheng, C [17] et al. used COMSOL (version 5.4, China) finite element software to simulate the distribution law of unloading gas in the mining area under the influence of mining and designed reasonable parameters for high directional borehole in the mining area. The research results provide a reference for studying the evolution law of overburden fracture and gas transportation in the mining area under the influence of mining and provide a basis for high borehole to reduce the gas concentration in the upper corner and return air flow. Li, H [18] et al. compared multiple methods of gas extraction in the unloading zone of the extraction area, and the results provided a basis for oversized diameter topside directional borehole instead of high-level borehole. Ji, M [19] et al., taking different drainage time periods in various positions of drainage holes into consideration, combined with the advanced situation of the 1207 working face in the Sima Coal Mine, a mixed layout gas drainage scheme featured with the effective borehole spacing was obtained through the COMSOL Multiphysics simulation. Wang, W [20] et al., according to the obtained goaf parameters, the distribution and migration law in the goaf under the conditions of the initial state and extraction with different roof borehole parameters were simulated by the FLUENT software. Luo, M [21] et al. studied the included angle between the borehole and the roadway middle line, determined the spatial area of gas drainage. A too small included angle will reduce the area of gas content reduction, while a too large included angle will result in a blind area on both sides of the roadway. The change in borehole spacing affects the decreasing rate of gas content in the rock and coal around the roadway. Liu J [22] et al. simulated the ground extraction drilling position in the goaf (the distance from the top of the coal seam and the distance from the return to the wind) and defined the final hole of the ground extraction hole in the goaf is 16 m from the roof of the coal seam, and the distance from the return air is 45 m, the extraction effect was optimal.
The research results of the above scholars have greatly enriched the law of influence of borehole parameters on the gas extraction effect, but there is no consistent evaluation index for measuring the gas extraction effect under the combined influence of multiple borehole parameters, so this paper takes three basic borehole parameters, namely, borehole horizon (H), borehole diameter (D) and borehole spacing (S) as the influencing factors, and the mixed amount of gas extraction (M), pure amount of gas extraction (P) and upper corner concentration (C) as measuring the gas extraction effect index, and it designs the three factors and three levels of the response surface model, using principal component analysis to assign weights to the three objectives to achieve improved gray correlation analysis, reduce the multi-objective optimization problem of the gas extraction effect to a single objective optimization problem, and finally, seek further optimization of extraction parameters with the help of the genetic algorithm, which is conducive to the comprehensive improvement of the gas extraction effect.

2. Mechanism of Gas Extraction by ‘Borehole in Place of Roadway’

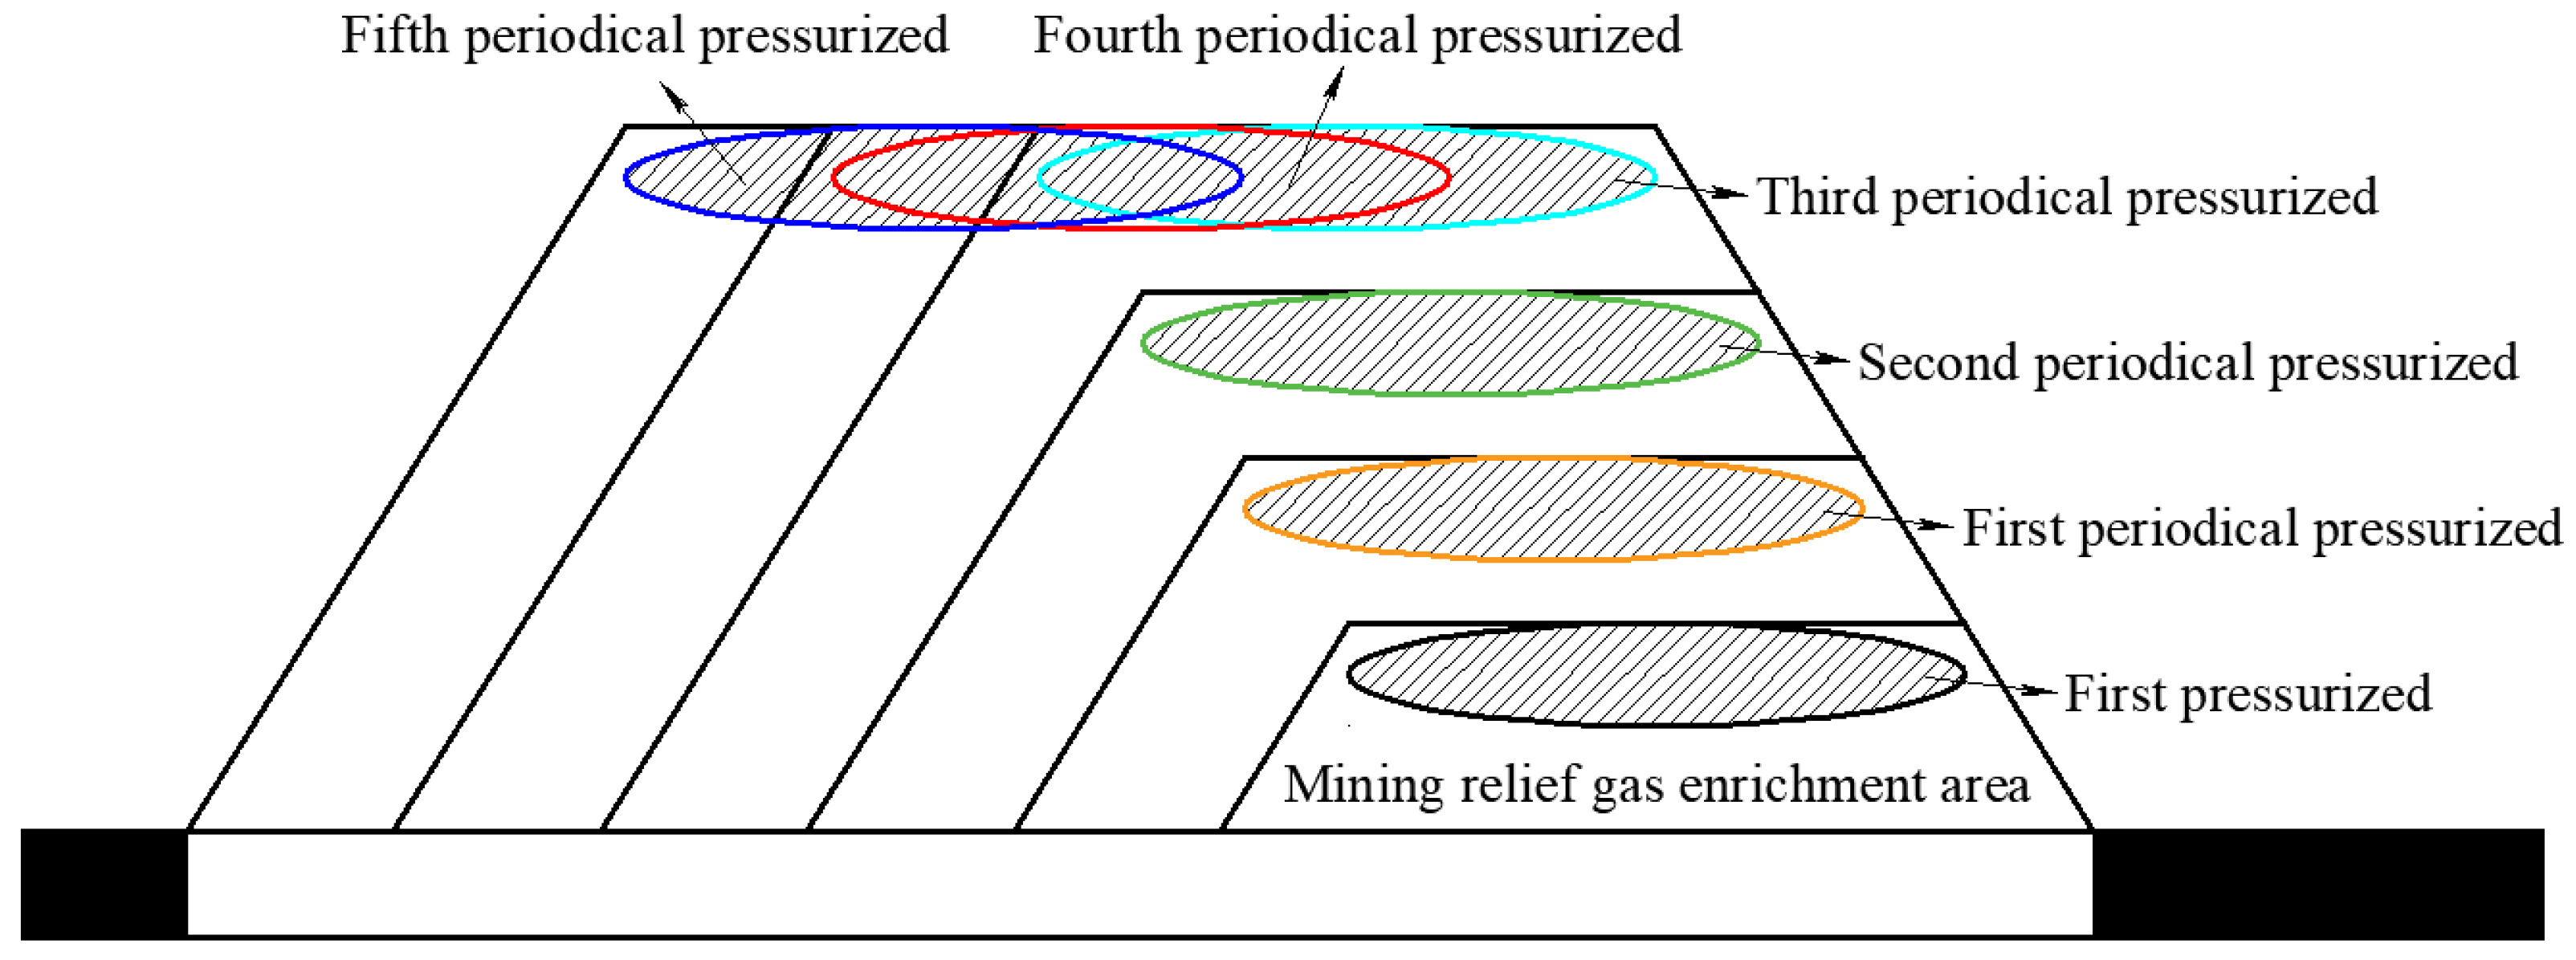
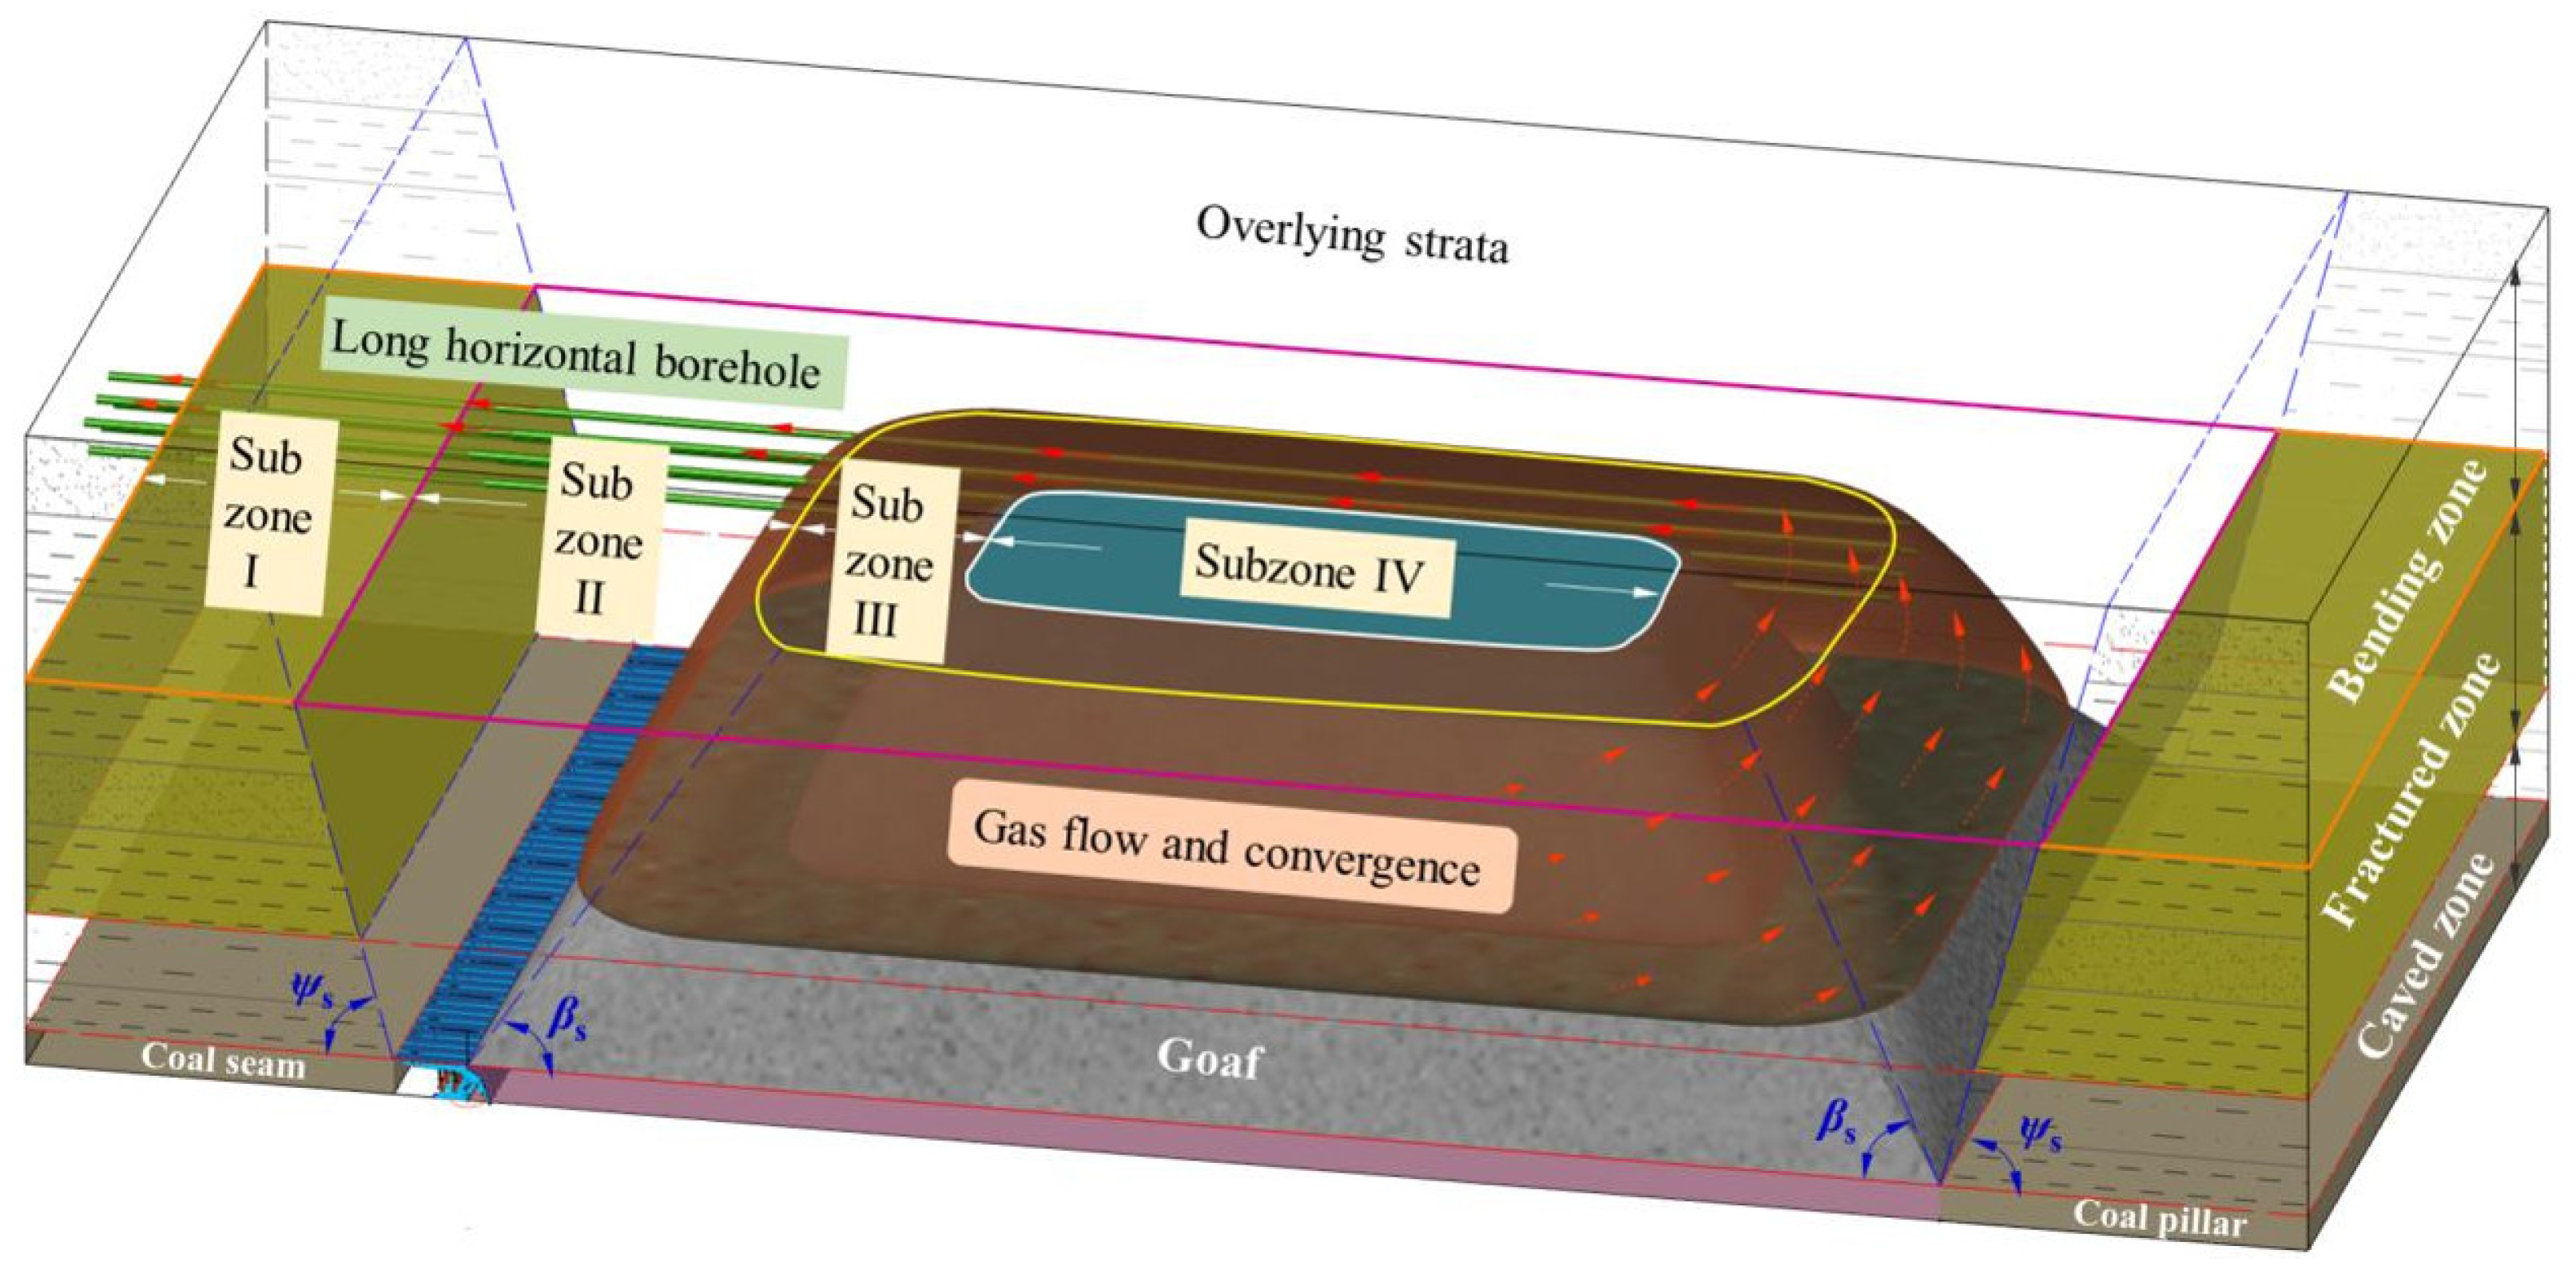
2.1. Formation Mechanism and Migration Law of Dominant Channels for Gas Extraction

The distribution characteristics of the overburden mining fractures directly determine the storage and transportation channels for unloading gas [23]; therefore, the extraction and unloading gas enrichment zones are constantly changing according to the evolution of the overburden mining fractures, during which the extraction and unloading gas enrichment zones will be formed within the overburden mining fracture network [24]. The evolution of the extraction and unloading gas enrichment zone will directly affect the extraction and utilization of unloading gas; therefore, one of the keys to the efficiency of extraction and unloading gas extraction is to determine the location of the extraction and unloading gas enrichment zone [25]. Combined with the process of stress changes along the strike and inclination of the slowly inclined seam, it can be seen that as the working face continues to advance, the working face will continue to form mining unloading gas [26], at which time the unloading gas will be stored and transported with the overburden mining fractures, as shown in Figure 1.
The working face will be broken continuously in the process of advancing in the direction of the formation of periodic to pressure and overburden mining fissures [27,28]. At this time, the top of the overburden mining fissure area will form an off-layer zone. At this time, the gas will unload through the off-layer zone below the penetration fissures for floating diffusion. With the overburden mining fissures continuing to develop, they will form in the direction of the ‘mining fissure rounded rectangular terrace belt’. The process of unloading gas will continue to enrich the terrace belt, and along with the terrace belt, the evolution to the top of the fractured zone will continue.
Gas extraction boreholes should be arranged along the strike in the hillside area of the structural fracture zone [29]. The division of mining-induced fracture zone in the overburden and the directional borehole layout are shown in Figure 2.

2.2. Spatio-Temporal Evolution of Gas Migration in Goaf

The overlying regular moving zone of the quarry produces delamination during the sinking process due to the discontinuity of the deformation of each rock layer, forming delaminated fractures, while a large number of breakage fractures was produced by the action of tensile stress. According to the definition of the void ratio, Formulae (1) and (2) can be given to calculate the void ratio within the range of two adjacent rock layers, respectively.
φ i , i + 1 = Δ w k i d x d y Δ h i d x d y = w k i w k i + 1 h i h i + 1
ϕ i , i + 1 = V v o i d V a r e a = 0 L s l y / 2 l y / 2 Δ w k i d x d y + u i Δ h i L s l y Δ h i = 0 L s l y / 2 l y / 2 ( w k i w k i + 1 ) d x d y L s l y ( h i h i + 1 ) + u i L s l y
where w stands for the amount of subsidence distributed by the basic roof along the central axis of the goaf floor strike, h stands for the thickness of the immediate roof, L stands for the distance of the advanced working face, l stands for the length of the main roof.

2.3. Mathematical Model of Gas Seepage in Roof Fracture Field

A long borehole is drilled into the roof overburden that meets the assumptions, and the length of the unit micro-element section of the borehole, dx, is taken as the object of study for planar radial seepage. The parameters of the roof overburden and the borehole are as follows: the permeability of the roof overburden is K, the negative extraction pressure of the borehole is p1, the gas pressure within the roof overburden is p0, and the gas viscosity of the gas is μ. The radius of the roof overburden is assumed to be r0, the radius of the extraction borehole is r1, and the length is L. The model is shown in Figure 3.

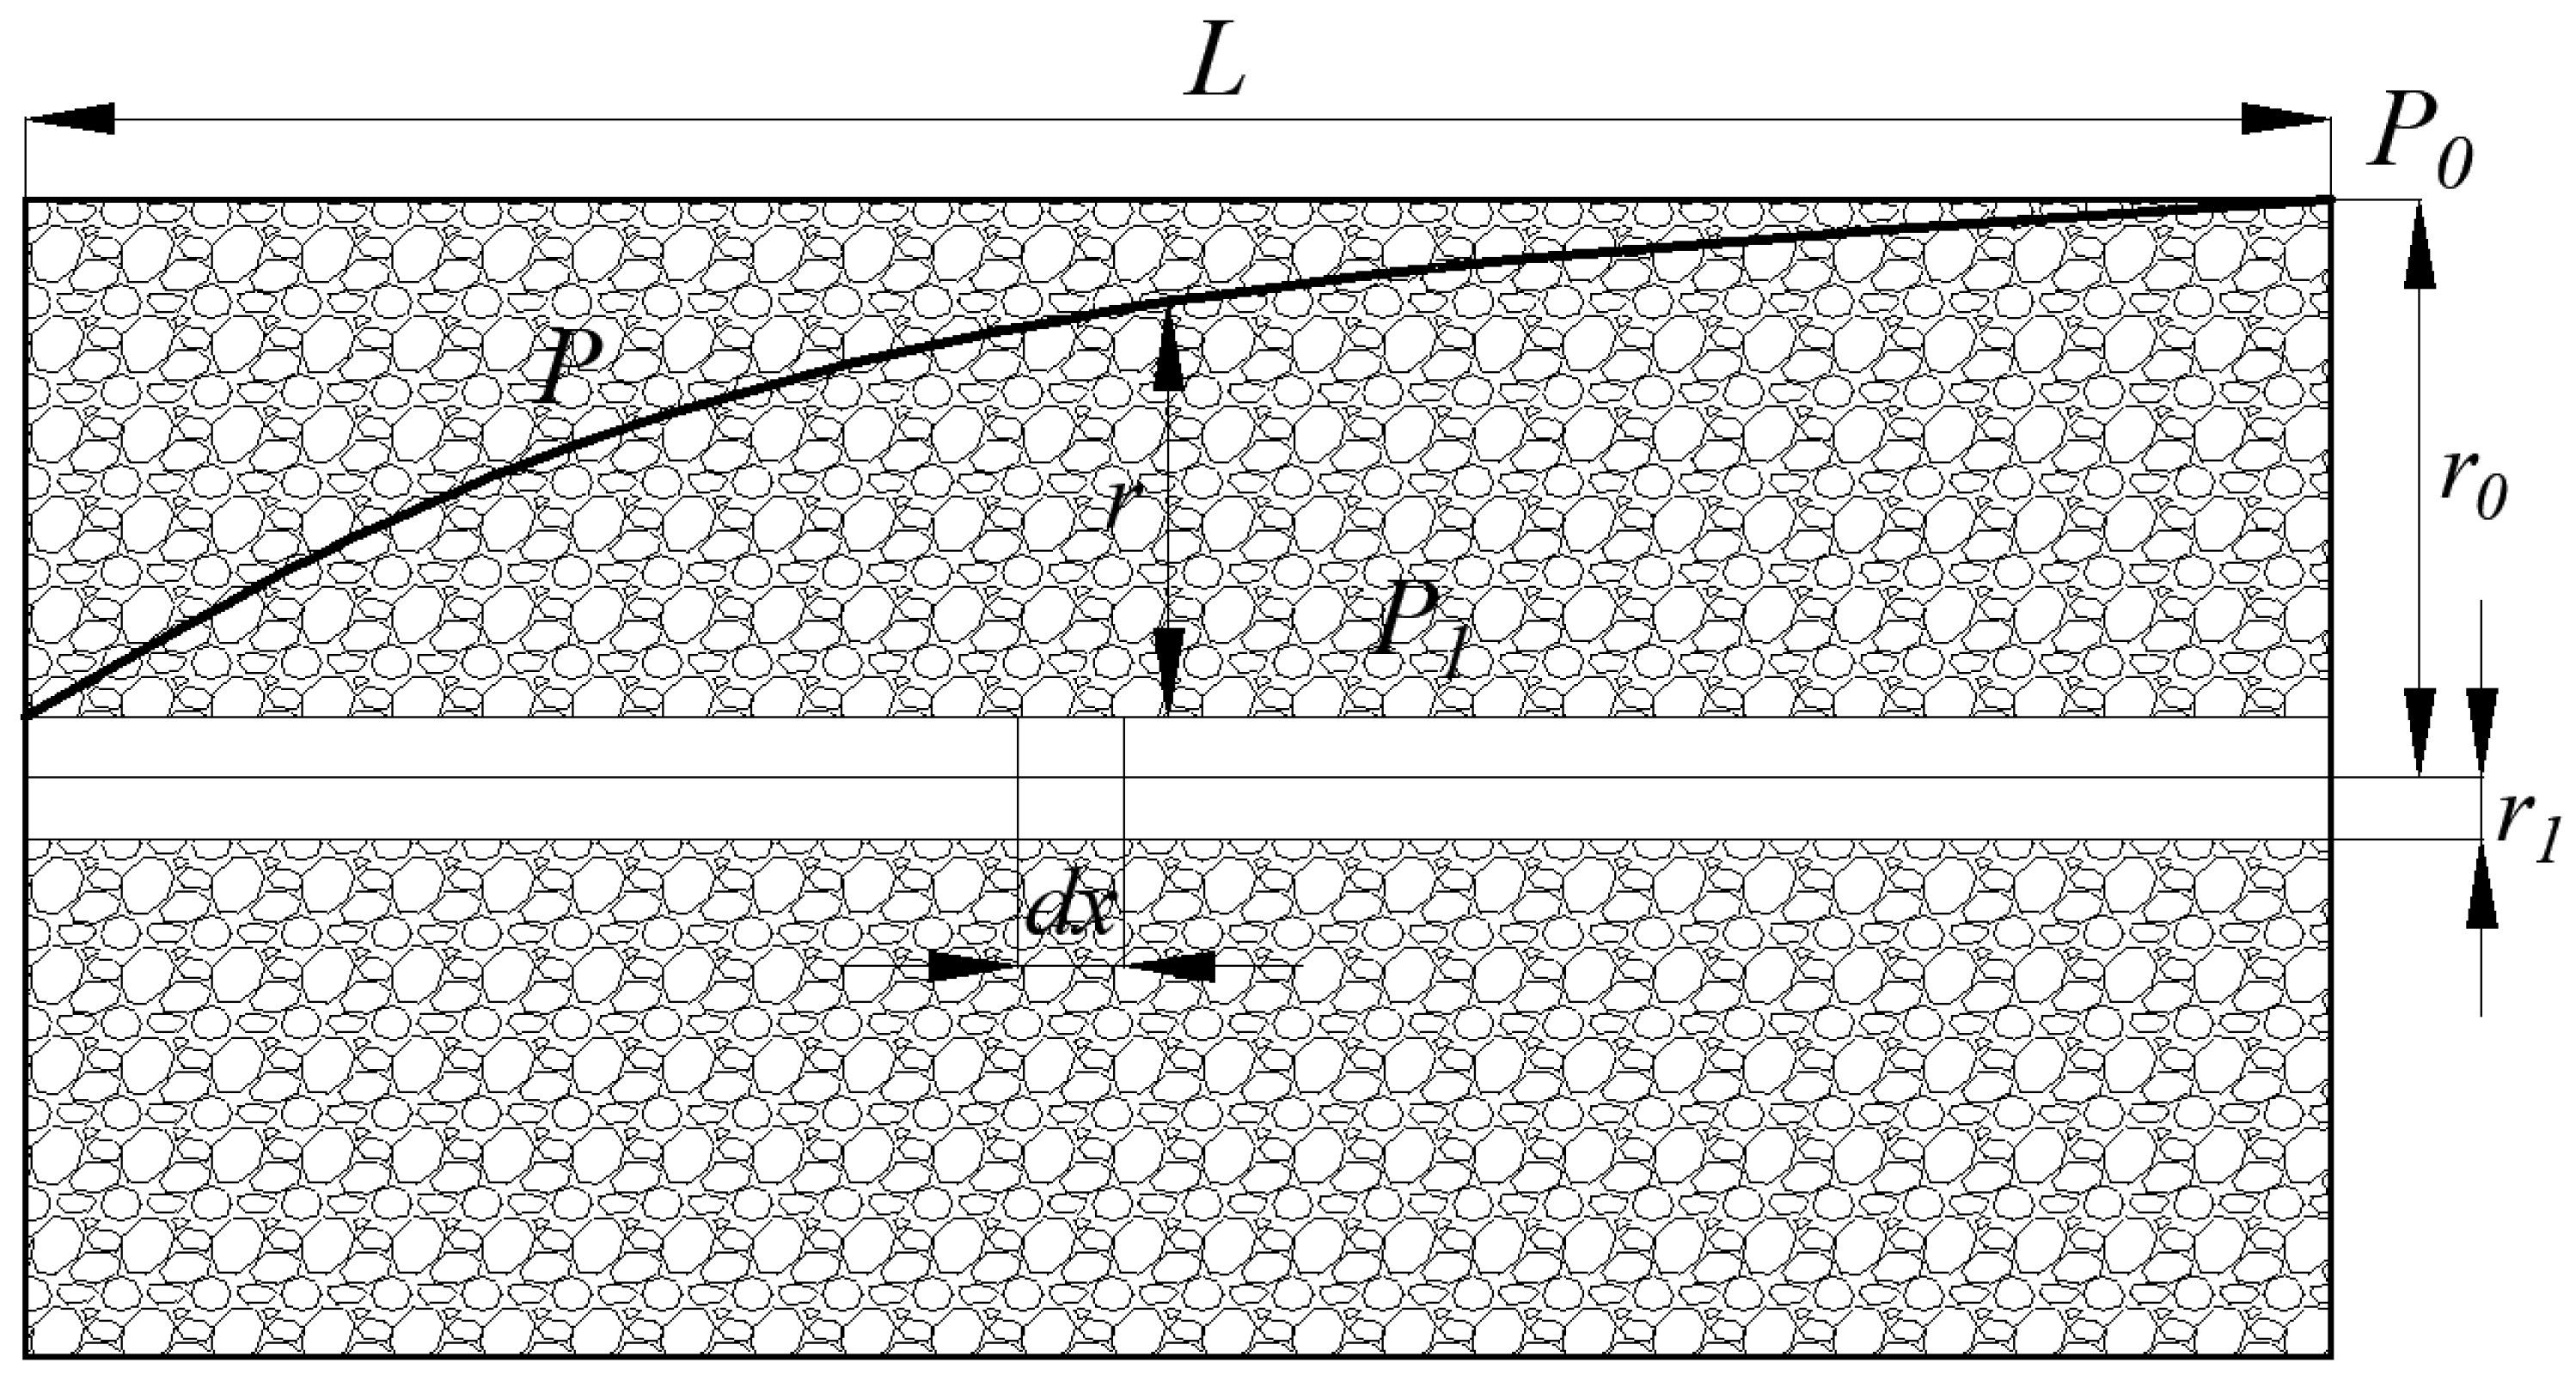
2.3.1. Equation of Gas Extraction from Single Borehole

The formula of seepage motion obtained by Darcy’s law is
v = K μ p r
where v stands for the gas seepage velocity, where K stands for the roof slab fracture field permeability, where μ stands for the gas power viscosity, where ∂p/∂r stands for the pressure gradient along the radial direction of the borehole.
( ϕ γ ) t + ( γ v ) = 0
where γ stands for the gas severity, where t stands for the time.
The pressure at any point in the overburden of the roof can be found by substituting the known boundary conditions as follows:
P = P 1 + P 0 P 1 I n r 0 r 1 I n r r 1
where P stands for the gas pressure at any point in the fissure zone of the overburden roof, P0 stands for the original gas pressure in the goaf, P1 stands for the negative pressure of drainage inside the borehole, r0 stands for the radius of the roof overburden fracture zone, r1 stands for the radius of the borehole, r stands for the distance from any point to the center of the borehole.
The amount of gas flowing radially into the borehole from the plane of the borehole during gas extraction is then equal to the amount of gas flowing out of the micro-element section, which is Formula (6).
d [ q ( x ) ] d x = Q ( x )
where q stands for the gas flow rate of the goaf fracture zone gas entering the borehole, Q stands for the amount of gas extracted from the borehole.
Substitution of Formula (3) into Formula (6) gives the gas extraction from a single borehole under steady-state seepage, as in Formula (7).
Q = 2 π L K ( p 0 p 1 ) μ I n r 0 r 1

2.3.2. Analysis of Influencing Factors of Gas Extraction Effect by ‘Borehole in Place of Roadway’

(1)
Borehole horizon
The borehole is arranged in the upper part of the fissure zone, which can pump a high concentration of gas, but the effect is not good; the arrangement in the lower part of the middle can effectively bar the gas that surges to the upper corner but is affected by the leakage of wind from the fallen zone, and the concentration of the pumped gas is low. In order to ensure that the gas in the upper corner does not exceed the limit, several fissure zone extraction holes should be arranged near the corner of the working face, i.e., in the middle and lower part of the fissure zone.
(2)
Borehole diameter
By increasing the borehole diameter, the amount of gas extracted will increase, enhancing the extraction effect of the borehole. In theoretical analysis and practical investigations, as the borehole diameter increases, the total amount of gas extracted will increase, and the power consumption of the equipment will gradually increase, so choose the right borehole diameter for gas extraction as far as the borehole rig equipment and technology available on site allow.
(3)
Borehole spacing
The extraction area of a single borehole is a cylindrical area with the maximum effective extraction distance as the radius of the borehole; when gas extraction boreholes are closely spaced, the effective extraction range of a single borehole overlaps more, reducing the extraction efficiency. When the boreholes are far away, there is a blind spot for gas extraction, which is not conducive to subsequent production succession.

3. Regression Experimental Design

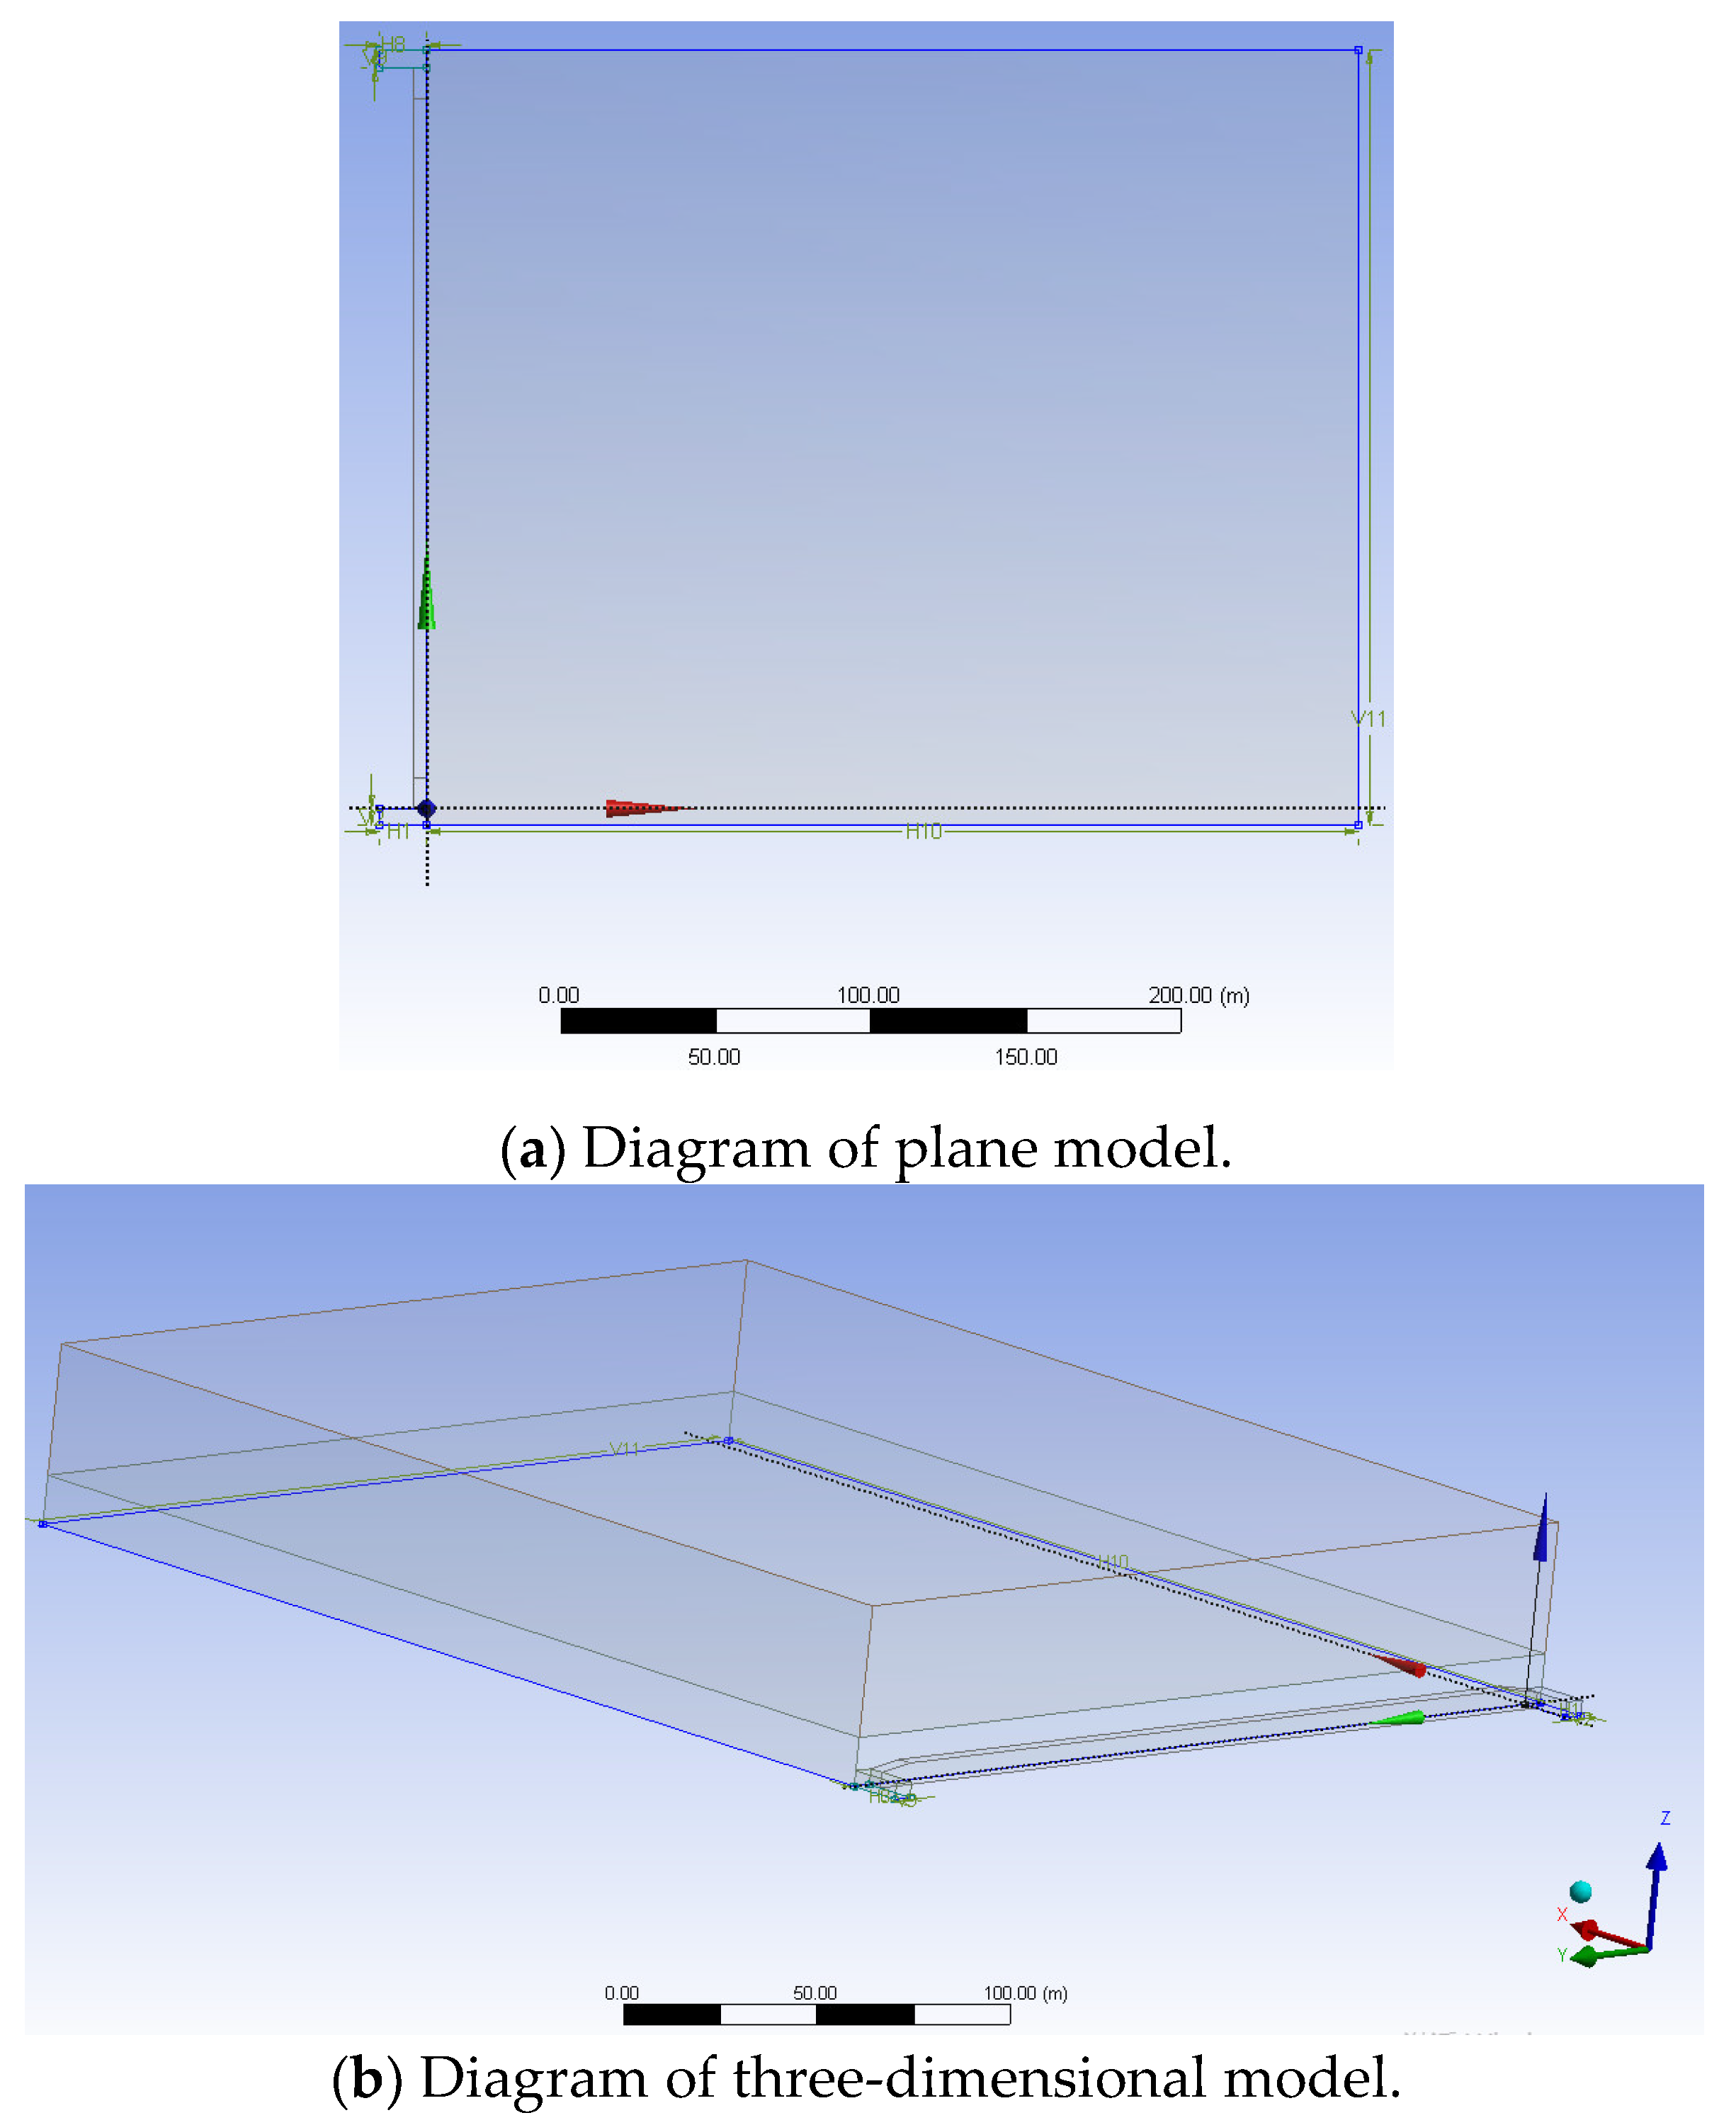
3.1. Computational Fluid Dynamics (CFD) Geometric Model Establishment

The open-off cut length of 1305 working face of the Licun Coal Mine is 250 m, and the average thickness of the coal seam is 5.77 m. The mining method of full-seam mining is adopted, and the mining height is 5.77 m. The roof is completely caved. The original gas content of the coal seam is 7.23 m3/t, and the residual gas content is about 2.15 m3/t.
According to the above parameters, a three-dimensional CFD model is established and calculated.
The premises of the theoretical model are as follows:
(1)
Steady-state seepage field—the initial process of gas extraction from the borehole can be regarded as an unsteady seepage state; however, after a long-enough time of gas extraction, the seepage field around the borehole will reach a relatively stable state.
(2)
The fracture field formed by the fractured zone of the extracted overburden is regarded as a uniform and continuous porous medium, and the seepage process is not affected by temperature changes and is isothermal seepage.
(3)
The process of gas extraction from the boreholes is considered as a planar radial seepage, and the flow line is a set of straight lines from around the borehole into the center of the borehole. Since gas seepage in the overburden fracture field is a complex process, the main influencing factors of borehole extraction are simplified and analyzed according to the above assumptions.
The selection of the boundary conditions and the setting of parameters of the computational model for FLUENT numerical simulation should consider the actual situation of the working surface on the one hand and the size of the computational model, computational area and mesh division on the other hand. The specific boundary conditions are set according to Table 1, and the discrete phase parameters are shown in Table 2. Figure 4a,b give the plan view and three-dimensional view of the geometric features of the CFD model of the working surface, respectively.

3.2. RSM Experimental Design

The main factors affecting the gas excavation effect of the borehole in the fracture zone are borehole horizon, borehole diameter, borehole spacing and negative pressure. This paper analyzes the gas extraction effect under the influence of different borehole horizons, borehole diameters, borehole spacings under the fixed negative pressure of 30 kPa and designs the experiment according to the field application situation.
The principle of response surface design is regression design, and regression design can determine the correlation between factors in a certain test range and establish the corresponding regression equation [30]. By arranging suitable test points, each point could contain the maximum amount of information, and orthogonality was satisfied among the factors. The three-factor, three-level coding design is shown in Table 3.
The response analysis of the combined scores of compressive strengths, setting time and viscosity was analyzed by the Box–Behnken test method in the Design expert (version 10.0.3, statease, China) software. The trial was divided into 17 groups, of which 12 groups were analytic trials, and 5 groups were central trials.

3.3. Comprehensive Evaluation Value of Gas Extraction Effect

In order to solve the problem of achieving the optimal gas extraction effect by gas extraction borehole in ‘borehole in place of roadway’, taking the borehole horizon (H), borehole diameter (D) and borehole spacing (S) as the influencing factors, and comprehensively evaluated the mixed amount of gas extraction (M), pure amount of gas extraction (P) and upper corner concentration (C) under different influencing factors. Therefore, this is a variety of factors, prone to random error. For the multi-objective optimization problem [31], scholars have used orthogonal test, regression test, neural network and other methods to study this kind of problem and achieved many results. The analysis principles of multi-objective optimization mainly include the matrix method, balance method and variance method. The matrix method cannot avoid the random error generated by the test, the balance method lacks objectivity, and the analysis results may vary from person to person. Therefore, based on the variance method, this paper objectively analyzes the significance of each factor and the interaction between factors on the results and eliminates the random error in the test [32,33]. By means of the gray relational analysis, the dimension of the three optimization indices was reduced to one optimization index [34], which reduced the processing difficulty and clarified the optimization purpose.
(1)
Data normalization
Different indicators have different dimensions and reflection rules, so 0–1 standardization is needed. Among them, the mixture amount of gas extraction and purity amount of gas extraction are as large as possible, calculated by Formula (8), while the concentrations of the upper corner are as small as possible, calculated by Formula (9).
n i l a r g e = n i j n i j min n i j max n i j min
n i s m a l l = n i j max n i j n i j max n i j min
where nij stands for each data value; nijmax stands for the maximum value of each data; nijmin stands for the minimum value of each data.
(2)
Building decision matrix
The normalized data were processed, and the borehole parameter set X = (X1, X2, …, Xm), the gas extraction effect set Y = (Y1, Y2, …, Yn), the construct decision matrix N.
N = [ d i j ] m × n = [ Y 1 Y j Y n X 1 0.0523 0.0853 0.0909 X i 0.4734 0.4861 0.5152 X m 0.4355 0.4773 0.5758 ]
(3)
Gray relational coefficient of all factors
In order to obtain the correlation between the optimized extraction index and the optimal solution, the gray relational coefficient is obtained by calculating the deviation sequence between the comparison sequence and the reference sequence. In this paper, the test value dij in the decision matrix N is taken as the comparison sequence, and the normalized expected value is taken as the reference sequence. The calculation formula of the gray correlation coefficient is shown in Equation (11).
g i j = min i   min j | 1 d i j | + ρ   max i   max j | 1 d i j | | 1 d i j | + ρ   max i   max j | 1 d i j |
where ρ stands for the judgment coefficient, its range being between 0 and 1; 0.5 is chosen in this paper. dij is the test value.
(4)
Comprehensive evaluation value of the model
Conventional gray correlation calculation only averages the correlation coefficients, ignoring the weight size of each indicator in the evaluation system. In this paper, the weights of the gas extraction mix (M), gas extraction pure (P) and upper corner concentration (C) are assigned to the comprehensive evaluation indices by principal component analysis, and the improved weighted gray correlation is obtained and used as the comprehensive evaluation value of the model.
The factor analysis of the three characteristics was performed using the numerical analysis software SPSS, based on the principle that the eigenvector eigenvalue is greater than 1, and the cumulative contribution is greater than 85%. The factor analysis results are shown in Table 4 and Table 5.
From the results in Table 4, it can be seen that the initial eigenvalues of the first two components are greater than 1, and the cumulative values are greater than 80%. Therefore, the first two components can be used to replace the three indicator factors.
The coefficients Gij of the principal components in each linear combination were determined by calculating the component matrix using Formula (12). Then, the coefficients of each factor in the composite score model Fij were determined by weighting the average of the principal components of each indicator by the percentage variance of the initial eigenvalues using Formula (13). Finally, the coefficients of each factor in the composite score model were normalized by Formula (14) to obtain the weighting coefficients of each factor wij. The results of the calculation of the assigned weights of the three indicators are shown in Table 6.
G i j = P i j S i
F i j = j = 1 2 i = 1 2 G i j N i i = 1 2 N i
w i = F i j F i j
where Gij stands for the coefficients of principal components in linear combinations, Pij stands for the different principal component values of each factor, S i stands for the total value square root of principal components, Ni stands for the percentage of variance, Fij stands for the coefficient of each factor in the comprehensive scoring model, wij stands for the weighting coefficient of each detection index.
In order to verify the rationality of PCA, three widely applicable weighting methods, namely criteria importance though intercriteria correlation (CRITIC), coefficient of variation method (CVM) and entropy weight method (EWM), were used to assign weights to the three evaluation indices and compare the differences of the weights under different methods.
After assigning the weights to each index by principal component analysis, the formula for calculating the improved comprehensive evaluation value is shown in Formula (15), while the calculation results are shown in Table 7.
G i = i = 1 n w i g i j
where gij stands for the gray relational coefficient of all factors.

3.4. Comparative Analysis

Figure 5 is drawn based on the results of the comprehensive evaluation values in Table 7, and from Figure 4, it can be obtained that the differences in the comprehensive evaluation values obtained by the four assignment methods are small, and therefore, the weight assignments obtained by the principal component analysis can be considered reasonable.
The principles of different weight determination methods are shown in Table 8. PCA takes into account the volatility of the data and the correlation between the data and, at the same time, has the effect of information concentration. This paper adopts the PCA assignment method for the following study.

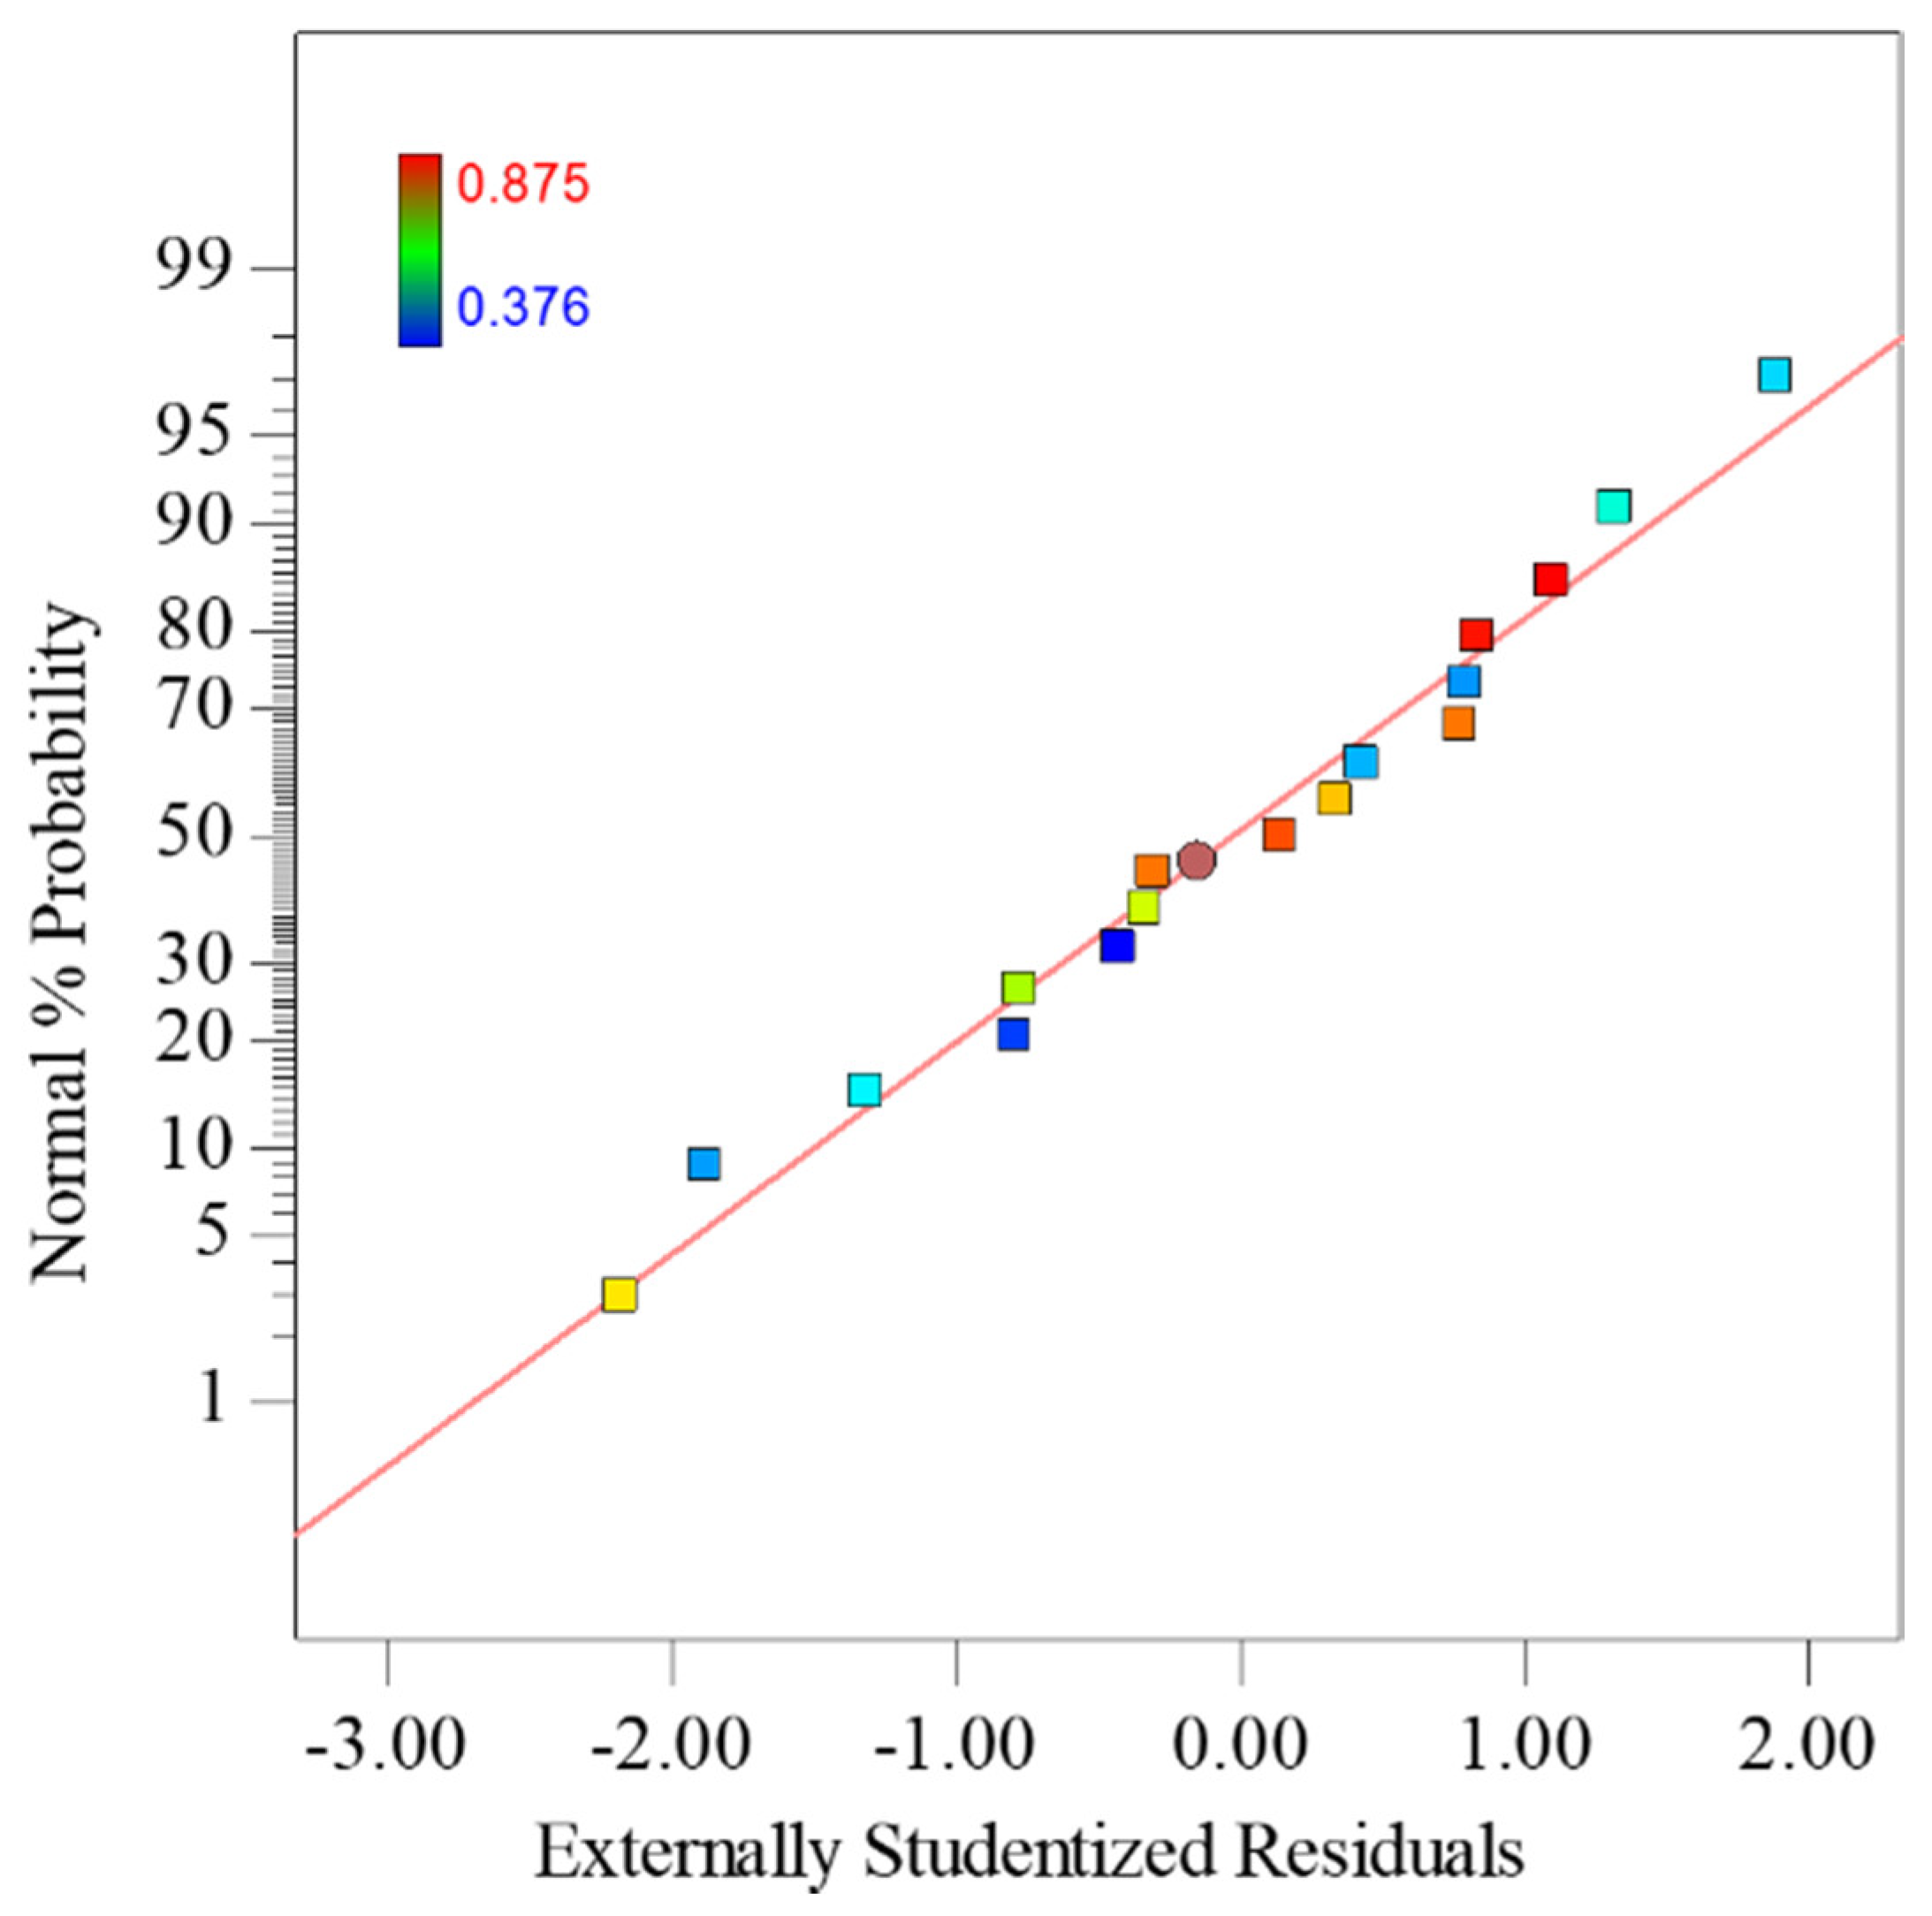
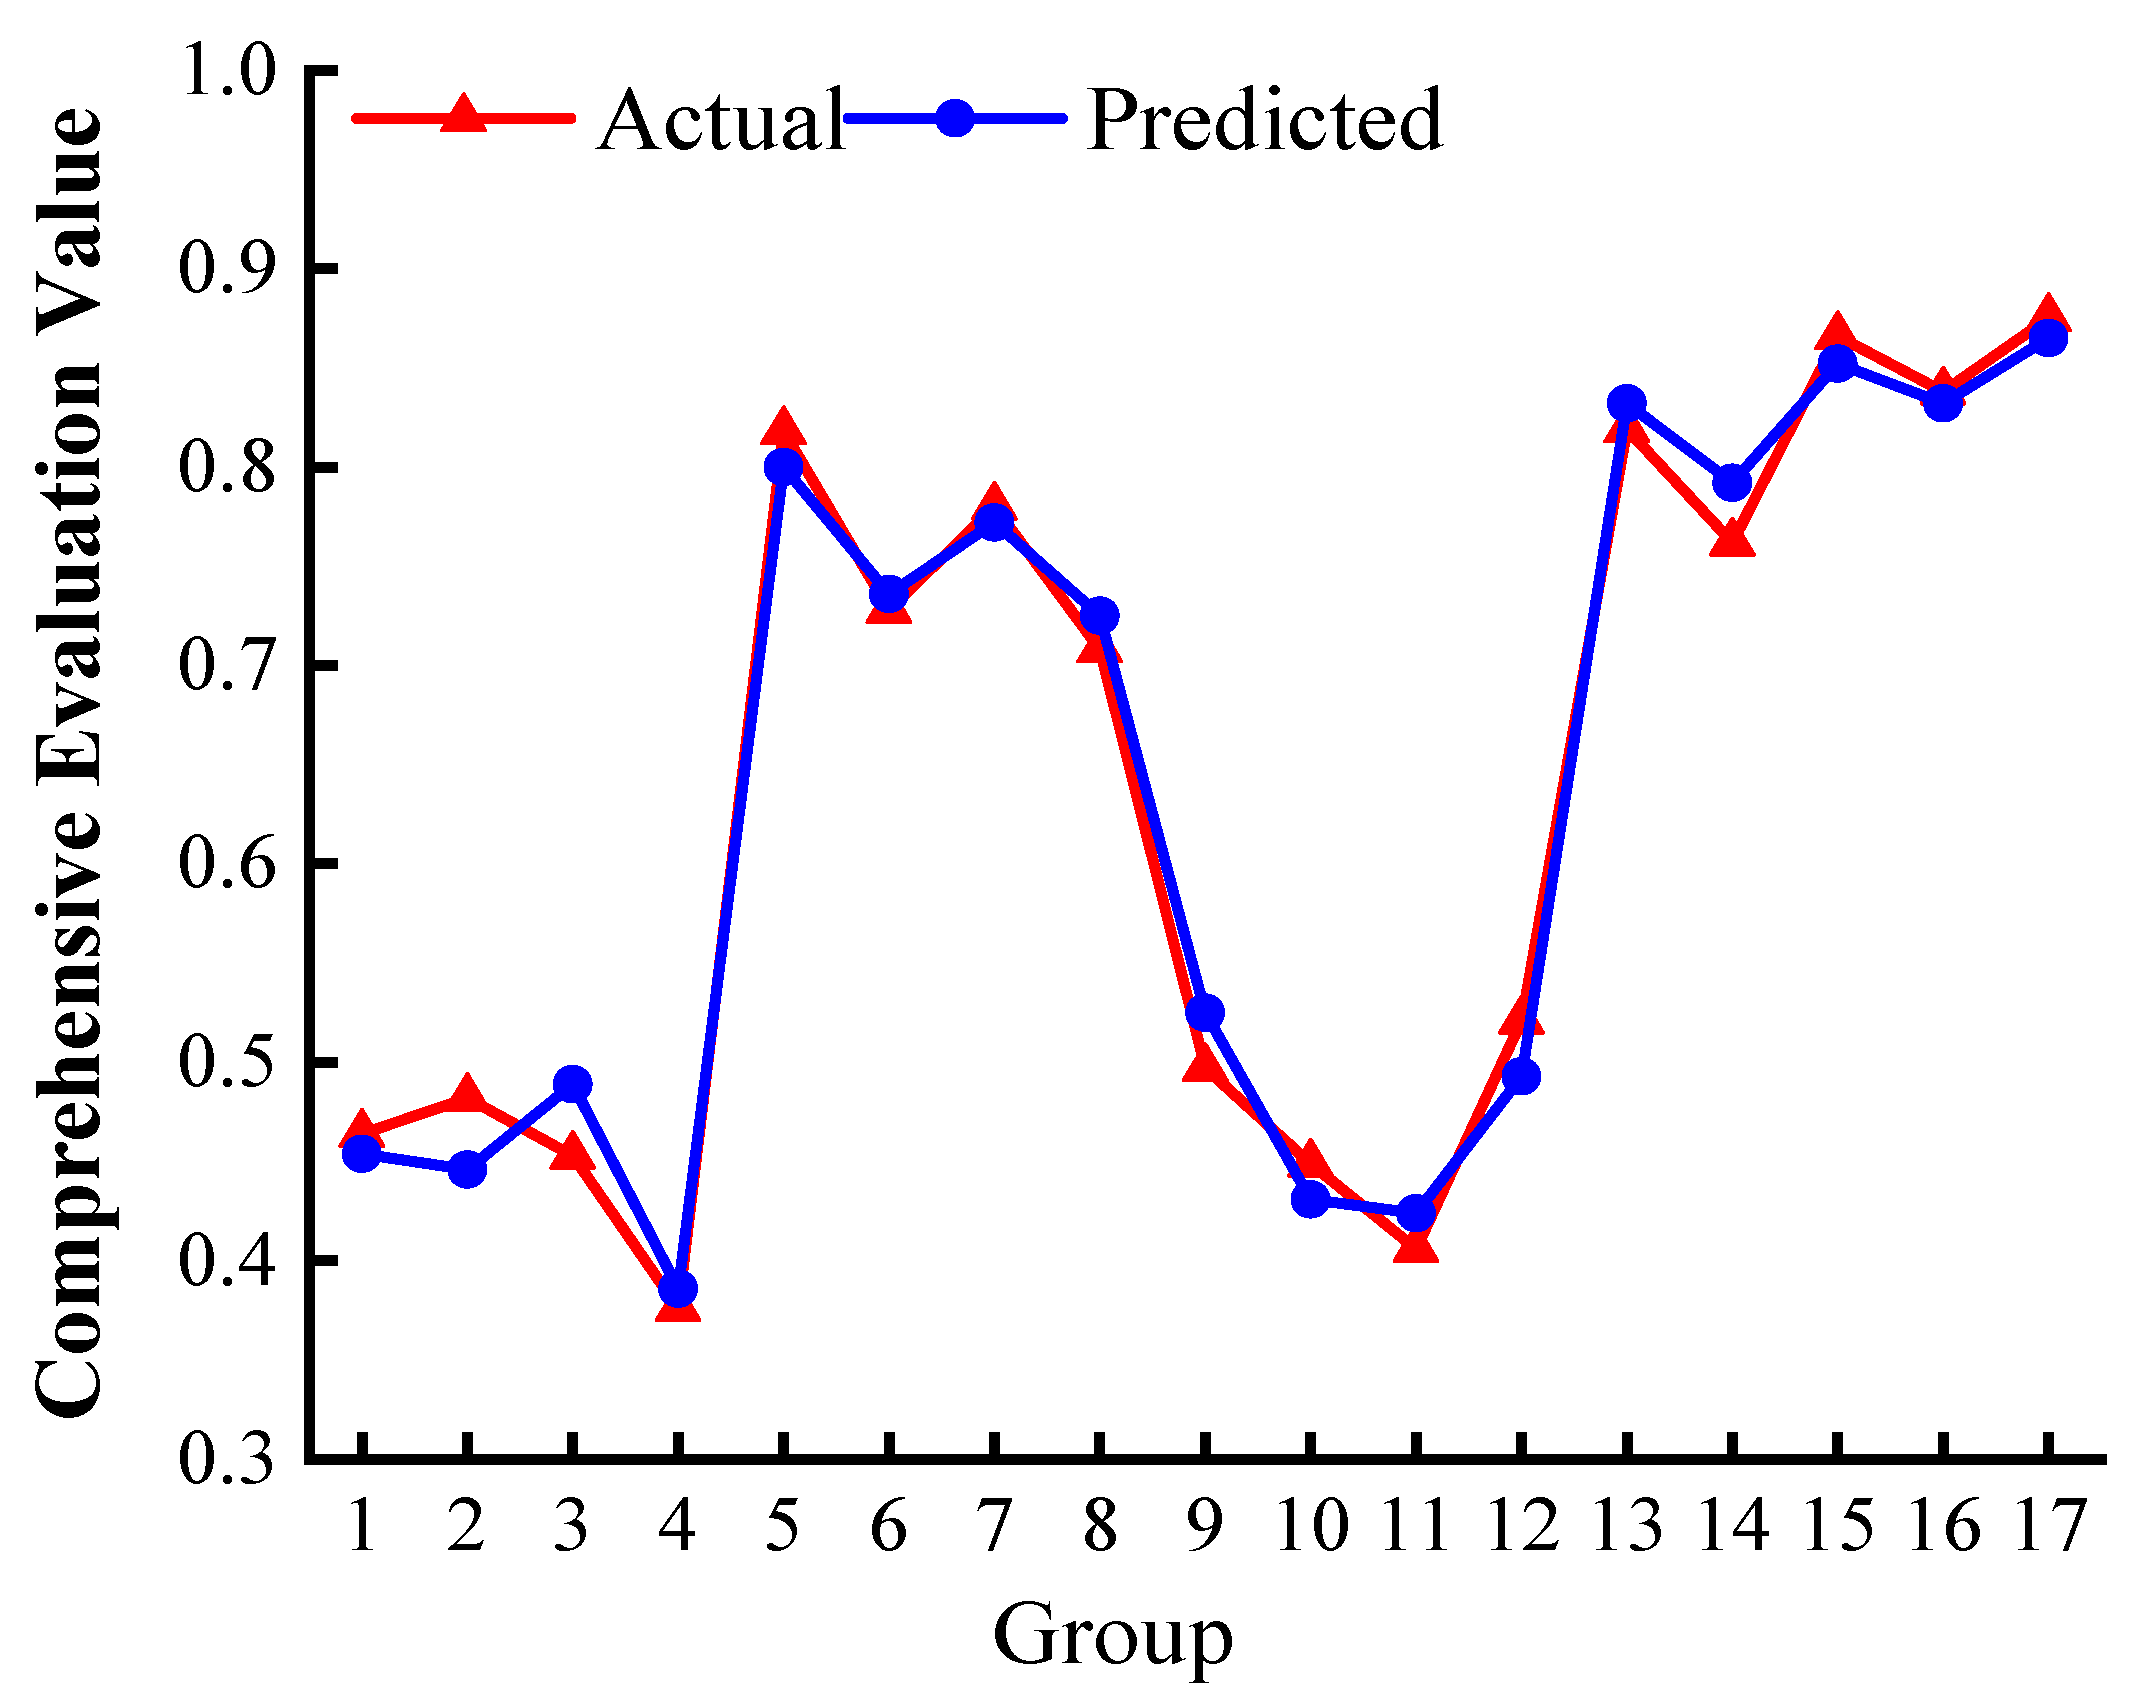
4. RSM Model Predictive Analysis

4.1. Model Establishment

Considering the two-by-two interaction effects between different influencing factors and the single-factor quadratic term effects, a second-order response surface model was used in this test [35]. Multiple regressions were fitted to the test data in Table 7 using the Design expert software to establish the composite score response model. The regression formula for the composite score was:
Y = 0.83 0.028 H 0.00625 D 0.009625 L 0.024 H D + 0.0045 H L + 0.041 D L 0.049 H 2 0.34 D 2 0.025 L 2
The residuals of the integrated evaluation value are plotted in Figure 6, and it can be seen that the residual results are linearly distributed, and most of them are concentrated in a straight line, indicating that the residuals of the modified model conform to the law of normal distribution. The residual results of the prediction model are shown in Figure 7, where the residuals are all randomly distributed around zero with no outliers, indicating that the predicted and measured values are in good agreement.
To give a more visual indication of the accuracy of the prediction model, the fitted values were compared with the experimental true values, as shown in Figure 8. In summary, it is shown that the model fits with more reliable accuracy and predicts well.
The variance analysis results of the model are shown in Table 9.
The overall significance of the model is extremely significant. The lack of fit was 0.4984, which was not significant, indicating that the fitting of the model was good. The order of influence of the three factors on the integrated evaluation value is: borehole layer > borehole spacing > borehole diameter.
The results of the model credibility analysis are shown in Table 10. According to the results in Table 10, the correlation coefficient and the modified correlation coefficient of the model are 0.9745 and 0.9416, respectively, which are close, indicating a good fit of the regression formula. The Adeq precision was 13.066 > 4, while the C.V.% was 6.98%, indicating a high degree of precision and confidence in the test.

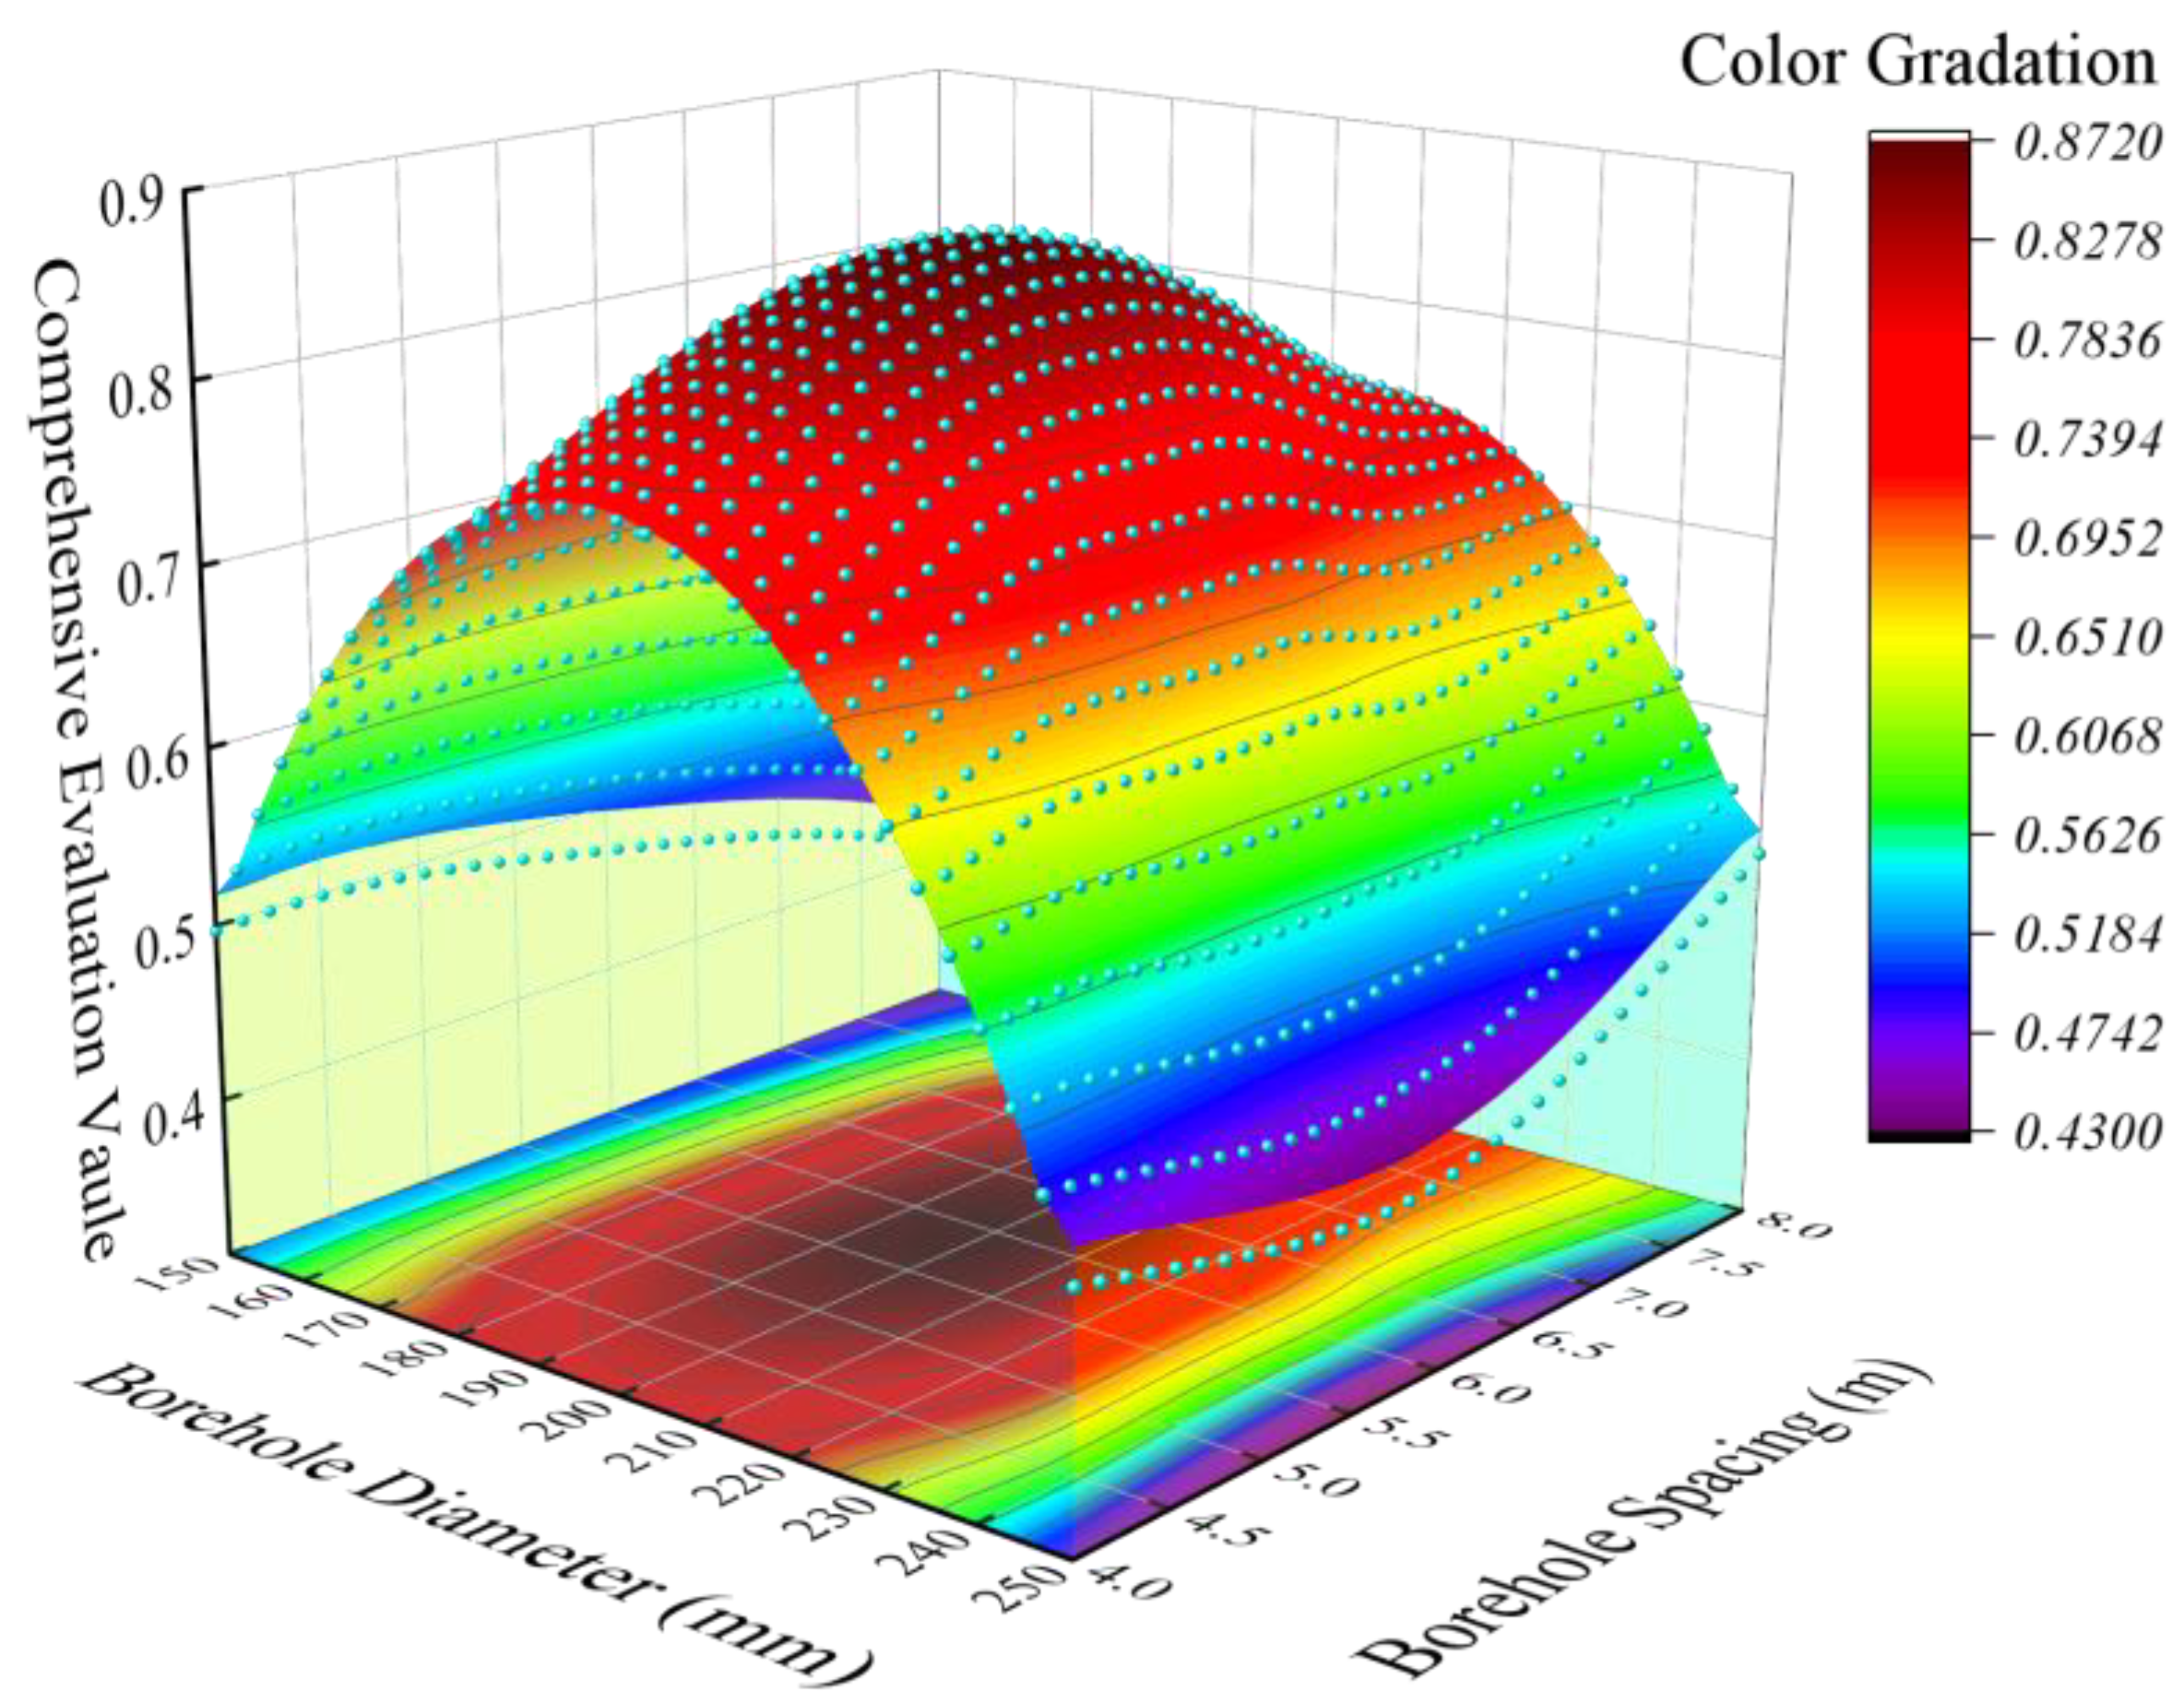
4.2. Interaction Relationship of Various Influencing Factors

The response curve graph represents a three-dimensional plot of the response results against two of the factors [36]. The degree of curvature of the response surface represents the degree of interaction between the factors, with a greater curvature indicating a greater influence of the interaction between the factors and vice versa indicating a lesser influence of the interaction [37]. In order to analyze the effect of the interaction between the borehole horizon, borehole diameter and borehole spacing on the comprehensive evaluation index of the model, response surfaces were drawn for the effect of the interaction between each factor. Origin is more intuitive for data processing, and the resulting projection surfaces are color gradation against each other. The results generated by the Design expert software were reconstructed using Origin, and the response surfaces are shown in Figure 9, Figure 10 and Figure 11.
By studying the influence of the interaction of the two factors on the comprehensive evaluation value, the optimal value range of each factor can be determined.
The effect of the interaction of borehole horizon and borehole diameter on the comprehensive evaluation value is shown in Figure 9. The comprehensive evaluation value is non-linear as the horizon increases, first increasing and then decreasing. The influence of borehole diameter on the comprehensive evaluation value is greater than that of the borehole horizon, and the influence trend is similar, with comprehensive evaluation value reaching its maximum at 28–30 m borehole horizon and 190–210 mm borehole diameter.
The effect of the interaction of borehole horizon and borehole spacing on the comprehensive evaluation value is shown in Figure 10. The degree of influence of borehole spacing on the comprehensive evaluation value is similar to the trend of influence of borehole horizon, with the comprehensive evaluation value reaching its maximum at 28–30 m borehole horizon and 5.5–6.5 m borehole spacing.
Figure 11 shows the effect of the interaction of borehole diameter and borehole spacing on the comprehensive evaluation value, from which it can be seen that the influence of borehole diameter and borehole spacing on the comprehensive evaluation value is even more significant, with the maximum comprehensive evaluation value being achieved for borehole diameter of 190–210 mm and borehole spacing of 5.5–6.5 m.

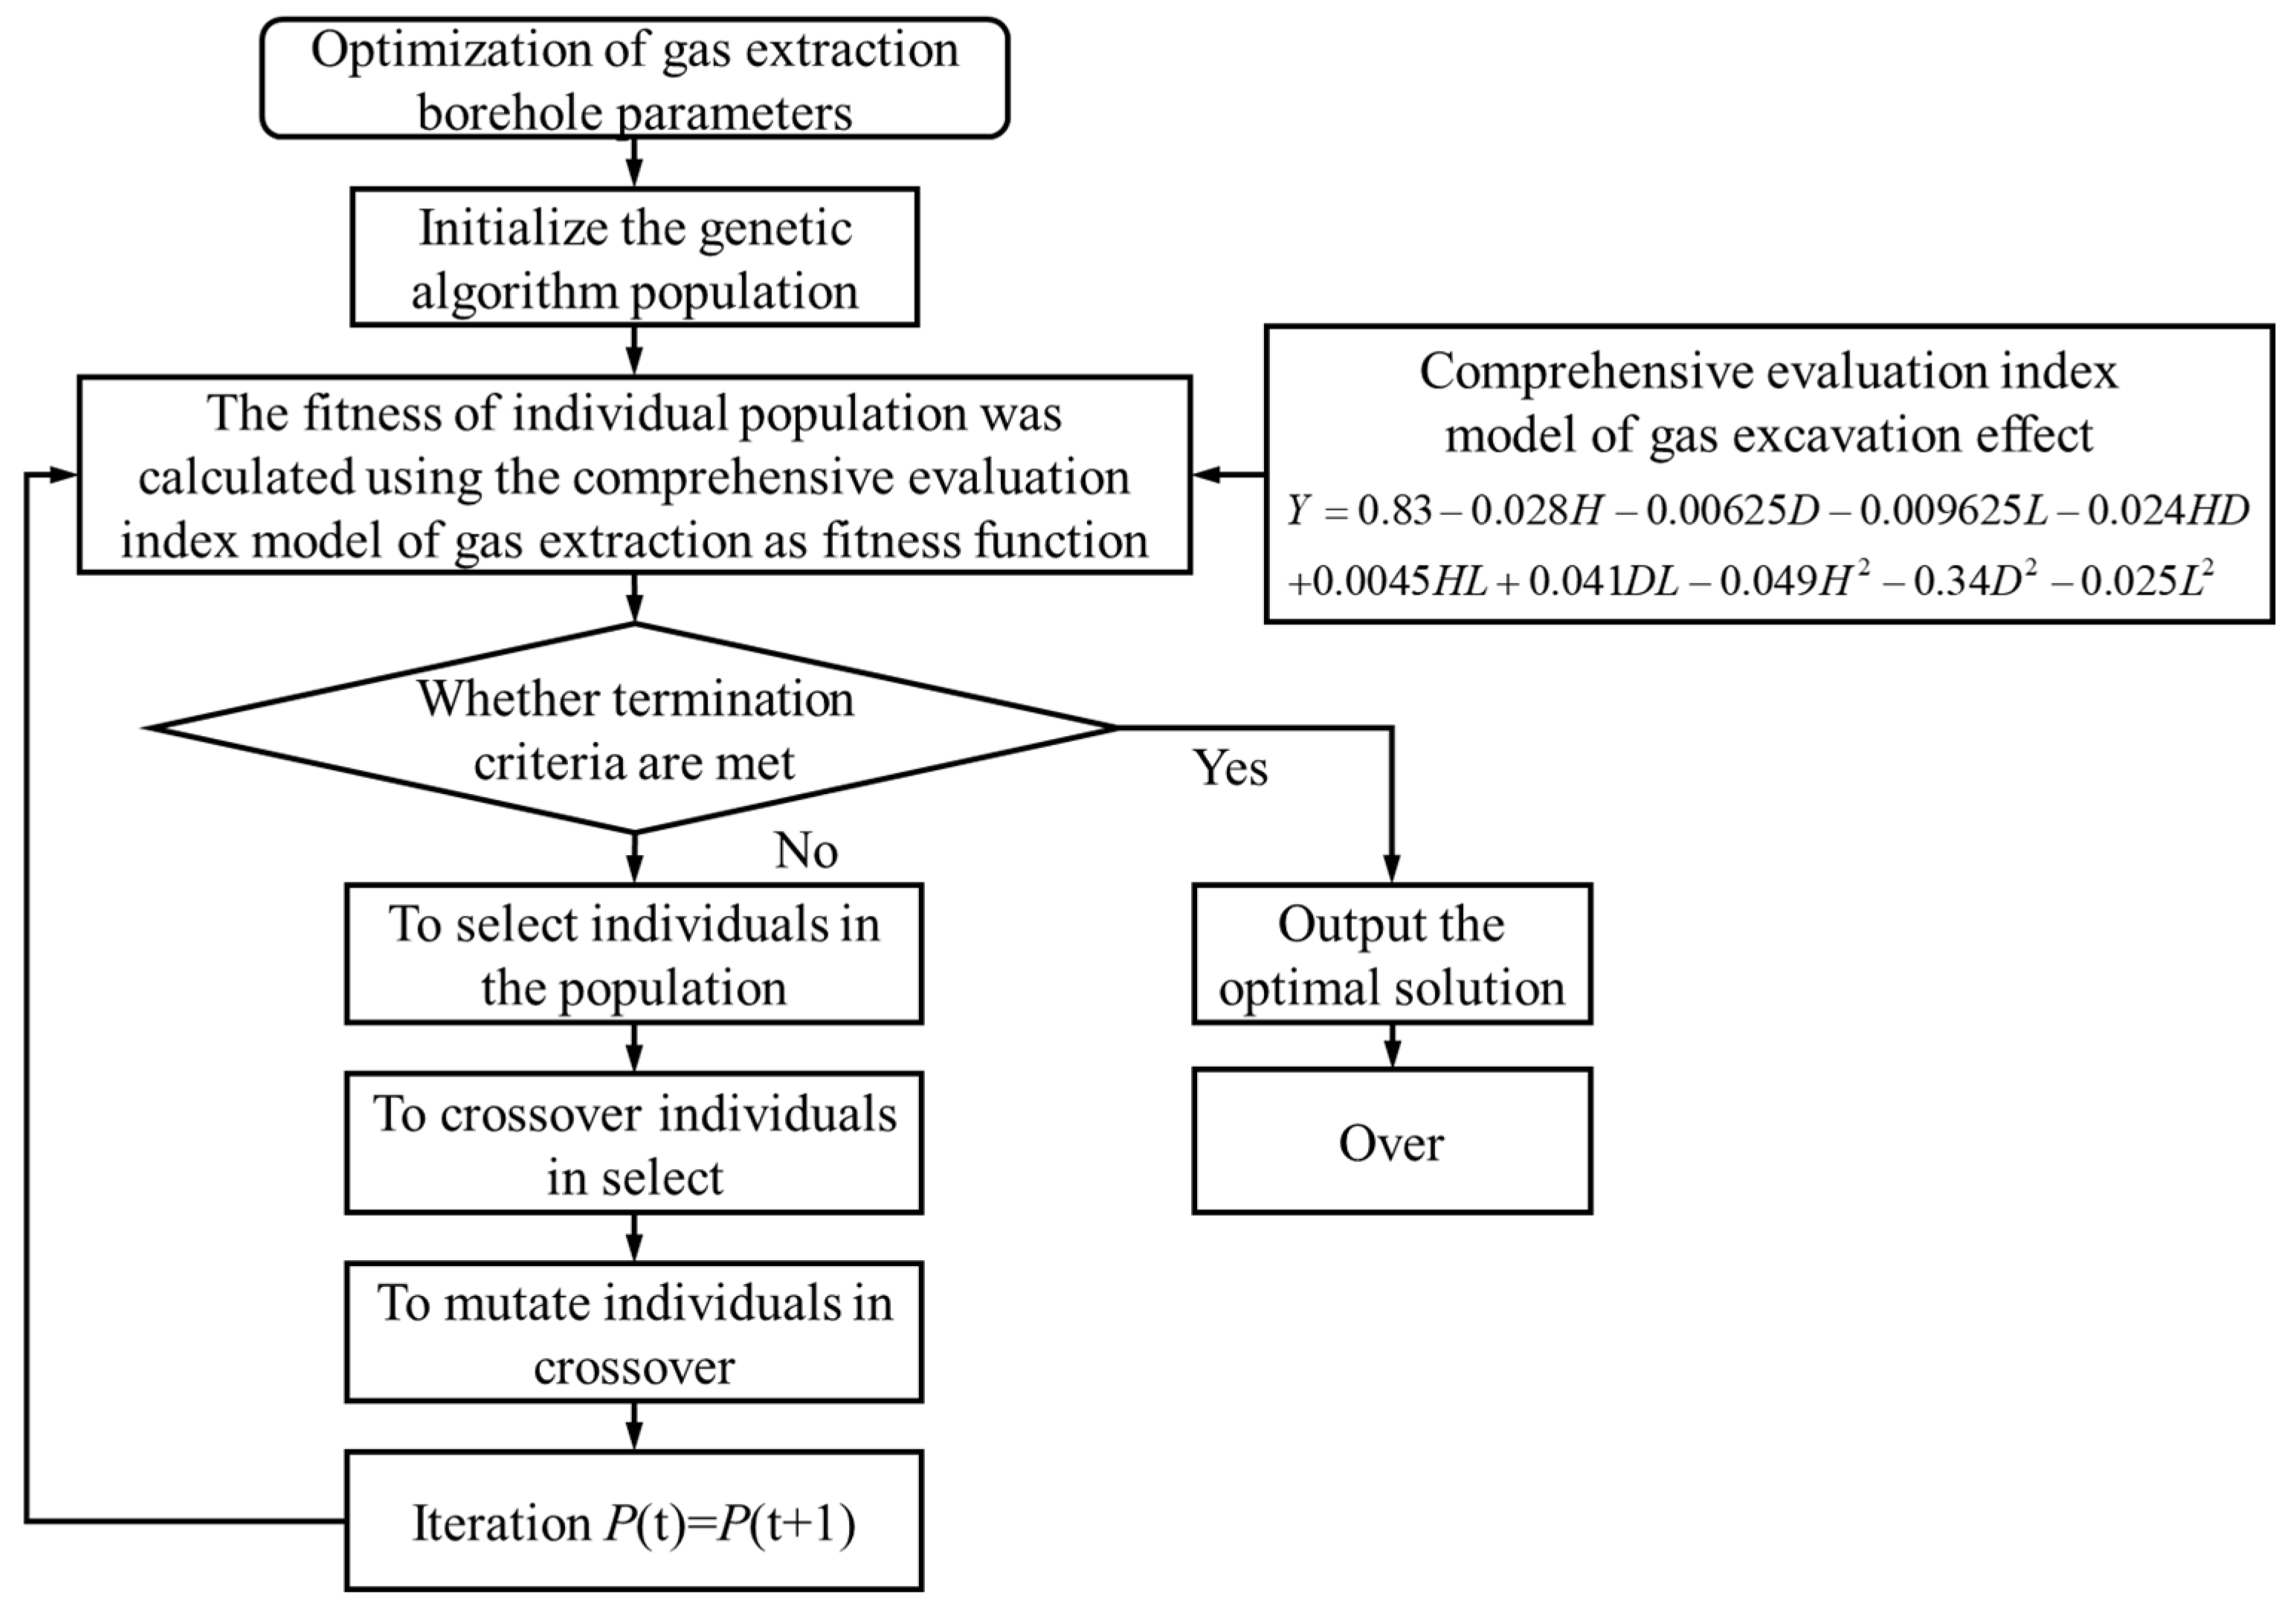
5. Analysis of Genetic Algorithm Prediction Model

5.1. Genetic Algorithm (GA)

The genetic algorithm (GA) operates by first encoding the set of parameters of the actual problem into a series of individual bit strings [38,39] and then evaluating the ‘survivability’ of the individual bit strings by calculating their fitness. Individual strings with high ‘survivability’ will be selected for crossover and mutation, resulting in the evolution of new individuals in the population. By iterating and choosing in this way, the final result will gradually approach the global optimal solution [40].
(1)
Initialization
Set the evolutionary generation counter g = 0, set the maximum evolutionary generation G and randomly generate N individuals as the initial population P(0).
(2)
Individual evaluation
Calculate the fitness of each individual in the population P(t).
(3)
Selection operation
The selection operator is applied to the population to select some good individuals to be inherited to the next-generation population according to certain rules or methods based on the fitness of the individuals.
(4)
Crossover operation
The crossover operator is applied to the population and, for selected pairs of individuals, some of the chromosomes between them are exchanged with a certain probability to produce new individuals.
(5)
Mutate operation
The mutation operator is applied to the population to change the value of one or some genes to other alleles with a certain probability for selected individuals. The population P(t) is selected, crossed and mutated to obtain the next-generation population P(t + 1). The fitness values are calculated and sorted according to the fitness values in preparation for the next genetic operation.
(6)
Termination condition judgment
If g ≤ G, then g = g + 1 and go to step (2); if g > G, the individual with the maximum fitness obtained in this evolutionary process is output as the optimal solution, and the calculation is terminated.
The process of calculating model optimization results using genetic algorithm is shown in Figure 12.

5.2. Genetic Algorithm Model Optimization Results

With Formula (16) as the objective function, its maximum point is the point where the parameters are optimally selected. When the above objective function is solved and searched for using the genetic algorithm, the individual coding method uses real number coding, the population size is 100, the evolutionary generation is 100, the crossover probability is taken as 0.4, and the variation probability is taken as 0.2.
The optimal borehole parameters are: 28.79 m borehole diameter, 199.89 mm borehole diameter and 5.76 m borehole spacing. The gas flow field at this parameter is shown in Figure 13. Under this parameter, the prediction result of the comprehensive evaluation value of the model is 0.916. To verify the accuracy of the GA optimized model, the new borehole parameters were used for simulation verification. The measured and calculated gas extraction mixing volume was 129.8 m3/min, the pure extraction volume was 9.16 m3/min, and the concentration in the upper corner was 0.52%.
The comprehensive evaluation value is 0.896 when the gas extraction parameters are put into the gray correlation degree sequence, which is close to the predicted results, as high as 97.8%. It can be considered that the model achieved the optimization of the gas extraction borehole parameter with high accuracy.

6. Discussion

This paper used the gray relational analysis to downscale the three optimization objectives of extraction mixing volume, extraction pure volume and upper corner concentration to one optimization objective of the comprehensive evaluation value, realizing a multi-objective problem with reduced dimensionality. On this basis, the principal component analysis method was used to assign weights to the three optimization objectives to improve the shortcomings of the original gray correlation analysis method by comparing several conventional objective assignment methods, and the range of parameters was selected by establishing a response surface prediction model, and the accuracy of the model was objectively analyzed. However, in this paper, three basic borehole parameters were selected as representative of the study; therefore, in future work, there is great promise in studying the effect of additional borehole parameters on gas extraction.

7. Conclusions

The main conclusions are as follows:
(1)
Among the four objective weighting methods, the weighting results of PCA were 0.385, 0.285 and 0.33; the weighting results of CRITIC were 0.235, 0.325, 0.44; the weighting results of CVM were 0.353, 0.317, 0.33; the weighting results of EWM were 0.33, 0.336, 0.334.
(2)
The PCA takes into account the volatility of the data and the correlation between the data and, at the same time, has the effect of information concentration. This paper adopted the PCA. The results of the response surface analysis showed that the optimal solution of the model existed when the borehole horizon was 28–30 m, the borehole diameter was 190–210 mm, and the borehole spacing was 5.5–6.5 m.
(3)
Through the genetic algorithm, most of this objective function solved and finally determined the borehole horizon as 28.79 m, the borehole diameter as 199.89 mm, the borehole spacing as 5.76 m. This parameter under the borehole gas extraction had great results. The extraction mixed volume was 129.8 m3/min, extraction pure volume was 9.16 m3/min, the upper corner concentration was 0.52%, the prediction accuracy of the model was 97.8%.

Author Contributions

Conceptualization, Z.Q. and Y.Y.; methodology, Z.Q. and Z.C.; software, Z.G.; investigation, Y.X. and H.S.; resources, Y.Y. and H.S.; data curation, Z.Q.; writing—original draft preparation, Z.Q.; writing—review and editing, Y.Y., H.S. and Z.C.; project administration, Z.Q. and H.S.; funding acquisition, Y.Y. and Z.Q. All authors have read and agreed to the published version of the manuscript.

Funding

Financial support for this work was provided by the National Natural Science Foundation of China (51974294), the Postgraduate Research & Practice Innovation Program of Jiangsu Province (KYCX22_2626), the Graduate Innovation Program of China University of Mining and Technology (2022WLJCRCZL01), the Qing Lan Project of Jiangsu Province Universities (2022).

Data Availability Statement

The data presented in this study are available on request from the corresponding author.

Conflicts of Interest

The authors declare no conflict of interest.

References

  1. Liu, Y.; Shao, S.; Wang, X.; Chang, L.; Cui, G.; Zhou, G. Gas flow analysis for the impact of gob gas ventholes on coalbed methane drainage from a longwall gob. J. Nat. Gas Sci. Eng. 2016, 36, 1312–1325. [Google Scholar] [CrossRef]
  2. Ke, W.; Wang, K. Impact of Gas Control Policy on the Gas Accidents in Coal Mine. Processes 2020, 8, 1405. [Google Scholar] [CrossRef]
  3. Chen, Z.; Yuan, Y.; Wang, W.; Zhu, C.; Qin, Z.; Yan, C. Pressure Relief and Permeability Enhancement with Carbon Dioxide Phase Transition Blasting: Fracture, Seepage, and Practice. Lithosphere 2021, 2021, 4983754. [Google Scholar] [CrossRef]
  4. Zhou, F.; Xia, T.; Wang, X.; Zhang, Y.; Sun, Y.; Liu, J. Recent developments in coal mine methane extraction and utilization in China: A review. J. Nat. Gas Sci. Eng. 2016, 31, 437–458. [Google Scholar] [CrossRef]
  5. Shakib, M.F.; Detournay, E.; van de Wouw, N. Nonlinear dynamic modeling and analysis of borehole propagation for directional drilling. Int. J. Non-Linear Mech. 2019, 113, 178–201. [Google Scholar] [CrossRef]
  6. Gao, J.; Yang, M.; Li, X. Research on the Parameters of Gas Extraction from the Gob of a Fully Mechanized Working Face. Disaster Adv. 2013, 6, 156–165. [Google Scholar]
  7. Zhao, E.; Li, K.; Yang, X.; Deng, N. Speculum Observation and Trajectory Measurement in Gas Extraction Drilling: A Case Study of Changling Coal Mine. Geofluids 2021, 2021, 5545067. [Google Scholar] [CrossRef]
  8. Huang, B.; Cheng, Q.; Zhao, X.; Kang, C. Hydraulic fracturing of hard top coal and roof for controlling gas during the initial mining stages in longwall top coal caving: A case study. J. Geophys. Eng. 2018, 15, 2492–2506. [Google Scholar] [CrossRef] [Green Version]
  9. Yuan, Y.; Zuo, L.; Chen, Z.; Meng, C.; Yan, C.; Gong, Z. Improvement of coalbed methane recovery rate by carbon dioxide phase transition blast fracturing. Energy Sources Part A-Recovery Util. Environ. Eff. 2022, 44, 3659–3672. [Google Scholar] [CrossRef]
  10. Wang, H.; Wang, E.; Li, Z.; Wang, X.; Zhang, Q.; Li, B.; Ali, M. Study on sealing effect of pre-drainage gas borehole in coal seam based on air-gas mixed flow coupling model. Process Saf. Environ. Prot. 2020, 136, 15–27. [Google Scholar] [CrossRef]
  11. Jia, L.; Peng, S.; Xu, J.; Yan, F.; Chen, J.; Wu, B. Investigation on gas drainage effect under different borehole layout via 3D monitoring of gas pressure. J. Nat. Gas Sci. Eng. 2022, 101, 104522. [Google Scholar] [CrossRef]
  12. Wu, K.; Shi, S.; Lu, Y.; Li, H.; Li, M. Optimization of the Plastic Area of a Borehole Based on the Gas Extraction Effect and Its Engineering Application. Geofluids 2021, 2021, 8147366. [Google Scholar] [CrossRef]
  13. Yan, Z.; Wang, Y.; Fan, J.; Huang, Y.; He, Y. Study on Key Parameters of Directional Long Borehole Layout in High-Gas Working Face. Shock Vib. 2021, 2021, 5579967. [Google Scholar] [CrossRef]
  14. Li, T.; Wu, B.; Lei, B. Study on the Optimization of a Gas Drainage Borehole Drainage Horizon Based on the Evolution Characteristics of Mining Fracture. Energies 2019, 12, 4499. [Google Scholar] [CrossRef] [Green Version]
  15. Fu, G.; Zhao, Z.; Hao, C.; Wu, Q. The Accident Path of Coal Mine Gas Explosion Based on 24Model: A Case Study of the Ruizhiyuan Gas Explosion Accident. Processes 2019, 7, 73. [Google Scholar] [CrossRef] [Green Version]
  16. An, F.; Wang, Z.; Yang, H.; Yang, S.; Pan, F.; Chen, T.; Xie, C. Application of directional boreholes for gas drainage of adjacent seams. Int. J. Rock Mech. Min. Sci. 2016, 90, 35–42. [Google Scholar] [CrossRef]
  17. Cheng, C.; Cheng, X.; Yu, R.; Yue, W.; Liu, C. The Law of Fracture Evolution of Overlying Strata and Gas Emission in Goaf under the Influence of Mining. Geofluids 2021, 2021, 2752582. [Google Scholar] [CrossRef]
  18. Li, H.; Liu, Y.; Wang, W.; Liu, M.; Ma, J.; Guo, X.; Guo, H. The integrated drainage technique of directional high-level borehole of super large diameter on roof replacing roof extraction roadway: A case study of the underground Zhaozhuang Coal Mine. Energy Rep. 2020, 6, 2651–2666. [Google Scholar] [CrossRef]
  19. Ji, M.; Sun, Z.; Sun, W. A Case Study on the Gas Drainage Optimization Based on the Effective Borehole Spacing in Sima Coal Mine. Geofluids 2021, 2021, 5510566. [Google Scholar] [CrossRef]
  20. Wang, W.; Li, Z.; Zhao, G.; Chen, Y. Coal and Gas Comining in the High-Gas Detong Mine, China: Analytical and Numerical Parameter Optimization of Gas Extraction Boreholes. Adv. Civ. Eng. 2022, 2022, 9552620. [Google Scholar] [CrossRef]
  21. Luo, M.; Yang, L.; Wen, H.; Zhao, D.; Wang, K. Numerical Optimization of Drilling Parameters for Gas Predrainage and Excavating-Drainage Collaboration on Roadway Head. Geofluids 2022, 2022, 3241211. [Google Scholar] [CrossRef]
  22. Liu, J.; Gao, J.; Yang, M.; Wang, D.; Wang, L. Numerical Simulation of Parameters Optimization for Goaf Gas Boreholes. Adv. Civ. Eng. 2019, 2019, 3891080. [Google Scholar] [CrossRef]
  23. Yang, H.; Qian, Z.; IOP. The Research of Coordination Extraction from the Stope Gas with Partition and Time-sharing. In Proceedings of the 6th International Conference on Advances in Energy, Environment and Chemical Engineering (AEECE), Dalizhou, China, 24–26 June 2020; p. 546. [Google Scholar]
  24. Zhao, P.; Zhuo, R.; Li, S.; Shu, C.M.; Laiwang, B.; Jia, Y.; Shi, Y.; Suo, L. Analysis of advancing speed effect in gas safety extraction channels and pressure-relief gas extraction. Fuel 2020, 265, 116825. [Google Scholar] [CrossRef]
  25. Wu, Y.; Wang, L. Application of Desirability Based Multiresponse Optimization for Reciprocating Pump Design: Mechanical, Industrial, And Manufacturing Engineering. In Proceedings of the International Conference on Mechanical, Industrial, and Manufacturing Engineering, Singapore, 28–30 September 2011. [Google Scholar]
  26. Moore, T.; Friederich, M. Defining Uncertainty: Comparing Resource/Reserve Classification Systems for Coal and Coal Seam Gas. Energies 2021, 14, 6245. [Google Scholar] [CrossRef]
  27. Yuan, Y.; Chen, Z.; Yuan, C.; Zhu, C.; Wei, H.; Zhang, X. Numerical Simulation Analysis of the Permeability Enhancement and Pressure Relief of Auger Mining. Nat. Resour. Res. 2020, 29, 931–948. [Google Scholar] [CrossRef]
  28. Zhu, C.; Yuan, Y.; Wang, W.; Chen, Z.; Wang, S.; Zhong, H. Research on the “three shells” cooperative support technology of large-section chambers in deep mines. Int. J. Min. Sci. Technol. 2021, 31, 665–680. [Google Scholar] [CrossRef]
  29. Guo, M.; Guo, W.; Yuan, R.; Jiao, Z.; Enbing, Y.I. Spatial Location Determination of Directional Boreholes based on Regional Distribution Characteristics of mining-induced overburden fractures. J. Min. Saf. Eng. 2021, 1, 1–10. [Google Scholar]
  30. Alipour, A.; Mokhtarian, M. RSM-Based Model to Estimate the V-Cut Drill and Blast Pattern Specific Charge in Rock Tunneling. Int. J. Geomech. 2021, 21, 06021030. [Google Scholar] [CrossRef]
  31. Cancan, P.; Xiaodong, Z.; Zhiguang, G.; Ju, W.; Yan, G. Research on cooperative optimization of multiphase pump impeller and diffuser based on adaptive refined response surface method. Adv. Mech. Eng. 2022, 14, 16878140211072944. [Google Scholar] [CrossRef]
  32. Hu, Q.; Yuan, K.; Peng, W.; He, S.; Zhao, G.; Wang, J. Flow pattern analysis and multi-objective optimization of helically corrugated tubes used in the intermediate heat exchanger for nuclear hydrogen production. Int. J. Hydrogen Energy 2022, 47, 4885–4902. [Google Scholar] [CrossRef]
  33. Meng, D.; Gan, H.; Wang, H. Modeling and Optimization of the Flue Gas Heat Recovery of a Marine Dual-Fuel Engine Based on RSM and GA. Processes 2022, 10, 674. [Google Scholar] [CrossRef]
  34. Mangaraj, S.; Bagal, D.; Parhi, N.; Panda, S.; Barua, A.; Jeet, S. Experimental study of a portable plasma arc cutting system using hybrid RSM-nature inspired optimization technique: Materials Today-Proceedings. In Proceedings of the 2nd International Conference on Functional Material, Manufacturing and Performances, Xi’an, China, 21–23 October 2022; pp. 867–878. [Google Scholar]
  35. Wang, J.; Wan, W. Optimization of fermentative hydrogen production process using genetic algorithm based on neural network and response surface methodology. Int. J. Hydrogen Energy 2009, 34, 255–261. [Google Scholar] [CrossRef]
  36. Balasubramanian, V.; Lakshminarayanan, A.K.; Varahamoorthy, R.; Babu, S. Application of Response Surface Methodolody to Prediction of Dilution in Plasma Transferred Arc Hardfacing of Stainless Steel on Carbon Steel. J. Iron Steel Res. Int. 2009, 16, 44–53. [Google Scholar] [CrossRef]
  37. Mostafa, J.J.; Mohammad, M.A.; Ehsan, M. A hybrid response surface methodology and simulated annealing algorithm: Computer Communication and Management. In Proceedings of the International Conference on Computer Communication and Management, Sydney, Australia, 1 January 2011; pp. 570–576. [Google Scholar]
  38. Guo, P.; Wang, X.; Han, Y. The Enhanced Genetic Algorithms for the Optimization Design. In Proceedings of the 3rd International Conference on Biomedical Engineering and Informatics (BMEI 2010), Yantai, China, 16–18 October 2010; pp. 2990–2994. [Google Scholar]
  39. Wen, F.; Zhang, D.; Han, C.; Zhang, G.; Li, G.; Zhang, X.; Ma, J.; Yao, Z.; Yu, K. Anti-offset performance optimization of coupling coils in wireless power transfer system based on genetic algorithm. Energy Rep. 2022, 8, 1–9. [Google Scholar] [CrossRef]
  40. Wang, Z.; Li, Y.; Shuai, K.; Zhu, W.; Chen, B.; Chen, K. Multi-objective Trajectory Planning Method based on the Improved Elitist Non-dominated Sorting Genetic Algorithm. J. Mec. Eng. 2022, 35, 7. [Google Scholar] [CrossRef]
Figure 1. Evolution of mining fractures in the coal seam overburden.
Processes 10 01421 g001
Figure 2. Regional division and the LHB layout in overlying strata (three-dimensional diagram. Note: ψs and ψd are the critical deformation angles of the overlying strata in the strike and dip, respectively; and βs and βd are the breaking angles of the overlying strata in the strike and dip, respectively) [29].
Processes 10 01421 g002
Figure 3. Schematic diagram of gas flow from a borehole to extract roof overburden.
Processes 10 01421 g003
Figure 4. Schematic diagram of model construction.
Processes 10 01421 g004
Figure 5. Comprehensive evaluation value results under different methods.
Processes 10 01421 g005
Figure 6. Overall normal probability of the model.
Processes 10 01421 g006
Figure 7. Residual plots of the predictive model.
Processes 10 01421 g007
Figure 8. Experimental and predicted values of the model.
Processes 10 01421 g008
Figure 9. The interaction relationship between borehole horizon and borehole diameter.
Processes 10 01421 g009
Figure 10. The interaction relationship between borehole horizon and borehole spacing.
Processes 10 01421 g010
Figure 11. The interaction relationship between borehole diameter and borehole spacing.
Processes 10 01421 g011
Figure 12. Step-by-step flow of the genetic algorithm.
Processes 10 01421 g012
Figure 13. Distribution of the gas flow field.
Processes 10 01421 g013
Table 1. Boundary conditions.
Name of the BorderType of the Border
InletVelocity inlet
OutPressure outlet
WallWall
Table 2. Parameters of the computational model.
ModelDefine
SolverPressure Based
Viscous Modelk-epsilon
EnergyOn
MaterialMethane–Air
Table 3. Code of test factor.
CodeH/mD/mmS/m
−1241504
0302006
1362508
Table 4. Total variance interpretation.
ComponentInitial EigenvalueSum of Squares of LoadsSum of Squares of Rotational Loads
TotalPercentage of VarianceAccumulationTotalPercentage of
Variance
AccumulationTotalPercentage of VarianceAccumulation
12.95552.37257.3721.57152.37257.3721.56452.12657.126
20.03935.38291.7551.06135.38291.7551.06935.62891.755
30.36712.245100.000
Table 5. Component matrix.
Component1
the mixed amount of gas extraction0.997
the pure amount of gas extraction0.992
upper corner concentration0.988
Table 6. Results of weight distribution of each indicator under different methods.
NumberEvaluation IndexWeight Distribution
PCACRITICCVMEWM
1the mixed amount of gas extraction0.3850.2350.3530.33
2the pure amount of gas extraction0.2850.3250.3170.336
3upper corner concentration0.330.440.330.334
Table 7. Comprehensive evaluation value results under different methods.
NumberParameter of BoreholeGray Regulation CoefficientComprehensive Evaluation Value
HDLMPCPCACRITICCVMEWM
13015040.4240.5260.5560.4970.5150.5000.502
23020060.8510.9060.8750.8750.8790.8760.877
33620080.6640.8990.5960.7080.7100.7160.720
43025040.4580.5350.3640.4490.4420.4510.452
52420040.80610.6760.8180.8120.8250.828
62425060.3980.5330.450.4530.4650.4580.461
73025080.4560.5320.5890.5210.5390.5240.526
83020060.7440.7850.7620.7620.7650.7630.764
93015080.4020.4920.3350.4060.4020.4080.410
103020060.7980.8460.8190.8190.8230.8200.821
113625060.3780.4060.3470.3760.3730.3770.377
122415060.4850.4850.420.4640.4560.4640.463
133615060.4280.5610.4760.4820.4920.4860.489
143020060.8690.8970.8360.9590.9500.9570.955
153020060.7840.8490.8920.9430.9360.9400.939
163620040.8730.7510.5370.7280.6860.7230.720
172420080.6670.8870.8190.7800.8050.7870.792
Table 8. Principles of different weight determination methods.
NameData
Volatility
Correlation between DataInformation of NumberOther
PCAYesYesNoInformation enrichment
CRITICYesYesNo
CVMYesNoNo
EWMNoNoNo
Table 9. Analysis of variance of regression equation.
ParameterSum of SquaresDegree of
Freedom
Mean SquareF-Valuep-ValueSignificance
Model0.5390.05929.67<0.0001**
H0.00610510.0061053.080.1225-
D0.000312510.00031250.160.7030-
L0.000741110.00074110.370.5600-
HD0.00225610.0022561.140.3212-
HL0.00008110.0000810.0410.8455-
DL0.00664210.0066423.360.1097-
H20.0110.025.110.0584-
D20.4810.54244.77<0.0001**
L20.00826310.0082631.280.2958-
Residual0.03370.004754
Lack of Fit0.00574830.0019160.950.4984-
Pure Error0.0081140.002027
Cor Total0.5416
Note: ** stands for extremely significant (p < 0.01), - stands for not significant.
Table 10. Reliability analysis of the model.
ModelStd. Dev.MeanR-SquaredAdj
R-Squared
Pred
R-Squared
PRESSC.V. %Adeq
Precision
Y0.0440.640.97450.94160.80710.16.9813.066
Publisher’s Note: MDPI stays neutral with regard to jurisdictional claims in published maps and institutional affiliations.

