
Experimental Study of a Gas-Liquid-Solid Three-Phase Flow in an Aeration Tank Driven by an Inverted Umbrella Aerator


1
Research Center of Fluid Machinery Engineering and Technology, Jiangsu University, Zhenjiang 212013, China
2
Second Ship Design and Research Institute, Wuhan 430060, China
3
School of Energy and Power Engineering, Jiangsu University, Zhenjiang 212013, China
*
Author to whom correspondence should be addressed.
Processes 2022, 10(7), 1278; https://doi.org/10.3390/pr10071278
Submission received: 10 June 2022
/
Revised: 24 June 2022
/
Accepted: 25 June 2022
/
Published: 29 June 2022
(This article belongs to the Section Environmental and Green Processes)
Abstract
:The three-phase flow in a aeration tank driven by an inverted umbrella aerator is relatively complex, including the processes of the hydraulic jump, air entrainment, and sludge particle sedimentation. A three-phase flow test bench for an inverted umbrella aerator is established for studying its influence on aeration performance. The experiment mainly studies the changed law of aeration performance under different immersion depths or sludge concentrations and measures the flow rate and sludge concentrations in the aeration tank in different working conditions. The results are as follows. (1) The total oxygen transfer coefficient, standard oxygenation capacity, and standard power efficiency increase with the increase in rotational speed. The total oxygen transfer coefficient and standard-charge oxygen capacity first increase and then decrease with the decrease in immersion depth, reaching a maximum at −20 mm immersion depth. The standard dynamic efficiency has a similar trend and reaches a maximum at −8 mm immersion depth. (2) In the aeration tank, the flow velocity near the impeller is faster and has greater turbulence. The shallow water is more profoundly affected by the impeller compared with the deeper water. (3) The shallow-water sludge varies greatly, and the deep-water sludge is distributed uniformly when the inverted umbrella aerator works stably.
1. Introduction
China is a country with serious water shortages, and its per capita water resources are only 1/4 that of the world average. With the rapid development of industry and the social economy, the problem of water pollution has become increasingly prominent. The treatment of domestic sewage and industrial sewage is necessary for the protection of the natural environment. An inverted umbrella aerator is part of the core equipment of sewage treatment. It is commonly used in Carrousel oxidation ditches because it serves the functions of both aeration and flow-pushing. Its working principle is shown in Figure 1. Driven by the motor, when the impeller rotates at a high speed, the mud and water mixture form a jet flow and a negative pressure zone is generated around the jet. Oxygen, water, and mud are fully mixed in the negative pressure zone, enabling oxygenation.
Oxidation ditches have attracted the attention of many scholars as they form a kind of annular aeration tank. Stamou [1] and Lesage [2] simulated the hydraulic model in the oxidation ditch under steady conditions; they provided a reference for the simulation of an oxidation ditch. Simon [3] simulated four oxidation ditches of different sizes and verified the flow rate by experimentation. Moullec [4] used the three-dimensional Euler-Eulerian two-phase flow method to numerically simulate the oxidation ditch. Zhang [5] coupled the solid-liquid two-phase flow model to simulate the flow field and sludge field in a Carrousel oxidation ditch.
Xing and Qiu [6] analyzed the stresses and strains on the blade, improving the standard dynamic efficiency of the aerator. Xing et al. [7] provided the basis for an optimal design of the curved blade. Ming [8] found that a straight blade offers a greater improvement in aeration performance than the inclined blade. Zhou [9] and Wang [10] found that the oxygenation capacity and power efficiency had a quadratic-function relationship with immersion depth. Xu [11] analyzed the liquid–solid two-phase process in the oxidation ditch and optimized the oxidation ditch structure. Fan [12] focused on the hydrodynamics of an oxidation ditch from the point of view of both experiments and simulations. Zhang [13] used single-factor analysis and orthogonal test methods to find the optimal working conditions of the aerator. Guo [14] mainly used the PBM model to simulate the aeration process, which has high accuracy for a gas–liquid two-phase flow. Liu [15] obtained the real-time flow streamline of the inverted umbrella aerator, using a simulated gas–liquid flow.
In summary, the previous studies mainly simulated the flow behavior in the aeration tank, but they lacked experimental research. Simulation cannot accurately express the complex flow found in the aeration tank and, even here, there is a serious lack of research into the gas–liquid–solid three-phase flow mechanism in the aeration tank. The previous experiments mainly focused on the gas–liquid two-phase flow or studied the shape of the blade.
The performance of the aerator is affected by rotational speed, the immersion depth of the impeller, and the sludge concentration. A three-flow test bench for the inverted umbrella aerator is established in this study for measuring rotational speed, the immersion depth of the impeller, and the sludge concentration of the aerator. It not only provides an experimental basis for research into the gas-liquid-solid three-phase mechanism of the inverted umbrella aerator but also promotes the development of a sewage sludge treatment theory. The experiment can also show the laws behind the complex flow seen in the aeration tank.
2. Text Model and Devices
The impeller of the inverted umbrella aerator is composed of three parts: blade, web, and web gap. The number of impeller blades is 6; the outer diameter of the impeller , with a web gap diameter , and a web gap opening , The impeller is made using three-dimensional printing.
The aeration tank consists of two parts: an inner plexiglass cylinder and an outer rectangular plexiglass tank. The internal cylinder diameter , and the external glass tank dimension is . The liquid height , and the immersion depth is expressed as . Schematic diagrams of the aeration tank and impeller are shown in Figure 2.
The aeration performance is an important parameter. A schematic diagram of the aeration performance test device is shown in Figure 3.
In the internal flow test, the drying method is used to measure the sludge concentration distribution in the aeration tank. The layout of the internal flow velocity measuring points is shown in Figure 4.
The specific parameters of the test instruments are shown in Table 1.
3. Aeration Performance Test
3.1. Test Steps
The changes to the dissolved oxygen content over time under different rotational speeds, immersion depths, and sludge concentrations are investigated. The specific test plan is shown in Table 2.
The test steps are in accordance with national standards. The specific test steps are as follows:
- With a calibration instrument, add water to the aeration tank to a liquid height level of , then adjust the height of the impeller to the specified immersion depth.
- When the impeller is functioning, the dissolved oxygen content in the tank is uniform. One measuring point is set up. The setting position is shown in Figure 5.
- Calculate the sludge powder mass required for the different sludge concentrations, put the sludge into a drying box, and dry it at 105 °C for 60 min. Weigh the sludge using an electronic balance, configure the sludge mixture, and activate the inverted umbrella aerator to keep the mixture evenly concentrated.
- Add NaSO4 as a deoxidizer; the required mass is:where is the deoxidation safety factor, taken as 1.5. is the concentration of dissolved oxygen, in . is the volume of water, in . CoCl2·6H2O is used as the experimental catalyst at a concentration of 0.10 .
- Sprinkle the chemical into the aeration tank and observe the readings from the dissolved oxygen-measuring instrument. When the dissolved oxygen concentration in the liquid has been stabilized for 3 min, begin recording the results.
- The dissolved oxygen concentration data are recorded every 30s for 30 min.
- Repeat steps 3–5 until the recording of the dissolved oxygen concentration is completed.
- After the dissolved oxygen concentration measurements are complete, data processing is performed. (a) The dissolved oxygen concentrations are classified by the different times; arrange them over time and draw a graph. (b) Taking the time point as the abscissa and the logarithmic oxygen deficit value as the ordinate, draw a scatter diagram and fit a straight line.
3.2. Discussion
3.2.1. Standard Oxygen Total Transfer Coefficient
According to the double-membrane theory, oxygen needs to pass through the gas film to the gas–liquid interface, thereby entering the liquid phase through the liquid film via molecular diffusion. The double-membrane theory is shown in Figure 6.
The change in dissolved oxygen concentration [16] in water is:
where is the oxygen transfer rate, in , is the total oxygen transfer coefficient, in , is the saturated oxygen concentration under test conditions, in and is the dissolved oxygen concentration at time , in .
The formula is integrated to obtain the following values:
where is the dissolved oxygen concentration at time and is the dissolved oxygen concentration at time .
In order to eliminate the influence of temperature and pressure on the oxygen mass transfer rate, the total oxygen transfer coefficient in the test is converted to the standard conditions (20 °C, 1 atm).
The curve of the dissolved oxygen concentration over time is created according to the data derived from the test. The influence of the different rotating speeds, the immersion depth, and the sludge concentration are shown in the following paragraphs.
From Figure 7, we can see that the dissolved oxygen concentration increases with the increase in rotational speed. Increasing the rotating speed is conducive to improving the working efficiency, agitating the water, and reducing the mass transfer resistance, and the hydraulic jump and entrainment effects are accentuated. Thus, the dissolved oxygen content increases correspondingly under the conditions of high rotating speed, which shortens the timespan for the oxygen to reach saturation.
At the same rotation speed, the dissolved oxygen solubility increases over time, but the dissolution rate gradually slows down. The reasons are as follows: the dissolved oxygen content gradually increases with the passage of time. According to the double-membrane theory, the oxygen mass transfer rate is proportional to the oxygen deficit. After a period of operation, the oxygen concentration gradient, the diffusion rate, and the oxygen mass transfer rate all decrease.
As shown in Figure 8, with the increase in the immersion depth, the growth rate of the dissolved oxygen concentration first increases and then decreases. When the immersion depth is less than 0 mm, the impeller is not in sufficient contact with the sewage, resulting in a slow increase in dissolved oxygen. When the impeller is −20 mm underwater, the hydraulic jump is more obvious: the stirring effect on the deep sewage is enhanced and the water circulation is accelerated; even the growth rate of the dissolved oxygen concentration increases. When the immersion depth is less than −20 mm, the impeller mainly plays the role of stirring the mixture, and the dissolved oxygen concentration increases slowly.
As shown in Figure 9, the dissolved oxygen transfer rate decreases with an increase in the sludge concentration. The increase in sludge concentration and sludge viscosity affect the hydraulic jump and the degree of turbulence near the impeller. The height and range of the hydraulic jump decrease, the resistance to oxygen mass transfer increases, and the growth rate of the dissolved oxygen concentration decreases when the sludge is thick.
Taking the time as the abscissa and the logarithmic oxygen deficit as the ordinate, we fit a straight line and the fitting effect is perfect. The inverse of the slope is the total oxygen transfer coefficient, . The logarithmic oxygen deficit and the total oxygen transfer coefficient are highlighted in the following paragraphs.
As shown in Figure 10, the total oxygen transfer coefficient increases with the increase in rotation speed; thus, the dissolved oxygen transfer rate increases. The main reasons are the following. (1) The double-film theory shows that the main resistance to oxygen transfer from the gas phase to the liquid phase is the liquid film. The liquid film thickness decreases and the resistance to mass transfer decreases with the increase in rotating speed, which is convenient for oxygen transfer at the gas–liquid interface. (2) Due to the rotation of the impeller, negative pressure is generated at the center of the impeller, and the air is entrained into the sewage. When the rotation speed increases, the negative pressure increases, the amount of air entrained in the sewage increases, and the number of bubbles formed in the liquid phase increases, which is conducive to oxygen mass transfer. (3) The axial lifting effect of the sewage is enhanced and the hydraulic jump effect is strengthened. The hydraulic jump height and radius are increased when the rotational speed increases. As the gas-liquid interface area increases, the amount of air folded into the sewage increases, and the mass transfer of bubbles is enhanced.
As shown in Figure 11, the total oxygen transfer coefficient first increases and then decreases. The dissolved oxygen transfer rate first increases and then decreases with the increase in immersion depth. The dissolved oxygen rate reaches the maximum at an immersion depth of −20 mm. When the immersion depth is higher than 0 mm, the impeller’s effect of sewage lifting is weakened, and the hydraulic jump effect is notably weakened. When the impeller is at the same level as the liquid level or is slightly lower, the impeller is in full contact with the sewage and the distance between the impeller and the bottom of the aeration tank is relatively close, which has a great effect on the sewage. The hydraulic jump height and the radiation radius increase, and more air is stirred into the sewage to enhance the mass transfer of the bubbles.
When the immersion depth is −20 mm, the distance between the impeller and the liquid’s surface enables the level of the hydraulic jump to reach the maximum; as the stirring ability of the sewage is strengthened, the flow rate of the sewage increases. The sewage is raised to the shallow area quickly, so that the oxygen mass transfer rate is now at its highest.
As shown in Figure 12, the total oxygen transfer coefficient decreases with the increase in sludge concentration. The dissolved oxygen transfer rate decreases. The main reasons are the following. (1) The hydraulic jump height and the hydraulic jump radius both decrease with the increase in the sludge concentration and the sewage viscosity. As a result, the amount of air entrained by the water jump is reduced, air bubbles that have formed in the sewage are reduced, and the mass transfer of air bubbles is suppressed. (2) The turbulent flow near the impeller decreases, the liquid film resistance increases, the oxygen mass transfer rate slows down with the increase in sludge concentration, and the sewage viscosity increases.
3.2.2. Standard Power Efficiency
The standard power efficiency [16] represents the oxygen content transferred to the liquid phase when a certain amount of electrical energy is consumed, under standard conditions. The formula is:
where SAE is the standard power efficiency, in , is the volume of water, in , is the saturated concentration of oxygen, in , and is the power consumed by the motor, in .
Figure 13a shows the variations in standard power efficiency with rotational speed. It shows that the standard power efficiency increases with the increase in rotational speed. As the speed increases, the standard oxygenation capacity increases, and the power consumption of the aerator increases, but the increase is less than the standard oxygenation capacity, so the standard power efficiency increases with the increase in speed.
The variation of standard power efficiency according to immersion depth is shown in Figure 13b. It shows that the standard dynamic efficiency first increases and then decreases with an increase in the immersion depth, and reaches the maximum when the immersion depth is −8 mm. When the impeller is higher than the liquid level, the contact area between the impeller and the sewage is limited, so the power consumption is low and the standard oxygenation capacity is low; therefore, the standard power efficiency is small. When the impeller is lower than the liquid level, the immersion depth is deeper, the resistance to the sewage is large, the power consumption is large, and the standard oxygenation capacity is small, so that the standard power efficiency is smaller. When the impeller is level with the liquid, the power consumption also increases with an increase in the immersion depth.
Figure 13c depicts the variations in standard power efficiency at different sludge concentrations. It shows that the standard dynamic efficiency decreases with the increase in the sludge concentration. The power consumed by the impeller during operation increases with the increase in the sludge concentration, so the standard power efficiency increases with the sludge concentration. The maximum standard power efficiency is seen in clean-water conditions.
4. Internal Flow Test
4.1. Test Steps
The flow rate and sludge concentration are measured at the specified measuring points under conditions where the rotational speed is 250 rpm, the immersion depth is 0 mm, and the sludge concentration is 2 g/L. The flow rate text steps are as follows:
First, fix the flowmeter, and begin measurement when the inverted umbrella aerator is working stably. Record the data every 20 s at each measurement point 10 times, continuously, and take the arithmetical average. The steps of sludge concentration measurement are as follows:
- Fix the probe in the sludge, making it parallel to the direction of the water flow. Start the measurement after the inverted umbrella aerator is working stably.
- Use a syringe to sample 200 mL of the sewage at the measuring point.
- Dry the sample at 105° C for 60 min, then weigh it with an electronic balance, record the weight, and calculate the sludge concentration at the measuring point.
4.2. Discussion
The specific results of the flow rate tests are shown in the following figures.
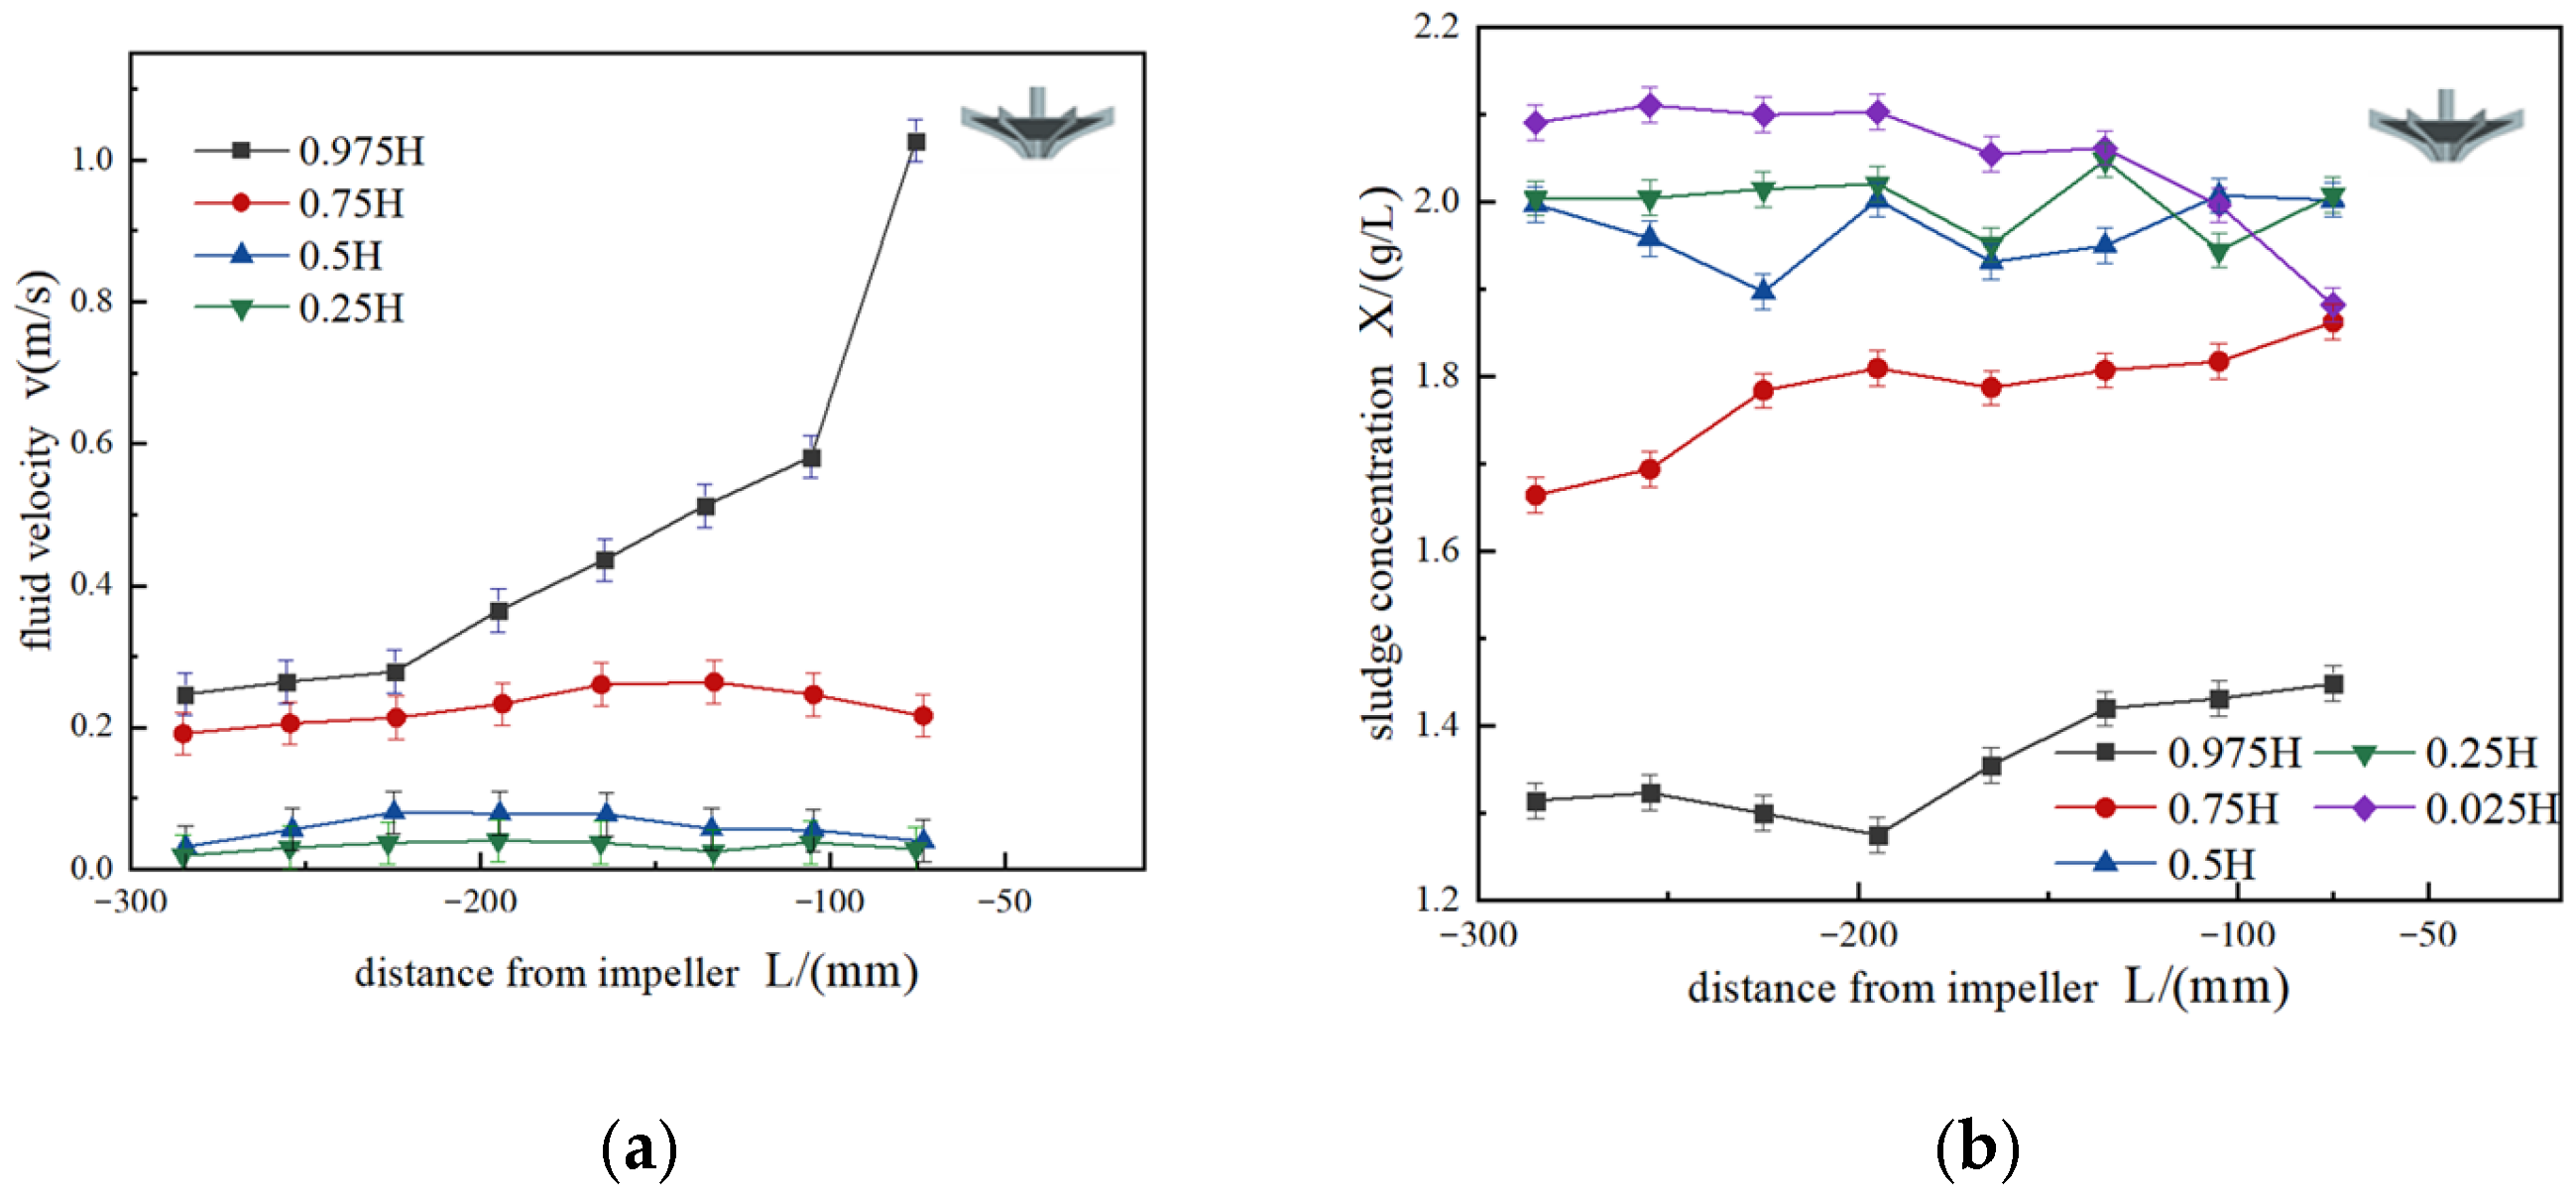
As can be seen in Figure 14a, the flow velocity is faster close to the impeller. The turbulence of the flow near the impeller is greater and the working force on the sewage is stronger, due to the rotating action of the impeller. The velocity of the shallow water is closely related to the radial distance, while the velocity of the deep water is hardly affected by the radial distance. The main reason for this difference [17] is that the shallow water is close to the impeller, while the turbulence near the impeller region is large, and the bubbles mainly gather in the shallow water. When a number of bubbles have gathered, a piston tail flow is formed, which results in energy loss and a flow rate decrease. Conversely, there are fewer air bubbles in the deep water.
Once the inverted umbrella aerator is working stably, the flow rate is measured; the specific results are shown in Figure 14b. The sludge concentration in the shallow water varies greatly, but in the deep water, the sludge is distributed uniformly, with a concentration of about 2 g/L. The vertical settlement movement of the sludge is mainly caused by gravity, the interactions between the sludge particles, and the centrifugal force of the impeller. The impeller speed is set at 250 rpm and the centrifugal force generated is great; the movement of the sludge is mainly affected by this centrifugal force. Therefore, the distribution of sludge in the deep water is uniform. The shallow water is closer to the impeller. During the rotating action of the impeller, the shallow water has greater turbulence. Overall, the bubbles mainly gather in the shallow water, and the movement of the bubbles affects the movement of the sludge particles.
5. Conclusions
In this paper, a three-phase flow test bench for an inverted umbrella aerator is established for studying its influence on aeration performance. The effect of various parameters on the aeration performance is investigated, taking different rotational speeds, immersion depths, and sludge concentrations. To study the internal flow field, the flow velocity and sludge distribution are measured. The results of this experiment are as follows. (1) The total oxygen transfer coefficient, standard oxygenation capacity, and standard power efficiency increase with the increase in rotating speed under the conditions of constant immersion depth and sludge concentration. The total oxygen transfer coefficient and standard oxygenation capacity first increase and then decrease with the decline in immersion depth, and reach a maximum at a −20 mm immersion depth, with a rotating speed of 250 rpm and a sludge concentration of 2 g/L. The standard dynamic efficiency first increases and then decreases with an increase in immersion depth and reaches its maximum at an −8 mm immersion depth. The performance of the inverted umbrella aerator decreases with an increase in sludge concentration. (2) The flow velocity near the impeller in the aeration tank is faster, the turbulence is larger, and the function of the sewage is stronger. The velocity of the shallow water body is greatly affected by the radial distance, and the velocity of the deep water is barely affected by the radial distance. (3) When the inverted umbrella aerator is operating stably, the sludge concentration in the shallow water varies greatly, and the sludge distribution in the deep water is widespread. The vertical settlement movement of the sludge is mainly caused by gravity, the interaction between sludge particles, and the centrifugal force of the impeller.
Author Contributions
Conceptualization, S.H. and L.D..; methodology, S.H and R.H.; validation, S.H., L.D. and H.L.; formal analysis, S.H.; investigation, J.G.; data curation, J.G.; writing—original draft preparation, S.H.; writing—review and editing, C.D.; visualization, J.G.; supervision, H.L.; project administration, L.D. All authors have read and agreed to the published version of the manuscript.
Funding
This research received no external funding.
Institutional Review Board Statement
Not applicable.
Informed Consent Statement
Not applicable.
Data Availability Statement
Not applicable.
Conflicts of Interest
The authors disclosed no relevant relationships.
References
- Anastasios, I.S. Modelling of oxidation ditches using an open channel flow 1-D advection-dispersion equation and ASM1 process description. Water Sci. Technol. 1997, 36, 269–276. [Google Scholar] [CrossRef]
- Lesage, N.; Sperandio, M.; Lafforgue, C.; Cockx, A. Calibration and application of a 1-d model for oxidation ditches. Chem. Eng. Res. Des. 2003, 81, 1259–1264. [Google Scholar] [CrossRef]
- Simon, S.; Roustan, M.; Audic, J.M.; Chatellier, P. Prediction of mean circulation velocity in oxidation ditch. Environ. Technol. 2001, 22, 195–204. [Google Scholar] [CrossRef] [PubMed]
- Moullec, Y.; Potier, O.; Gentric, C.; Leclerc, P. Flow field and residence time distribution simulation of a cross-ow gas-liquid wastewater treatment reactor using cfd. Chem. Eng. Sci. 2008, 63, 2436–2449. [Google Scholar] [CrossRef]
- Zhang, D.; Guo, L.; Xu, D.; Chen, Y. Simulation of component distributions in a full-scale carrousel oxidation ditch: A model coupling sludge-wastewater two-phase turbulent hydrodynamics with bioreaction kinetics. Environ. Eng. Sci. 2009, 27, 154. [Google Scholar] [CrossRef]
- Xing, P.; Qiu, B. The oxidation ditch ow field analysis pushed by the new type surface inverted umbrella aerator. In Proceedings of the 2013 Third International Conference on Intelligent System Design and Engineering Applications, Hong Kong, China, 16–18 January 2013; pp. 53–55. [Google Scholar] [CrossRef]
- Xing, P.; Zhao, J.; Xiu, Y. The finite element analysis and optimal design to inverted umbrella aerator. Adv. Mater. Res. 2011, 199–200, 187–192. [Google Scholar] [CrossRef]
- Ming, J.; Dong, L.; Liu, H.; Zhao, Y.; Yao, H. Influence of blade shape on performance in inverse umbrella aerator. J. Drain. Irrig. Mach. Eng. 2018, 36, 104–110. [Google Scholar]
- Zhou, W.; Fan, K.; Guo, Q. Study on oxygen transfer characteristics of inverted-umbrella type surface aerator. Ind. Water Wastewater 2013, 44, 58–6080. [Google Scholar]
- Wang, Y.; Ming, J.; Dong, L.; Liu, H.; Liu, J.; Wang, W. Experiment on influence of operating parameters on aeration performance in inverse umbrella aerator. Trans. Chin. Soc. Agric. Eng. 2017, 33, 67–73. [Google Scholar]
- Xu, J.; Zhang, D. A fluid and solid two-phase ow model and modeling of a carrousel oxidation ditch. Acta Sci. Circumstantiate 2008, 12, 2622–2627. [Google Scholar] [CrossRef]
- Long, F.; Xu, N.; Wang, Z.; Shi, H. PDA experiments and cfd simulation of a lab-scale oxidation ditch with surface aerators. Chem. Eng. Res. Des. 2010, 88, 23–33. [Google Scholar] [CrossRef]
- Zhang, D.; Mei, J.; Zhao, R.; Huang, J.; Jin, Y. Response surface method-based optimization of impeller of fluoroplastic two-phase ow centrifugal pump. J. Drain. Irrig. Mach. Eng. 2020, 38, 898. [Google Scholar]
- Dong, L.; Guo, J.; Liu, J.; Liu, H.; Dai, C. Experimental study and numerical simulation of gas-liquid two-phase ow in aeration tank based on cfd-pbm coupled model. Water 2020, 12, 1569. [Google Scholar] [CrossRef]
- Dong, L.; Liu, J.; Liu, H.; Dai, C.; Gradov, D.V. Study on the internal two-phase ow of the inverted-umbrella aerator. Adv. Mech. Eng. 2019, 11, 1687814019871731. [Google Scholar] [CrossRef]
- Roppongi, T.; Mizuno, N.; Miyagawa, Y.; Kobayashi, T.; Nakagawa, K.; Adachi, S. Solubility and mass transfer coefficient of oxygen through gas–and water–lipid interfaces. J. Food Sci. 2021, 86, 867–873. [Google Scholar] [CrossRef] [PubMed]
- Funfschilling, D.; Huaizhong, L. Effects of the injection period on the rise velocity and shape of a bubble in a non-Newtonian fluid. Chem. Eng. Res. Des. 2006, 84, 875–883. [Google Scholar] [CrossRef]
Figure 1.
Diagram of the working principles of an inverted umbrella aerator.
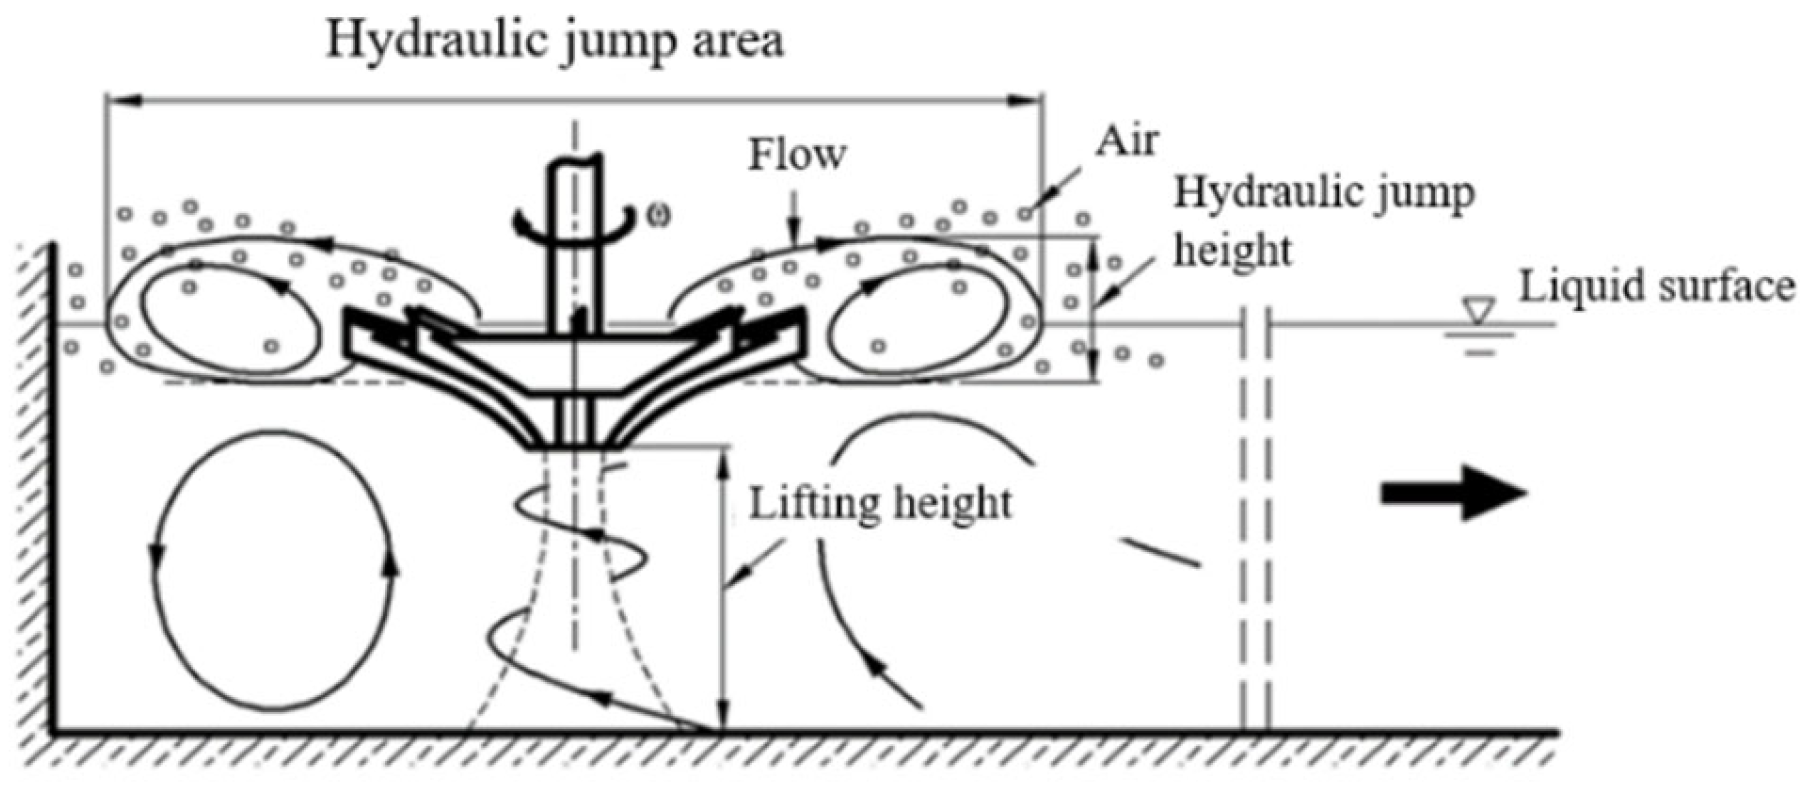
Figure 2.
Schematic diagrams of the aeration tank and impeller.

Figure 3.
Schematic diagrams of the aeration tank and impeller.
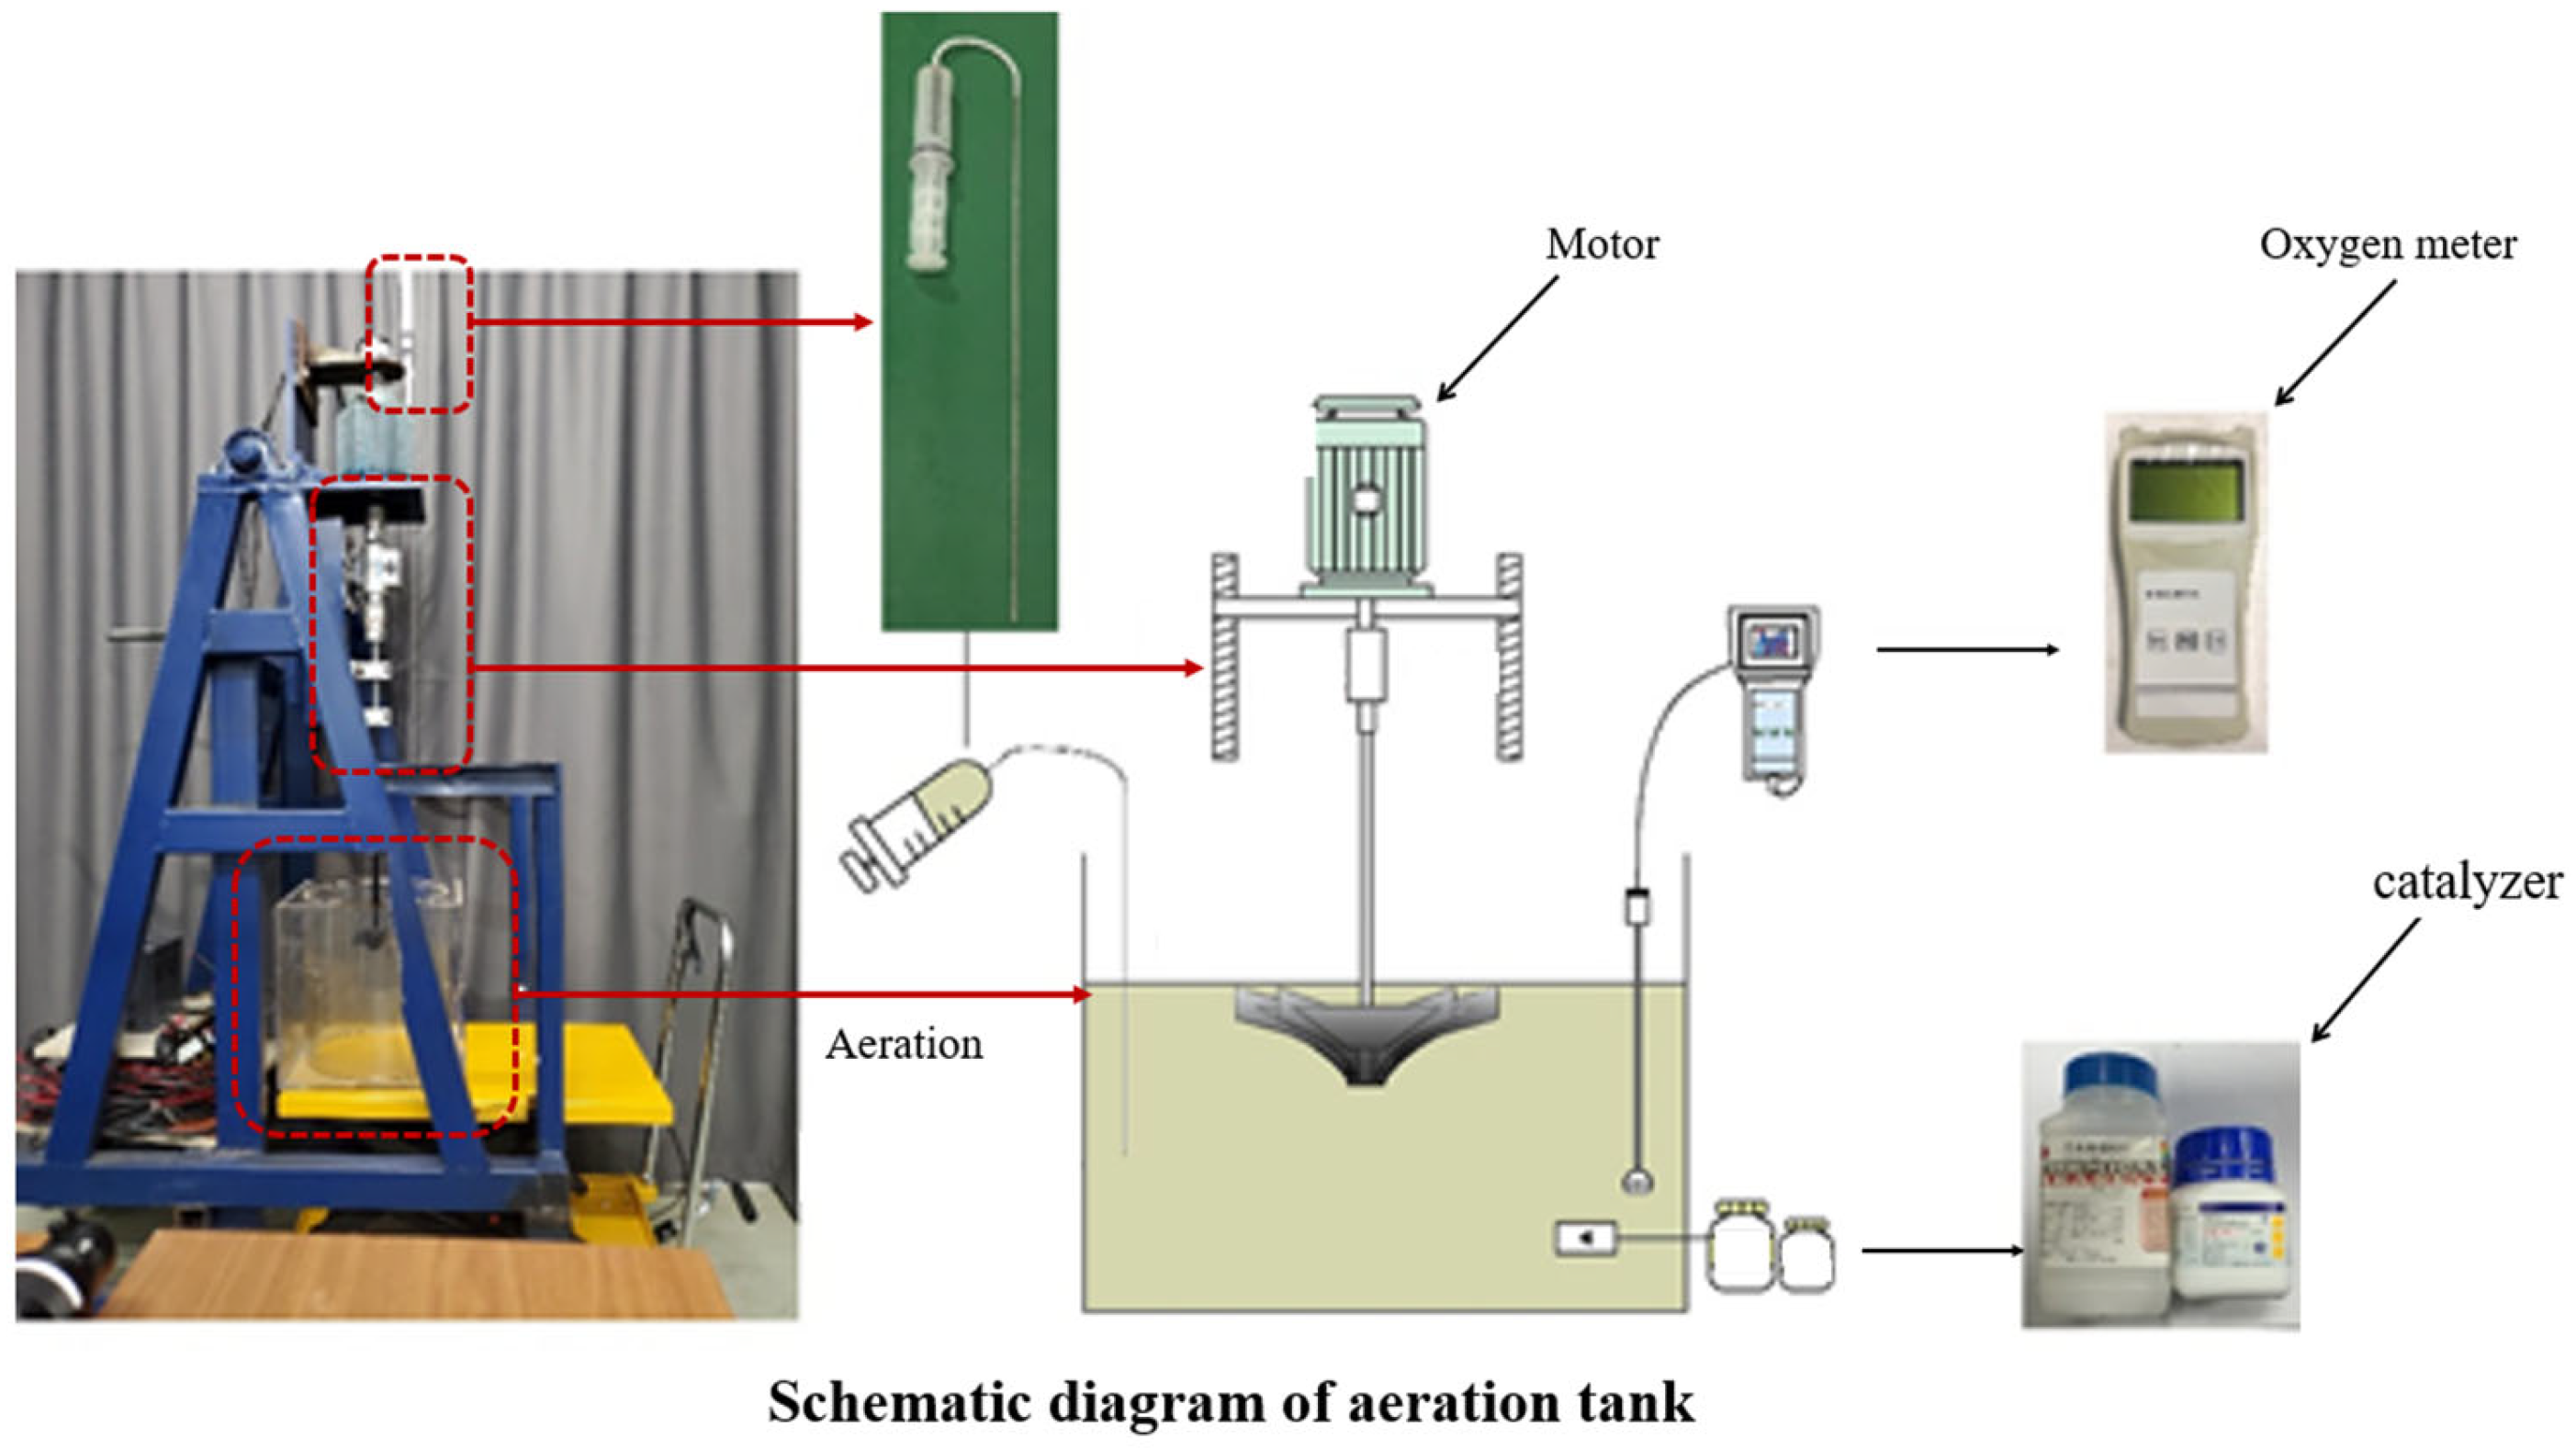
Figure 4.
Flow velocity and sludge concentration measuring points: (a) velocity measuring points; (b) concentration measuring points.
Figure 4.
Flow velocity and sludge concentration measuring points: (a) velocity measuring points; (b) concentration measuring points.

Figure 5.
Schematic diagram of the aeration tank and impeller.

Figure 6.
Schematic diagram of the double membrane theory.
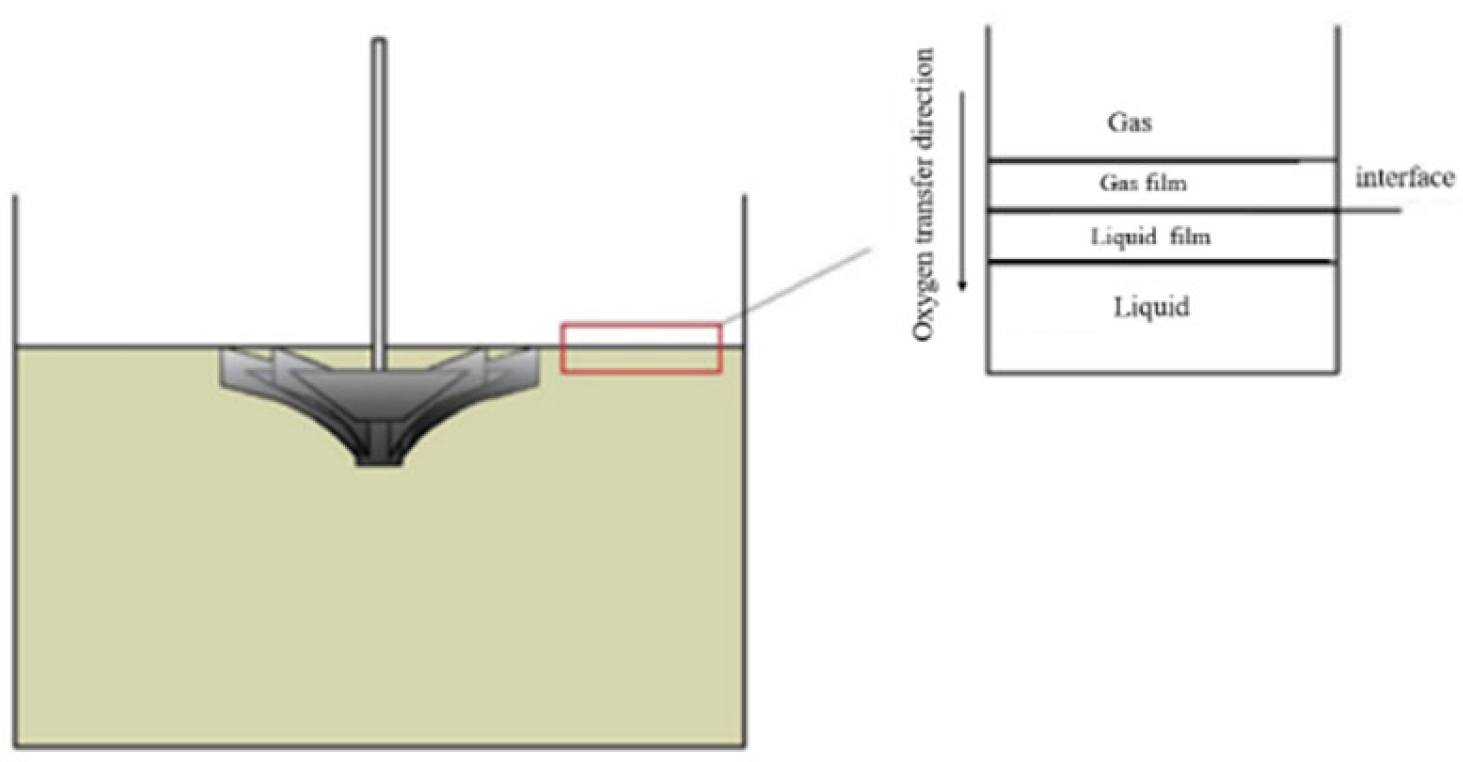
Figure 7.
The dissolved oxygen concentrations at different speeds.

Figure 8.
The dissolved oxygen concentrations at different immersion depths.
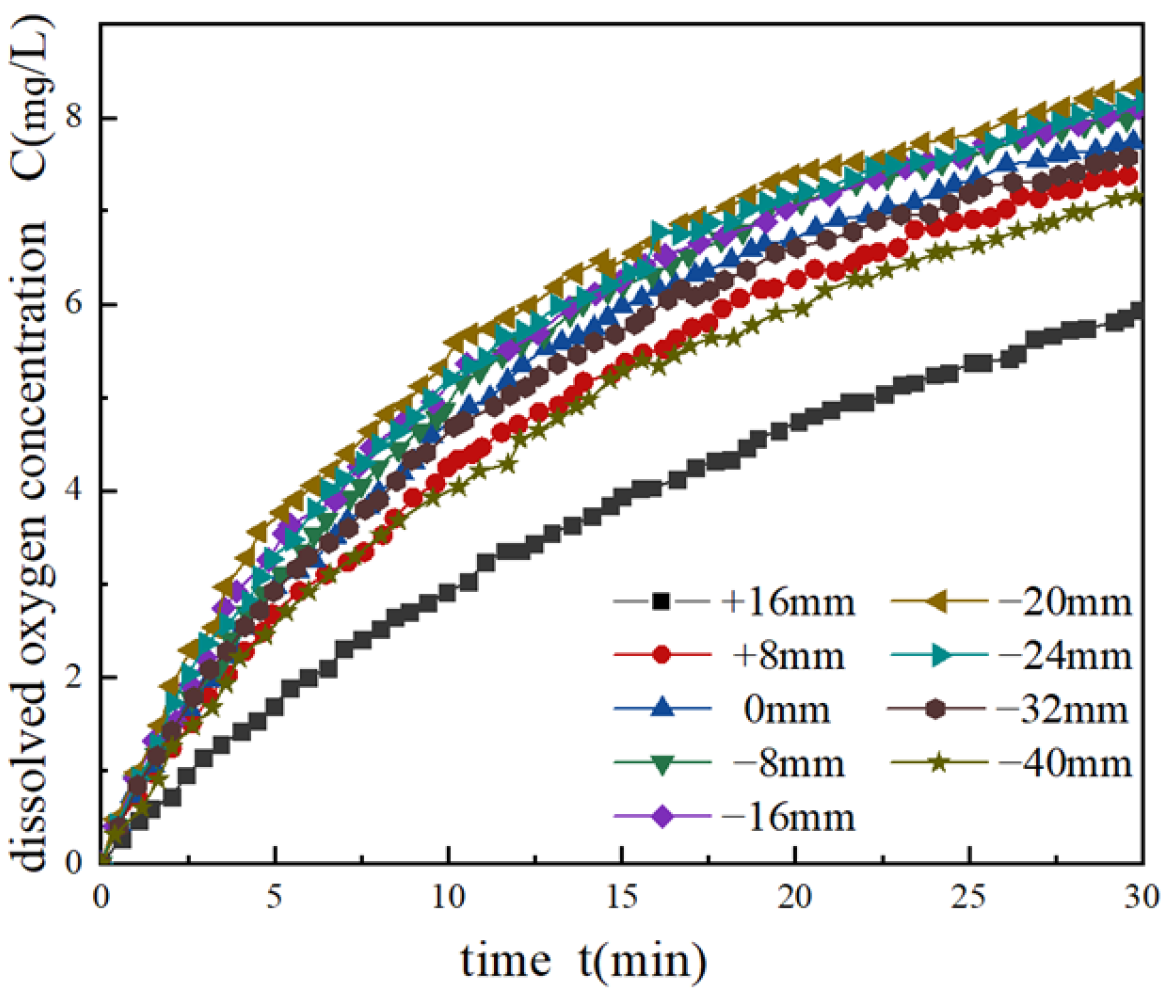
Figure 9.
The dissolved oxygen concentrations at different sludge concentrations.
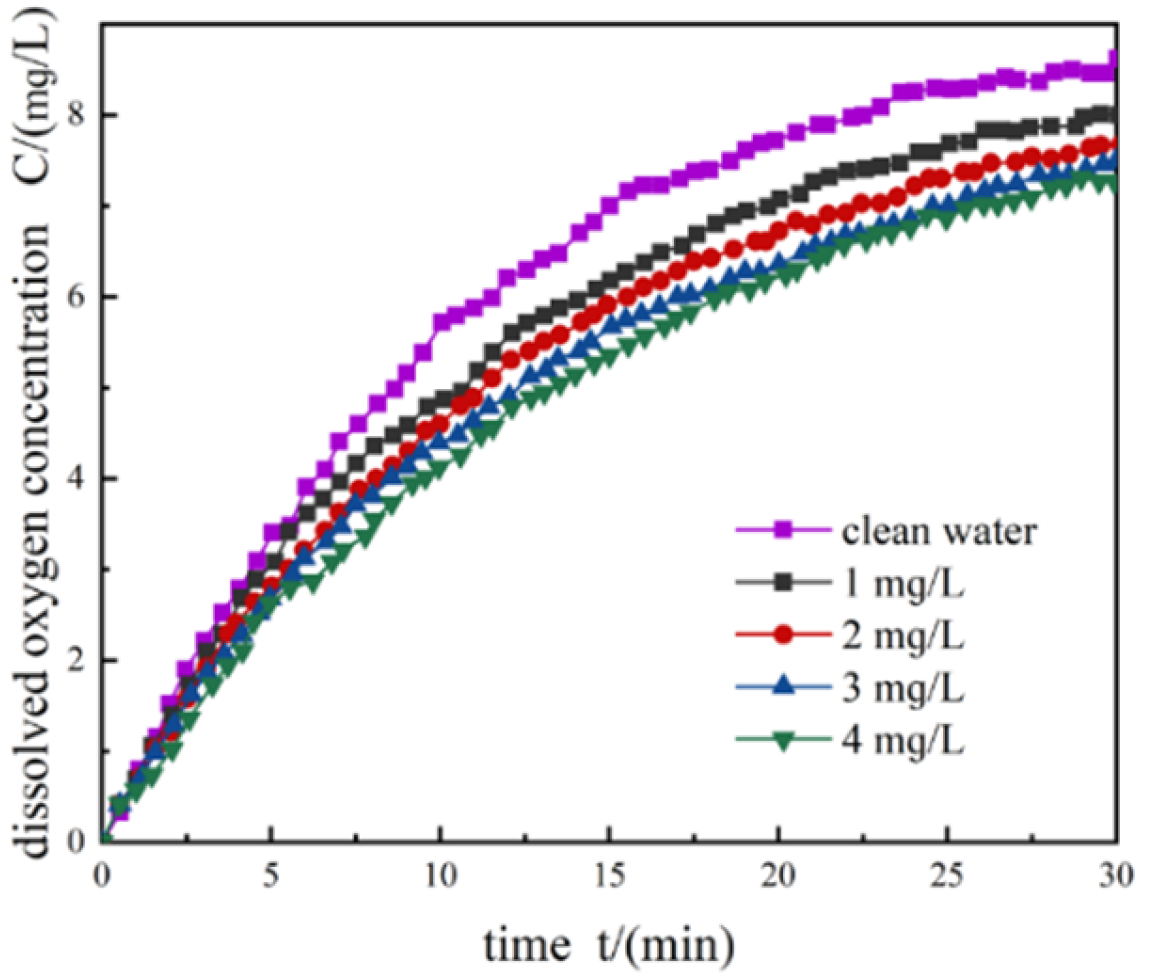
Figure 10.
The logarithmic oxygen deficit and total oxygen transfer coefficient at different speeds: (a) logarithmic oxygen deficit; (b) total oxygen transfer coefficient.
Figure 10.
The logarithmic oxygen deficit and total oxygen transfer coefficient at different speeds: (a) logarithmic oxygen deficit; (b) total oxygen transfer coefficient.

Figure 11.
Logarithmic oxygen deficit and total oxygen transfer coefficient at different immersion depths: (a) logarithmic oxygen deficit; (b) total oxygen transfer coefficient.
Figure 11.
Logarithmic oxygen deficit and total oxygen transfer coefficient at different immersion depths: (a) logarithmic oxygen deficit; (b) total oxygen transfer coefficient.

Figure 12.
Logarithmic oxygen deficit and total oxygen transfer coefficient at different sludge concentrations: (a) logarithmic oxygen deficit; (b) total oxygen transfer coefficient.
Figure 12.
Logarithmic oxygen deficit and total oxygen transfer coefficient at different sludge concentrations: (a) logarithmic oxygen deficit; (b) total oxygen transfer coefficient.
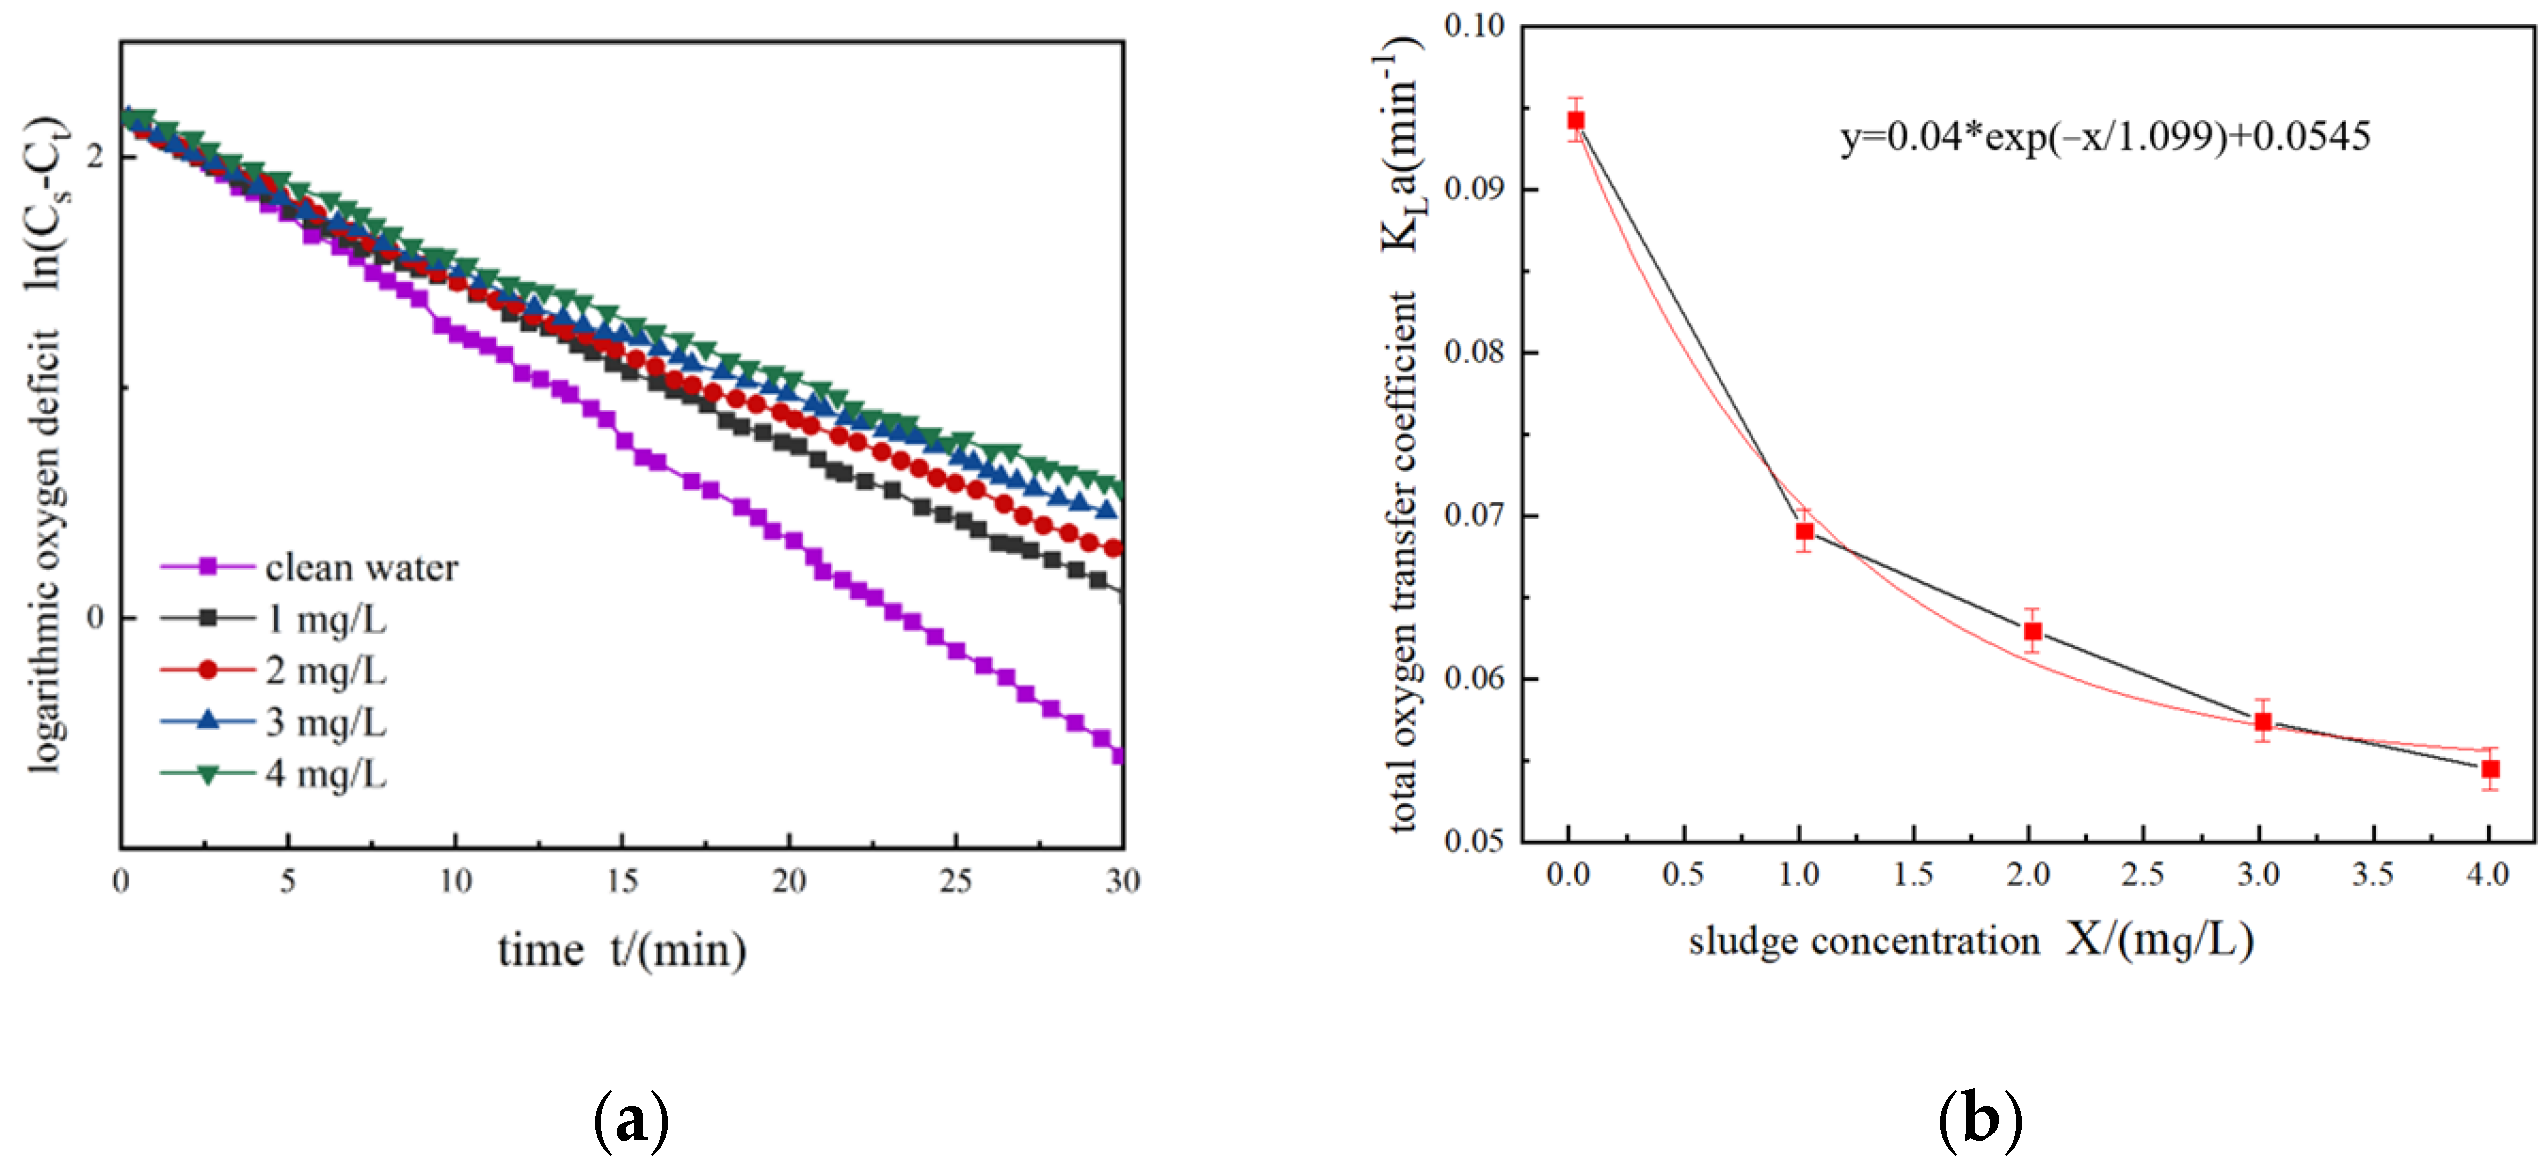
Figure 13.
Standard power efficiency: (a) at different speeds; (b) at different immersion depths; (c) at different sludge concentrations.
Figure 13.
Standard power efficiency: (a) at different speeds; (b) at different immersion depths; (c) at different sludge concentrations.
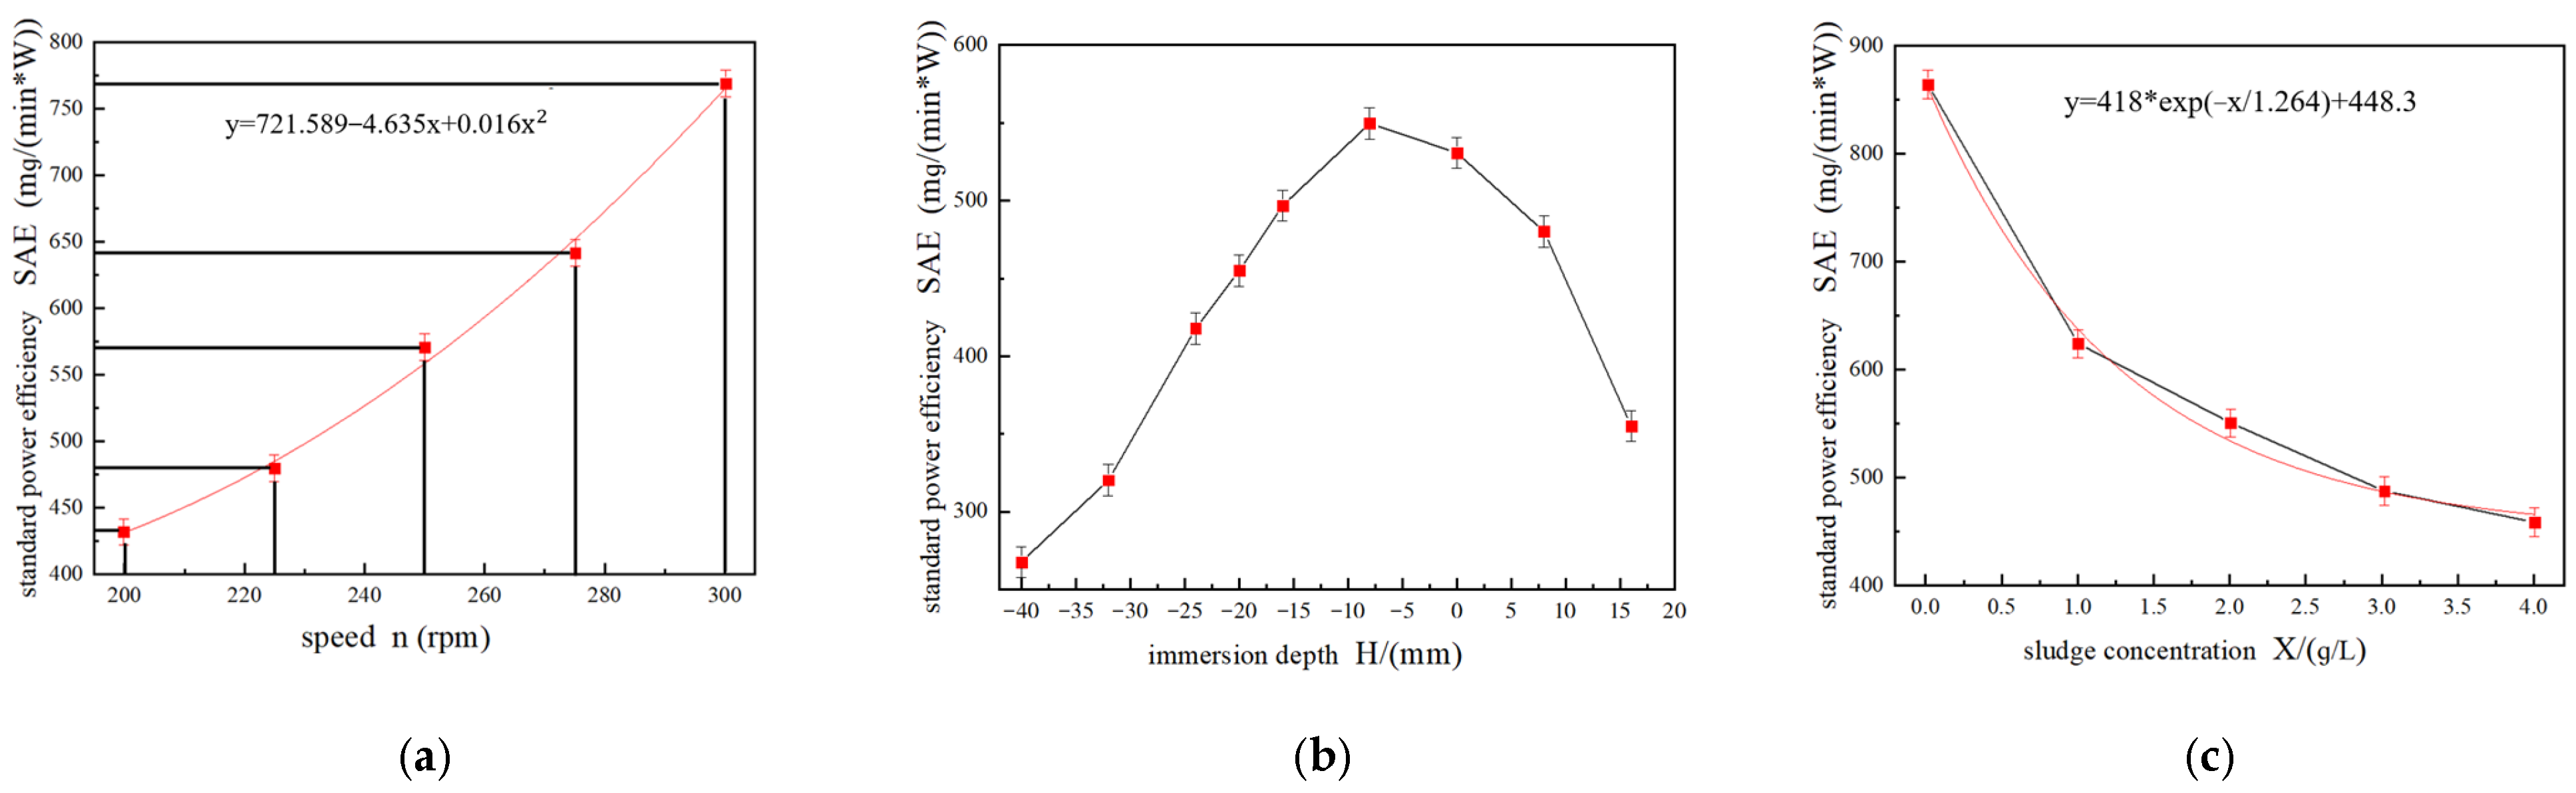
Figure 14.
(a) The flow rate of each measuring point. (b) The sludge concentration at each measuring point.
Figure 14.
(a) The flow rate of each measuring point. (b) The sludge concentration at each measuring point.

Table 1.
Test instrument parameters.
| Type | Model | Range | Precision | Productor |
|---|---|---|---|---|
| Portable Flow Meter | SL-50B | 0.01–5 m/s | 0.001 | Sheng Rong |
| Dissolved Oxygen Meter | JPB-607A | 0~20 mg/L | ±0.3 mg/L | Hai Ci |
| Torque meter | CYT-302 | 0–20 N·m | 0.25 | Tian Yu |
Table 2.
Test scheme.
| Liquid Level | 400 | ||||||||
|---|---|---|---|---|---|---|---|---|---|
| Rotating speed | 200 | 225 | 250 | 275 | 300 | ||||
| Immersion deth | +16 | +8 | 0 | −8 | −16 | −20 | −24 | −32 | −40 |
| Sludge concentration | 0 | 1 | 1.5 | 2 | 2.5 | 3 | 3.5 | 4 | 4.5 |
Publisher’s Note: MDPI stays neutral with regard to jurisdictional claims in published maps and institutional affiliations. |
© 2022 by the authors. Licensee MDPI, Basel, Switzerland. This article is an open access article distributed under the terms and conditions of the Creative Commons Attribution (CC BY) license (https://creativecommons.org/licenses/by/4.0/).
Share and Cite
MDPI and ACS Style
Hu, S.; Dong, L.; Hua, R.; Guo, J.; Liu, H.; Dai, C. Experimental Study of a Gas-Liquid-Solid Three-Phase Flow in an Aeration Tank Driven by an Inverted Umbrella Aerator. Processes 2022, 10, 1278. https://doi.org/10.3390/pr10071278
AMA Style
Hu S, Dong L, Hua R, Guo J, Liu H, Dai C. Experimental Study of a Gas-Liquid-Solid Three-Phase Flow in an Aeration Tank Driven by an Inverted Umbrella Aerator. Processes. 2022; 10(7):1278. https://doi.org/10.3390/pr10071278
Chicago/Turabian StyleHu, Siyuan, Liang Dong, Runan Hua, Jinnan Guo, Houlin Liu, and Cui Dai. 2022. "Experimental Study of a Gas-Liquid-Solid Three-Phase Flow in an Aeration Tank Driven by an Inverted Umbrella Aerator" Processes 10, no. 7: 1278. https://doi.org/10.3390/pr10071278
Note that from the first issue of 2016, this journal uses article numbers instead of page numbers. See further details here.