
Evaluation of Hydrodynamic Performance of New Random Packing Structure Using CFD


1
Department of Chemical and Material Engineering, National Yunlin University of Science and Technology, Yunlin 64002, Taiwan
2
Department of Chemical Engineering, National Tsing Hua University, Hsinchu 30013, Taiwan
*
Authors to whom correspondence should be addressed.
Processes 2022, 10(7), 1276; https://doi.org/10.3390/pr10071276
Submission received: 11 June 2022
/
Revised: 25 June 2022
/
Accepted: 27 June 2022
/
Published: 29 June 2022
(This article belongs to the Special Issue CFD Simulation of Multiphase Flow)
Abstract
:This study demonstrates the use of computational fluid dynamics (CFD) to evaluate the hydraulic properties of a new/complicated random packing structure, including flooding point, interfacial area, and liquid holdup. A standard Raschig ring and an extremely complex helical ring were employed as representative traditional and new structures. The combination of Green-Gauss node-based method with polyhedral meshing was presented to improve the hydraulic predictions. The CFD models were adopted to extend the liquid-to-gas ratio, L/G to the flooding points for hydraulic evaluation. The combination to calculate the gradient is essential for correctly evaluating the hydrodynamics of the complex helical ring. The predicted hydrodynamics for the helical ring were in good agreement with the experimental data. The helical ring has a wider operating range of L/G than the Raschig ring. Furthermore, we observed that the gas-liquid interface changed during the flooding and found that the inverted interfacial area was caused due to the flooding affecting the generation of the gas-liquid interface. The hydrodynamics of the Raschig ring and helical ring were compared based on CFD simulations; notably, the helical ring exhibited a wider range of L/G ratios and a better hydraulic performance. Finally, the flooding behaviors of the Raschig ring and the helical ring were investigated through volume fraction contours in CFD. We found that a part of the liquid was blown away, leading to the gas-liquid mixing area increasing at the flooding point. A severe flooding state can be investigated due to a large volume of liquid leaving the upper outlet which could be found when over the flooding point.
1. Introduction
Packing is widely applied in unit operations, such as those entailing distillation, absorption, and stripping columns [1]. Optimal packing can increase the number of transfer units effectively, thus reducing operating costs and increasing the operating range of pressure drops. Critical hydraulic properties are required to apply a newly designed packing on operating units, including flooding point, interfacial area, and liquid holdup. Among these properties, the flooding point investigation is the most necessary because it determines the operable range. However, the hydraulic correlations cannot estimate a newly designed packing because of lacking relative packing parameters. Although hydraulic properties can be investigated in experiments based on the packing having the mass production, it is undoubtedly a challenge for designing packing because of the considerable cost.
Computational fluid dynamics (CFD) are generally used to evaluate flow field behaviors [2,3,4,5]. CFD has undergone numerous improvements and has been widely used to investigate the hydraulic behavior of packings, which can be divided into the structured and random types. In the case of structured packings, a representative unit element of the flow field can be obtained to reduce the computational cost in CFD [6]; hence, CFD has been applied to structured packings. Shojaee et al. [7] compared the predicted hydraulic parameters of a structured packing column using CFD and separation research program (SRP) models. Compared to the SRP model, the CFD model could predict the pressure drop in the flooding region very well and the average error was approximately 13.4%.
By contrast, investigating random packings using CFD is challenging because of the complex geometric structure of such packings [8,9,10]. Thus, only a few reports have discussed random packings.
The CFD simulation of random packing under a multiphase flow generally entails the volume of fluid (VOF) and Eulerian models to describe hydraulic behavior. However, for multiphase flow with random packing, only the co-current flow with simple spherical packing has been discussed in previous papers. Lopes and Quinta-Ferreira [11] and Lopes and Quinta-Ferreira [12] reported the VOF and Eulerian models to predict the liquid holdup and pressure drop in a trickling flow regime based on spherical packing in a co-current system. The results indicated that both the VOF and Eulerian models agreed well with the hydrodynamic experiments. Wen et al. [13] reviewed recent studies on CFD simulations for packing towers. The results showed that CFD is generally employed in the investigation of energy and mass exchange between phases. However, a random packing should exhibit high porosity and through-flow structural properties [14], implying a highly complex flow field that causes non-physical hydraulic results in CFD simulations. Gupta et al. [15] investigated the gradient calculation for a biphasic flow system in a microchannel. The study reported that the surface tension force calculation might cause induced spurious flows near the gas-liquid interface in the microchannel because the pressure and viscous force could not balance the surface tension force. The flow field of the random packing beds also have many microchannels which leads to non-physical hydraulic results. Kim et al. [16] reported that complex flow fields easily cause non-physical hydraulic results in CFD simulations because the gradient could not be calculated correctly on discontinuous curvatures in CFD simulations. The results showed that the Green-Gauss node-based (GGNB) gradient scheme [17] might improve the drawbacks of the gradient calculation. However, the impact of GGNB on complex flow fields in random packing has not been investigated.
The hydraulic properties of the interfacial area, liquid holdup, and pressure drop were often discussed in CFD simulation for different random packings [18,19], but the flooding phenomenon simulated via CFD in a random packing tower has rarely been discussed. The main reason is that the random packing flow field is complicated: it easily leads to discontinuous curved surfaces, and may cause calculation errors; consequently, the flooding state cannot be calculated.
In our previous study [19], the Raschig ring was adopted as an example to demonstrate the packing stacking, meshing quality, and boundary setting of a counter-current flow. The results showed that the hydraulic properties obtained from CFD are in good agreement with the experimental data. However, the gradient calculation issue was not considered in the CFD model. As the packing structure becomes complicated, the CFD model underestimates hydraulic properties because the complicated structure of a flow field easily produces non-physical values in gradient calculations. Moreover, the flooding behavior of random packing using CFD simulation is still rarely discussed.
This study aims to demonstrate the use of CFD to evaluate the hydrodynamics of a new packing structure to accelerate packing design, including flooding point, interfacial area, and liquid holdup. Additionally, the flooding behavior was observed by fluid distributions in the CFD model. A standard Raschig ring was adopted, as a benchmark of the hydrodynamics, for comparison with the new random packing structure. A helical ring column was adopted as a new structure to demonstrate the use of CFD to evaluate the hydraulic properties of the new random packing structure. The combination of GGNB and polyhedral meshing was presented to evaluate the random packing hydrodynamics correctly. The hydrodynamics were in good agreement with the experimental results. In the CFD simulation, the flooding points were observed for the Raschig ring and helical ring. The helical ring had a wider L/G flooding point range than the Raschig ring. An inverted curve of the interfacial area was found when flooding occurred for the Raschig ring. On the contrary, the helical ring has a wider operating range of the L/G and better hydraulic performance than the Raschig ring.
2. CFD Modeling Approach
2.1. Governing Models Selection
Ansys Fluent R18®, a commercial CFD simulator, was employed in this study. The VOF method in the multiphase flow model was used to describe the flow characteristics of the air and water phases. In the VOF, the surface tension force, , was calculated using the continuum surface force model [20] and the surface tension coefficient was set as 0.072 N/m. The model was adopted as the turbulence equation.
The GGNB [17] method was used in this study to improve the estimation of gradients for various continuous variables. The Green-Gauss theorem is as follows:
where is the volumetric domain of the cell, is the normal face vector, and is the average value of any continuous variable at the centroid of the cell face. The face value from the Green-Gauss cell-based (GGCB) [21] gradient scheme is calculated from the arithmetic average of the values of the neighboring cell centroids, as follows:
where is the value of any continuous variable at the centroid of the cell , and is the value of any continuous variable at the centroid of cell , which is the neighboring cell of . In the GGNB method, can be evaluated using the arithmetic average of the nodal values on the face.
where is the number of nodes on the face and is the value of any continuous variable on the nodes of the cell face.
2.2. Packing Structures and Properties
Figure 1 shows the specifications of the Raschig ring and the helical ring adopted in this study. The size of the Raschig ring was a 6-mm outer diameter, 6-mm height, and a 4-mm inner diameter. For the helical ring, the height of the packing was 10.11 mm, and its diameter was 4 mm. The diameter of the helical tube was 0.6 mm, and the gap between the helical tubes was 0.18 mm.
Table 1 lists the flow field properties of the helical ring and Raschig ring. As shown in the table, the helical ring exhibited a 25% increase in the number of packing elements compared to the commercial Raschig ring; the specific packing area could be increased by 70%, and the porosity was increased by 10%.
2.3. Flow Fields of Packing Columns
Figure 2 shows the flow fields employed in this study for the Raschig ring and helical ring. The size of the two flow fields was 25-mm inner diameter and 22-mm height. The generation and meshing methods of the flow fields were referred from Kang et al. [19]. The four circular areas marked in red at the top were liquid inlets; the top remaining area marked in blue and the entire bottom surface marked in purple were set as the outlets. The wall of the column and packing elements were set as no-slip walls. The detailed boundary settings in Ansys Fluent ® are presented in Table 2.
Table 3 and Table 4 show comparisons between the tetrahedral mesh and polyhedral mesh for the Raschig ring and the helical ring flow fields by using the default mesh setting with 50 of the relevance in Ansys®. The results indicate that the polyhedral mesh can reduce the number of meshes by 40% and 13% compared to the tetrahedral mesh for the Raschig ring and the helical ring flow fields, separately. Mesh quality indices such as orthogonality and skewness were improved. Note that a skewness close to one and an orthogonal quality close to zero represents poor quality.
2.4. Convergence and Termination
A workstation with 144 cores in four CPUs of 2.4 GHz Intel® Xeon Gold was used to perform the CFD simulation. The time step size was set as 0.001 s to solve a maximum of 20 iterations per time step. The convergence conditions were set to 10−3 of the absolute residuals for all monitoring parameters, including the continuity, velocity, volume fraction of phases, and and for the viscous model. The initial transient state was set as a stationary gas phase that filled the flow field. A steady-state was defined as when the gas and liquid mass balance errors became stable and close to zero, and stability in the gas-liquid interfacial area, liquid holdup, and pressure drop was reached.
2.5. Calculations of Hydraulic Properties
The interfacial area, , is calculated using the iso-surface curve at 0.5 of the water volume fraction in Ansys Fluent R18®, which was suggested by Ataki and Bart [22]. The volume of the liquid in the flow field was treated as a liquid holdup. The liquid holdup fraction is expressed as
where is the volume of the liquid and is the total volume in the flow field.
The pressure drop is estimated by
where is the height of the column, and and are the gauge pressures of the bottom inlet and top outlet, respectively.
3. Experiments
A laboratory-scale packed bed absorber was employed to perform the experiments to validate the results of our CFD simulation with helical rings. The absorber was installed with two removable glass columns. The inlet gas flow (G) was fixed as 1 L/min from the top of the absorber and five liquid flow rates (L) from 0.1 L/min to 0.5 L/min were used to investigate the hydraulic behaviors. Detailed operating conditions are listed in Table 5. For the measurements of the hydraulic behaviors, refer to Kang et al. [19].
4. Results and Discussions
4.1. Gradient Calculations between GGCB and GGNB
Figure 3 shows the comparison of the hydraulic behaviors among the CFD simulations using a polyhedral or tetrahedral mesh combined with GGCB or GGNB and the experiment. Various methods were discussed only at L/Gs of 0.1 and 0.5, owing to the limitation of the computational cost.
Figure 3a shows a comparison of the interfacial areas. The CFD simulations using the tetrahedral mesh combined with GGCB or combined with GGNB underestimated the interfacial area compared with the experimental interfacial area. When the CFD simulation used a polyhedral mesh combined with GGCB, the prediction of the fraction area was improved, but the prediction slightly overestimated the fraction area. The interfacial area can only be accurately evaluated using a polyhedral mesh combined with a GGNB.
Figure 3b shows a comparison of the liquid holdup using various methods. The results showed that the methods of the tetrahedral mesh combined with GGCB and GGNB and polyhedral mesh combined with GGCB underestimated the liquid holdup significantly, compared to the experiment. The method of using the polyhedral mesh combined with GGNB was able to obtain a smaller error of the liquid holdup in the experiment.
Figure 3c shows a comparison of the pressure drops in various methods. The results showed that only the method of polyhedral mesh combined with GGNB could obtain the minimum error of the pressure drop in the experiment.
The comparisons of the hydraulic behaviors predicted by CFD simulations using a polyhedral or tetrahedral mesh combined with GGCB or GGNB and the experimental results are shown in Table 6.
4.2. Validation of Combination of Polyhedral Mesh and GGNB
In this study, the Raschig ring and helical ring were adopted as case studies. Since the Raschig ring has been comprehensively discussed in our previous work [19], this section aims at the CFD model validation of the helical ring.
Figure 4 shows a comparison of the hydraulic behaviors among the simulation, experiment, and correlation of the helical ring at L/Gs of 0.1 and 0.5. Figure 4a shows the interfacial area among the experiments, CFD simulations, and correlation. The difference in the interfacial area between the CFD simulation of the helical ring and the experiment was 5.0%, while the difference between the correlation and experiment was 28.6%. The correlation of the helical ring was calculated. As shown in the figure, the correlation from Billet and Schultes [23] overestimated the interfacial area of each L/G. Hence, the interfacial area estimated by the CFD simulation is more accurate than the interfacial area correlation.
Figure 4b shows that the CFD simulation can predict the liquid holdup more accurately than the correlation provided by Billet and Schultes [23]. The liquid holdup error between the CFD simulation and the experiment was 10%, and for the correlation and experiment it was 25.8%. The simulated liquid holdup of the helical ring was much closer to the experimental liquid holdup than the correlation.
The interfacial area and liquid holdup were overestimated by the correlations because the empirical correlations in the literature are generalized correlations developed for many types of packings by using data with much wider gas-liquid-flow ranges in much larger diameters.
The error in the pressure drop between the CFD simulation and the experiment was 9.7% and is shown in Figure 4c. There is no available correlation to predict the pressure drop of the helical ring; instead, the CFD simulation was implemented to evaluate the pressure drop. The predicted pressure drops of the helical ring matched the experimental data closely, and the simulated results showed a stable curve when L/G changed.
4.3. Hydrodynamic Evaluation for Raschig and Helical Rings
Figure 4 compares the hydraulic behaviors of the Raschig and helical rings with the increase of the L/G to over flooding points in the CFD simulation. In the figure, the symbols represent the simulation results; the curves represent the trend lines. Figure 4a shows that the pressure drop in the Raschig ring significantly increases when L/G was greater than around 2. The flooding point of the Raschig ring was estimated at L/G = 2.2 according to the flood rule of thumb [24]. By contrast, the helical ring exhibited a relatively stable pressure drop, indicating a wider operating condition in terms of L/G. The flooding point of the helical ring is at L/G = 4.2. As shown in Figure 4b, the interfacial area of the Raschig ring exhibited an inverted curve as L/G increased over 1.89. The interfacial area of 153 m2/m3 was observed at L/G = 1.89, after which it declined. The interfacial area declined because of the flooding affecting the gas-liquid thin film generation. Compared to the Raschig ring, the helical ring had a higher interfacial area, and the L/G ratio could be manipulated more extensively. When L/G reached 3.64, the interfacial area of the helical ring reached 182 m2/m3. As shown in Figure 5c, the helical ring exhibited a slightly higher liquid holdup than the Raschig ring under the same operating conditions. Owing to the wider operating range of the helical ring in terms of the flooding point, the maximum liquid holdup in the available operating conditions was significantly higher than that of the Raschig ring.
Figure 6a,b show the distribution of the liquid fraction for the Raschig ring and helical ring, respectively, for various L/G values. The blue area represents the gas channel, and the red area represents the liquid channel. The transition colors between red and blue represent the gas-liquid mixing area. Figure 6a shows that when L/G = 0.758, the gas-liquid interface was easily observed. As L/G increased to 1.89, part of the liquid was blown away, leading to the gas-liquid mixing area increasing. This state is close to flooding. A portion of the liquid was removed from the upper outlet. When L/G = 3.35, a substantial gas-liquid mixing area appears in the flow field to decrease the interfacial area generation; a large volume of liquid leaving the upper outlet could be found, which is a severe flooding state.
Figure 6b shows that the flooding point of the helical ring was higher than that of the Raschig ring. When L/G = 1.72, the gas and liquid areas were distinct. At L/G = 2.48, the volume of gas and liquid mixture tended to increase gradually. When L/G = 3.64, a small volume of liquid was left at the top of the column, and it can be inferred that the L/G of the flooding point for the helical ring may be greater than 3.64.
5. Conclusions
This study demonstrated the use of CFD to evaluate the hydraulic properties of a new random packing structure. A standard Raschig ring and an extremely complex helical ring were adopted as the traditional and newly designed structures in this study, respectively. We found that using the GGNB method to calculate the gradient and the use of the polyhedral meshing scheme are critical for evaluating the hydrodynamics correctly. The results show that the gas-liquid interface area, liquid holdup, and pressure drop are in good agreement with the experimental results.
The CFD models were employed to extend L/G to flooding points for hydraulic evaluation. In accordance with the flood rule of thumb [24], the Raschig ring flooding behaviors were investigated at L/G = 2. The helical ring has a wider L/G operating range than the Raschig ring to reach the flooding points. The gas-liquid interface changed when flooding occurred was investigated by the gas-liquid distributions. The inverted curve of the interfacial area of the Raschig ring was found because the flooding affected the gas-liquid interface generation. The helical ring has a higher interfacial area than the Raschig ring at the flooding point. The helical ring exhibited a slightly higher liquid holdup than the Raschig ring.
The flooding behaviors can be investigated through volume fraction contours. For the Raschig ring, as L/G closed to 1.89, the flooding behavior was investigated. A part of the liquid was blown away, leading to the gas-liquid mixing area increasing. When over 2 of L/G, a severe flooding state can be investigated due to a large volume of liquid leaving the upper outlet. As CFD can evaluate, for the helical ring the flooding point is better than the Raschig ring, because when L/G is at 3.64, a small volume of liquid is left at the top of the column, and it can be inferred that the L/G of the flooding point for the helical ring may be greater than 3.64.
Author Contributions
Conceptualization, J.-L.K.; methodology, J.-L.K.; software, J.-L.K. and S.-H.H.; validation, J.-L.K. and S.-S.J.; formal analysis, J.-L.K. and S.-H.H.; investigation, S.-H.H.; resources, S.-S.J.; data curation, J.-L.K. and S.-H.H.; writing—original draft preparation, J.-L.K.; writing—review and editing, J.-L.K. and S.-S.J.; visualization, S.-H.H.; supervision, J.-L.K. and S.-S.J.; project administration, J.-L.K. and S.-S.J. All authors have read and agreed to the published version of the manuscript.
Funding
The authors acknowledge the financial support provided by the Ministry of Science and Technology through the grants MOST 108-2218-E-007-058-MY3 and MOST 110-2636-E-224-001. The authors are grateful to the National Center for High-Performance Computing for the use of their facility.
Data Availability Statement
The data presented in this study are available on request from the corresponding authors.
Conflicts of Interest
The authors declare no conflict of interest.
References
- Humphrey, J.L.; Keller, G.E. Separation Process Technology; McGraw-Hill: New York, NY, USA, 1997. [Google Scholar]
- Jalili, B.; Aghaee, N.; Jalili, P.; Ganji, D.D. Novel usage of the curved rectangular fin on the heat transfer of a double-pipe heat exchanger with a nanofluid. Case Stud. Therm. Eng. 2022, 35, 102086. [Google Scholar] [CrossRef]
- Jalili, B.; Jalili, P.; Sadighi, S.; Ganji, D.D. Effect of magnetic and boundary parameters on flow characteristics analysis of micropolar ferrofluid through the shrinking sheet with effective thermal conductivity. Chin. J. Phys. 2021, 71, 136–150. [Google Scholar] [CrossRef]
- Jalili, B.; Sadighi, S.; Jalili, P.; Ganji, D.D. Characteristics of ferrofluid flow over a stretching sheet with suction and injection. Case Stud. Therm. Eng. 2019, 14, 100470. [Google Scholar] [CrossRef]
- Jalili, P.; Ganji, D.D.; Jalili, B.; Ganji, D.R.M. Evaluation of electro-osmotic flow in a nanochannel via semi-analytical method. Therm. Sci. 2012, 16, 1297–1302. [Google Scholar] [CrossRef]
- Hodson, J. Computational Fluid Dynamical Studies of Structured Distillation Packings. Ph.D. Thesis, Aston University, Birmingham, UK, April 1997. [Google Scholar]
- Shojaee, S.; Hosseini, S.H.; Razavi, B.S. Computational fluid dynamics simulation of multiphase flow in structured packings. J. Appl. Math. 2012, 2012, 917650. [Google Scholar] [CrossRef]
- Bai, H., Jr.; Theuerkauf, J.; Gillis, P.A.; Witt, P.M. A coupled DEM and CFD simulation of flow field and pressure drop in fixed bed reactor with randomly packed catalyst particles. Ind. Eng. Chem. Res. 2009, 48, 4060–4074. [Google Scholar] [CrossRef]
- Eppinger, T.; Seidler, K.; Kraume, M. DEM-CFD simulations of fixed bed reactors with small tube to particle diameter ratios. Chem. Eng. J. 2011, 166, 324–331. [Google Scholar] [CrossRef]
- Dixon, A.G.; Nijemeisland, M. CFD as a design tool for fixed-bed reactors. Ind. Eng. Chem. Res. 2001, 40, 5246–5254. [Google Scholar] [CrossRef]
- Lopes, R.J.; Quinta-Ferreira, R.M. CFD modelling of multiphase flow distribution in trickle beds. Chem. Eng. J. 2009, 147, 342–355. [Google Scholar] [CrossRef] [Green Version]
- Lopes, R.J.; Quinta-Ferreira, R.M. Numerical simulation of trickle-bed reactor hydrodynamics with RANS-based models using a volume of fluid technique. Ind. Eng. Chem. Res. 2009, 48, 1740–1748. [Google Scholar] [CrossRef]
- Wen, T.; Lu, L.; He, W.; Min, Y. Fundamentals and applications of CFD technology on analyzing falling film heat and mass exchangers: A comprehensive review. Appl. Energy 2020, 261, 114473. [Google Scholar] [CrossRef]
- Wagner, I.; Stichlmair, J.; Fair, J.R. Mass transfer in beds of modern, high-efficiency random packings. Ind. Eng. Chem. Res. 1997, 36, 227–237. [Google Scholar] [CrossRef]
- Gupta, R.; Fletcher, D.F.; Haynes, B.S. On the CFD modelling of Taylor flow in microchannels. Chem. Eng. Sci. 2009, 64, 2941–2950. [Google Scholar] [CrossRef]
- Kim, S.-E.; Makaro, B.; Caraen, D. A multi-dimensional linear reconstruction scheme for arbitrary unstructured mesh. In Proceedings of the 16th AIAA Computational Fluid Dynamics Conference, Orlando, FL, USA, 23–26 June 2003; p. 3990. [Google Scholar]
- Holmes, D.; Connell, S. Solution of the 2D Navier-Stokes equations on unstructured adaptive grids. In Proceedings of the 9th Computational Fluid Dynamics Conference, Buffalo, NY, USA, 13–15 June 1989; p. 1932. [Google Scholar]
- Haddadi, B.; Jordan, C.; Norouzi, H.R.; Harasek, M. Investigation of the pressure drop of random packed bed adsorbers. Chem. Eng. Trans. 2016, 52, 439–444. [Google Scholar]
- Kang, J.-L.; Ciou, Y.-C.; Lin, D.-Y.; Wong, D.S.-H.; Jang, S.-S. Investigation of hydrodynamic behavior in random packing using CFD simulation. Chem. Eng. Res. Des. 2019, 147, 43–54. [Google Scholar] [CrossRef]
- Brackbill, J.; Kothe, D.B.; Zemach, C. A continuum method for modeling surface tension. J. Comput. Phys. 1992, 100, 335–354. [Google Scholar] [CrossRef]
- Mishriky, F.; Walsh, P. Towards understanding the influence of gradient reconstruction methods on unstructured flowsimulations. Trans. Can. Soc. Mech. Eng. 2017, 41, 169–179. [Google Scholar] [CrossRef]
- Ataki, A.; Bart, H.J. Experimental and CFD simulation study for the wetting of a structured packing element with liquids. Chem. Eng. Technol. 2006, 29, 336–347. [Google Scholar] [CrossRef]
- Billet, R.; Schultes, M. Prediction of mass transfer columns with dumped and arranged packings: Updated summary of the calculation method of Billet and Schultes. Chem. Eng. Res. Des. 1999, 77, 498–504. [Google Scholar] [CrossRef]
- McCabe, W.L.; Smith, J.C.; Harriott, P. Unit Operations of Chemical Engineering; McGraw-Hill: New York, NY, USA, 1993. [Google Scholar]
Figure 1.
Structures of (a) Raschig ring and (b) helical ring.

Figure 2.
Boundaries of flow fields using (a) Raschig ring and (b) helical ring.

Figure 3.
Comparison of (a) interfacial area, (b) liquid holdup, and (c) pressure drop among the experimental, polyhedral, and tetrahedral meshes with GGNB.
Figure 3.
Comparison of (a) interfacial area, (b) liquid holdup, and (c) pressure drop among the experimental, polyhedral, and tetrahedral meshes with GGNB.
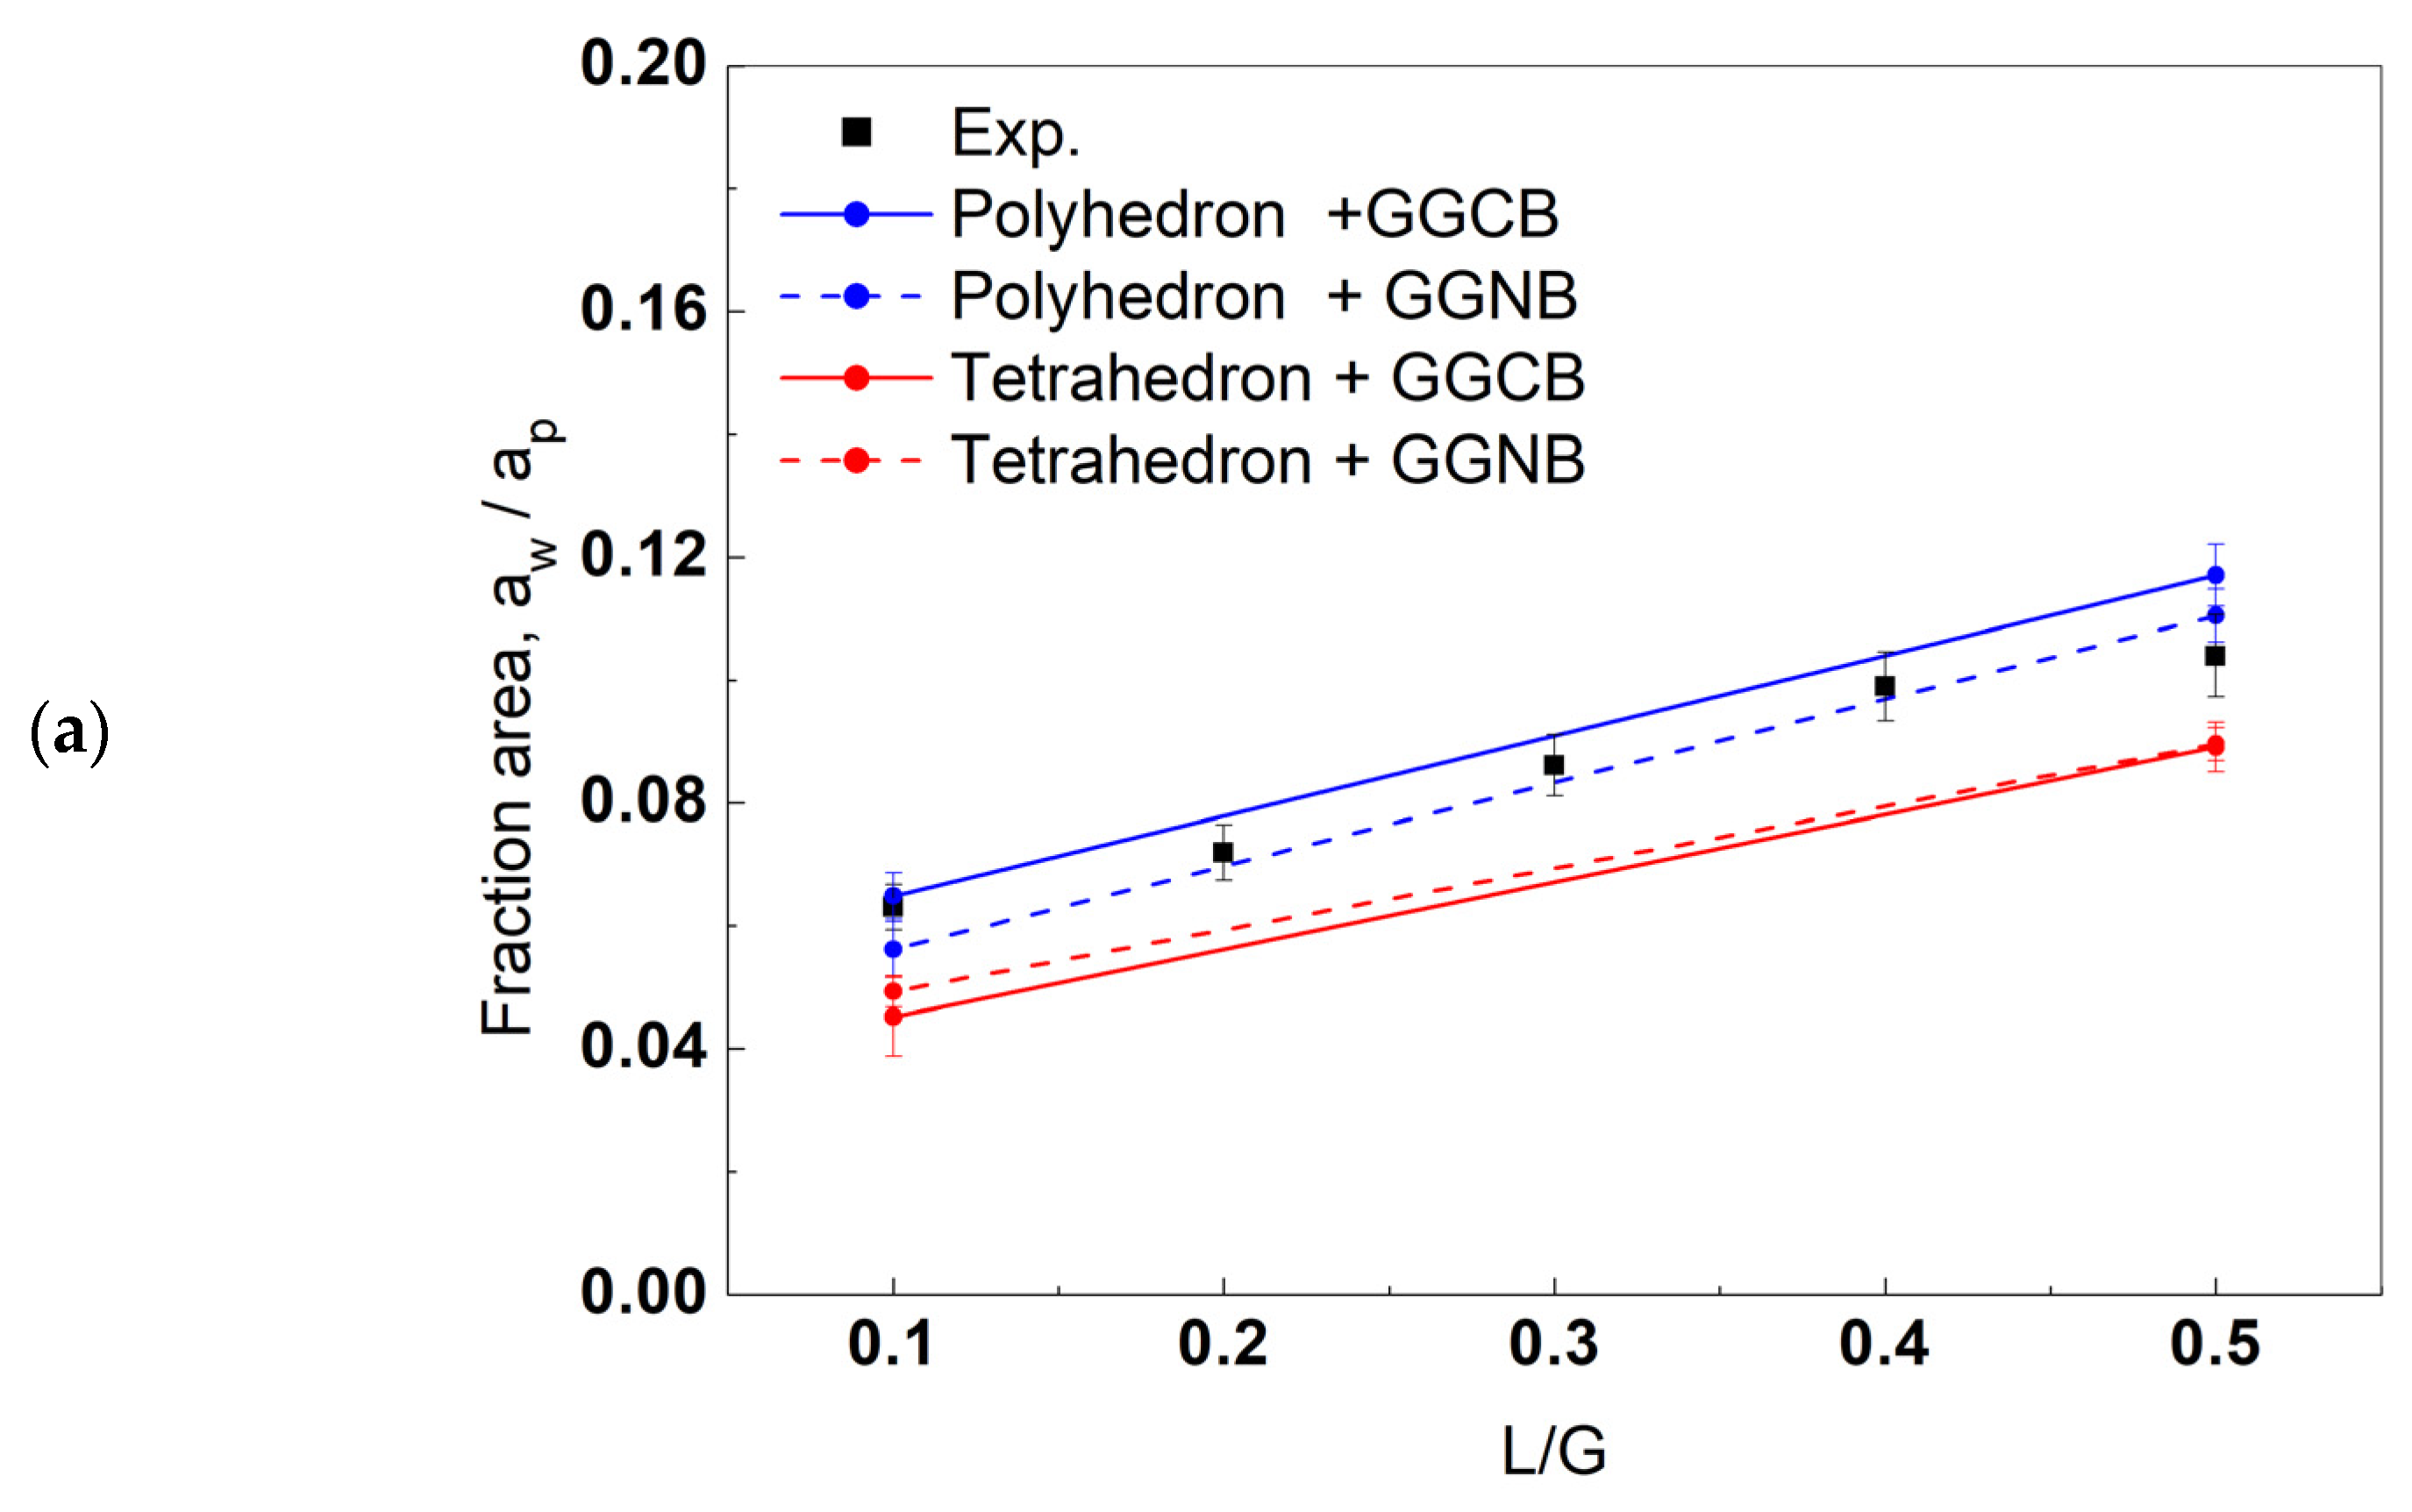

Figure 4.
Comparison of (a) interfacial area, (b) liquid holdup, and (c) pressure drop among the simulation, experiment, and correlation of the helical ring.
Figure 4.
Comparison of (a) interfacial area, (b) liquid holdup, and (c) pressure drop among the simulation, experiment, and correlation of the helical ring.
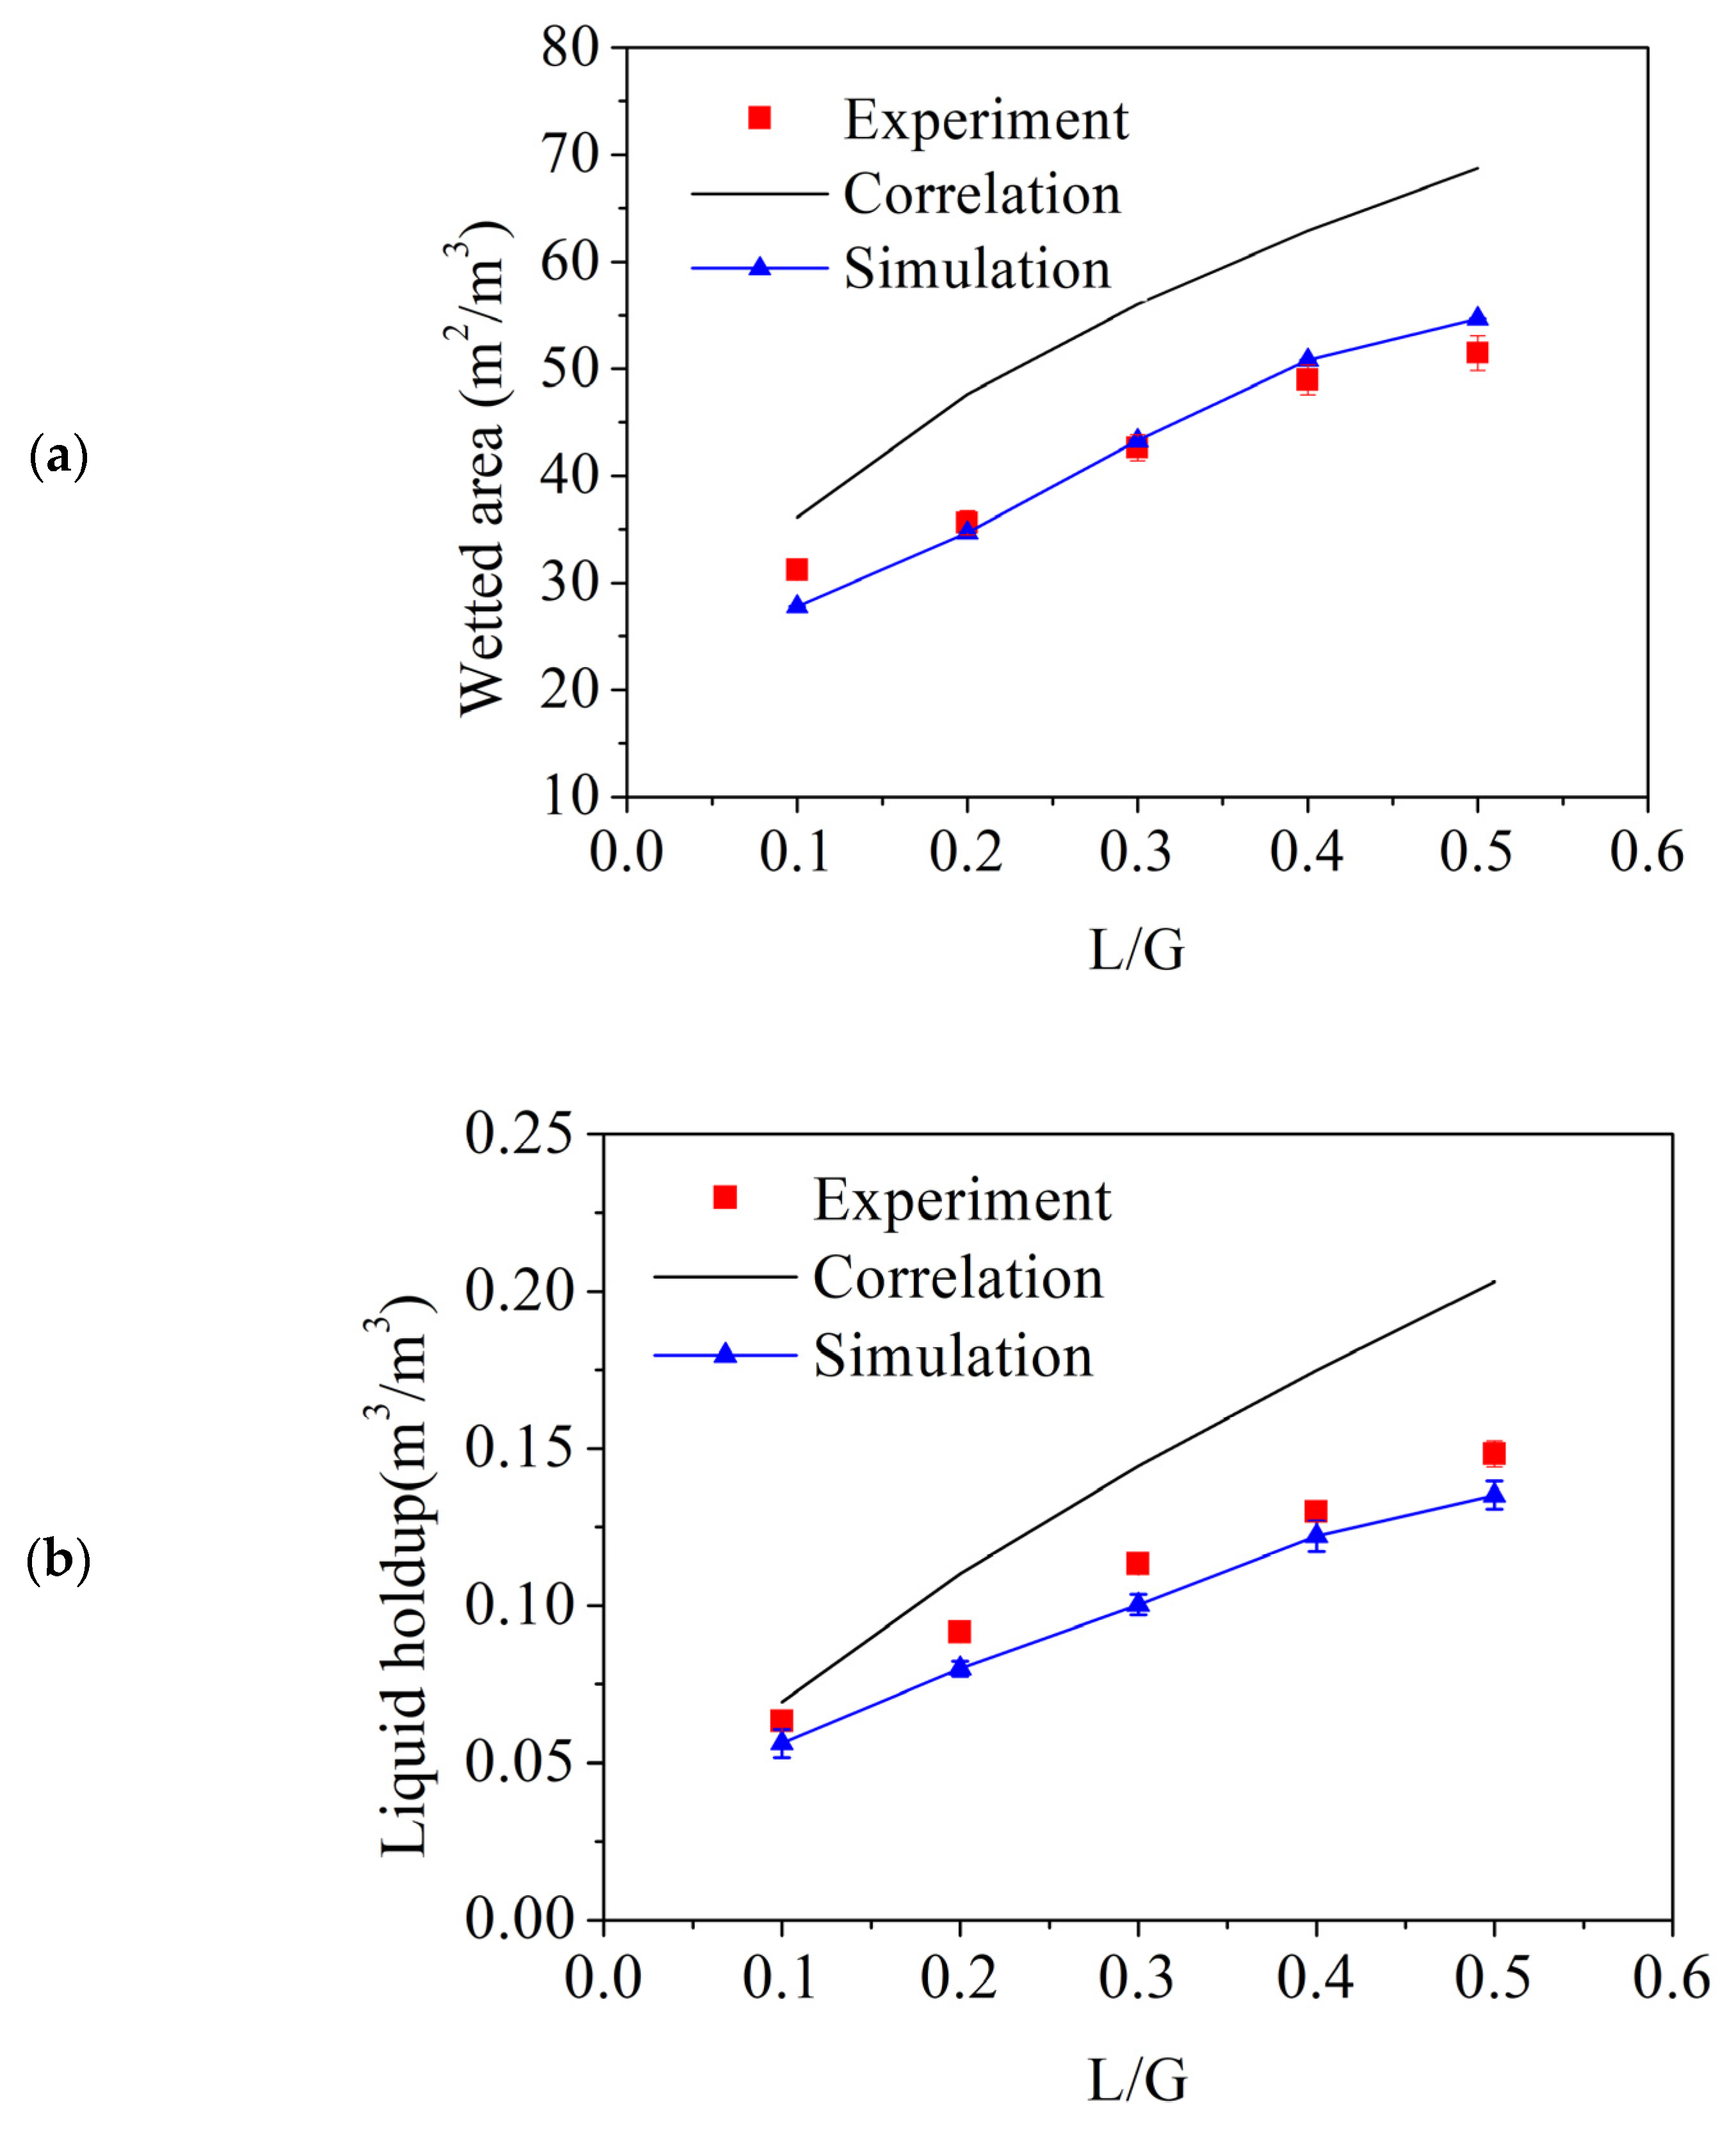
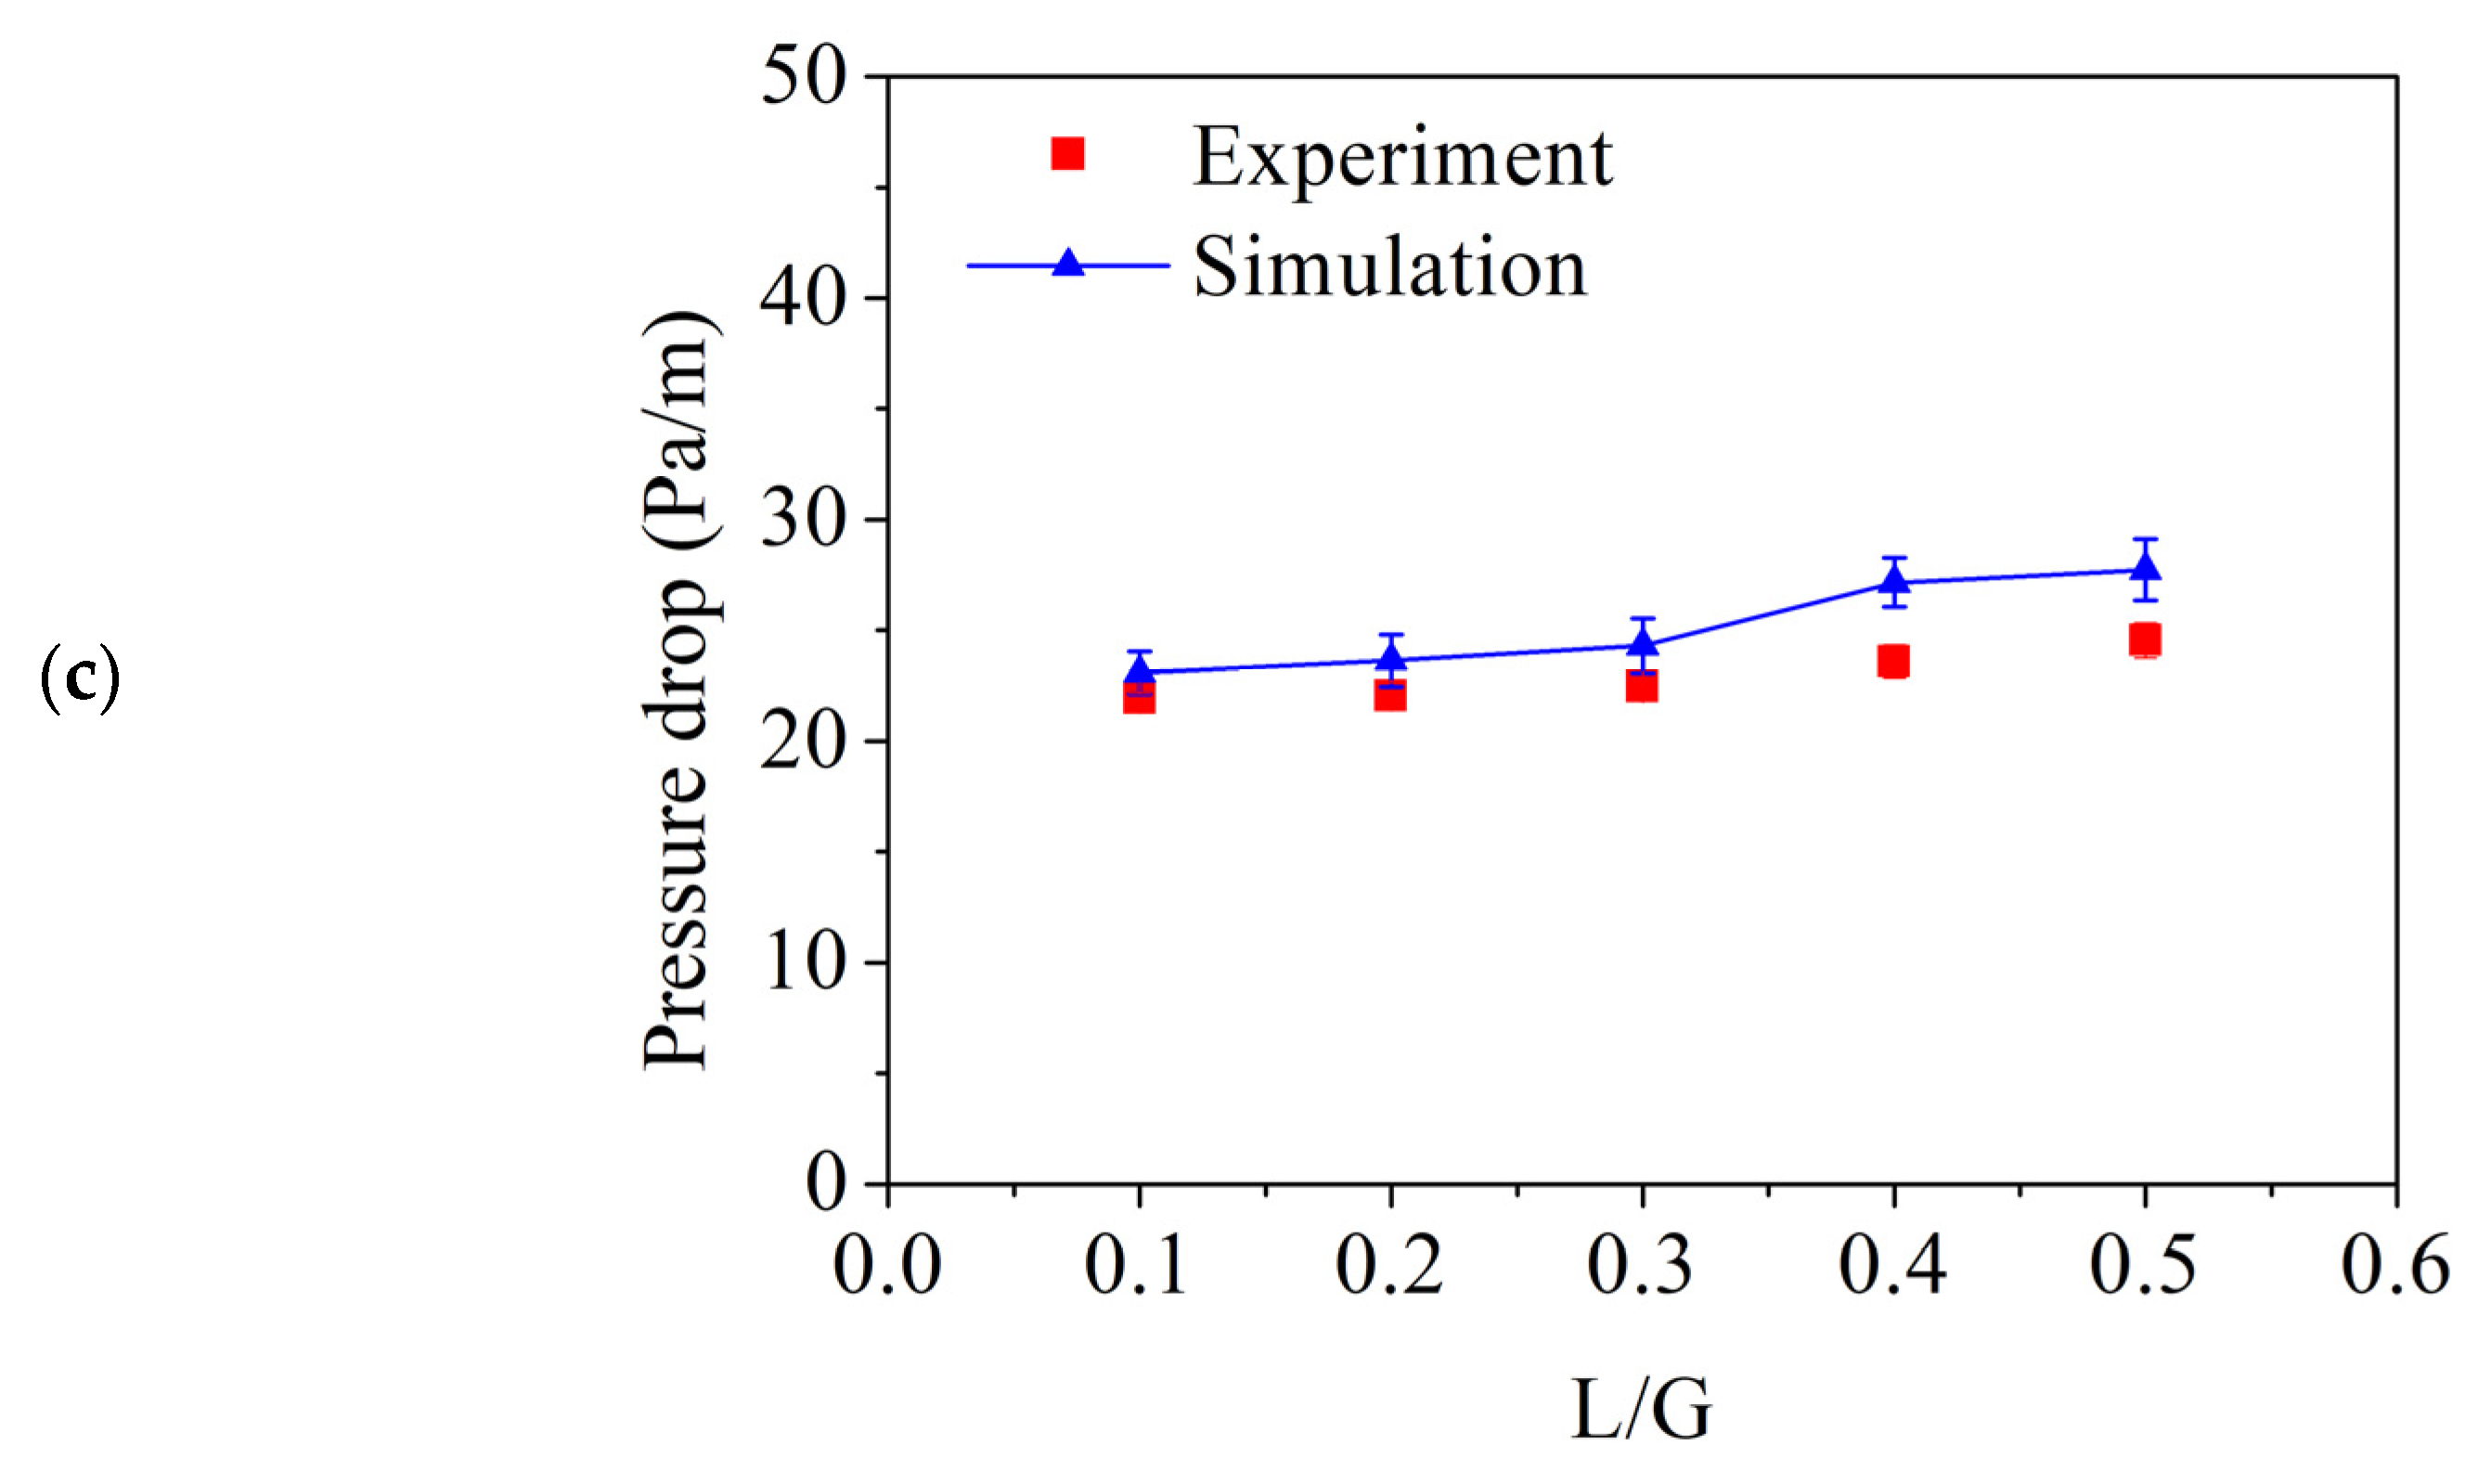
Figure 5.
Comparison of (a) interfacial area, (b) liquid holdup, and (c) pressure drop between the Raschig ring and the helical ring.
Figure 5.
Comparison of (a) interfacial area, (b) liquid holdup, and (c) pressure drop between the Raschig ring and the helical ring.
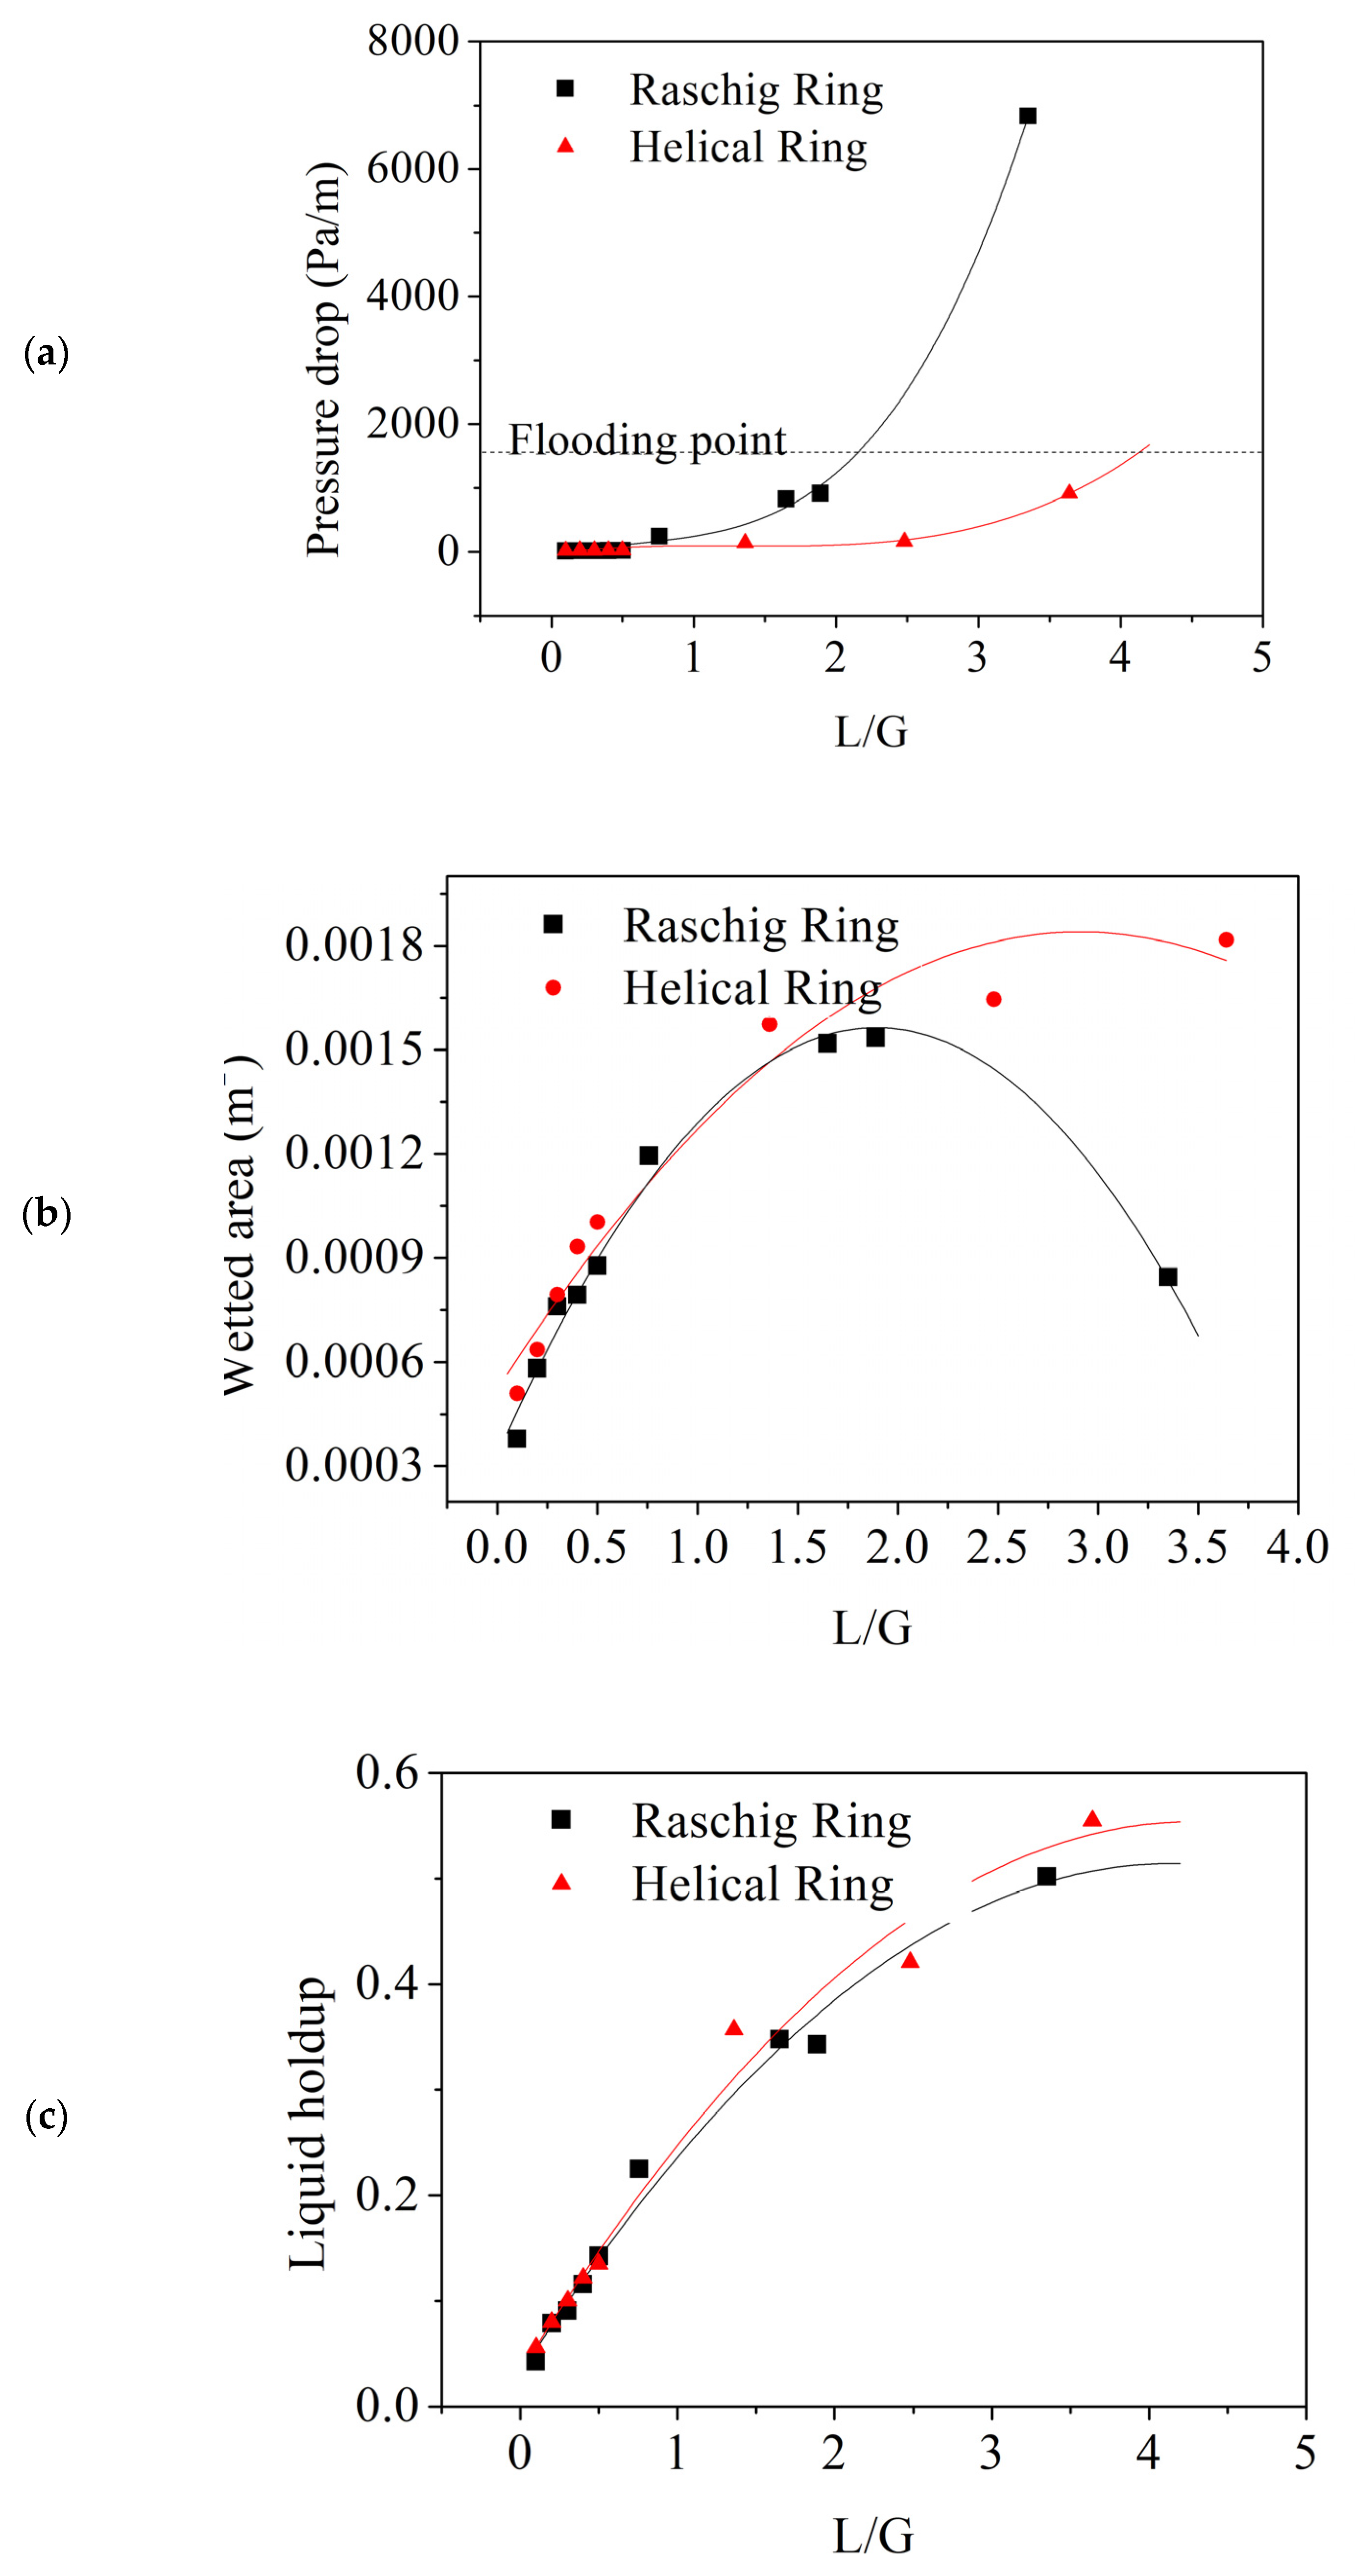
Figure 6.
Distribution of liquid fraction for (a) Raschig ring and (b) helical ring at various L/G ratios.
Figure 6.
Distribution of liquid fraction for (a) Raschig ring and (b) helical ring at various L/G ratios.


Table 1.
Comparison of properties of Raschig ring and helical ring.
| Number of Packing Elements | Specific Surface Area | Porosity | |
|---|---|---|---|
| Exp. helical ring | 30.6 ± 1.3 | 874 ± 37 | 0.869 ± 0.006 |
| Exp. Raschig ring | 24.2 ± 1.1 | 493 ± 23 | 0.789 ± 0.009 |
Table 2.
Boundary conditions of the flow field in Ansys Fluent ® [19].
Table 2.
Boundary conditions of the flow field in Ansys Fluent ® [19].
| Boundaries | Type | Materials | Backflow Phase | Specification |
|---|---|---|---|---|
| Liquid inlet | Velocity | Water | 0.021–0.106 m/s | |
| Top outlet | Pressure | Air | 0 kPa-g | |
| Bottom outlet | Pressure | Air | Adjusted by PID control to obtain the correct gas inlet flow rate of 1 L/min |
Table 3.
Comparison of tetrahedral mesh and polyhedral mesh in the Raschig ring flow field.
| Raschig Ring | Tetrahedral Mesh | Polyhedral Mesh |
|---|---|---|
| Mesh number | 494,937 | 196,116 |
| Min orthogonal quality | 0.1 | 0.129 |
| Max skewness | 0.955 | 0.871 |
Table 4.
Comparison of tetrahedral mesh and polyhedral mesh in the helical ring flow field.
| Helical Ring | Tetrahedral Mesh | Polyhedral Mesh |
|---|---|---|
| Mesh number | 4,567,277 | 3,939,130 |
| Min orthogonal quality | 0.128 | 0.156 |
| Max skewness | 0.856 | 0.769 |
Table 5.
Absorber specification and operating conditions.
| Diameter (mm) | 25.4 |
| Height (mm) | 600 |
| Operating pressure (atm) | 1 |
| Specific surface area (m2/m3) | 869 (helical ring) 495 (Raschig ring) |
| Porosity | 0.87 (helical ring) 0.79 (Raschig ring) |
| Gas flow rate (G) (L/min) | 1 |
| Liquid flow rate (L) (L/min) | 0.1~0.5 |
Table 6.
Average error of hydraulic behaviors using various methods compared with experimental data.
Table 6.
Average error of hydraulic behaviors using various methods compared with experimental data.
| Method | Interfacial Area | Liquid Holdup | Pressure Drop |
|---|---|---|---|
| Polyhedron + GGCB | 15.9% | 28.9% | 39.9% |
| Polyhedron + GGNB | 7.1% | 9.9% | 9.1% |
| Tetrahedron + GGCB | 21.3% | 34.8% | 43.1% |
| Tetrahedron + GGNB | 17.8% | 28.6% | 38.5% |
Publisher’s Note: MDPI stays neutral with regard to jurisdictional claims in published maps and institutional affiliations. |
© 2022 by the authors. Licensee MDPI, Basel, Switzerland. This article is an open access article distributed under the terms and conditions of the Creative Commons Attribution (CC BY) license (https://creativecommons.org/licenses/by/4.0/).
Share and Cite
MDPI and ACS Style
Kang, J.-L.; Huang, S.-H.; Jang, S.-S. Evaluation of Hydrodynamic Performance of New Random Packing Structure Using CFD. Processes 2022, 10, 1276. https://doi.org/10.3390/pr10071276
AMA Style
Kang J-L, Huang S-H, Jang S-S. Evaluation of Hydrodynamic Performance of New Random Packing Structure Using CFD. Processes. 2022; 10(7):1276. https://doi.org/10.3390/pr10071276
Chicago/Turabian StyleKang, Jia-Lin, Siao-Han Huang, and Shi-Shang Jang. 2022. "Evaluation of Hydrodynamic Performance of New Random Packing Structure Using CFD" Processes 10, no. 7: 1276. https://doi.org/10.3390/pr10071276
Note that from the first issue of 2016, this journal uses article numbers instead of page numbers. See further details here.