Article

Comprehensive Evaluation of Ecological Environmental Quality in Small-Scale Coal Mining Subsidence Area Based on Hierarchical Structure—A Case Study of Shendong Coalfield in Western China

1
State Key Laboratory of Water Resource Protection and Utilization in Coal Mining, Beijing 102211, China
2
School of Chemical and Environmental Engineering, China University of Mining and Technology, Beijing 100083, China
3
National Institute of Clean-and-Low-Carbon Energy (NICE), Beijing 102211, China
*
Author to whom correspondence should be addressed.
These authors contributed equally to this work.
Processes 2022, 10(5), 952; https://doi.org/10.3390/pr10050952
Submission received: 19 April 2022 / Revised: 29 April 2022 / Accepted: 5 May 2022 / Published: 10 May 2022

Abstract

:
Aiming at the problem that the current research is not suitable for the evaluation of the surface ecological environmental quality in a small-scale coal mining subsidence area, a model combining the hierarchical method and the weighted method was constructed to realize the comprehensive evaluation of the surface ecological environmental quality in a small-scale subsidence area. The results showed that the change in the water and soil environment caused by coal mining subsidence was the main factor affecting the quality of the ecological environment in the subsidence area; the evaluation results in the control area and uniform subsidence area were of grade III, which was at the “general” level, and the evaluation results in the non-uniform subsidence area were of grade VI, which was at the “poor” level. Coal mining subsidence has a great impact on the quality of ecological environment in a non-uniform subsidence area.

1. Introduction

In the report of the 19th National Congress of the Communist Party of China, President Xi Jinping pointed out: “We will firmly follow the path of civilized development of production development, affluent life and good ecology, build a beautiful China, create a good production and living environment for the people, and contribute to global ecological security” [1,2]. Therefore, promoting green development, focusing on solving prominent environmental problems, and increasing the protection of ecosystems is fundamental and important work for the harmonious coexistence of man and nature. The ecological environmental assessment is the premise and guarantee of the scientifically normative protection and management of the environment.
Due to the continuous emergence of various environmental problems, which have seriously affected people’s normal production and life, governments worldwide have carried out ecological environmental assessments since 1960 and issued a series of relevant systems [3]. In 1969, the United States formulated and issued the environmental impact assessment system, requiring the government to strictly implement this system in environmental supervision and management [4]. Relevant environmental protection agencies in the United States also evaluated the ecological environmental quality of cities nationwide in 1990 [5]. The rapid development of the Japanese industry has caused serious pollution to the ecological environment. Therefore, the government has launched an environmental impact assessment model and used a variety of methods to assess the environmental impact [6]. Australia, France, New Zealand, Canada, and other countries have also formulated and promulgated the environmental impact assessment system [7]. China’s eco-environmental assessment started in the 1970s where the government has promulgated a series of environmental protection laws and management measures, established the environmental impact assessment system, and improved the comprehensive evaluation index system [8,9].
With the increasingly serious ecological and environmental problems caused by coal mining, the ecological and environmental assessment of mining areas has gradually attracted the attention of the government and academia [10,11]. Since 1970, developed countries such as Europe and the United States began formulating a series of systems for mine ecological environmental assessment and restoration and carried out some ecological environmental evaluation work in coal mining areas [12]. The environmental quality, ecological security, ecological risk, ecological carrying capacity, ecological degradation, and ecological capital at the mining scale have been the main research points [13]. In recent years, based on the continuous development of mathematical theory and computer technology, scholars at home and abroad have carried out a lot of research on the evaluation index system and the evaluation methods of ecological environmental quality in mining areas [14,15,16].
Regarding the evaluation content, the existing research has mainly carried out the evaluation from the perspectives of natural factors (temperature, precipitation), surface factors (vegetation, soil), and social factors (production and life) at the macro-scale, which is applicable to large-scale areas such as mining areas or coal mines [17,18,19,20]. However, as a small-scale area, the particularity of a coal mining subsidence area is that there are not only differences in vegetation, soil, and other indicators in different subsidence areas, but also differences in the moisture of the vadose zone and the degree of surface deformation, that is, the factors affecting the quality of the ecological environment in the subsidence area are more complex. Therefore, it is necessary to study the eco-environmental quality evaluation of small-scale subsidence areas.
In terms of evaluation methods, the current research has mainly adopted the comprehensive evaluation method of the ecological environmental quality, which includes principal component analysis, the comprehensive index method, the analytic hierarchy process, the fuzzy evaluation method, the machine learning method, and so on [21,22,23,24,25,26]. Among them, the analytic hierarchy process has clear logic and clear hierarchy, which is suitable for the hierarchical construction of the index system, but the determination of the index weight mainly depends on human evaluation and lacks objectivity. The weighting method determines the index weight according to the objective standard, which avoids the human subjectivity. The fuzzy evaluation method considers the fuzziness between environmental quality grades, and the comprehensive evaluation results are more in line with the actual situation. Therefore, the combination of these methods can improve the scientificity of the evaluation.
As one of the important energy sources in China, coal accounts for more than 70% of the composition of the domestic energy consumption, and presents a state of “more in the West than in the East, poor in the South and rich in the North” in terms of regional distribution [27]. As the main area of coal resource development in China, the northwest region has inherent contradictions between its high-intensity coal resource development and the inherently fragile ecological background environment, which has caused a series of ecological and environmental problems. For example, open-pit coal mining will damage the soil structure and surface vegetation; underground coal mining will cause problems such as subsidence, cracks, groundwater level drop; and soil erosion on the surface, which will lead to vegetation degradation or even death [28,29]. Therefore, taking the 1-year and 2-year subsidence area of the Nalinhe No. 2 coal mine in the Shendong Coalfield in northwest China as the research object, this paper established a hierarchical analysis structure evaluation model of the surface ecological environmental quality in a small-scale subsidence area, and used the weighting method to determine the weight of the evaluation index. On this basis, the fuzzy evaluation method was used to analyze the impact of coal mining subsidence on the environmental index factors, environmental elements, and surface ecosystem, and we put forward measures and suggestions to improve the quality of the ecological environment in the subsidence area, in order to provide a theoretical basis for the development and utilization of coal resources and the ecological restoration in this area.

2. Materials and Methods

2.1. Study Area

The study area is located in Wudinghe Town, Wushen Banner, Ordos City, Inner Mongolia Autonomous Region, at the southernmost end of the Nalinhe Mining Area in the Shendong Coalfield. The area is about 17.8 km long, 13.5 km wide, and 176.34 km2 in area. The surface subsidence is mainly controlled by the working face inclination. The measured maximum subsidence of the surface inclination is 2.72 m and the maximum subsidence of the strike is 1.52 m. The geographic coordinates are east longitude 108°51′30″–109°00′00″, and north latitude 37°58′00″–38°05′30″, as shown in Figure 1.
The study area is located in the east of the Mu Us Desert. The climate is characterized by a semi-arid temperate plateau, continental climate, sparse vegetation, heavy wind and sand, dry, and little rain. The annual evaporation is 5~10 times that of the annual precipitation, and the temperature difference between day and night is wide [30]. Therefore, the ecological environment of the mining area is extremely fragile.
There is no obvious surface water system in the study area. The groundwater is mainly the pore phreatic aquifer of the Quaternary Salawusu Formation, and the average buried depth of the phreatic water level is about 30 m [31]. The main recharge source of the phreatic layer is atmospheric precipitation, followed by the lateral runoff recharge of phreatic water outside the study area including the overflow recharge of deep confined water [32]. Although the average annual precipitation in this area is small, it is mainly concentrated in summer. Therefore, in the rainy season, the phreatic water supply will increase significantly.
The tectonic division of the study area belongs to the Dongsheng uplift area of the Ordos syncline of the North China platform, which is located in the south of the Dongsheng uplift area [33]. The basic structural form is a westward-dipping monoclinic structure, which turns into a northwest-dipping monoclinic structure in the south. The dip angle of the rock formations is 1–3°. Folds and faults are not developed, but there are weak wave-like ups and downs locally, and there is no magmatic rock intrusion. Therefore, it belongs to a simple structural coal field [34,35].

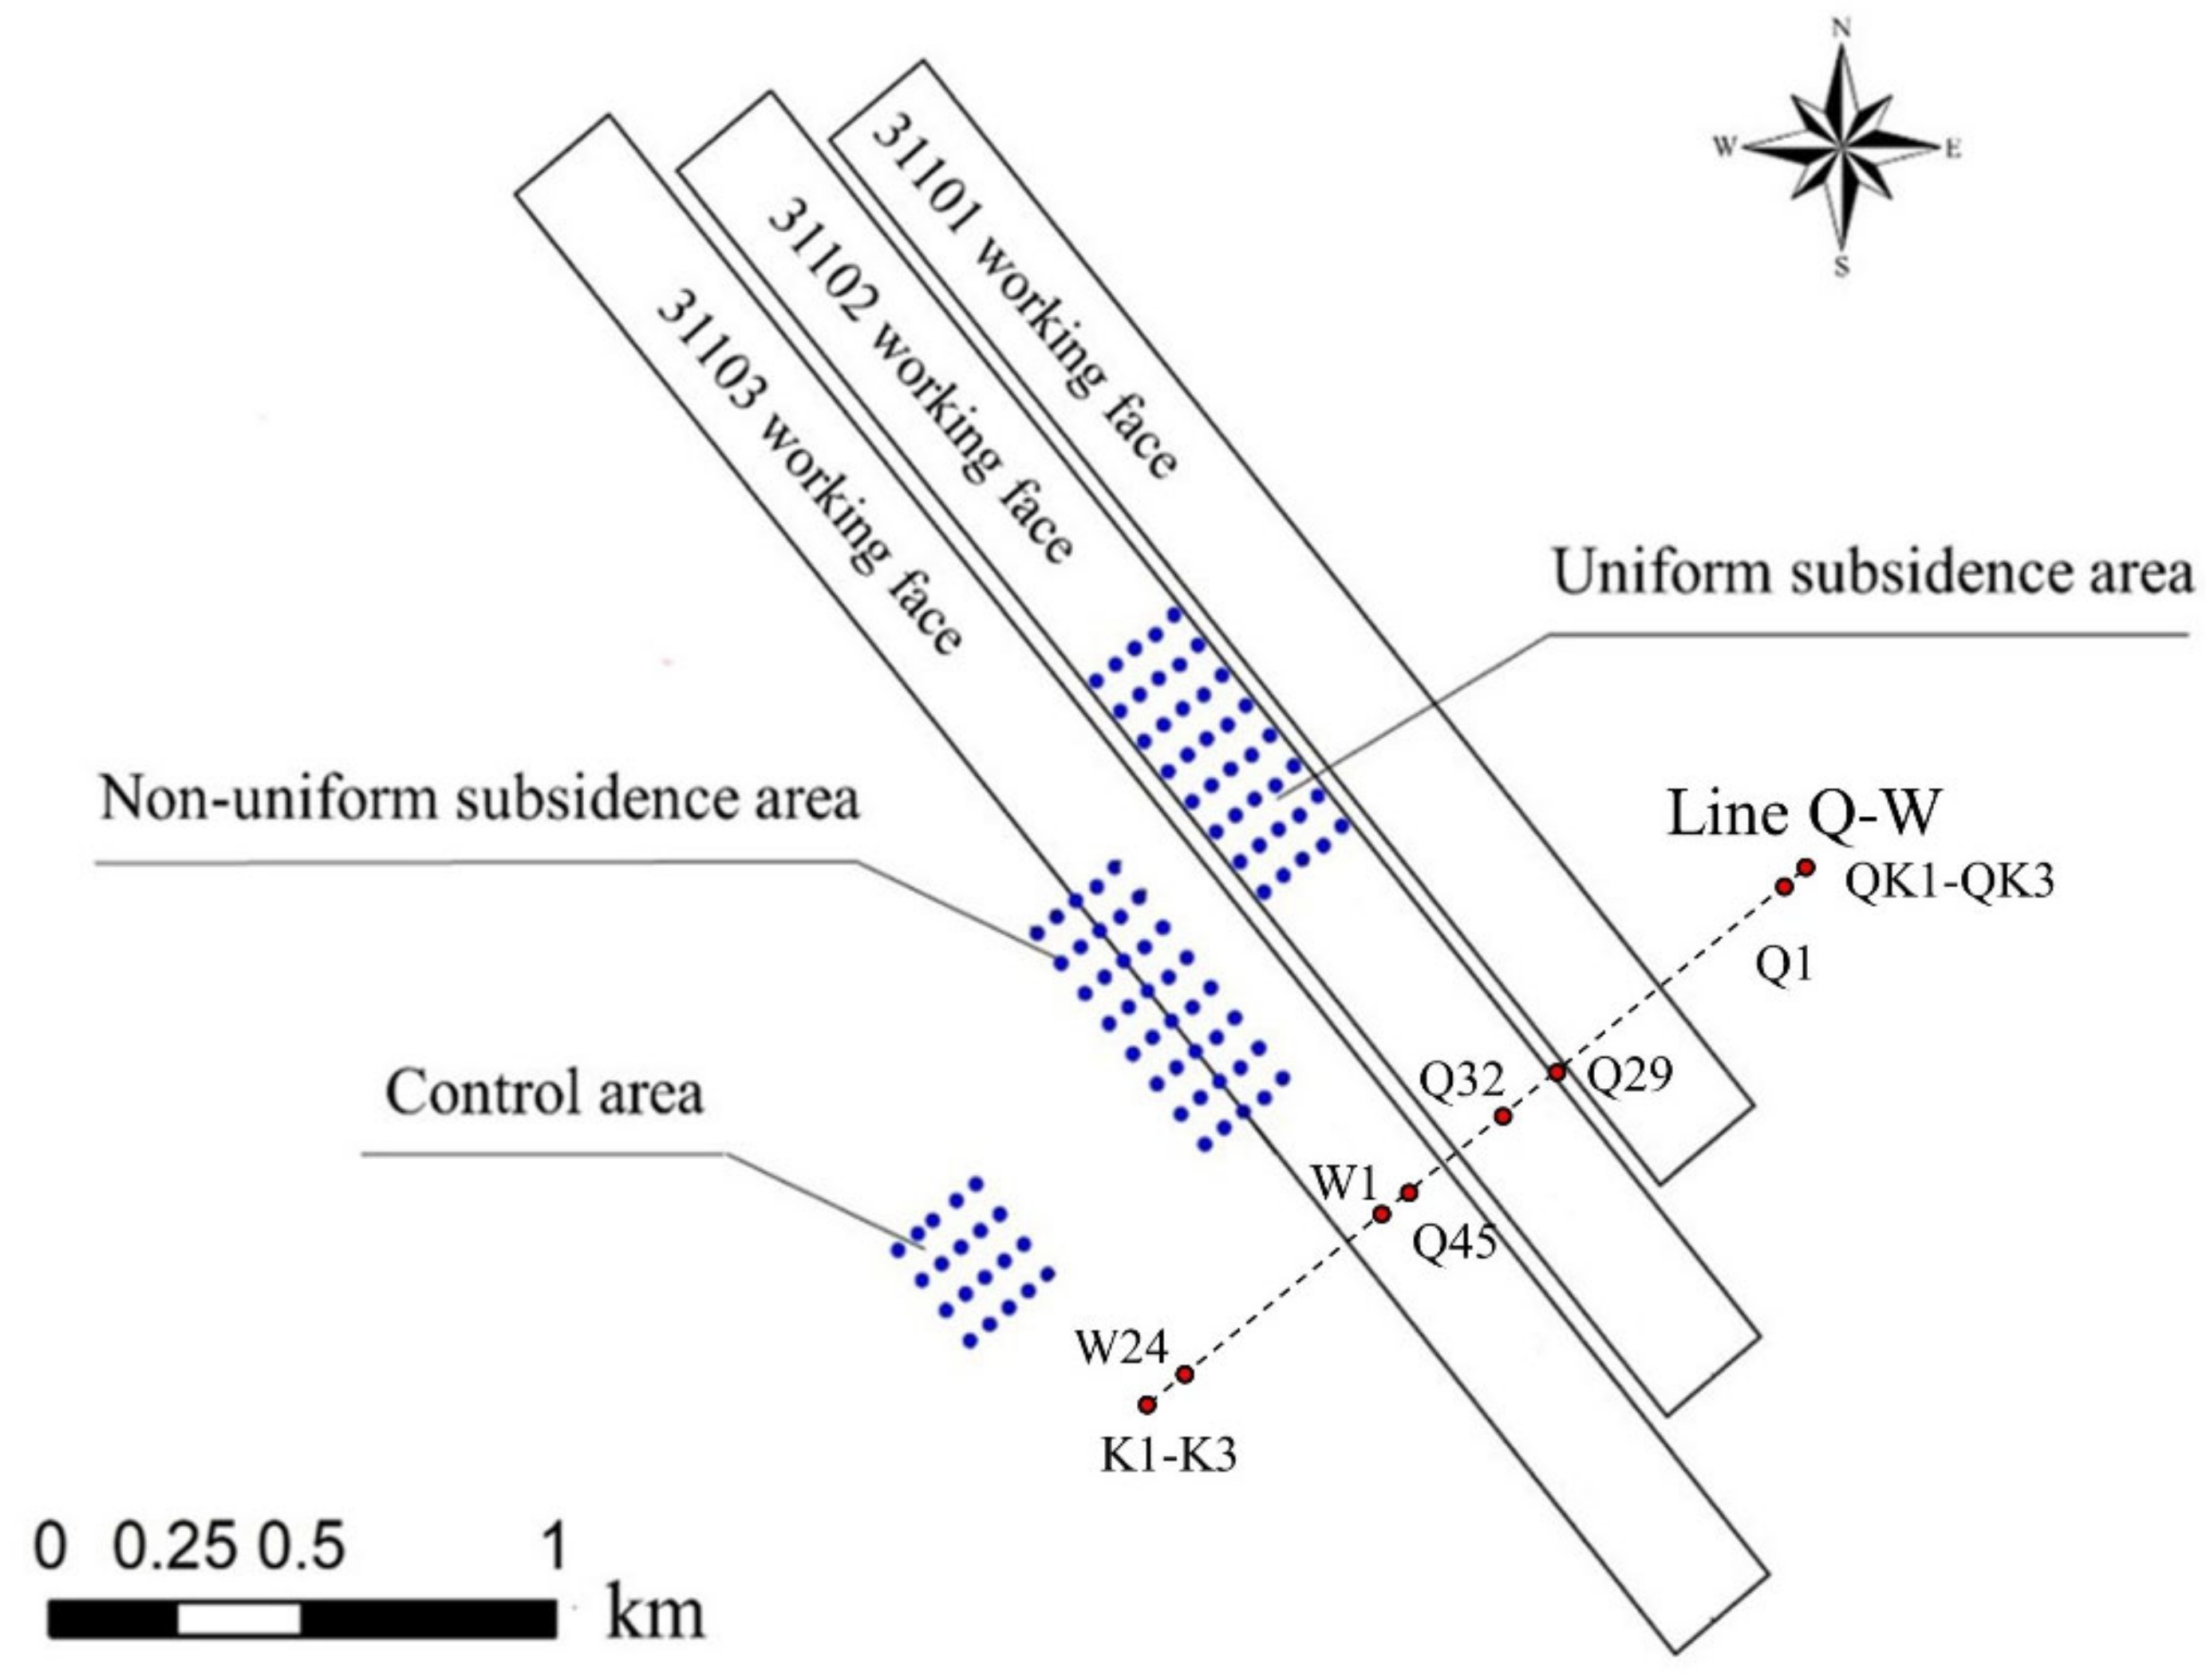
2.2. Field Test Area

According to the needs of this study for the surface subsidence observations and on-site monitoring of ecological elements such as water, soil, and vegetation, the working faces of 31101, 31102, and 31103 in the first mining area of Nalinhe No. were related to the research work. The geographical location of the field test area is east longitude 108°56′00″–108°59′00″, and north latitude 38°1′00″–38°3′30″.
The working face of 31101 is 241 m wide and 2600 m long, and the mining time was from September 2014 to May 2017; the 31102 working face is 241 m wide and 3100 m long, and the mining time was from June 2017 to December 2018; and the 31103 working face is 241 m wide and 3600 m long, and the mining time was from April 2019 to April 2021. The coal pillar spacing in the reserved section of the working face is 20 m. The mining height of the three working faces is 5.5 m, and the buried depth of the coal seam is about 600 m. The roof is composed of sandy mudstone (15.6 m), fine-grained sandstone (13.6 m), and sandy mudstone (20.1 m) from top to bottom, and the floor is composed of fine-grained sandstone (6.6 m) and sandy mudstone (15.3 m) from bottom to top.
According to the monitoring results of the surface subsidence in this area, the surface subsidence basically stopped about one year after mining. For example, according to the monitoring results, the mining time of the 31102 working face was from November 2017 to December 2018 and the mining subsidence stopped in May 2019.
After the mining of the three working faces, the influence scope of the surface subsidence was 450 m outside the goaf, and the subsidence area could be divided into a uniform subsidence area and non-uniform subsidence area. The uniform subsidence area was located in the flat bottom area of the basin, mainly in the middle section of the 31102 working face and the non-uniform subsidence area was located at the edge of the basin including the 31101 and 31103 working faces and their extended 450 m area.
In the uniform subsidence area, the non-uniform subsidence area, and the control area, sections of 200 m × 600 m area, 200 m × 600 m area, and 200 m × 300 m area were selected for sampling distribution, respectively. The checkerboard method was used for sampling, the grid design was 50 m × 75 m, and each sampling point was at the center of the grid. A total of 100 sampling points was arranged in the three areas including 20 in the control area, 40 in the uniform subsidence area, and 40 in the non-uniform subsidence area, as shown in Figure 2.
The dynamic characteristics of the inclined surface subsidence curve of the working face (layout of survey line Q–W) are shown in Figure 3a. As can be seen from Figure 3a, as of 3 July 2020, the maximum subsidence point of the dip survey line Q–W was q32 (the middle of the 31102 working face), and the maximum subsidence was 2.72 M. At this time, the flat bottom disc-shaped feature appeared in the middle of the subsidence area, which was a uniform subsidence area, while the edge of the subsidence area was a non-uniform subsidence area. Through the numerical simulation and prediction, the vertical subsidence shape of the subsidence area could also be obtained, as shown in Figure 3b. The central area of the subsidence area was a uniform subsidence area with almost the same subsidence, and the edge was a non-uniform subsidence area with a large difference in subsidence.

2.3. Selection and Measurement of Evaluation Indicators

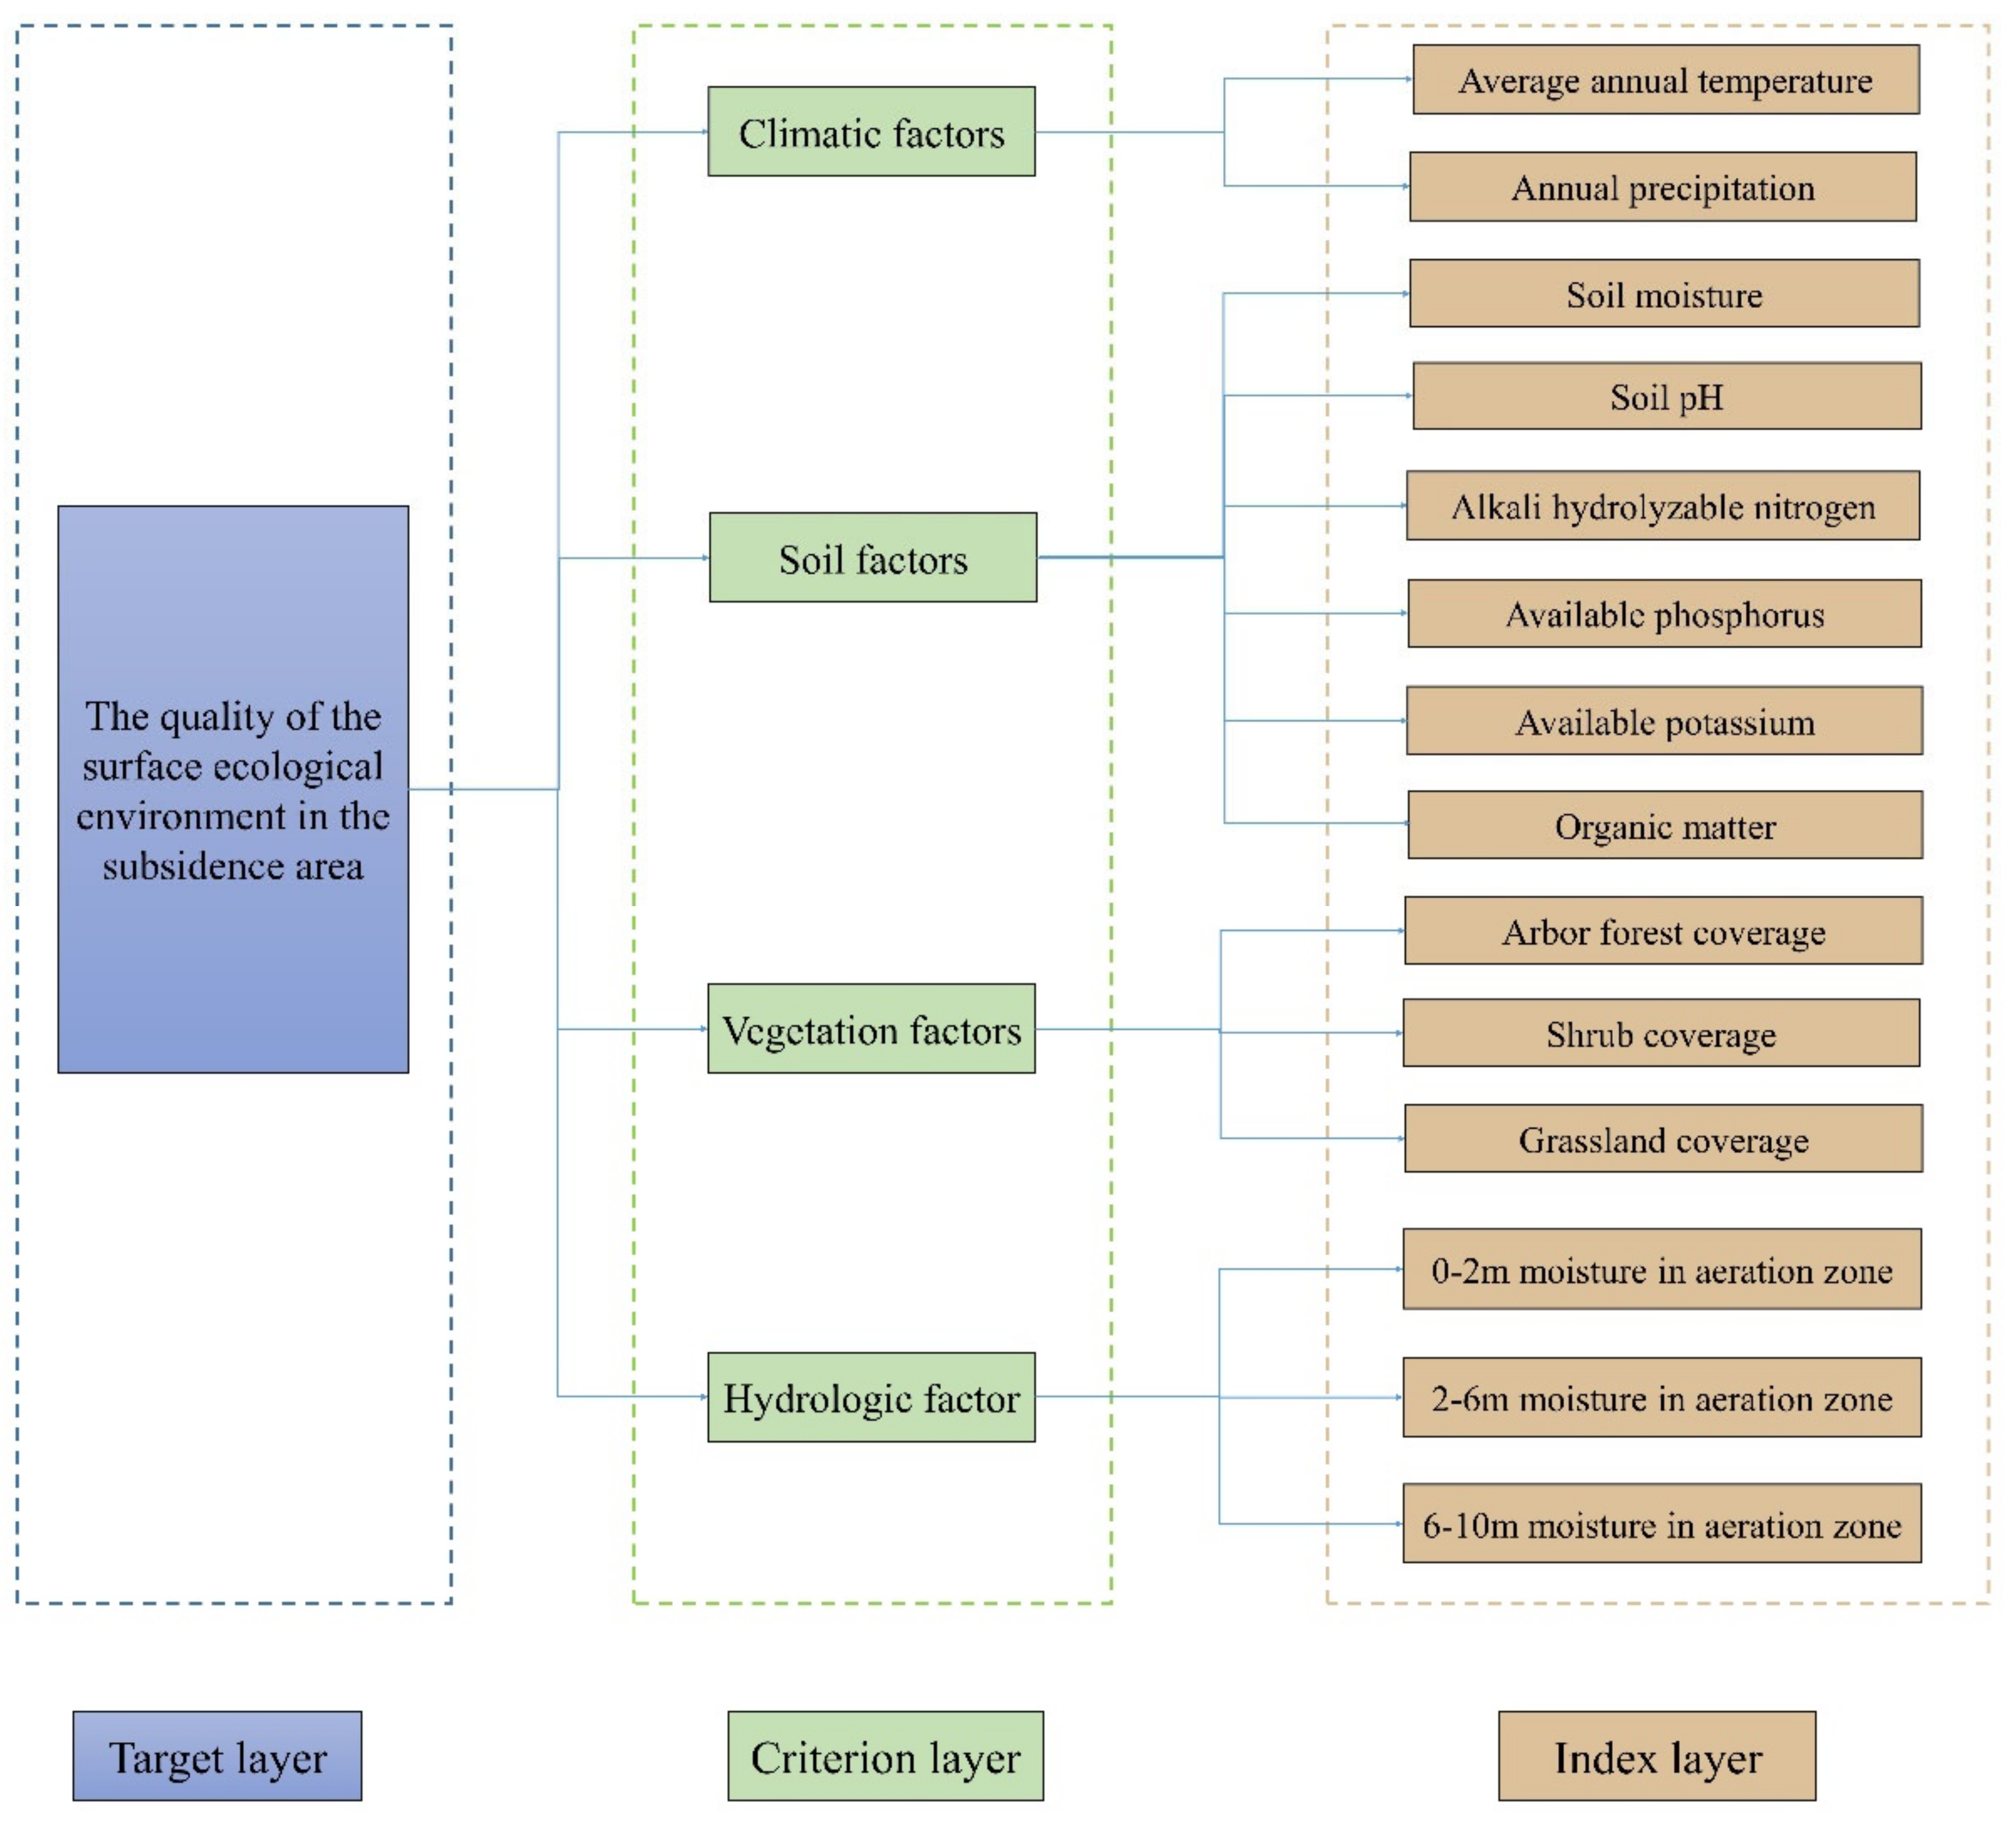
2.3.1. Evaluation Indicators

Vegetation factors (vegetation type, coverage), soil factors (physical and chemical characteristics indicators), and hydrological factors (vadose zone moisture) interact and restrict each other, and have correlation and coupling and mutual feed characteristics under the disturbance of coal mining. From the natural background, climate is the decisive factor for the quality of the regional ecological environment. Therefore, combined with the measured data and the actual situation of the study area, this paper selected the annual precipitation, average annual temperature, surface soil moisture, pH value, alkaline hydrolyzable nitrogen, available phosphorus, and available potassium. There were 14 indicators in total including organic matter, arbor vegetation coverage, shrub vegetation coverage, grassland vegetation coverage, and moisture in the vadose zone (0–2 m, 2–6 m, and 6–10 m). The analysis of each index is as follows:
(1)
Climate factor
Average annual temperature and annual rainfall are important climatic factors that affect the quality of the surface ecological environment in arid and semi-arid regions. Studies have shown that precipitation has a positive effect on vegetation cover and soil physicochemical properties [36]. Temperature can change plant growth patterns and have a greater impact on soil physicochemical properties [37]. Therefore, the annual average temperature and annual rainfall were selected as the evaluation indicators of climate factors.
(2)
Soil factor
Soil factors mainly include the physical and chemical properties of the surface soil. Soil moisture is a key factor for vegetation growth in arid and semi-arid regions. Soil pH value is an important attribute formed under the comprehensive action of climate, biology, geology, hydrology, and other factors, which determines the transformation direction, transformation process, existence state, and effectiveness of most elements in soil. Soil nutrients are important elements for promoting vegetation growth. Therefore, according to the field monitoring data, this study selected the surface soil moisture, pH value, alkali-hydrolyzed nitrogen, available phosphorus, available potassium, and organic matter as the evaluation indicators of soil factors.
(3)
Vegetation factor
The vegetation types and vegetation coverage in different subsidence areas have spatial heterogeneity, while the effects of coal mining subsidence on different vegetation types are different. Therefore, according to the actual situation of the vegetation types in the study area, the vegetation coverage of arbor forest, the vegetation coverage of shrub forest and the vegetation coverage of grassland were selected as the evaluation indicators of vegetation factors.
(4)
Hydrological factors
Water in the vadose zone is the main source of water for the growth of trees, shrubs, and herbs in arid and semi-arid regions. Heterogeneous subsidence increases the spatial variability of moisture in the vadose zone, which in turn affects vegetation growth. According to the analysis results of the soil water spatial variation mechanism, the coal mining subsidence did not cause leakage of the aquifer, and had no effect on the water level of the aquifer. Therefore, in terms of hydrology, the water content of the vadose zone at different depth profiles was selected as the evaluation index.

2.3.2. Evaluation Index Measurement

A soil drill was used to collect 20 cm soil samples at each sampling point, three parallel samples were randomly collected from each sampling point, and the arithmetic mean of the three parallel samples at each sampling point was taken as the measurement result of this point. During the determination, the drying method, the potentiometric method, the alkaline hydrolysis diffusion method, the combined leaching-colorimetric method, and the potassium dichromate volumetric external heating method were used to determine the soil moisture, soil pH, soil alkaline hydrolysis nitrogen, soil available phosphorus and soil moisture, fast-acting potassium, and organic matter. In addition, based on the Gaofen-2 satellite remote sensing image data, the pixel dichotomy model method was used to extract and calculate the average vegetation coverage of trees, shrubs, and herbs in different regions.

2.4. Evaluation Models and Methods

The analytic hierarchy process (AHP) includes the target layer, criterion layer, and index layer. The target layer judges the ecological environment quality of the subsidence area as a whole and expresses the surface ecological environmental quality of the subsidence area; the criterion layer reflects the ecological environmental stability of the target layer from different factors including climatic factors, soil factors, vegetation factors, and hydrological factors; and the index layer is the most basic level of the evaluation index system of the ecological environmental quality in the subsidence area, and the criterion level is directly measured including the annual rainfall, average annual temperature, surface soil moisture, pH value, alkali-hydrolyzable nitrogen, available phosphorus, available potassium, organic matter, arbor vegetation coverage, shrub vegetation coverage, grassland vegetation coverage, and vadose zone moisture (0–2 m, 2–6 m, 6–10 m). The AHP hierarchy model is shown in Figure 4.
As the changes in the ecological factors in the coal mining subsidence area are uncertain, and considering that the individual indicators in different areas of the subsidence area are quite different, the weighting method was used to assign different weights to each index factor. Due to the ambiguity between the two adjacent levels in the quality classification standard of the environmental elements, dividing the measured value of the evaluation index into a certain level according to the evaluation standard will result in inaccurate evaluation results. This study used the membership matrix of fuzzy mathematics to solve this problem and used it to comprehensively evaluate the surface ecological environmental quality of the subsidence area.
  • Evaluation factor weight
The weighting method is used to calculate the weight of the evaluation factors, and the formula is as follows [25]:
x i = a i p i p i
Normalize xi:
b i = x i / k 1 n x i
In the formula, xi is the weight factor; ai is the measured value of the evaluation index; pi is the average value of the standard value of the ith evaluation index at all levels; and bi is the weight value of the ith evaluation index.
The weight value of each evaluation factor is used to form fuzzy matrix B:
B = b 1 , b 2 , , b n
2.
Evaluation Index Standard Basis
The evaluation criteria and sources of each evaluation index are shown in Table 1.
It can be seen from Table 1 that the meteorological factors refer to “Precipitation Grade Standard” (GB T 28592–2012) and “Temperature Evaluation Grade” (GB/T 35562–2017). The index of the soil physical and chemical properties adopted the “Second National Soil Census Classification Standard” and was determined in combination with the actual local environmental conditions; the changes in vegetation coverage refer to the “Technical Specifications for Evaluation of Ecological Environment Conditions” (HJ 192–2015); and the vadose zone soil moisture was determined with reference to the “Second National Soil Census Grading Standard”, combined with the relevant literature and the local actual environmental conditions [38,39]. According to the above grading standards, the ecological rating of each index corresponding to the value range was determined.
There are optimum ranges of soil pH and annual average temperature in the growing season and too high or too low will have negative effects. The traditional evaluation method uses the intermediate fuzzy membership model to evaluate the soil pH value, but the selection of the boundary value of the model is subjective. Using the 3δ criterion can better judge the attributes of the evaluation index in the range of quality classification [40]. It can be seen from the above that the measured data of the soil pH value conformed to the normal distribution, according to the 3δ criteria, and the soil pH value grade table of the coal mining subsidence area was obtained as shown in Table 2.
The air temperature data were classified according to the standard deviation of the air temperature evaluation index and grade of “Air Temperature Evaluation Grade” (GB/T 35562–2017), as shown in Table 3.
3.
Comprehensive evaluation grade of the ecological environmental quality
The fuzzy membership matrix was introduced to reflect the grade of the surface ecological environmental quality evaluation index in the subsidence area. In the evaluation, the measured value of the i evaluation factor is taken as a i , the standard value of grade j is d i j (i = 1, 2, … n; j = 1, 2, …, n), and then the membership function of the evaluation factor is as follows:
The membership function for the first-level evaluation criteria, that is, j = 1:
  Positive   indicator Negative   indicator r i 1 = 1 d i 2   a i d i 2   C i 1 0 a i d i 1 d i 2 < a i d i 1 a i d i 2 a i d i 1 d i 1 < a i d i 2 a i > d i 2
The membership function for the evaluation criteria of the j to n − 1 levels, that is, j = 2, 3, 4, ……, n – 1:
  Positive   indicator Negative   indicator r i j = a i d i j 1 d i j d i j 1 d i j + 1 a i d i j + 1 d i j 0 d i j 1 > a i d i j d i j a i > d i j + 1 d i j 1 < a i d i j + 1 d i j 1 < a i d i j d i j a i < d i j + 1 d i j 1 a i > d i j + 1  
The membership function for the n-level evaluation criteria, that is, j = n:
  Positive   indicator Negative   indicator r i n = 1 d i j a i d i j d i j 1 0 a i d i j d i j 1 > a i > d i j a i > d i j 1 a i d i j d i j 1 < a i < d i j a i d i j 1  
According to the membership function and the measured value, the membership degree of each single factor to the evaluation standard can be calculated, and the following fuzzy relation matrix R can be obtained.
R = r 11 r 1 j r i 1 r i j
where i represents the number of evaluation indicators, i = 1, 2, …, 13; and j represents the number of index grades, j = 1, 2, 3, 4.
According to C = BR, the membership degrees of the climatic factors, soil factors, vegetation factors, and hydrological factors in the criterion layer were calculated. The calculation result was dimensionless, that is, there was no unit. Then, according to the requirements of the maximum membership degree in the fuzzy mathematics method, after matrix operation, the membership degree of the surface ecological environmental quality in the subsidence area was finally obtained, in which level I is “excellent”, level II is “good”, level III is “average”, and IV grade is “poor”. According to the evaluation results, the ecological environmental quality grade of each evaluation unit in the subsidence area was determined, which provides theoretical guidance for the improvement of the surface ecological environmental quality in the subsidence area.

3. Results

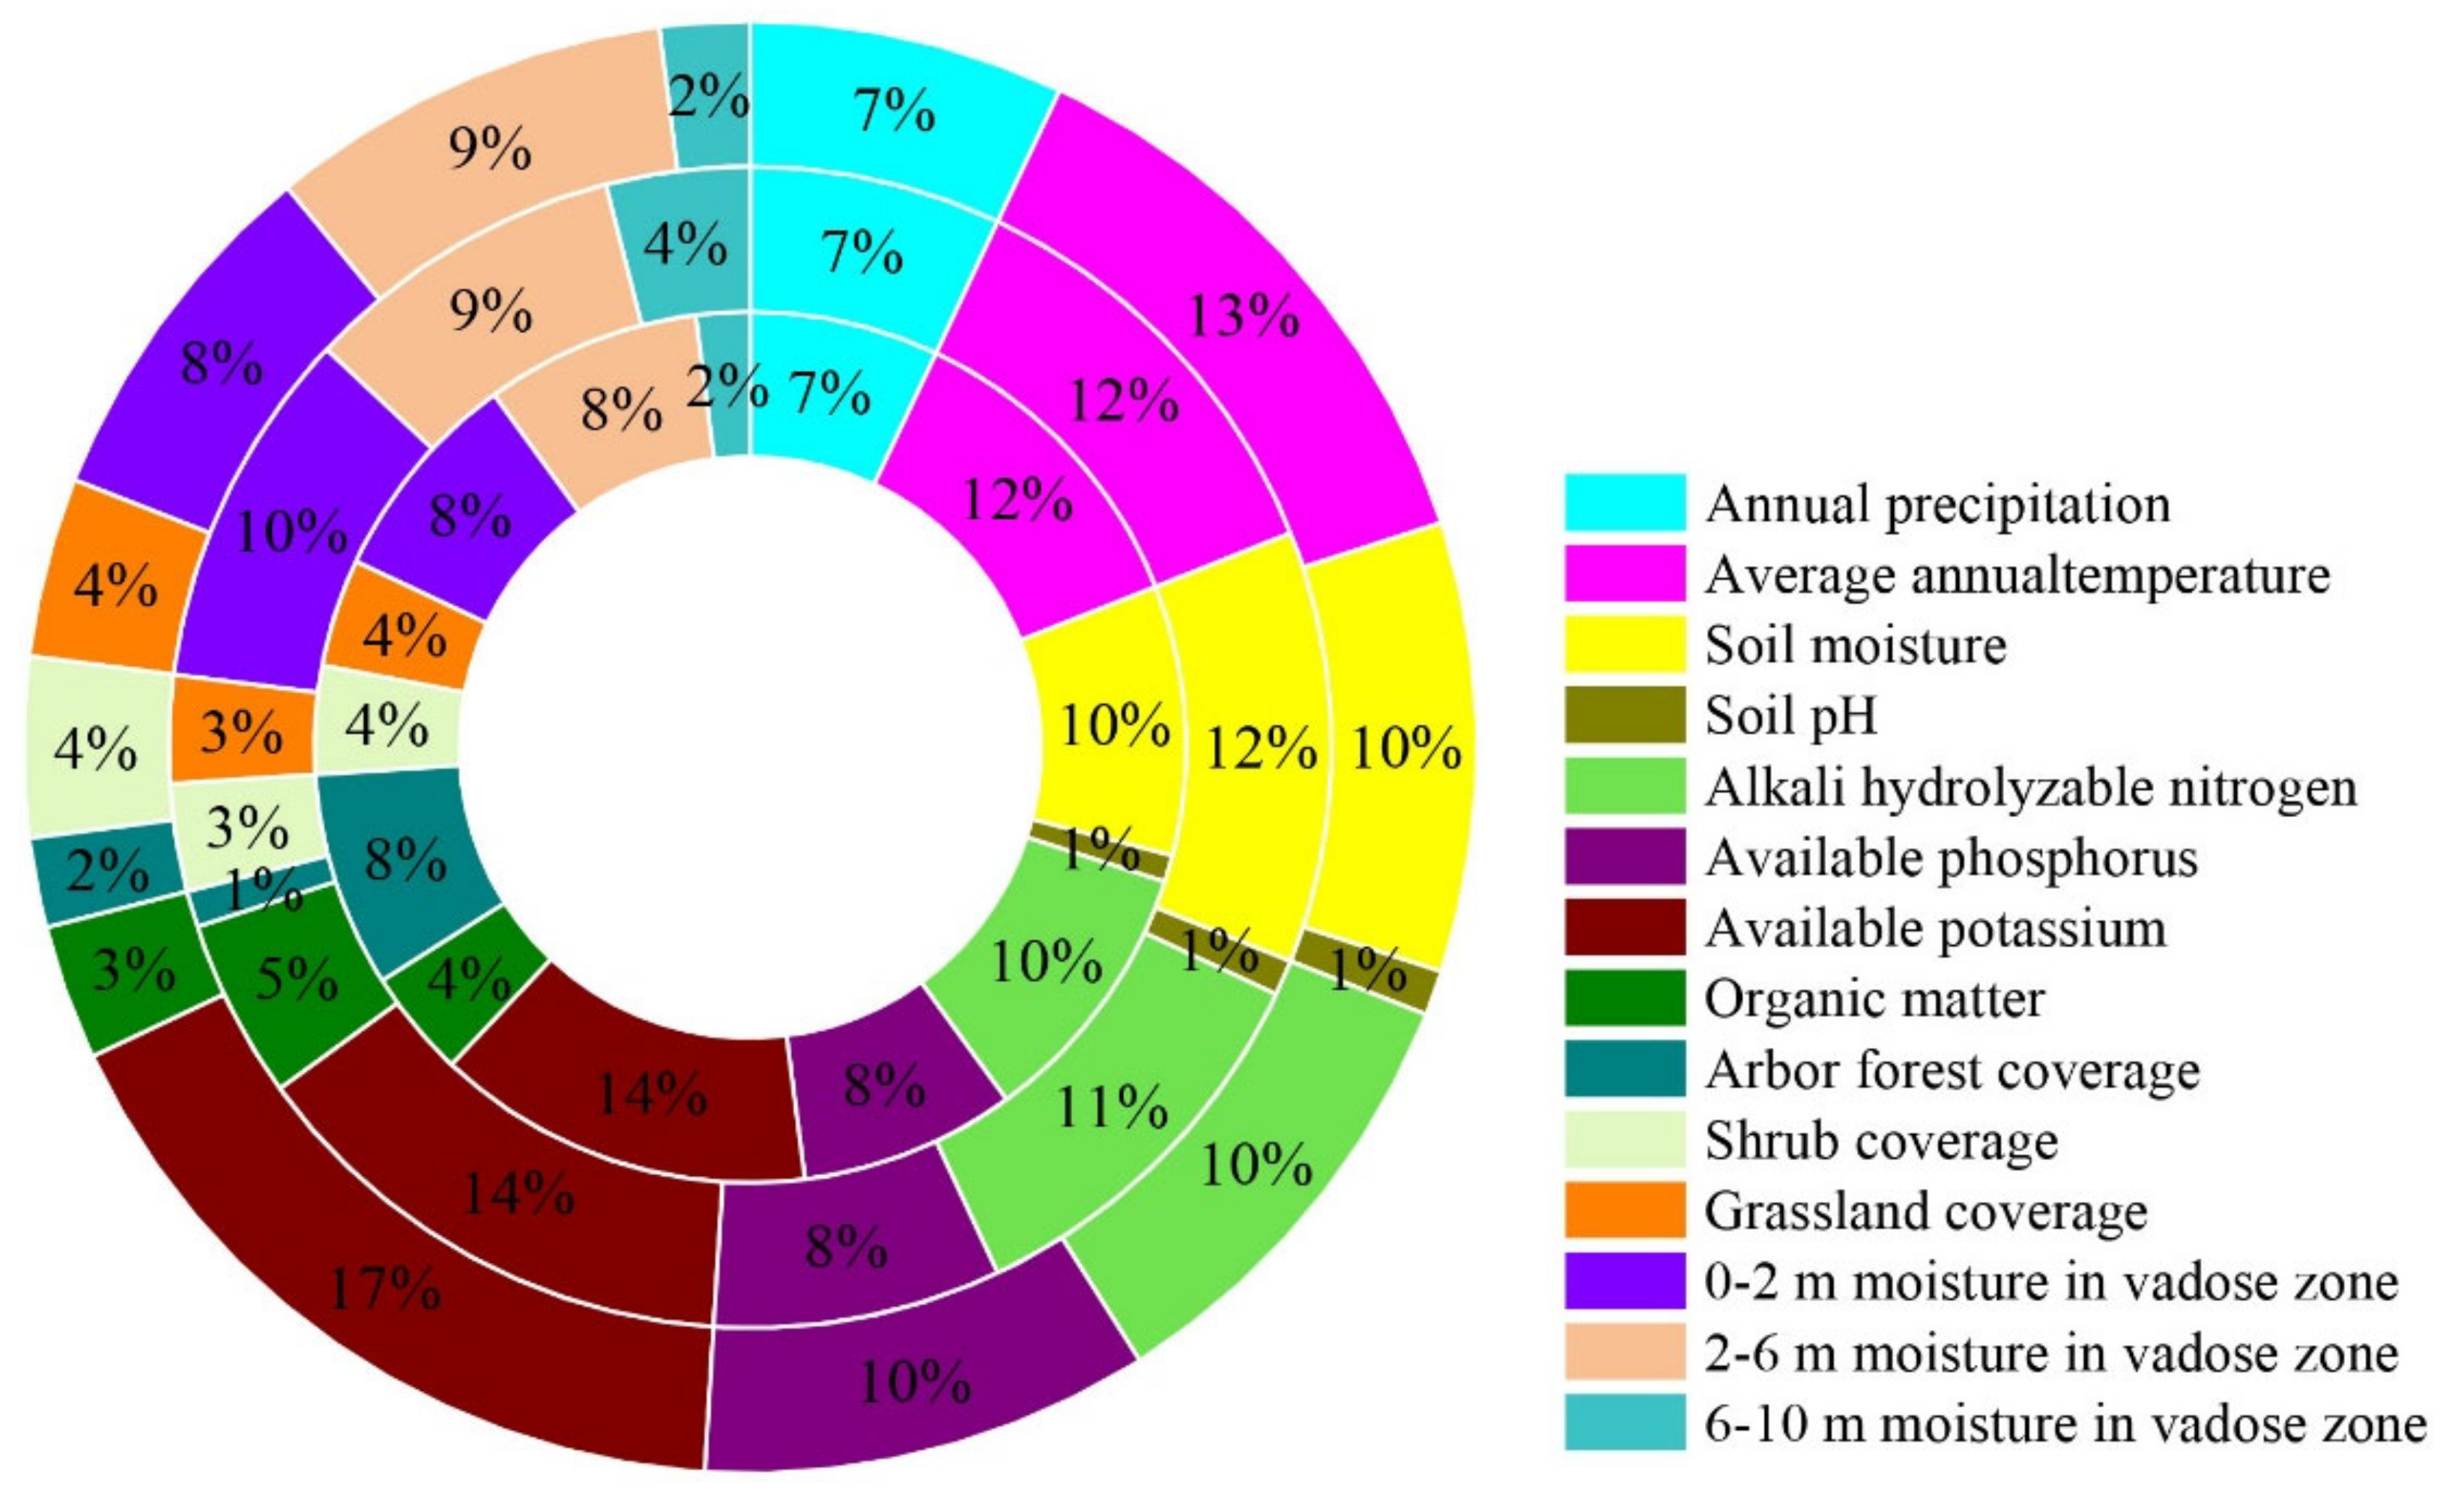
3.1. Evaluation Factor Weight

3.1.1. Index Layer Factor Weights

We used Equations (1)–(3) to calculate the index weight of the index layer, and the results are shown in Figure 5.

3.1.2. Criterion Layer Factor Weights

The criterion layer factor weight can be determined by the index weight contained in each factor, as shown in Figure 6.
It can be seen from Figure 6 that the soil factors and hydrological factors had higher weights in the eco-environmental quality evaluation, accounting for 60–70%, and the weight of the climate factors and vegetation factors in the evaluation of the ecological environmental quality was lower, accounting for 30–40%, indicating that the change in the water and soil environment caused by the coal mining subsidence is the main factor affecting the ecological environmental quality at the small regional-scale of a coal mining subsidence area.

3.2. Evaluation Factor Membership

3.2.1. Index Layer Factor Membership

According to Equations (4)–(7), the membership degrees of each single factor to the four levels of the evaluation standard can be calculated, and the following fuzzy relationship matrix can be obtained for the 13 evaluation factors (Table 4).

3.2.2. Criterion Layer Factor Membership

According to C = BR, the membership degrees of climatic factors, soil properties, vegetation status, and hydrological status of the criterion layer were further calculated (Table 5).
As can be seen from Table 5, in terms of climatic factors, the evaluation results of the three regions were all grade III. Studies have shown that vegetation growth is closely related to climatic factors, and a humid climate can provide good growth conditions for vegetation growth [41]. However, the annual rainfall in the evaluation area was low, and the annual evaporation was 5–10 times that of the annual rainfall. Soil moisture and fertility were affected to a certain extent, which was not conducive to the growth of surface vegetation.
In terms of the soil factors, the evaluation results of the control area and the uniform subsidence area were all grade I, and the evaluation result of the non-uniform subsidence area was grade VI. The evaluation results showed that the mining subsidence had a great influence on the soil quality in the non-uniform subsidence area, but had no effect on the soil quality in the uniform subsidence area, or even improved. This may be due to the fact that the permanent ground fissures in the non-uniform subsidence area expand the leaching effect of soil nutrients [42], causing the nutrients to converge to the bottom of the subsidence area, resulting in a decrease in nutrients in the non-uniform subsidence area and an increase in soil nutrients in the uniform subsidence area.
In terms of vegetation factors, the evaluation results of the three regions were grade II. In the control area, the grade II membership degree was 0.79, and the grade I membership degree was 0.17. The grade II membership degree of the uniform subsidence area and the non-uniform subsidence area were 0.86 and 0.76, respectively. The evaluation results showed that the mining subsidence had a certain impact on vegetation growth, and the impact of the non-uniform subsidence area was greater than that of the uniform subsidence area.
In terms of the hydrological factors, the evaluation results of the three regions were all grade VI. Among them, the membership degree of grade VI in the control area, uniform subsidence area, and non-uniform subsidence were 0.62, 0.61, and 0.74, respectively. The research showed that the change of moisture in the vadose zone was obvious during the mining process, and the impact degree of different damaged areas was different [42]. The moisture in the vadose zone of the uniform subsidence area gradually showed the phenomenon of “self-healing”, while the surface cracks in the non-uniform subsidence area were difficult to self-heal; this negative effect still exists, and is difficult to recover in the short-term.

3.3. Comprehensive Evaluation of Surface Ecological Environment Quality in Subsidence Areas

According to the principle of the maximum membership degree in fuzzy mathematics, the membership degree of the surface ecological environmental quality in the subsidence area was obtained after the fuzzy matrix operation (Table 6).
As can be seen from Table 6, according to the principle of maximum membership and the evaluation classification of the referenced eco-environmental quality evaluation factors, the eco-environmental quality evaluation result of the control area was grade III and the eco-environmental quality was “general”. The evaluation result of the uniform subsidence area was grade III, and the ecological environment quality was “general”, which was close to the control area. The evaluation result of the non-uniform subsidence area was grade VI, and the ecological environment quality was “poor”. The comprehensive evaluation results of the surface ecological environment in the subsidence area showed that mining subsidence had a greater impact on the ecological environment quality of the non-uniform subsidence area, and the ecological environment quality dropped from the general level to the poor level while the ecological environmental quality of the uniform subsidence area had little impact, and the ecological environmental quality level had not changed, indicating that the ecological environmental quality of the uniform subsidence area had returned to the original level.

4. Discussion

A large number of studies have shown that the AHP evaluation index is relatively rich, the calculation process is relatively reasonable, the hierarchical structure is clear, the evaluation index can be flexibly selected according to the characteristics of the study area, and is less affected by the scale change of the study area. The hierarchical structure model proposed in this paper is suitable for the comprehensive evaluation of the surface ecological environmental quality in small-scale subsidence areas. The evaluation results are consistent with the impact law of coal mining subsidence on the surface ecological environment [15,22,43,44]. Compared with the analytic hierarchy process, the comprehensive index method is a weighted multi-factor environmental quality evaluation method, which is more commonly used in the ecological environmental evaluation of mining areas. For example, the “Technical Specifications for Evaluation of Ecological Environment Status” (HJ/T 192–2015) promulgated by the Ministry of Environmental Protection uses the ecological environmental status index EI as a comprehensive evaluation index to reflect the quality of the ecological environment. Some scholars have taken the Huolinhe mining area as the research object, and used the comprehensive index method to determine the weight of each index based on the four indices of biological abundance, vegetation coverage, land degradation, and environmental quality to calculate the EI index and conduct a survey on the ecological environment grading [45]. However, this method assumes that the weight of the evaluation regional indicators is fixed under different natural conditions, which cannot reflect regional differences and lacks objectivity in evaluating the ecological environment [46]. With the development of remote sensing technology, most scholars have used the remote sensing method to quickly obtain the information of the surface ecological elements and reflect the quality of the ecological environment through the remote sensing ecological index RESI. This method has the advantages of the stable and easy access of index data [47]. The disadvantage of this method is that the RSEI index has a strong dependence on the remote sensing indicators, the number of indicators is relatively small, and there is a lack of test indicators that reflect the surface ecological information in subsidence areas that are not suitable for the ecological environmental quality evaluation of small-scale subsidence areas [44].
The climate factor was not a variable in this study, and its function was to limit the application scenario of the model. Under certain climatic conditions, the background value of ecological elements such as vegetation, soil, and hydrology is at a certain level. When disturbed by human beings, the level of these factors will fluctuate on the original basis, and the climatic conditions can amplify or reduce the impact of these fluctuations to a certain extent. Therefore, considering climate factors can make the evaluation results more in line with the local ecological environment to increase the accuracy of the model.

5. Conclusions

In this study, a surface ecological environmental quality evaluation model combining the hierarchical method and the weighted method was constructed to achieve a comprehensive evaluation of the surface ecological environmental quality in small-scale subsidence areas. The main conclusions are as follows:
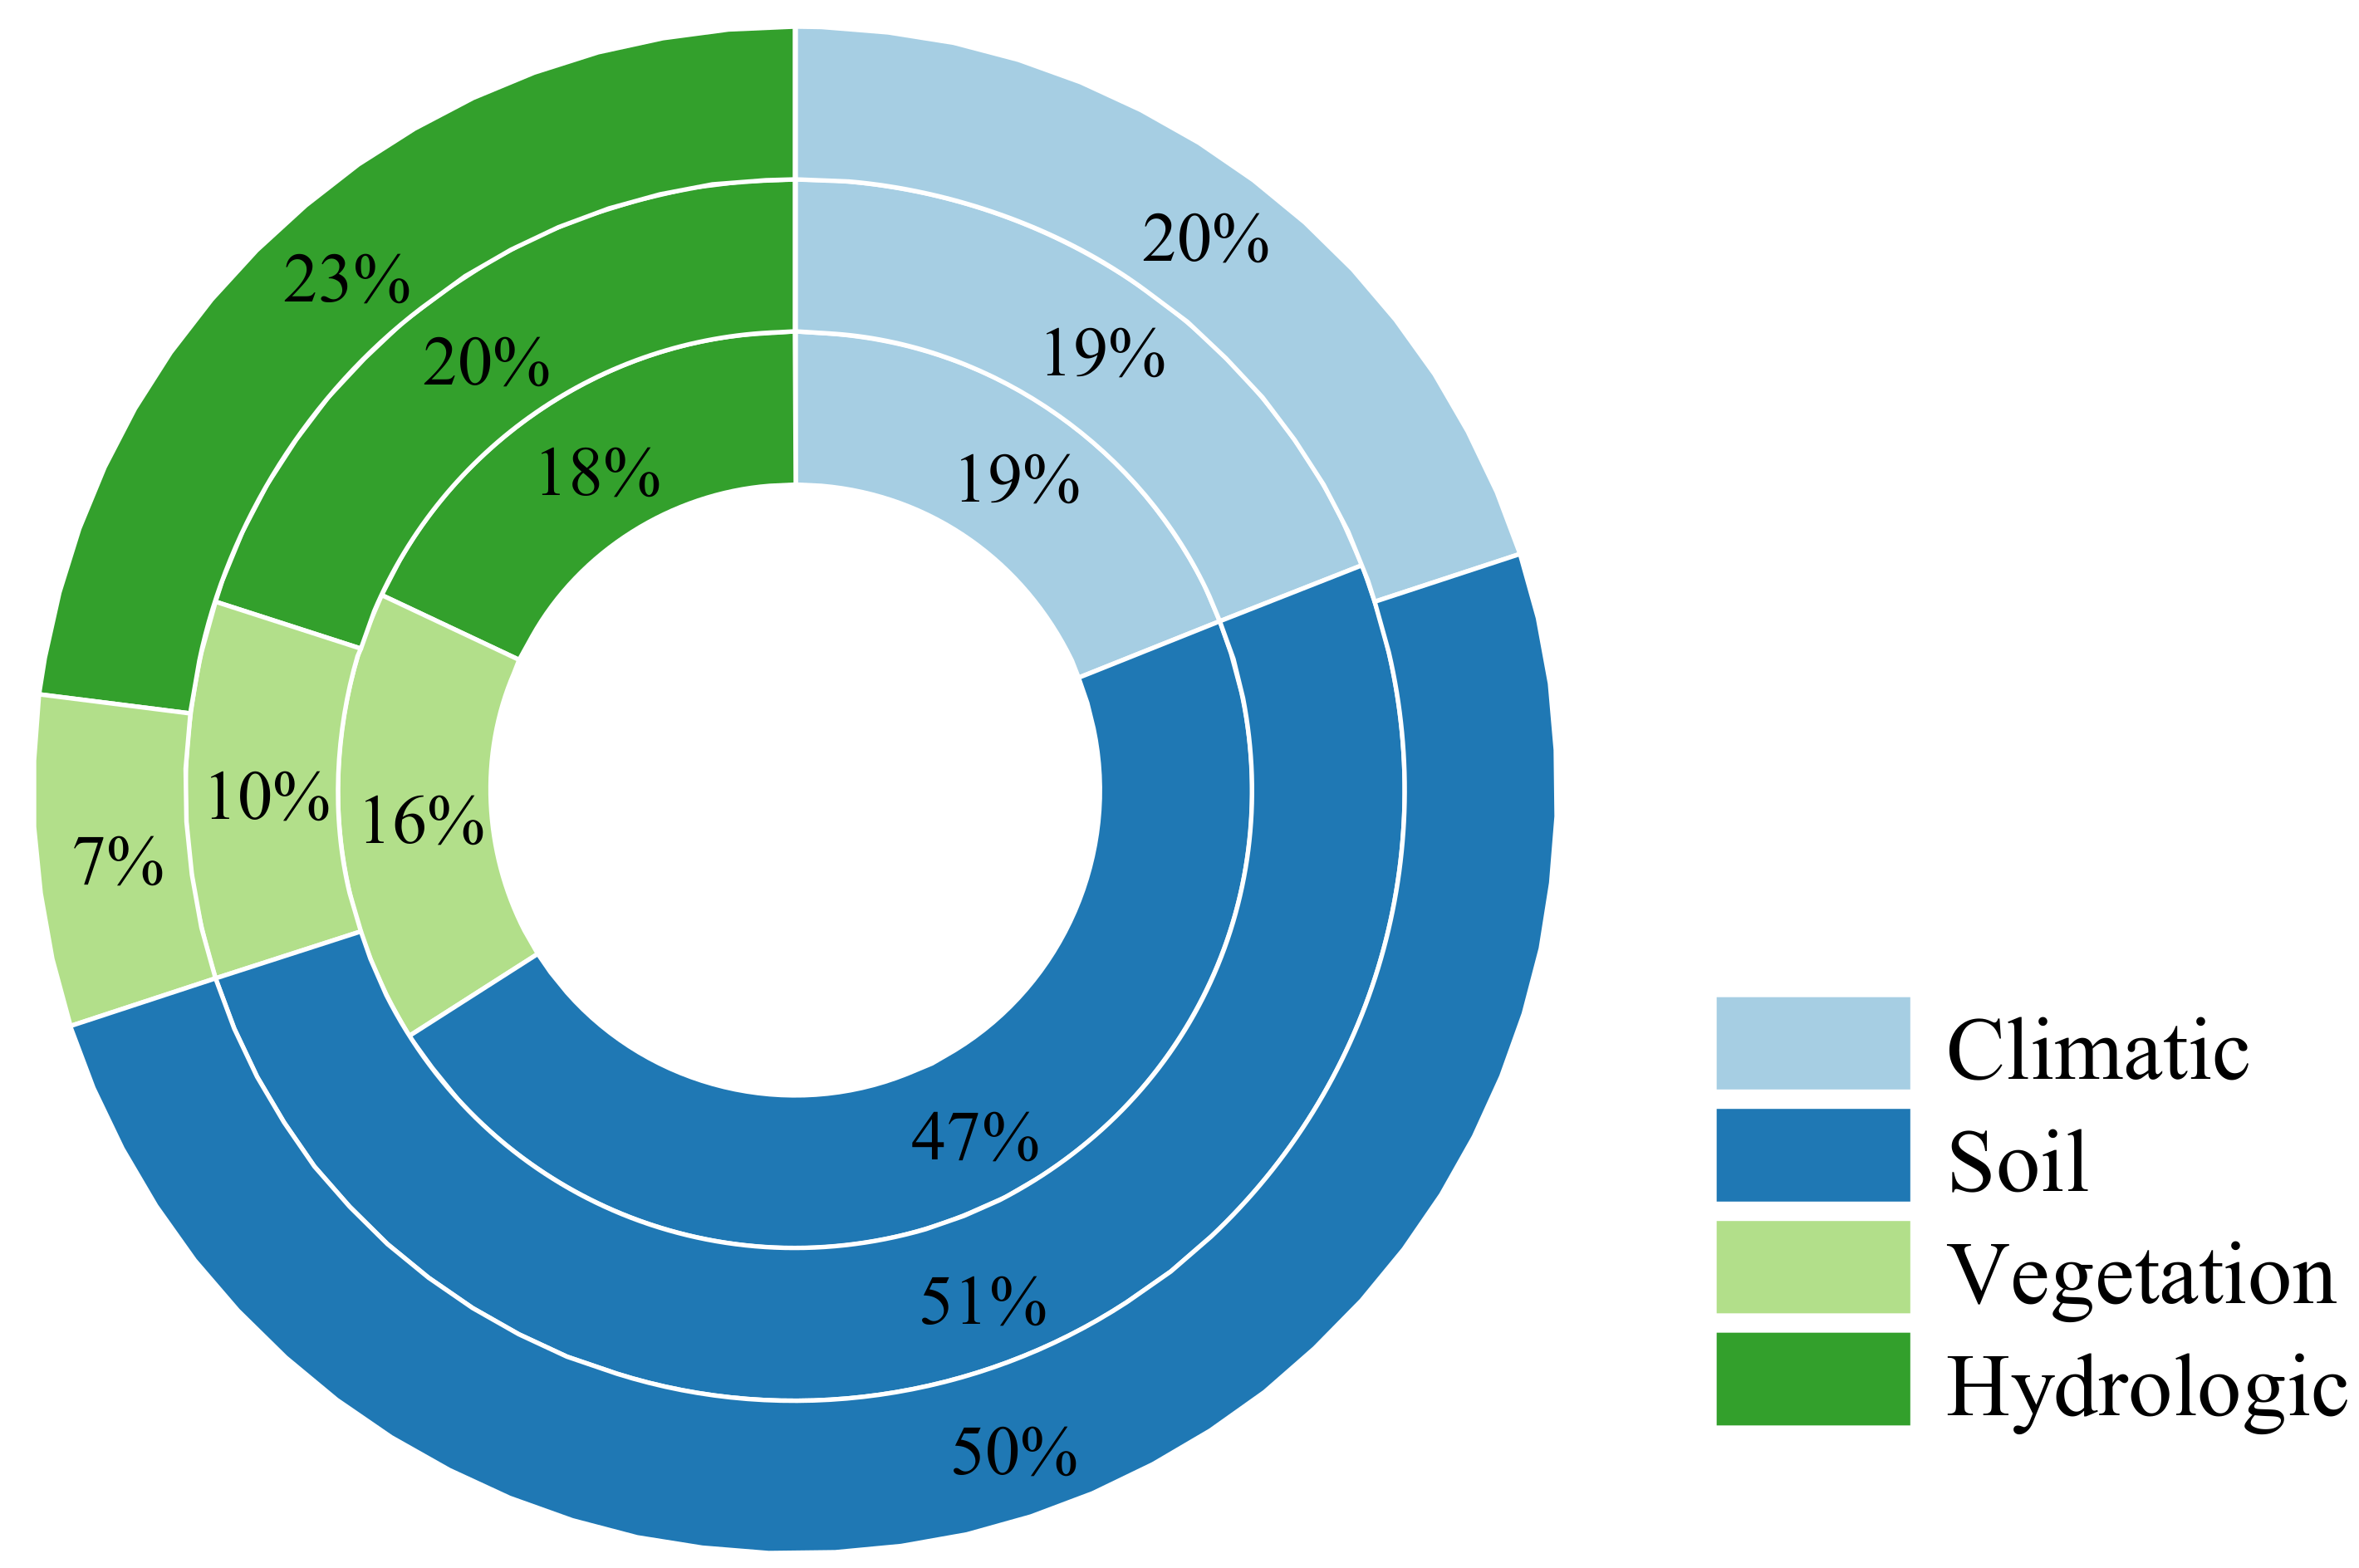
  • Soil factors and hydrological factors have a high weight in the evaluation of ecological environmental quality, and the two weights accounted for 60–70%. Climate factors and vegetation factors had lower weights in the evaluation of ecological environmental quality, and the two weights accounted for 30–40%. The changes in soil and water environment caused by coal mining subsidence were the main factors that caused differences in the ecological environmental quality in subsidence areas.
  • In terms of climate factors, the evaluation results of the three regions were grade III, and the impact of climate factors on small-scale subsidence areas was the same. In terms of soil factors, the evaluation results of the control area and the uniform subsidence area were grade I, and the evaluation results of the non-uniform subsidence area were grade VI. Coal mining subsidence had a great impact on the soil quality of the non-uniform subsidence area, but had no impact on the soil quality of the uniform subsidence area, and was even improved. In terms of the vegetation factors, the evaluation results of the three regions were grade II. The membership values of the different grades showed that mining subsidence had a certain impact on the vegetation growth, and the impact of the non-uniform subsidence area was greater than that of the uniform subsidence area. In terms of the hydrological factors, the evaluation results of the three regions were grade VI. The membership values of different grades showed that coal mining subsidence had a significant impact on the non-uniform soil moisture and had little impact on the uniform subsidence area.
  • The comprehensive evaluation result of the eco-environmental quality in the control area was grade III and the eco-environmental quality was at the “general” level; the evaluation result of the uniform subsidence area was grade III and the ecological environmental quality was “general”, which was close to the control area; and the evaluation result of the non-uniform subsidence area was grade VI and the ecological environmental quality was “poor”. Coal mining subsidence had a greater impact on the quality of the ecological environment in the non-uniform subsidence area, and the quality of the ecological environment decreased while the impact on the ecological environmental quality in the uniform subsidence area was small, and the quality of the ecological environment was close to the original level.

Author Contributions

Conceptualization, Y.Y. and K.Z.; Methodology, K.Z.; Software, L.B.; Validation, L.B., S.L. and F.W.; Writing—original draft preparation, S.L.; Writing—review and editing, Y.Y.; Visualization, S.L.; Supervision, K.Z.; Funding acquisition, K.Z. All authors have read and agreed to the published version of the manuscript.

Funding

This research was funded by the National Natural Science Foundation of China, grant number 52004012; the Key Technologies of Ecological Restoration and Ecological Stability Improvement in Western Mining Area, grant number GJNY2030XDXM-19–03.1; The Science and Technology Innovation Projects of Shenhua Shendong Coal Group, grant number 202016000041; and the 2020 Xinjiang talent introduction plan.

Data Availability Statement

Experimental data are available from the authors.

Conflicts of Interest

The authors declare no conflict of interest.

References

  1. Du, Y. Research on Xi Jinping Thought on Ecological Advancement; College of Marxism, Northwest A & F University: Xianyang, China, 2020. [Google Scholar]
  2. Zhao, X. Xi Jinping’s Thought of Ecological Civilization and Its Contemporary Value; Harbin Normal University: Harbin, China, 2021. [Google Scholar]
  3. Mandal, A.; Sengupta, D. An assessment of soil contamination due to heavy metals around a coal-fired thermal power plant in India. Environ. Geol. 2006, 51, 409–420. [Google Scholar] [CrossRef]
  4. Rostami, R.; Jonidi Jafari, A. Application of an adsorptive-thermocatalytic process for BTX removal from polluted air flow. J. Environ. Health Sci. Eng. 2014, 12, 89. [Google Scholar] [CrossRef] [PubMed] [Green Version]
  5. Zhou, Y. A Comparative Study of Chinese and Foreign Environment Impact Assessment of the Legal System; China University of Geosciences: Beijing, China, 2008. [Google Scholar]
  6. Lu, H.; Qi, Y. A Study on Japan’s Environmental Management and Govermental Responsibilities. Contemp. Econ. Jpn. 2013, 12, 68–79. [Google Scholar] [CrossRef]
  7. Liu, P. General Environmental Sciences; Higher Education Press: Beijing, China, 1985. [Google Scholar]
  8. Dongsheng, Z.; Gangwei, F.; Liqiang, M.; An, W.; Yude, L. Harmony of large-scale underground mining and surface ecological environment protection in desert district—A case study in Shendong mining area, northwest of China. Procedia Earth Planet. Sci. 2009, 1, 1114–1120. [Google Scholar] [CrossRef] [Green Version]
  9. Pei, H.; Fang, S.; Lin, L.; Qin, Z.; Wang, X. Methods and applications for ecological vulnerability evaluation in a hyper-arid oasis: A case study of the Turpan Oasis, China. Environ. Earth Sci. 2015, 74, 1449–1461. [Google Scholar] [CrossRef] [Green Version]
  10. Yan, C.; Dai, H.; Wen, G. Evaluation of Ecological Environmental Quality in a Coal Mining Area by Modelling Approach. Sustainability 2017, 9, 1265. [Google Scholar] [CrossRef] [Green Version]
  11. Lei, K.; Pan, H.; Lin, C. A landscape approach towards ecological restoration and sustainable development of mining areas. Ecol. Eng. J. Ecotechnol. 2016, 90, 320–325. [Google Scholar] [CrossRef]
  12. Weeks, J.L. Is Regulation Effective? A Case Study of Underground Coal Mining. Ann. N. Y. Acad. Sci. 1989, 572, 189–199. [Google Scholar] [CrossRef]
  13. Cherp, A. Environmental assessment in countries in transition: Evolution in a changing context. J. Environ. Manag. 2001, 62, 357–374. [Google Scholar] [CrossRef]
  14. Lv, X.; Xiao, W.; Zhao, Y.; Zhang, W.; Li, S.; Sun, H. Drivers of spatio-temporal ecological vulnerability in an arid, coal mining region in Western China. Ecol. Indic. 2019, 106, 105471–105475. [Google Scholar] [CrossRef]
  15. Han, X.; Cao, T.; Yan, X. Comprehensive evaluation of ecological environment quality of mining area based on sustainable development indicators: A case study of Yanzhou Mining in China. Environ. Dev. Sustain. 2021, 23, 7581–7605. [Google Scholar] [CrossRef]
  16. Zhang, K.; Zheng, X.; Li, H.; Zhao, Z. Human health risk assessment and early warning of heavy metal pollution in soil of a coal chemical Plant in Northwest China. Soil Sediment Contam. Int. J. 2020, 29, 481–502. [Google Scholar] [CrossRef]
  17. Liu, S.; Li, W.; Qiao, W.; Wang, Q.; Hu, Y.; Wang, Z. Effect of natural conditions and mining activities on vegetation variations in arid and semiarid mining regions. Ecol. Indic. 2019, 103, 331–345. [Google Scholar] [CrossRef]
  18. Xiao, W.; Zhang, W.; Ye, Y.; Lv, X.; Yang, W. Is underground coal mining causing land degradation and significantly damaging ecosystems in semi-arid areas? A study from an Ecological Capital perspective. Land Degrad. Dev. 2020, 31, 1969–1989. [Google Scholar] [CrossRef]
  19. Gao, X. Study on the Change and Evaluation of Land Ecological Quality in Caol Mining Subsidence Area of Mu Us Sandy Landt—A Case Study of the Bulianta Coal Mine; Inner Mongolia Normal University: Hohhot, China, 2021. [Google Scholar]
  20. Xu, J.; Li, G.; Chen, G.; Zhao, H. Dynamic changes and evaluation of land ecological quality in coal mining area. J. China Coal Soc. 2013, 38, 180–185. [Google Scholar]
  21. Shao, W.; Guan, Q.; Tan, Z.; Luo, H.; Ma, Y. Application of BP—ANN model in evaluation of soil quality in the arid area, northwest China. Soil Tillage Res. 2021, 208, 104907. [Google Scholar] [CrossRef]
  22. Yang, Z.; Li, W.; Li, X.; Wang, Q.; He, J. Assessment of eco-geo-environment quality using multivariate data: A case study in a coal mining area of Western China. Ecol. Indic. 2019, 107, 105651. [Google Scholar] [CrossRef]
  23. Wang, Y.; Wu, X.; He, S.; Niu, R. Eco-environmental assessment model of the mining area in Gongyi, China. Sci. Rep. 2021, 11, 17549. [Google Scholar] [CrossRef]
  24. Chen, Z. Study on Remote Sensing Assessment Model and Method of Land Ecological Quality: A Case Study of the City of Guang An; China University of Geosciences: Beijing, China, 2020. [Google Scholar]
  25. Pei, W. Eco-Environment Dynamic Monitoring and Prewarning Study in Panxie Coal Mining Area, Huainan; Nanjing University: Nanjing, China, 2016. [Google Scholar]
  26. Fan, D.; Qiu, Y.; Sun, W.; Zhao, X.; Mai, X.; Hu, Y. Evaluating ecological environment based on remote sensing ecological index in Shenfu mining area. Bull. Surv. Mapp. 2021, 7, 23–28. [Google Scholar] [CrossRef]
  27. Han, Z. Study on the Effect of Coal Mining Collapse Crack on Soil Physical and Water Characteristics in Sandy Area; Henan Polytechnic University: Jiaozuo, China, 2017. [Google Scholar]
  28. Shi, P.; Zhang, Y.; Hu, Z.; Ma, K.; Yu, B. Influence mechanism of coal mining subsidence on soil quality and restoration measures in west China aeolian sand area. J. Univ. Chin. Acad. Sci. 2017, 34, 318–328. [Google Scholar] [CrossRef]
  29. Li, X. Status and countermeasures of clean and efficient utilization of coal resources in China. Coal Econ. Res. 2019, 39, 71–75. [Google Scholar] [CrossRef]
  30. Li, Q.; Liu, N.; Zhang, Z.; Ma, C. Distribution Characteristics of Salix Psammophila Litter in Southeastern Edge of Mu Us Sandy Land. J. Arid. Meteorol. 2020, 30, 313–318. [Google Scholar]
  31. Xu, Z.; Lu, H. Aeolian environment change studies in the Mu Us Sandy Land, north-central China: Theory and recent progress. Acta Gograph. Sin. 2021, 76, 2203–2223. [Google Scholar]
  32. Yan, F.; Wu, B. Desertification progress in Mu Us Sandy Land over the past 40 years. Arid Land Geogr. 2013, 36, 987–996. [Google Scholar]
  33. Hu, Z.; Chen, C.; Xiao, W.; Wang, X.; Gao, M. Surface movement and deformation characteristics due to high-intensive coal mining in the windy and sandy region. Int. J. Coal Sci. Technol. 2016, 3, 339–348. [Google Scholar] [CrossRef] [Green Version]
  34. Du, P. Research on Geologic Environment Effects Induced by Coal Mining in Ecological Weakness Aera and Assessment Techniques; China University of Mining and Technology: Xuzhou, China, 2011. [Google Scholar]
  35. Guo, J.; Li, Q. Surface damage characteristics in shallow-buried coal seam with strong disturbance mining: Taking Shendong coal mine district as an example. China Min. Mag. 2018, 27, 106–112. [Google Scholar]
  36. Grothmann, T.; Petzold, M.; Ndaki, P.; Kakembo, V.; Siebenhüner, B.; Kleyer, M.; Yanda, P.; Ndou, N. Vulnerability assessment in african villages under conditions of land use and climate change: Case studies from Mkomazi and Keiskamma. Sustainability 2017, 9, 976. [Google Scholar] [CrossRef] [Green Version]
  37. Hao, J.; Xu, G.; Luo, L.; Zhang, Z.; Yang, H.; Li, H. Quantifying the relative contribution of natural and human factors to vegetation coverage variation in coastal wetlands in China. Catena 2020, 188, 104429. [Google Scholar] [CrossRef]
  38. Dong, G.; Guo, C. Evaluation of Land Ecological Quality in the Energy-development Area in the West—A Case Study of Yijinhuoluo Country. J. Inn. Mong. Norm. Univ. (Philos. Soc. Sci.) 2015, 44, 73–76. [Google Scholar]
  39. Yang, D.; Lei, S.; Bian, Z.; Mou, S. A Review of the Progress in the Research on Soil Physical Quality Indicator and Its Application in the Mining Area Environment. Resour. Environ. Yangtze Basin 2015, 11, 1961–1968. [Google Scholar] [CrossRef]
  40. Qin, X.; Xiong, J. Application of 3σ rule in LabVIEW data procession. China Meas. Test 2009, 35, 66–69. [Google Scholar]
  41. Ma, X.; Fan, L.; Zhang, X.; Zhang, Y. Dynamic change of land desertification and its driving mechanism in Yushenfu mining area based on remote sensing. J. China Coal Soc. 2016, 41, 2063–2070. [Google Scholar] [CrossRef]
  42. Wang, X. Monitoring Evolution and Self-Healing Characteristic of Land Damage Due to High Tension Coal Mining in Windy and Sandy Area; China University of Mining & Technology: Beijing, China, 2014. [Google Scholar]
  43. Zhang, Y.; Lu, W.; Guo, J.; Zhao, H.; Yang, Q.; Chen, M. Geo-environmental impact assessment and management information system for the mining area, northeast China. Environ. Earth Sci. 2015, 74, 7173–7185. [Google Scholar] [CrossRef]
  44. Xia, N. Study on Remote Sensing Monitoring of Eco-environment and Assessment Model of Ecological Quality in Zhundong Mining Region; Xinjiang University: Ürümqi, China, 2018. [Google Scholar]
  45. Fu, G. The Ecological Environment Impact Assessment Study of Coal Mine Planning Environmental Impact Assessment-Take Huolinhe Mine Planning as an Example; Inner Mongolia University: Hohhot, China, 2013. [Google Scholar]
  46. Fang, A. Study on Ecological Cumulative Effects of Mining Areas in Arid and Semi-Arid Grassland in Eastern Inner Mongolia; China University of Mining and Technology: Xuzhou, China, 2020. [Google Scholar]
  47. Hu, S.; Yao, Y.; Fu, J.; Zhao, J.; Hao, D. Evaluation of ecological quality variation in mining area of Northeast China based on RESI Index: A case study of Gongchangling District, Liaoning Province. Chin. J. Ecol. 2021, 40, 4053–4060. [Google Scholar] [CrossRef]
Figure 1. Location map of the No. 2 mine field of Nalin River.
Processes 10 00952 g001
Figure 2. Layout of the sample points in the three areas.
Processes 10 00952 g002
Figure 3. (a) Dynamic characteristics of dip surface subsidence curve of the working face (layout of survey line Q–W). (b) Prediction results of the settlement numerical simulation.
Processes 10 00952 g003
Figure 4. The AHP hierarchy model diagram.
Processes 10 00952 g004
Figure 5. The evaluation factor ring weight chart.
Processes 10 00952 g005
Figure 6. The ring weight graph of the evaluation factors in the sub criteria layer.
Processes 10 00952 g006
Table 1. Evaluation criteria of the environmental parameter.
ElementsStandardIndexUnitStandard Grading
IIIIIIVI
ClimatePrecipitation grade standard (GB/T 28592–2012)Annual precipitationmm800600400200
Temperature evaluation grade (GB/T 35562–2017)Average temperature°C////
SoilClassification standard of the second soil surveyMoisture%151285
pH /////
Nmg/kg1501206030
Pmg/kg2520105
Kmg/kg1501205020
Organic matterg/kg30251510
VegetationTechnical specification for ecological environment assessment (HJ192–2015)Vegetation coverage%5205070
HydrologicalClassification standard of the second soil surveyMoisture in vadose zone%151285
Table 2. The soil pH grade table.
Serial NumberpH RangeGrade
17.13–7.42I
27.42–7.56II
6.99–7.13
37.56–7.70III
6.84–6.99
4>7.70VI
<6.84
Table 3. The annual average temperature grade table.
Serial NumberTemperature RangeGrade
1−0.5σ ≤ ∆T ≤ 0.5σI
20.5σ ≤ ∆T ≤ 1.5σII
−1.5σ ≤ ∆T ≤ −0.5σ
31.5σ ≤ ∆T ≤ 2.0σIII
−2.0σ ≤ ∆T ≤ −1.5σ
4∆T ≥ 2.0σVI
∆T≤ −2.0σ
Table 4. The membership value of the ecological evaluation index in the index layer.
Membership ValueControl AreaUniform Subsidence AreaNon-Uniform Subsidence Area
IIIIIIVIIIIIIIVIIIIIIIVI
Annual precipitation0.000.000.610.390.000.000.610.390.000.000.610.39
Average annual temperature0.000.001.000.000.000.001.000.000.000.001.000.00
Soil moisture0.000.000.001.000.000.000.001.000.000.000.001.00
Soil pH1.000.000.000.001.000.000.000.001.000.000.000.00
Alkali hydrolysable nitrogen0.000.000.480.520.000.000.420.580.000.000.310.69
Available phosphorus0.210.790.000.000.550.450.000.000.000.990.010.00
Available potassium0.950.060.000.001.000.000.000.000.750.250.000.00
Organic matter0.000.060.940.000.000.240.760.000.000.000.980.02
Arbor forest coverage0.340.660.000.000.000.740.260.000.000.590.410.00
Shrub coverage0.000.900.100.000.000.880.120.000.000.800.200.00
Grassland coverage0.000.930.070.000.000.920.080.000.000.780.220.00
0–2 m moisture in vadose zone0.000.000.270.730.000.000.270.730.000.000.001.00
2–6 m moisture in vadose zone0.000.000.370.630.000.000.330.670.000.000.230.77
6–10 m moisture in vadose zone0.000.290.710.000.000.180.820.000.000.000.970.03
Table 5. The membership value of the ecological evaluation index at the criteria level.
Evaluation UnitCriterion LayerIIIIIIVIQuality Level
Control areaClimate0.000.000.860.14III
Soil0.340.150.190.32I
Vegetation0.170.790.040.00II
Hydrologic0.000.030.350.62VI
Uniform subsidence areaClimate0.000.000.860.14III
Soil0.460.100.120.32I
Vegetation0.000.860.140.00II
Hydrologic0.000.020.370.61VI
Non-uniform subsidence areaClimate0.000.000.860.14III
Soil0.220.200.170.41VI
Vegetation0.000.760.240.00II
Hydrologic0.000.000.260.74VI
Table 6. The membership value of the target layer.
Evaluation UnitIIIIIIVIQuality Level
Control area0.190.200.320.29III
Uniform subsidence area0.230.140.320.31III
Non-uniform subsidence area0.110.150.340.40VI
Publisher’s Note: MDPI stays neutral with regard to jurisdictional claims in published maps and institutional affiliations.

