
Experiment on Influence of Blade Angle on Hydraulic Characteristics of the Shaft Tubular Pumping Device


1
College of Hydraulic Science and Engineering, Yangzhou University, Yangzhou 214000, China
2
The Eastern Route of South-to-North Water Diversion Project Jiangsu Water Source Co., Ltd., Nanjing 210029, China
*
Authors to whom correspondence should be addressed.
Processes 2022, 10(3), 590; https://doi.org/10.3390/pr10030590
Submission received: 11 February 2022
/
Revised: 6 March 2022
/
Accepted: 10 March 2022
/
Published: 17 March 2022
(This article belongs to the Special Issue Design and Optimization Method of Pumps)
Abstract
:In order to understand the influence of blade angle on the hydraulic characteristics of a shaft tubular pumping device, the energy characteristics, cavitation characteristics, runaway characteristics, and pressure pulsation of the tubular pumping device under different blade angles were studied by a model test. Comparing the efficiency of the best efficiency point of the pumping device under different blade angles, it can be seen that when the blade angle is +4°, the efficiency of the best efficiency point of the pumping device is the lowest, 74.10%. When the blade angle is −4°, the efficiency of the best efficiency point of the pumping device is the highest, 79.75%. Comparing the cavitation characteristics of the pumping device under different blade angles, it can be seen that when the blade angle is −4°, the overall cavitation performance of the pumping device is the best. When the design head point is deviated, the NPSHav (Net positive suction head available) of the pump will increase. At the same blade angle, the runaway speed increases with the increase in head. The runaway speed of the prototype pump decreases with the increase in blade angle. When the blade angle is −6°, the runaway speed of the prototype pump is the largest, which is not conducive to the safe operation of the pumping station. When the blade angle is −4°, the variation law of pressure pulsation is small, and there is no abnormal pulsation. The tubular pumping device has satisfactory hydraulic performance, high efficiency, cavitation, and runaway characteristics. Therefore, the shaft tubular pumping device has wide application prospects under ultra-low head, and we recommend prioritizing it in low-head pumping stations.
1. Introduction
Pumping station projects are part of China’s economic construction, and their purpose is water energy transmission. At present, pumping stations have been widely used in urban flood control and disaster reduction, agricultural drainage and irrigation, and inter-basin water transfer. However, with the rapid development of the global economy, energy consumption is becoming more and more intense, and the problem of high unit energy consumption of pumping stations is prominent and needs to be solved urgently. In order to save energy and reduce consumption, it is first necessary to ensure the efficient and stable operation of a pumping station, which also requires that the pump, as the core component of the pumping station, can operate at the best angle [1]. Therefore, it is necessary to study the external characteristics of the pumping device at different blade angles.
In the middle and lower reaches along the Yangtze River in China, due to the low-lying and flat terrain, there are a large number of low-head axial flow pumping stations. These low-head pumping stations have the characteristics of high flow rate, low head, and high degree of automation [2]. The common types of low-head axial flow pumping stations along the Yangtze River are vertical, inclined, tubular, and two-way passage.
According to the characteristics of structural type, tubular pumps can be divided into shaft tubular pumps, submersible tubular pumps, and axial extension tubular pumps. The shaft tubular pump is a new type of ultra-low-head pump. Its motor is installed in the shaft. It has many advantages, such as simple structure, relatively high device efficiency, convenient maintenance, two-way water diversion, and drainage function [3,4]. The shaft tubular pump has also been widely used in the east line of the South-to-North Water Transfer Project in China [5]. According to the position of the shaft, the vertical shaft tubular pump can be divided into the front shaft type and the rear shaft type. As shown in Figure 1, the front shaft tubular pump is mostly used in the design and construction of low-head pumping stations because its pumping device has a suitable overall flow pattern in the inlet and outlet channels and its device efficiency is slightly higher than that of the rear shaft tubular pump [6,7].
At present, the research of experts and scholars on the shaft tubular pump mainly focuses on the following aspects. Firstly, due to the low head of the shaft tubular pump, the performance of the device largely depends on the loss of the passage. Zhou et al. [8], Zhang et al. [9], Jiao et al. [10], and Gao et al. [11] carried out in-depth research on the optimal design of the inlet and outlet channels of the pumping device, and put forward optimization suggestions on the type and profile of the channel. Secondly, with the development of China’s South-to-North Water Transfer Project and the renewal and reconstruction project of small- and medium-sized pumping stations, in order to further optimize the performance of vertical shaft tubular pump devices, Shi et al. [12] used CFD to perform unsteady simulation calculations on full tubular and axial flow pumps based on the RNG k-ε turbulence model, and the results show that the pressure pulsation of the full tubular pump is less than that of the axial flow pump under design and large flow conditions. In order to improve the operating head and efficiency of tubular pumps while maintaining a low shaft power, Zhao et al. [13] used the multi-objective orthogonal optimization method to determine the critical parameters of the tubular pump, and the results indicate that the optimized scheme improved the operating head to 6.9 m with higher efficiency of 84.2% and a lower shaft power of 27.7 kW. Aiming at the performance defects of the tubular pump with fixed guide vanes, Zhu et al. [14] proposed a design scheme of the tubular pump with adjustable guide vanes. In this scheme, the installation angle of the guide vane inlet can be flexibly adjusted to match the operating conditions of the pump. The results indicate that with the design of adjustable guide vanes and at off-design flow rates, the flow conditions inside the diffuser of the tubular pump can be improved effectively, and its hydraulic losses can be reduced. On the whole, there are many numerical simulation studies on hydraulic optimization [15,16], internal flow characteristics [17], and hydraulic stability [18,19] of the vertical shaft tubular pump by CFD technology, and the research results meet the needs of engineering applications. However, there are still few studies on the model test of the shaft tubular pump system, especially research on the core component of the pumping device, the pump. At present, the choice of blade angles for traditional pumps is still to meet the requirements of design conditions, ignoring the hydraulic performance analysis of pumping devices that meet the operating conditions of design conditions when operating at other blade angles.
In this work, we take the shaft tubular pumping station in a large-scale inter-basin water transfer project as the research background. Based on the model test technology, the hydraulic performance of the pumping device under different blade angles is studied. The related results can provide reference for the actual project.
2. Model Pump and Pumping Device
A total of four shaft tubular pumping devices are installed in the pumping station; three are used and one is on standby. The devices are arranged in a single row with a design flow rate of 42 m3/s. The diameter of the impeller is 2350 mm, the rotation speed is 135 r/min, the designed single device flow rate is 14 m3/s, and the designed net head is 1.52 m. The schematic diagram of the shaft tubular device is shown in Figure 2, and the basic geometric parameters of the pumping device are shown in Table 1.
The pump model and device model are geometrically similar to the prototype pumping device. The scale between the pumping device model and the prototype pumping device is 1:7.8333, and the impeller diameter of the model pump is D0 = 300 mm. The model impeller is shown in Figure 3a. The number of impeller blades is three. It is processed and formed with cast copper material, and the blade top clearance is controlled within 0.20 mm. The number of model guide vane blades is six, which is integrally cast with cast iron material. As shown in Figure 3b, the inlet and outlet channels are welded with steel plates. In order to meet similar roughness, the inner wall of the steel channel is coated.
3. Model Test System and Test Method
3.1. Composition of the Test Bench
The model test of pumping device was carried out on the high-precision hydraulic machinery test bench in the test center of Yangzhou University, and the comprehensive error of the efficiency test system was ±0.39%. The test bench was a vertical closed circulation system, as shown in Figure 4. The total length of the hydraulic closed circulation system of the test bench was 60.0 m. The diameter of the straight pipe section 10 times the pipe diameter before and after the installation position of the electromagnetic flowmeter was 0.4 m, the diameter of other pipes was 0.5 m, and the water volume of the whole system was 50 m3. External characteristic tests such as the pump model energy test, cavitation test, runaway characteristic test, and pressure pulsation test were carried out on the test bench. The main instrument and equipment parameters of the measurement system in this test are shown in Table 2. The DC rectifier in the test bench was used to adjust the motor speed of the model pumping device. According to the principle that the product of the impeller diameter and the speed of model pump is equal to that of the prototype pump, the speed of the model pump was 1057.5 r/min, and the actual test speed was 1057.5 r/min.
3.2. Test Method
3.2.1. Energy Test
The energy test of the pumping device is one of the important tests to check whether the hydraulic performance of the pumping device can meet the standards. The energy test parameters of the pumping device mainly include three parameters: flowrate Q, head h, and efficiency η. The flow rate Q of the pumping device model is directly measured by the electromagnetic flow meter.
The head h of the pumping device is equal to the total head difference between the two pressure measuring sections at the inlet and outlet of the pumping device. The pressure measuring section is shown in Figure 5. Section 1-1 is the inlet pressure measuring section and section 2-2 is the outlet pressure measuring section. Therefore, the head of the pumping device is equivalent to the water level difference between the upstream and downstream of the pumping station, the net head.
The total head difference is equal to the algebraic sum of the static pressure difference and dynamic pressure difference between the two sections:
where
is net head (in m). The pressure difference between the inlet section 1-1 and the outlet section 2-2 is directly measured by the differential pressure transmitter in the head measuring system. is dynamic head (in m). The dynamic pressure difference is calculated from the flow and the cross-sectional area of the two pressure measuring sections.
The efficiency η of the pumping device model is the efficiency calculated after deducting the mechanical loss torque. The calculation formula is as follows:
where N is the shaft power (in kW), M is the input torque of model pump (in N·m), M′ is the mechanical loss torque of model pump (in N·m), n is the test speed of model pump (in r/min), ρ is the water density (in kg/m3), g is the gravitational acceleration (in m/s2), and Q is the flow rate (in m3/s).
3.2.2. Cavitation Test
During the cavitation test, the flow rate is always kept constant. By vacuuming the closed-loop system, the system pressure is gradually reduced to cause cavitation in the pump. The effective cavitation margin value of the pumping device under different system pressures is calculated by the following formula:
where NPSHav is the net positive suction head available (in m), Pav is the absolute pressure of the pressure measuring point of the inlet tank (in Pa), v is the average velocity of the pressure measuring section of the inlet tank (in m/s), Pv is the saturated vapor pressure of water at test water temperature (in Pa), and h is the height difference between the absolute pressure transmitter and the pump blade rotation centerline (pump shaft).
3.2.3. Runaway Test
The runaway test of water head is provided by the auxiliary pump. The test process is as follows: disconnect the coupling between the torque meter and the motor, adjust the speed of the auxiliary pump, and measure the speed and flow when the model pumping device reverses and the output torque is zero under different water heads. The runaway characteristic can be expressed by unit speed and unit flow, which are calculated according to the following equations:
where is the unit speed (in r/min), is the unit flow rate (in m3/s), D is the nominal diameter of the impeller (in m), H is the total head difference between upstream and downstream (in m), is the measured speed at the characteristic head (in r/min), and is the measured flowrate at the characteristic head (in m3/s).
Next, we calculated the corresponding unit speed and unit flow, taking the value when the unit speed tends to be stable as the unit runaway speed . The actual runaway speed of the prototype pump at different head points can be determined by the following formula:
where is the actual runaway speed of the prototype pump (in r/min), DP is the diameter of the prototype pump (in m), and HP is the head of the prototype pump at the working point (in m).
3.2.4. Pressure Pulsation Test
Two CYG1505GLLF high-frequency dynamic pressure pulsation sensors were used for the pressure pulsation test, and the range of the pressure pulsation sensor was 200 kPa, equipped with the SQCJ-USB-16 data acquisition instrument.
As shown in Figure 6, the pressure pulsation sensor is installed at the impeller inlet of the model pump (P1) and the guide vane outlet of the model pump (P2). The water pressure pulsation at three head operating points (including the low head, designed head, and high head) at six placement angles (−6°, −4°, −2°, 0°, +2°, and +4°) of the impeller blades was tested.
4. Results
4.1. Energy Characteristics
The energy characteristics of the pumping device were tested under six different blade angles of −6°, −4°, −2°, 0°, +2°, and +4°, and more than 20 working points were set under each blade angle. It is worth noting that before the energy characteristic test of the pumping device model, we first ensured that the pumping device model operated at the rated flow operating point for more than 30 min, and that all test parameters changed smoothly without runout. Figure 7 shows the energy characteristics curve of the pumping device at different blade angles. It can be seen from the figure that at the same blade angle, the head of the pumping device decreases as the flow rate increases, and the efficiency of the pumping device increases and then decreases as the flow rate increases. Comparing the energy performance of the pumping device at different blade angles, it can be seen that the energy performance curve of the pumping device changes from small to large angles as the blade angle increases. Under the same flow conditions, as the blade angle increases, the head gradually increases, and the efficiency gradually decreases.
Table 3 shows the table of parameters of the optimal efficiency point of the pumping device under different vane angles. As can be seen from Table 3, the maximum efficiency of the pumping device under six different vane angles varies from 74.10% to 79.75%. When the vane angle is −4 degrees, the pumping device efficiency is the highest, 79.75%. When the blade angle is +4°, the pumping unit has the lowest efficiency of 74.10%. The optimum efficiency of the pumping unit is basically the same for blade angles of −6° and −4°, with a difference of only 0.19%. As the blade angle shifts from −4° to +4°, the maximum efficiency of the pumping unit gradually decreases.
4.2. Cavitation Characteristics
The cavitation test of the pumping device model was carried out using the energy method with a constant flow rate, and the cavitation margin of 1% reduction in pump efficiency was taken as the critical cavitation margin. The cavitation performance of the pumping device was tested at six different blade angles at three characteristic heads. Table 4 shows the critical cavitation margin of the pumping device under the characteristic head conditions at each blade placement angle. As can be seen from the table, the cavitation performance of the pump is optimal at the design net head working condition, and the critical cavitation margin of the pump is also the lowest at this time. When deviating from the design net head condition point, the critical cavitation margin is higher at both high and low head conditions.
As shown in Figure 8, under the condition that the blade angle is −4°, image acquisition was carried out for the cavitation in the pump when the efficiency decreased by 1% under different characteristic heads. Figure 8a–e show the cavitation at the position of impeller blade under the working conditions of head of 0.30 m, 0.89 m, 1.52 m, 1.92 m and 2.30 m respectively. It can be seen from the figure that under different characteristic head conditions, there is obvious cavitation at the outlet edge of the impeller blade. The bubble mass induced by cavitation is mainly attached to the pressure surface of the impeller blade.
4.3. Runaway Characteristics
When the pump stops suddenly due to the failure of the pump system, the pump will experience a countercurrent and enter the working condition of the turbine. When the reverse speed reaches the maximum value and continues to operate, the pump will be in the runaway state. The speed in this state is called the runaway speed or the runaway speed of the pump unit. For large- and medium-sized pumping stations, it is necessary to determine the runaway speed of the pump unit. Through the runaway speed, the strength of impeller parts can be determined to ensure the safety of the actual operation of the pump.
In order to test the runaway characteristics of the tubular pumping device, the runaway characteristic experiments were carried out under the three working conditions of blade angle −6°, −4°, and +4°. The model pump measured in the test reverses the working condition of the turbine and the output torque is 0. The runaway speed data of the device are shown in Table 5. The variation curve of runaway speed of the prototype pumping device with head is shown in Figure 9.
It can be seen from Table 4 that under the test angles of −6°, −4°, and +4°, the average unit runaway speeds N0 of the prototype pumping device are 232.1 r/min, 230.3 r/min, and 207.4 r/min, respectively. At the same blade angle, the runaway speed increases with the increase in head. The runaway speed of the prototype pump decreases with the increase in blade angle, and the runaway speed of the prototype pump is the largest when the blade angle is −6°. When the blade angle is −6°, the maximum runaway speed of the prototype pump corresponding to the maximum head is 232.1 r/min, equivalent to 1.72 times the rated speed. The runaway speed of the prototype pump corresponding to the design head is 192.1 r/min, equivalent to 1.42 times the rated speed.
4.4. Pressure Pulsation Characteristics
Since the pressure pulsation measuring points are located at the impeller inlet and guide vane outlet, and the pressure pulsation near the impeller and guide vane is mainly affected by the impeller rotation and the dynamic and static interference between the impeller guide vane, the pressure pulsation spectrum changes regularly at P1 and P2 measuring points, and no abnormal pulsation data appear. In order to further explore the changes in pressure pulsation at P1 and P2 measuring points under different blade angles, the peak-to-peak values corresponding to 97% confidence were compared and analyzed, as shown in Figure 10.
As shown in Figure 10, the peak-to-peak values of pressure pulsation at the impeller inlet and guide vane outlet are the smallest under the condition that the blade angle is −4°. With the change in head, the peak-to-peak values are basically the smallest under the design head condition, and the peak-to-peak values show an increasing trend after deviating from the design head. This is mainly because under the design head condition, the internal flow pattern of the pump is better, and after deviating from the design head, the inflow angle of the water worsens, and the internal flow pattern of the pump becomes disordered.
5. Conclusions
- (1)
- When the blade angle of the vertical shaft tubular pumping device is −4°, the maximum efficiency of the model pumping device can reach 79.75%. The head condition of a −4° blade angle is the largest covered by the high efficiency area. We suggest that the −4° blade angle is selected as the actual operation angle of the pumping device.
- (2)
- The cavitation test results show that when the blade placement angle of the prototype pumping device is −4°, the critical cavitation allowance within the operating condition range of 0–2.22 m head is within 5.0 m. When the head is 1.52 m, the critical cavitation allowance is 3.2 m. When the head is 2.22 m, the critical cavitation allowance is 3.5 m.
- (3)
- The runaway speed of the pumping device decreases with the increase in blade angle. The smaller the blade placement angle, the higher the unit runaway speed. When the blade angle is −6°, the maximum head is less than 2.22 m. At this time, the maximum runaway speed of the prototype pump is less than 1.72 times the rated speed of the device. When the backflow occurs, the pump station unit can operate safely. The runaway speed at the same blade angle increases with the increase in head.
- (4)
- The vertical shaft tubular pumping device has high efficiency, good cavitation and runaway characteristics, and the variation law of pressure pulsation without abnormal pulsation. Therefore, we suggest giving priority to its application in the low-head pumping station of the Yangtze River.
Author Contributions
Data curation, L.C. and W.J.; Formal analysis, K.C. and B.Z.; Methodology, S.L. and T.S.; Writing—original draft, K.C. and W.J.; Writing—review and editing, L.C., K.C. and W.J.; Supervision, L.C. All authors have read and agreed to the published version of the manuscript.
Funding
This research was funded by the National Natural Science Foundation of China (grant no. 51779214), A Project Funded by the Priority Academic Program Development of Jiangsu Higher Education Institutions (PAPD), the Key Project of Water Conservancy in Jiangsu Province (grant no. 2020030 and 2020027), and the Jiangsu Province South-North Water Transfer Technology Research and Development Project (SSY-JS-2020-F-45).
Acknowledgments
The authors are grateful for the financial support from the National Natural Science Foundation of China (grant no. 51779214), A Project Funded by the Priority Academic Program Development of Jiangsu Higher Education Institutions (PAPD), the Key Project of Water Conservancy in Jiangsu Province (grant no. 2020030 and 2020027), and the Jiangsu Province South-North Water Transfer Technology Research and Development Project (SSY-JS-2020-F-45).
Conflicts of Interest
The authors declare no conflict of interest.
References
- Feng, X.; Qiu, B. Adjusting Frequency of Pump Blade Angles and Optimal Operation for Large Pumping Station System. Adv. Mech. Eng. 2013, 5, 317517. [Google Scholar] [CrossRef]
- Cheng, L. Numerical Simulation for Flow Pattern and Hydraulic Performance of Pumping Station. Ph.D. Thesis, Hohai University, Nanjing, China, 2006. [Google Scholar]
- Lu, L.G.; Chen, J.; Liang, J.D.; Leng, Y. Optimal hydraulic design of bulb tubular pump system. J. Hydraul. Eng. 2008, 39, 355–360. [Google Scholar]
- Kan, K.; Chen, H.; Yuan, Z.; Zhou, D.; Binama, M.; Dai, J. Transient characteristics during power-off process in a shaft extension tubular pump by using a suitable numerical model. Renew. Energy 2021, 164, 109–121. [Google Scholar] [CrossRef]
- Shi, W.; Liu, J.; Lu, L.G.; Xu, L.; Zhou, X.; Sun, S. Hydraulic design standardization for inlet and outlet conduit of tubular pump system with front-positioned shaft. South-to-North Water Transf. Water Sci. Technol. 2020, 18, 115–122. [Google Scholar]
- Liu, J.; Zheng, Y.; Zhou, D.; Mao, Y. Analysis of basic flow pattern in shaft front-positioned and shaft rear-positioned tubular pump systems. Trans. Chin. Soc. Agric. Mach. 2010, 41, 32–38. [Google Scholar]
- Zhang, R.T.; Zhu, H.G.; Yao, L.B. Comparison of shaft-type tubular pump systems with different outflow structures. J. Hydroelectr. Eng. 2014, 33, 198–201. [Google Scholar]
- Zhou, J.; Zhao, M.; Wang, C.; Gao, Z. Optimal design of diversion piers of lateral intake pumping station based on orthogonal test. Shock Vib. 2021, 2021, 6616456. [Google Scholar] [CrossRef]
- Zhang, W.; Shi, L.; Tang, F.; Duan, X.; Liu, H.; Sun, Z. Analysis of inlet flow passage conditions and their influence on the performance of an axial-flow pump. Proc. Inst. Mech. Eng. Part A J. Power Energy 2021, 235, 733–746. [Google Scholar] [CrossRef]
- Jiao, W.; Cheng, L.; Zhang, D.; Zhang, B.; Su, Y. Investigation of Key Parameters for Hydraulic Optimization of an Inlet Duct Based on a Whole Waterjet Propulsion Pump System. Trans. FAMENA 2021, 45, 145–162. [Google Scholar] [CrossRef]
- Gao, X.; Tian, Y.; Sun, B. Multi-objective optimization design of bidirectional flow passage components using RSM and NSGA II: A case study of inlet/outlet diffusion segment in pumped storage power station. Renew. Energy 2018, 115, 999–1013. [Google Scholar] [CrossRef]
- Shi, L.; Yuan, Y.; Jiao, H.; Tang, F.; Cheng, L.; Yang, F.; Jin, Y.; Zhu, Y. Numerical investigation and experiment on pressure pulsation characteristics in a full tubular pump. Renew. Energy 2021, 163, 987–1000. [Google Scholar] [CrossRef]
- Zhao, W.; Zhang, J.; Yu, X.; Zhou, D.; Calamak, M. Multi-objective optimization of a tubular pump to improve the applicable operating head and hydraulic performance. Proc. Inst. Mech. Eng. Part C J. Mech. Eng. Sci. 2021, 235, 1555–1566. [Google Scholar] [CrossRef]
- Zhu, H.; Zhang, R. Numerical Simulation of Internal Flow and Performance Prediction of Tubular Pump with Adjustable Guide Vanes. Adv. Mech. Eng. 2014, 6, 171504. [Google Scholar] [CrossRef]
- Zhou, C.F.; Zhang, J.B.; Jiao, W.X.; Cheng, L.; Jiang, H.Y. Numerical simulation of influence of shaft on performance of low head tubular pumping system. J. Drain. Irrig. Mach. Eng. 2021, 39, 231–237. [Google Scholar]
- Jin, K.L.; Chen, Y.; Tang, F.P.; Shi, L.; Liu, H.; Zhang, W. Influence of shaft location on hydraulic characteristics of bidirectional tubular pump systems. J. Hydroelectr. Eng. 2021, 40, 67–77. [Google Scholar]
- Shi, L.; Zhang, W.; Jiao, H.; Tang, F.; Wang, L.; Sun, D.; Shi, W. Numerical simulation and experimental study on the comparison of the hydraulic characteristics of an axial-flow pump and a full tubular pump. Renew. Energy 2020, 153, 1455–1464. [Google Scholar] [CrossRef]
- Fang, G.; Guo, H.; Hu, D.; Shi, J.; Zhang, Y.; Kan, K.; Yang, J. Pressure pulsation and shaft modal optimization of a large shaft tubular pump. South-to-North Water Transf. Water Sci. Technol. 2021, 19, 822–832. [Google Scholar]
- Zhang, D.; Jiao, W.; Cheng, L.; Xia, C.; Zhang, B.; Luo, C.; Wang, C. Experimental study on the evolution process of the roof-attached vortex of the closed sump. Renew. Energy 2021, 164, 1029–1038. [Google Scholar] [CrossRef]
Figure 1.
The front shaft tubular pumping device.
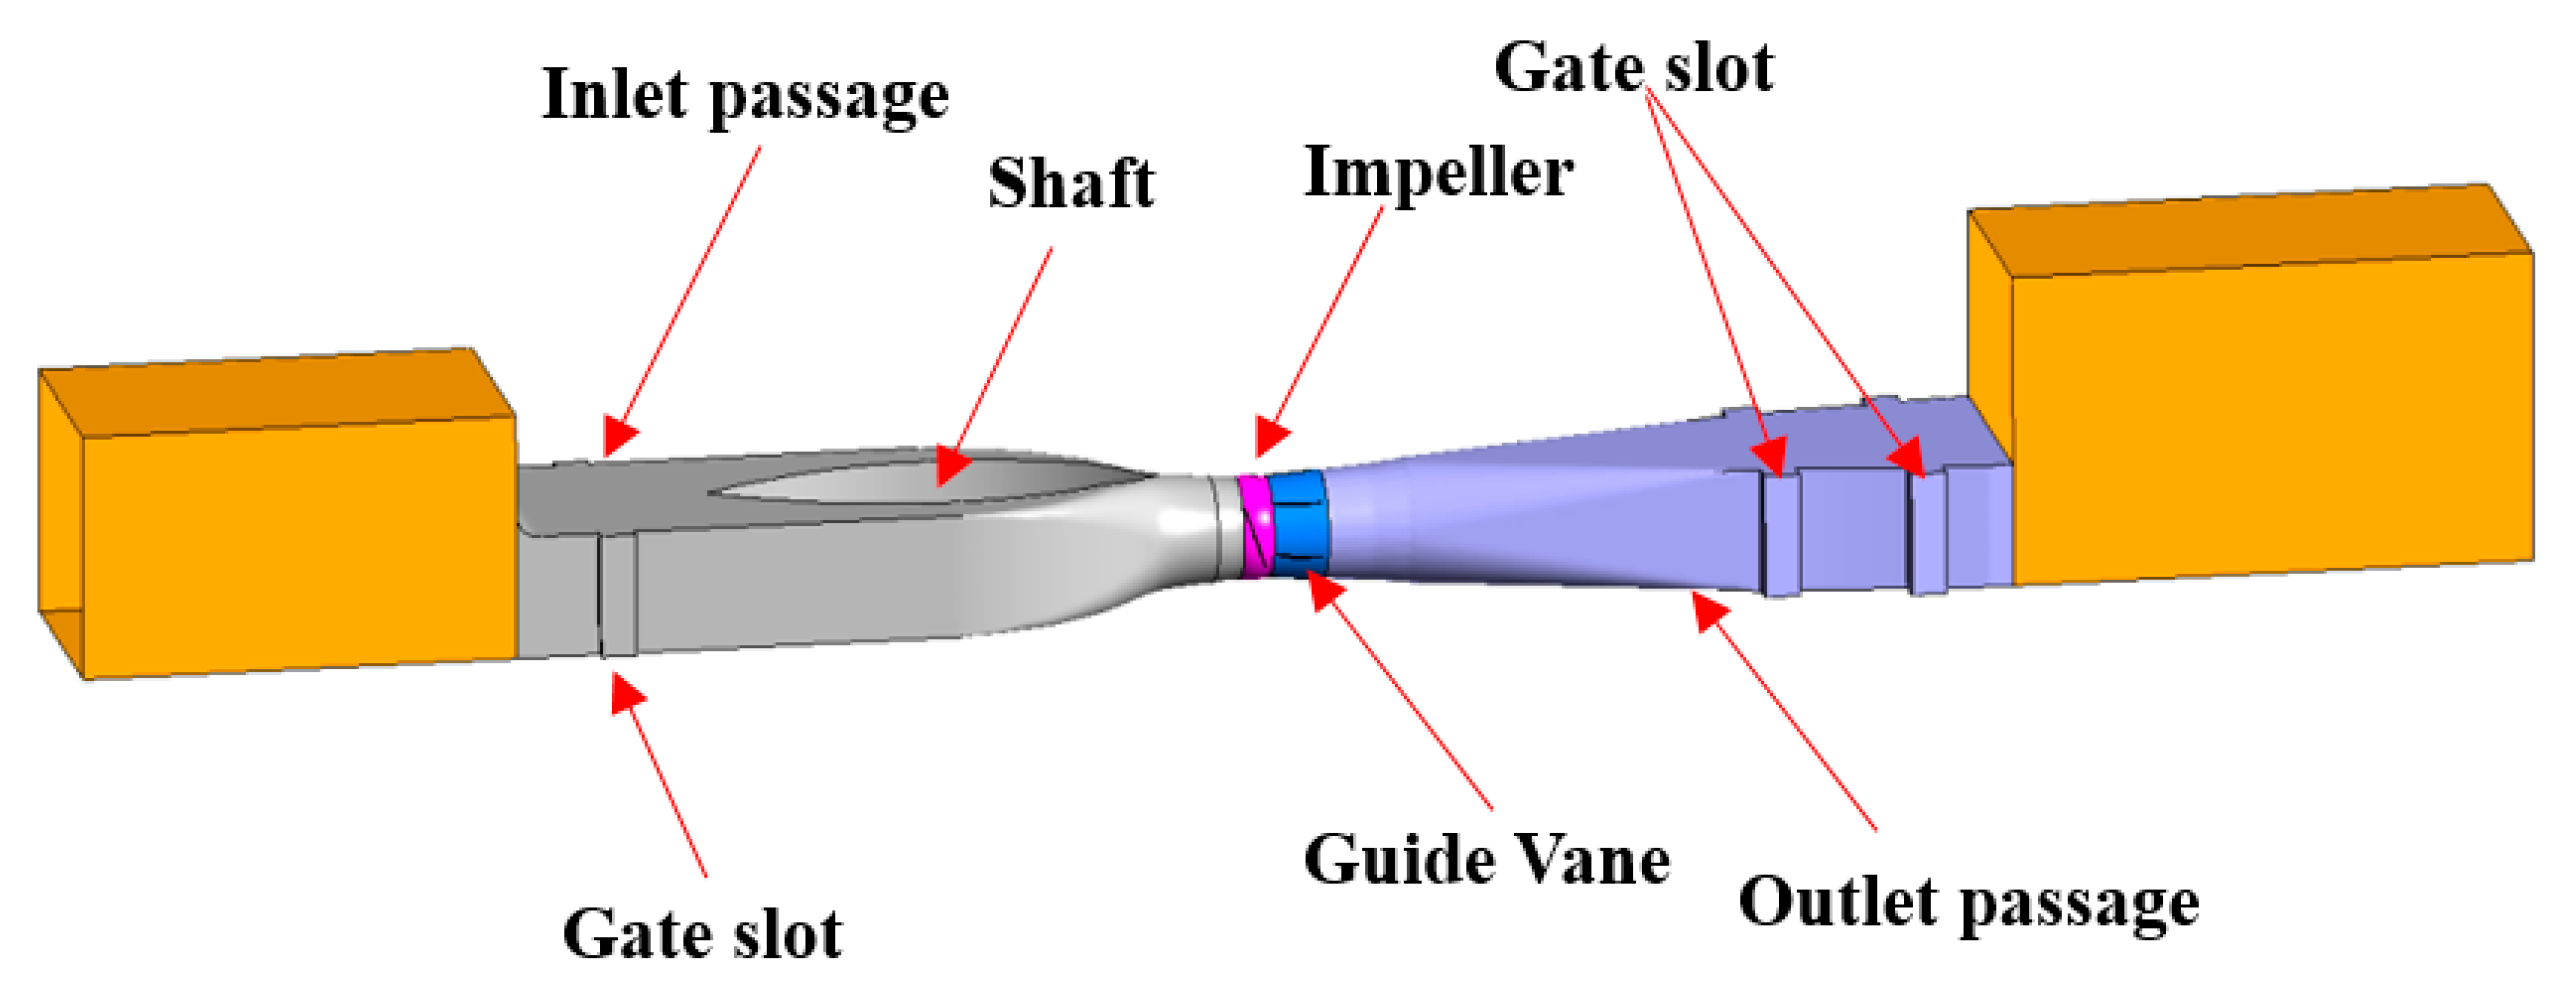
Figure 2.
The vertical shaft tubular pumping device model. (a) Longitudinal section; (b) Horizontal section.
Figure 2.
The vertical shaft tubular pumping device model. (a) Longitudinal section; (b) Horizontal section.
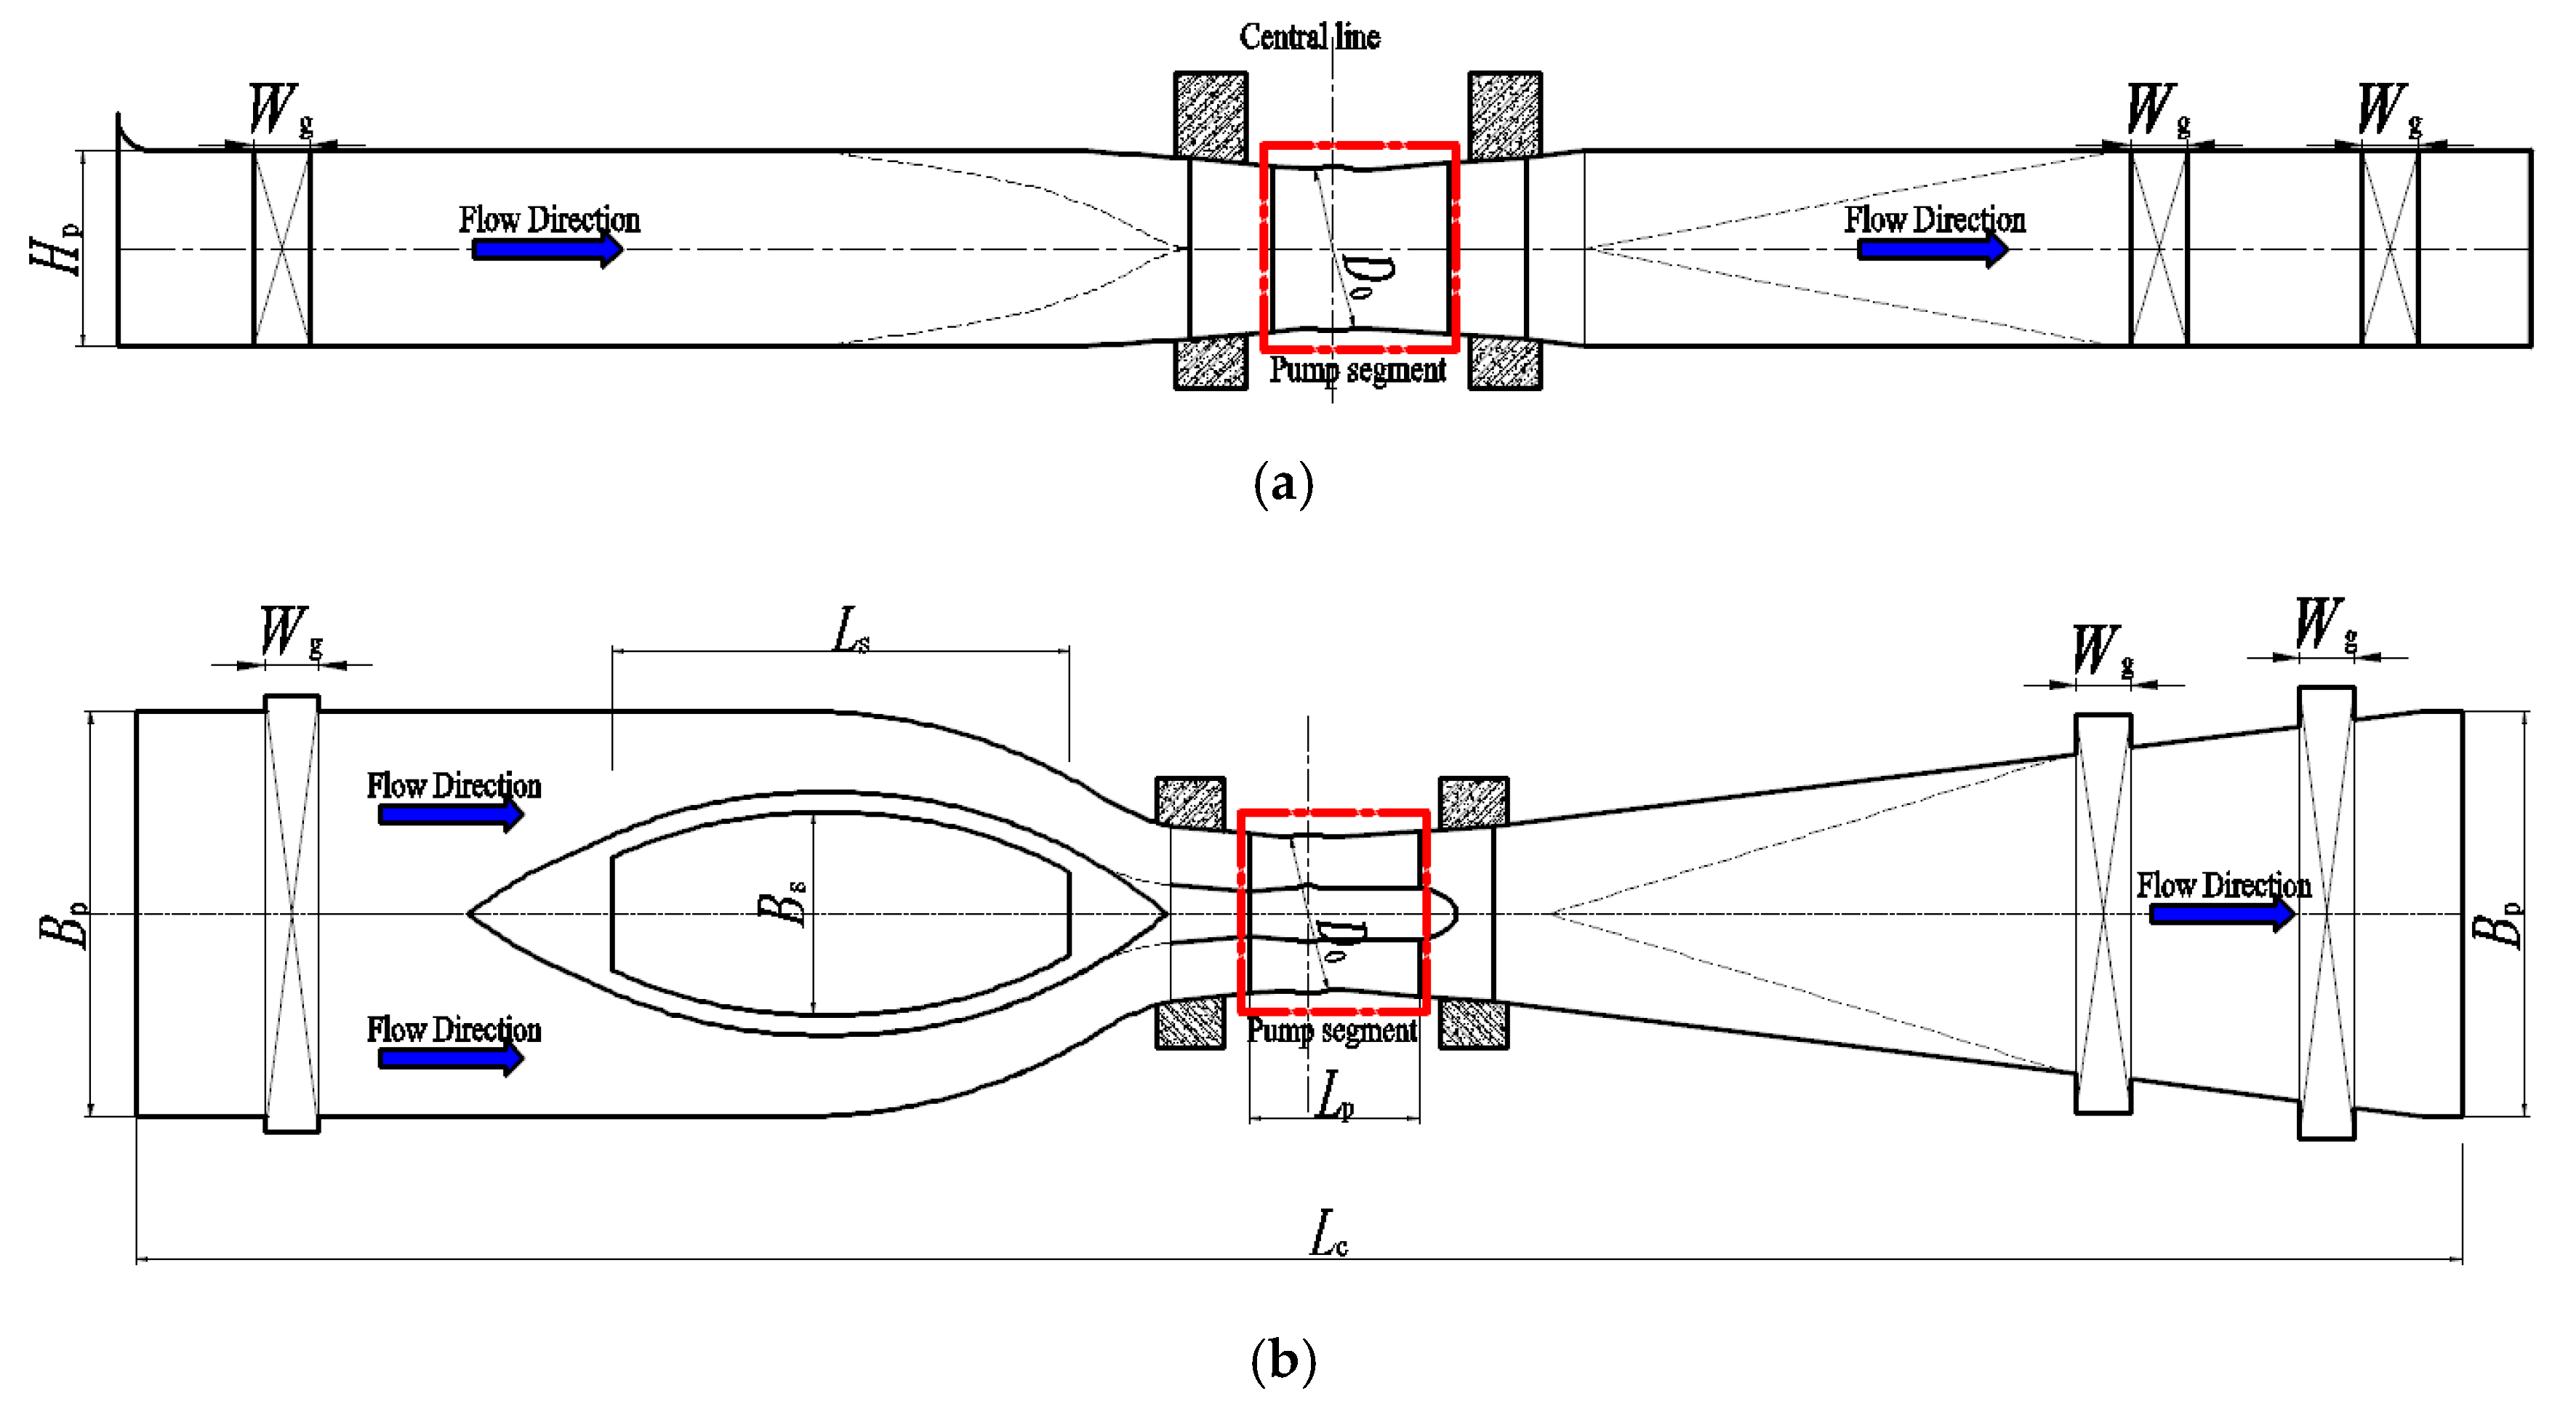
Figure 3.
Pump and pumping device.

Figure 4.
High-precision hydraulic machinery test bench. (1) Inlet tank. (2) Tested pumping device and drive motor. (3) Pressure outlet tank. (4) Bifurcated water tank. (5–6) Flow in situ calibration device. (7) Condition regulating valve. (8) Pressure stabilizing rectifier cylinder. (9) Electromagnetic flowmeter. (10) Forward and reverse operation control gate valve. (11) Auxiliary pumping device.

Figure 5.
Pressure measuring section.
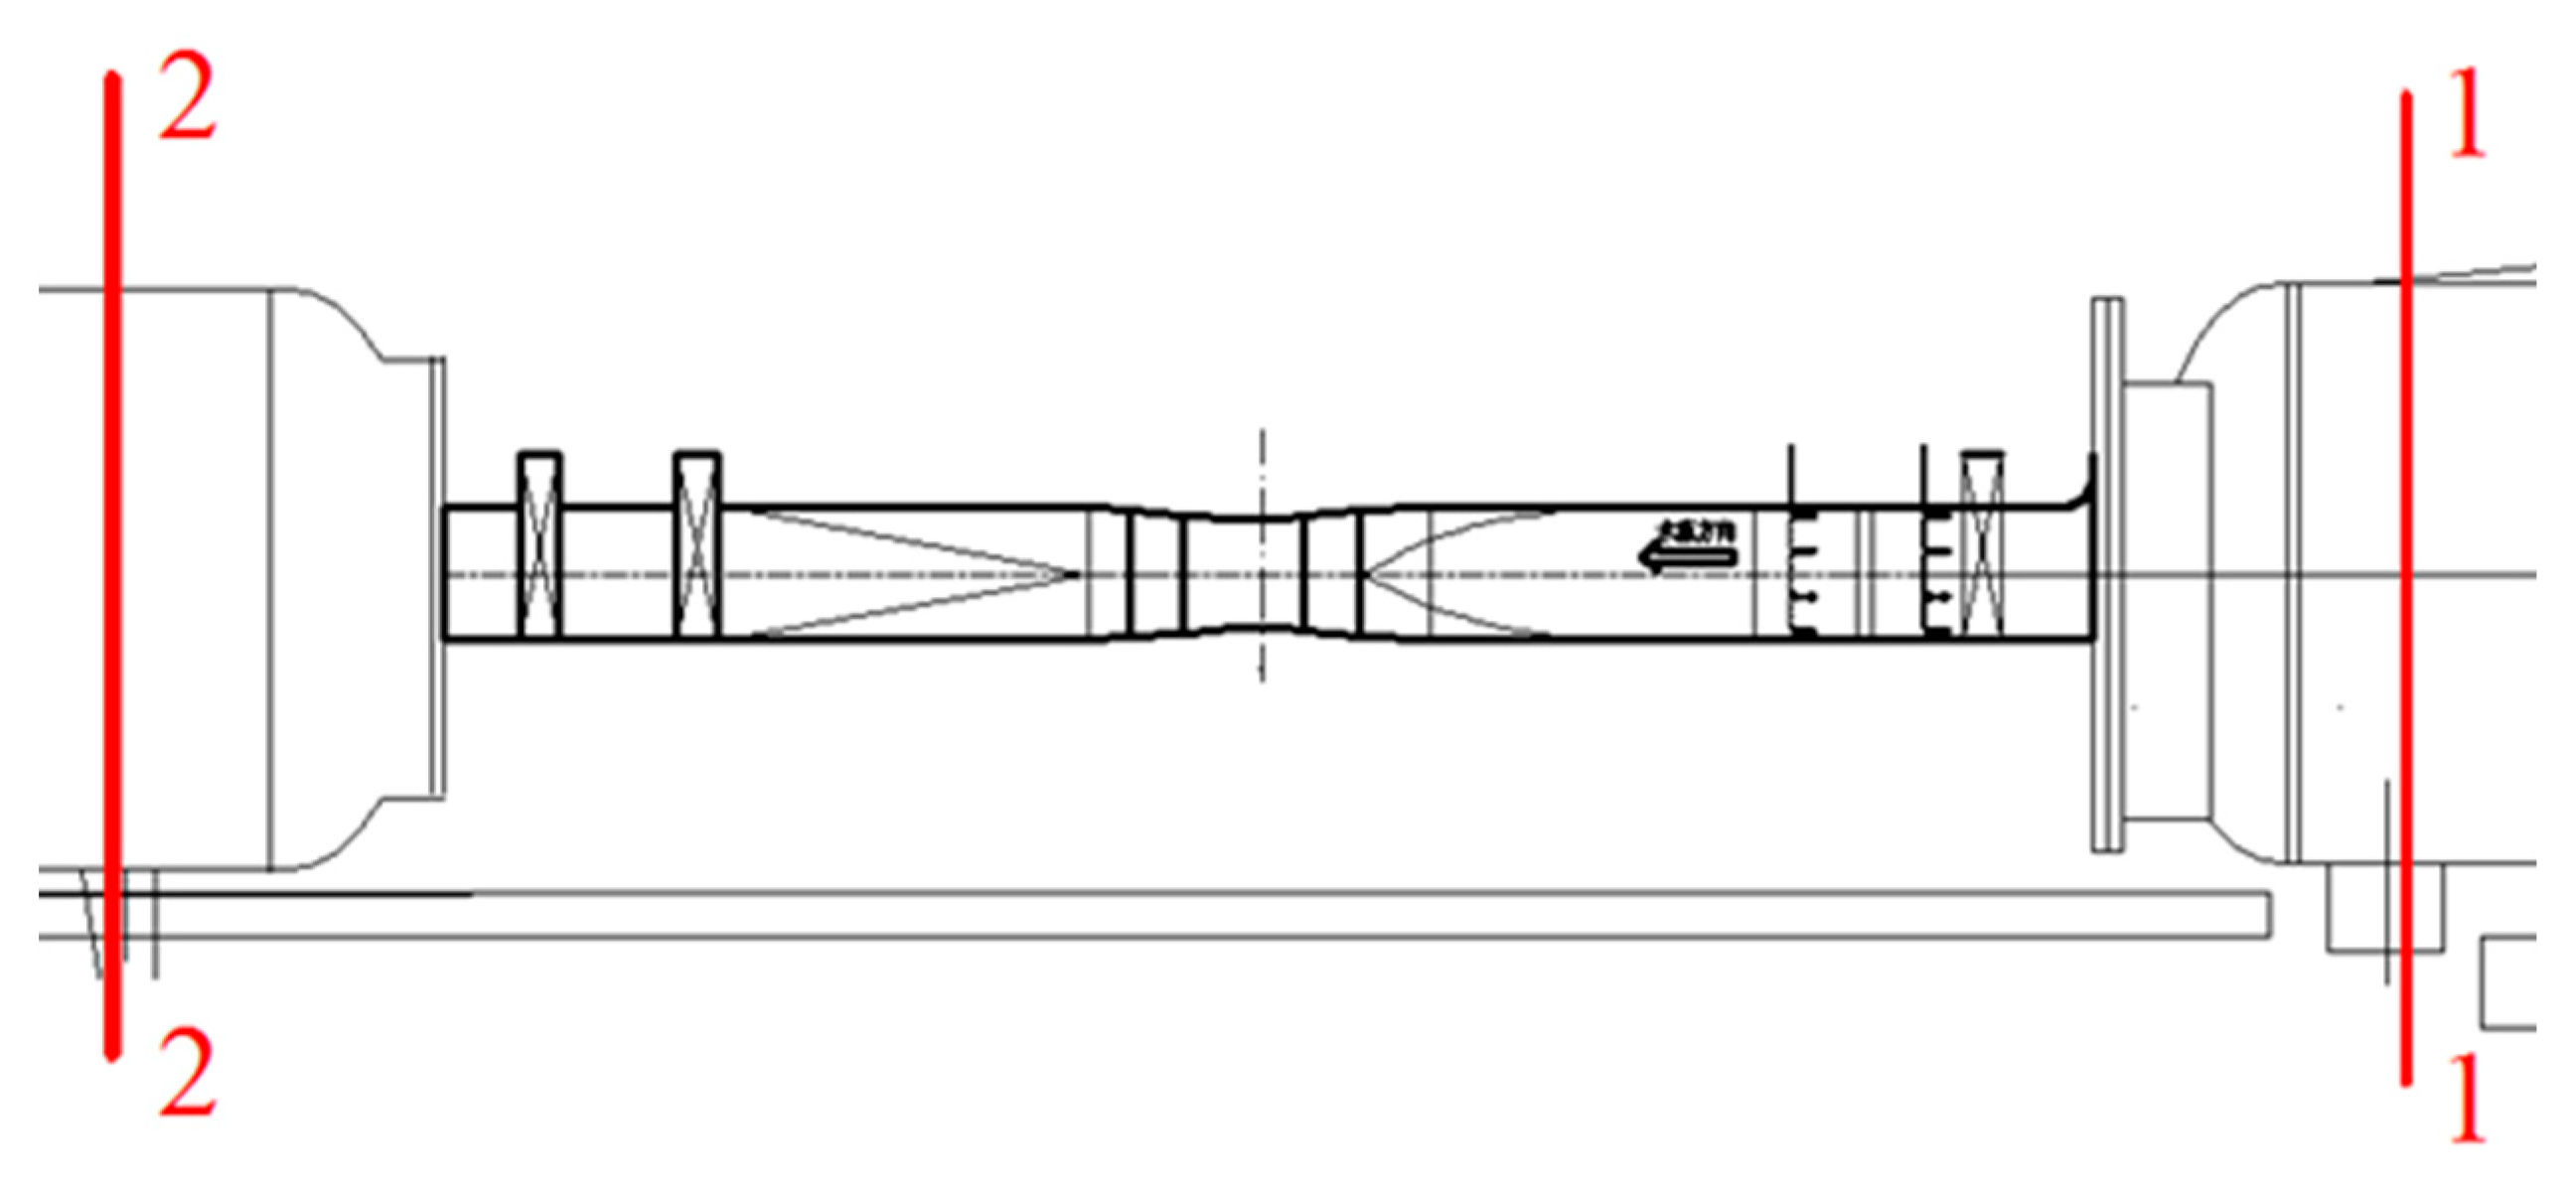
Figure 6.
Installation position of pressure pulsation sensors.
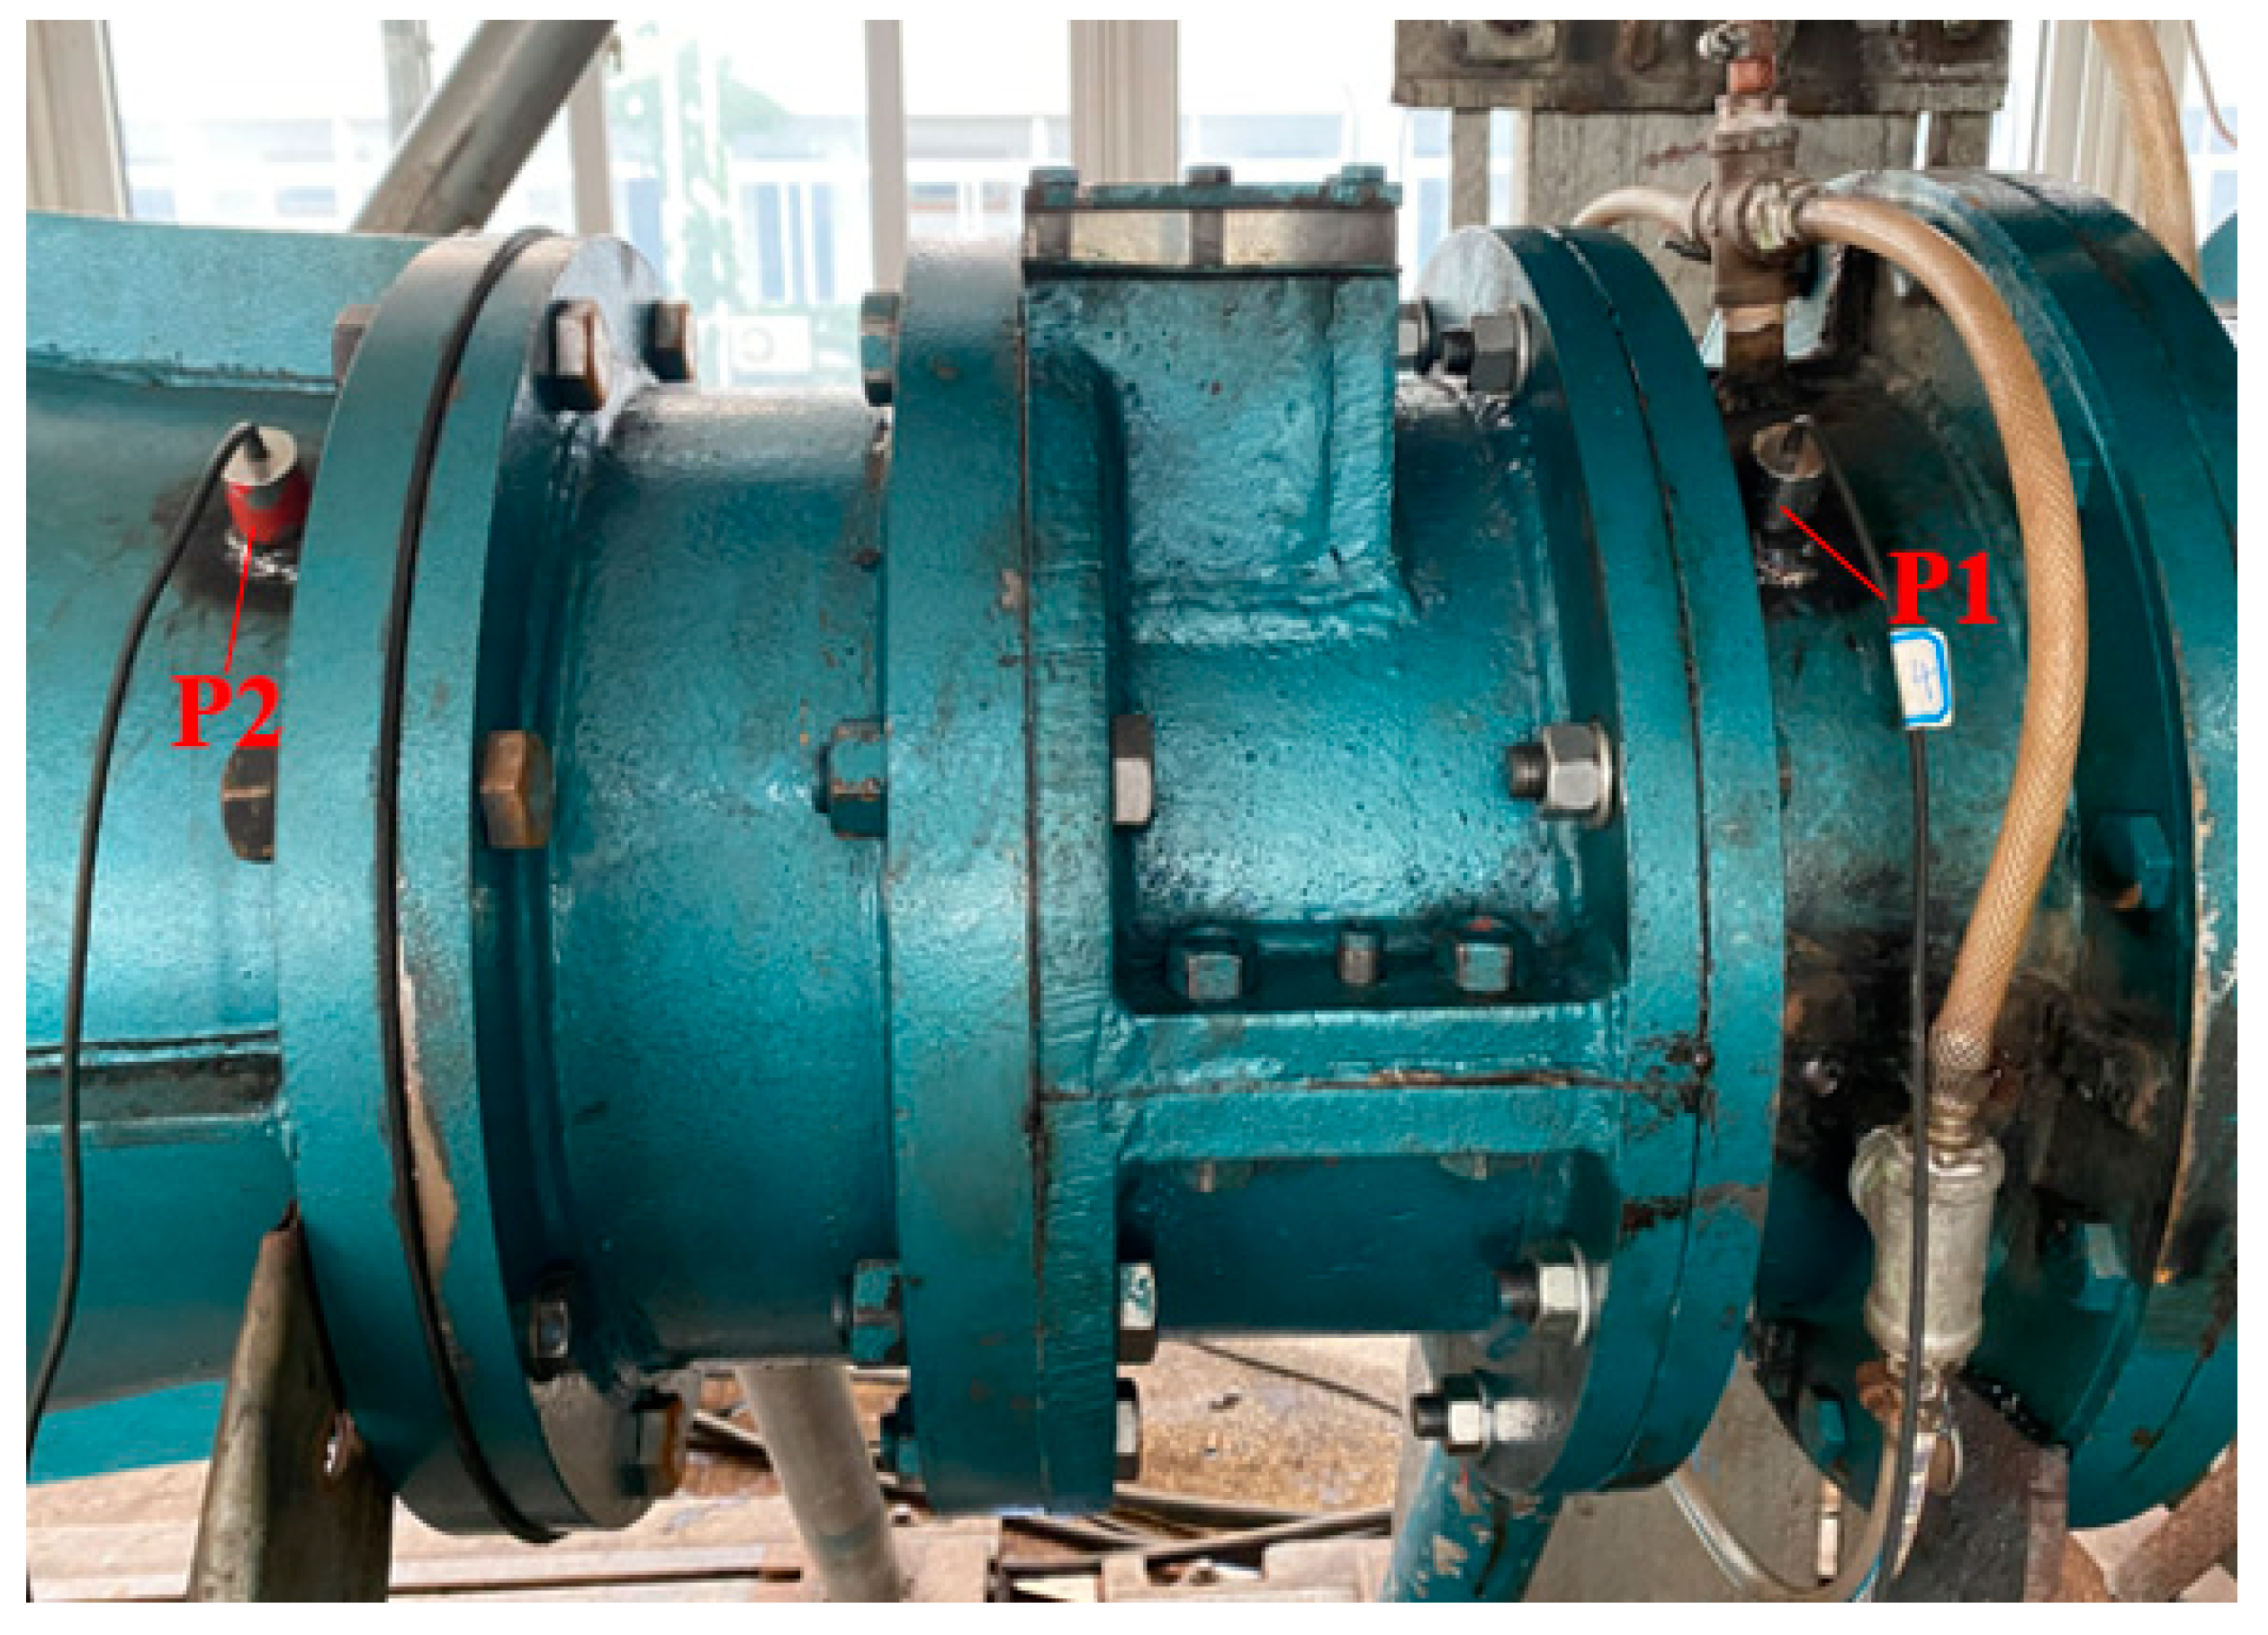
Figure 7.
Comprehensive characteristic curve of the pump under different blade angles.

Figure 8.
Cavitation diagram under five characteristic heads (−4°).
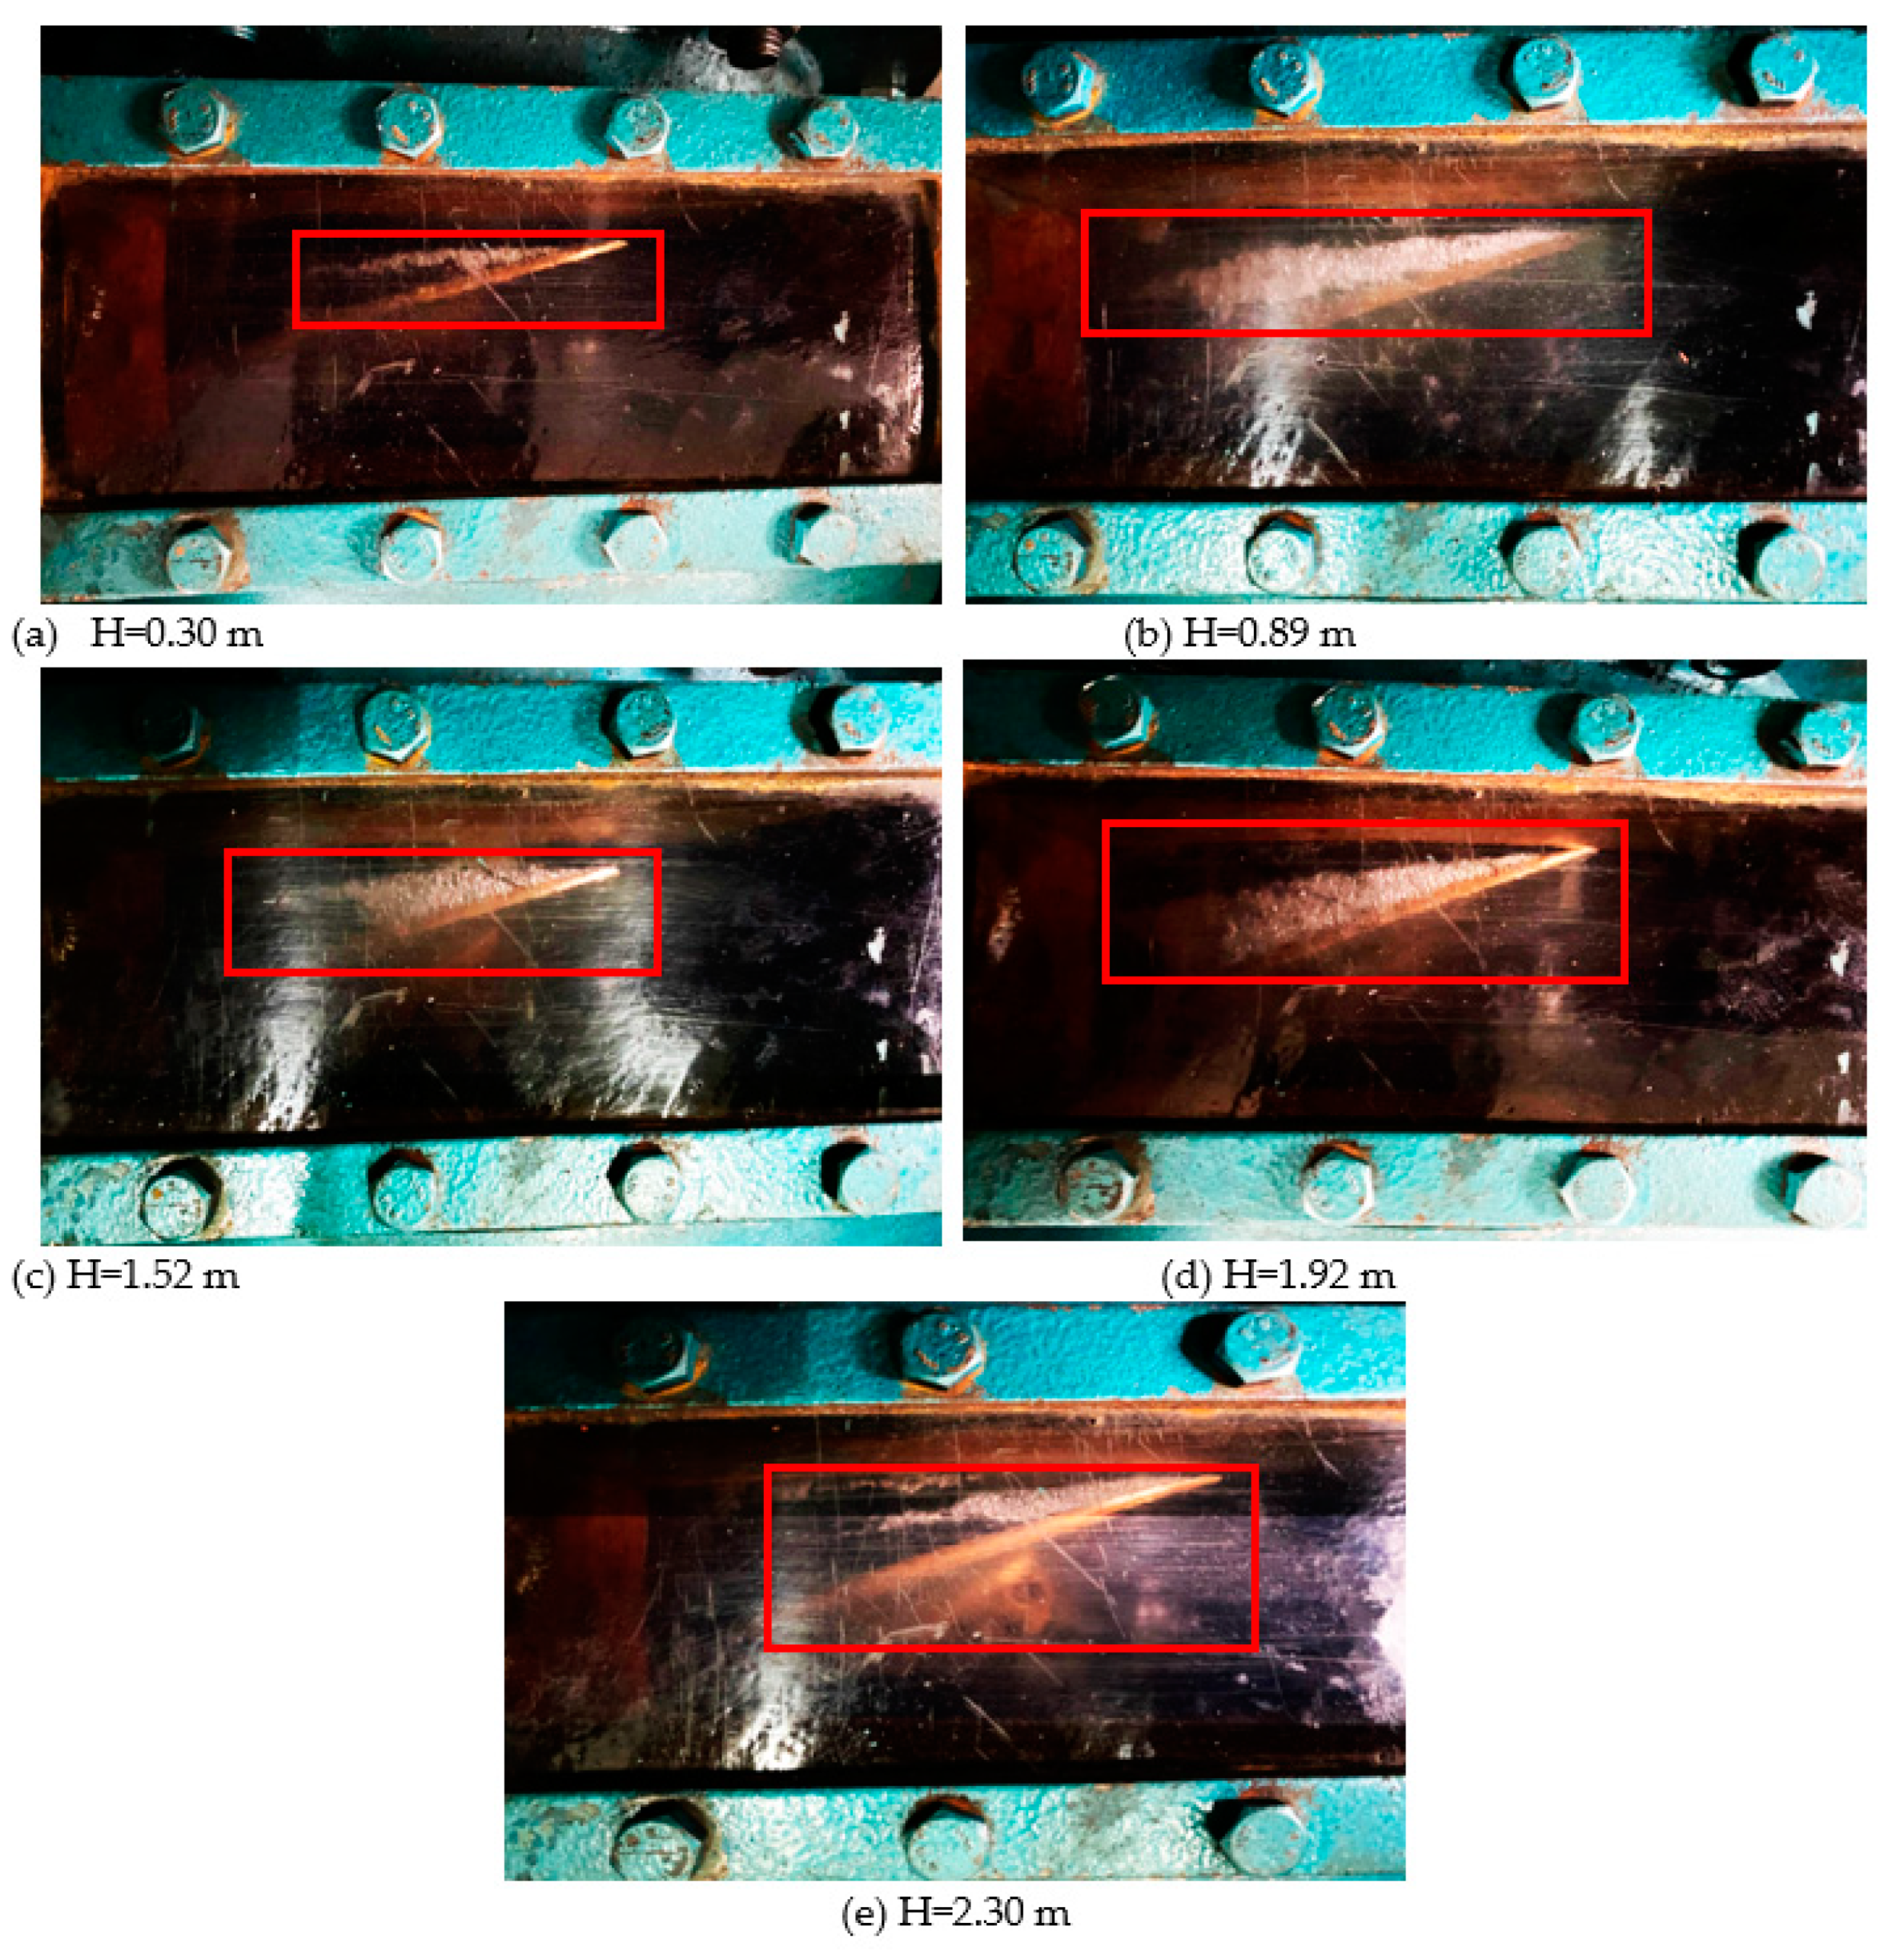
Figure 9.
Runaway characteristic curve of the prototype pumping device.
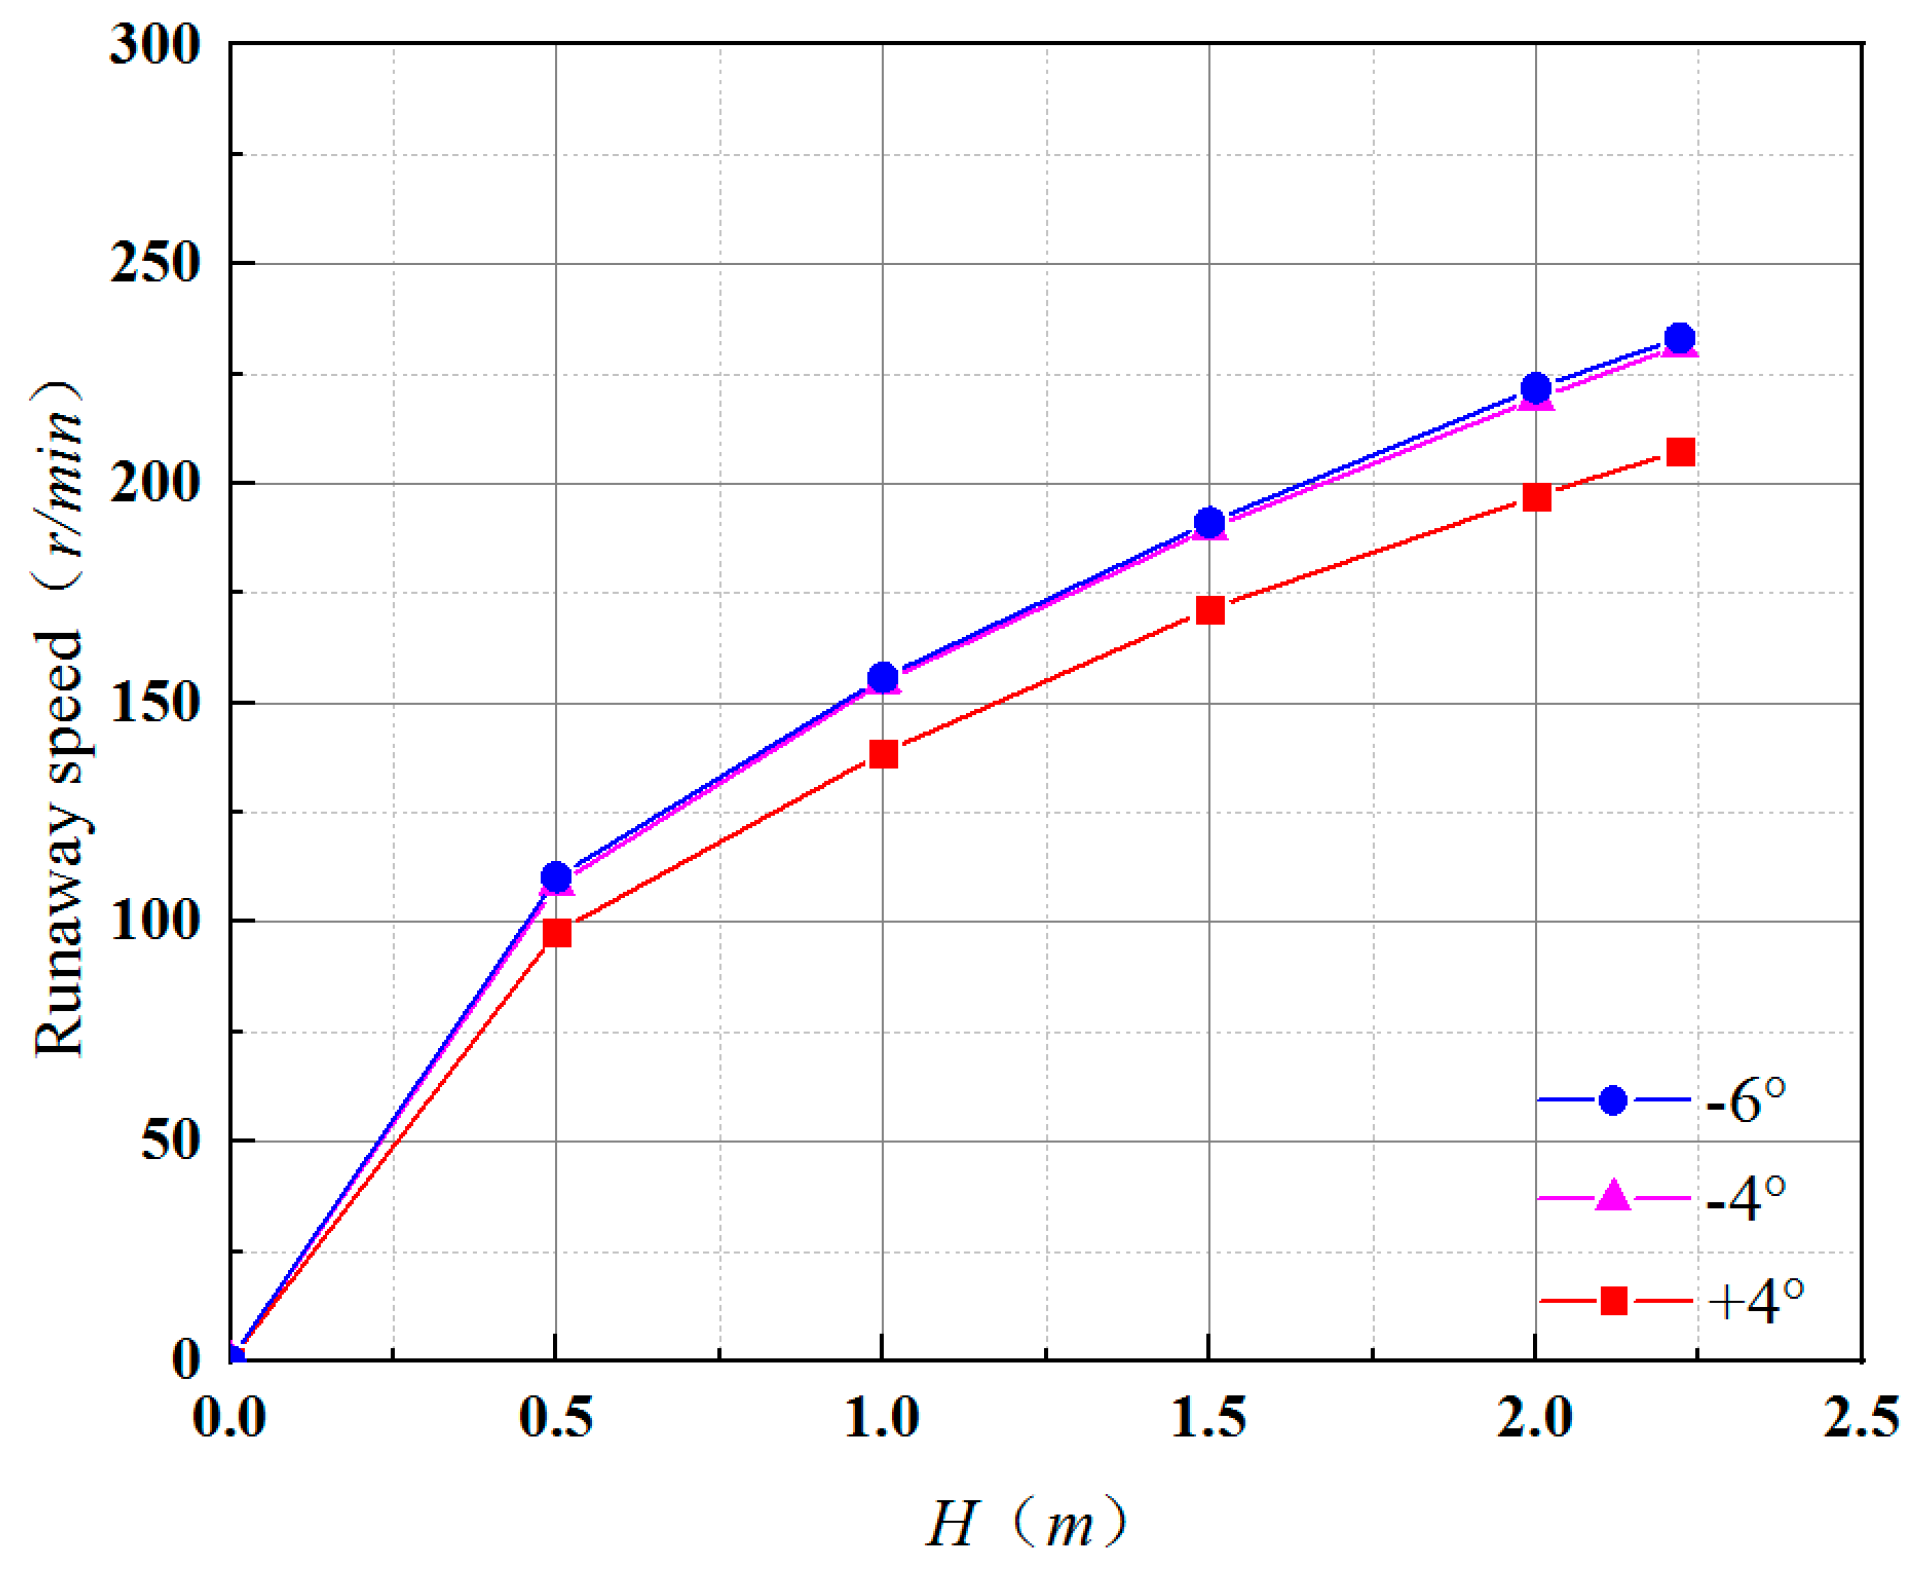
Figure 10.
Comparison of peak-to-peak values of pressure pulsation at different blade angles. (a) Impeller inlet; (b) Guide vane outlet.
Figure 10.
Comparison of peak-to-peak values of pressure pulsation at different blade angles. (a) Impeller inlet; (b) Guide vane outlet.


Table 1.
Basic geometric parameters of the pumping device.
| Geometric Parameter | Value | Geometric Parameter | Value |
|---|---|---|---|
| Length of the shaft Ls (mm) | 6800 | Width of the shaft Bs (mm) | 3000 |
| Number of impeller blades Z1 | 3 | Number of guide vane blades Z2 | 6 |
| Diameter of the impeller D0 (mm) | 2350 | Length of the pump segment Lp (mm) | 2522 |
| Length of the pumping device Lc (mm) | 34,500 | Width of the pumping device Bp (mm) | 6000 |
| Height of the pumping device Hp (mm) | 2800 | Width of the gate Wg (mm) | 810 |
Table 2.
Basic geometric parameters of the pumping device.
| Measurement Items | Measuring Instruments and Equipment | Model | Range | Calibration Accuracy |
|---|---|---|---|---|
| Head | Differential pressure transmitter | EJA110A | 0–200 kPa | ±0.1% |
| Flow rate | Electromagnetic flowmeter | E-mag | DN400 mm | ±0.2% |
| Torque and speed | Speed and torque sensor | ZJ | 100 N·m | ±0.15% |
| NPSH | Absolute pressure transmitter | EJA310A | 0–130 kPa | ±0.020% |
Table 3.
Optimal efficiency point parameters of the pump under different blade angles.
| Blade Angle (°) | Flowrate (L/s) | Head (m) | Shaft Power (kW) | Efficiency (%) |
|---|---|---|---|---|
| −6° | 177.25 | 2.29 | 4.993 | 79.56 |
| −4° | 190.07 | 2.52 | 5.864 | 79.75 |
| −2° | 195.64 | 2.78 | 6.962 | 76.76 |
| 0° | 211.16 | 2.89 | 7.826 | 76.36 |
| +2° | 218.40 | 3.12 | 8.779 | 76.20 |
| +4° | 265.92 | 2.47 | 8.682 | 74.10 |
Table 4.
Pumping device prototype design of net head and maximum net head critical cavitation allowance.
Table 4.
Pumping device prototype design of net head and maximum net head critical cavitation allowance.
| Blade Angle (°) | Low Head NPSHa(m) | Designed Head NPSHa (m) | High Head NPSHa (m) |
|---|---|---|---|
| −6 | 4.035 | 3.925 | 4.078 |
| −4 | 4.392 | 3.152 | 3.512 |
| −2 | 4.227 | 3.813 | 3.838 |
| 0 | 4.545 | 3.509 | 3.618 |
| +2 | 4.292 | 3.866 | 4.092 |
| +4 | 4.427 | 4.035 | 4.807 |
Table 5.
Runaway speed data of the prototype pump under different blade placement angles (Hmax = 2.22 m).
Table 5.
Runaway speed data of the prototype pump under different blade placement angles (Hmax = 2.22 m).
| Blade Angle (°) | Model Unit Runaway Speed (r/min) | Prototype Unit Runaway Speed (r/min) | Ratio of Prototype Unit Runaway Speed to Motor Rated Speed |
|---|---|---|---|
| −6 | 366.1 | 232.1 | 1.72 |
| −4 | 363.3 | 230.3 | 1.70 |
| +4 | 327.1 | 207.4 | 1.54 |
Publisher’s Note: MDPI stays neutral with regard to jurisdictional claims in published maps and institutional affiliations. |
© 2022 by the authors. Licensee MDPI, Basel, Switzerland. This article is an open access article distributed under the terms and conditions of the Creative Commons Attribution (CC BY) license (https://creativecommons.org/licenses/by/4.0/).
Share and Cite
MDPI and ACS Style
Cheng, K.; Li, S.; Cheng, L.; Sun, T.; Zhang, B.; Jiao, W. Experiment on Influence of Blade Angle on Hydraulic Characteristics of the Shaft Tubular Pumping Device. Processes 2022, 10, 590. https://doi.org/10.3390/pr10030590
AMA Style
Cheng K, Li S, Cheng L, Sun T, Zhang B, Jiao W. Experiment on Influence of Blade Angle on Hydraulic Characteristics of the Shaft Tubular Pumping Device. Processes. 2022; 10(3):590. https://doi.org/10.3390/pr10030590
Chicago/Turabian StyleCheng, Kaihua, Songbai Li, Li Cheng, Tao Sun, Bowen Zhang, and Weixuan Jiao. 2022. "Experiment on Influence of Blade Angle on Hydraulic Characteristics of the Shaft Tubular Pumping Device" Processes 10, no. 3: 590. https://doi.org/10.3390/pr10030590
Note that from the first issue of 2016, this journal uses article numbers instead of page numbers. See further details here.