Abstract
Aiming at the shortcomings of the beetle swarm algorithm, namely its low accuracy, easy fall into local optima, and slow convergence speed, a rebellious growth personality–beetle swarm optimization (RGP–BSO) model based on rebellious growth personality is proposed. Firstly, the growth and rebellious characters were added to the beetle swarm optimization algorithm to dynamically adjust the beetle’s judgment of the optimal position. Secondly, the adaptive iterative selection strategy is introduced to balance the beetles’ global search and local search capabilities, preventing the algorithm from falling into a locally optimal solution. Finally, two dynamic factors are introduced to promote the maturity of the character and further improve the algorithm’s optimization ability and convergence accuracy. The twelve standard test function simulation experiments show that RGP–BSO has a faster convergence speed and higher accuracy than other optimization algorithms. In the practical problem of PM2.5 concentration prediction, the ELM model optimized by RGP–BSO has more prominent accuracy and stability and has obvious advantages.
1. Introduction
Optimization plays a crucial role in the efficient operation of almost all real-world systems [1]. The core basis of the optimization process is to achieve trade-offs between multiple conflicting criteria for a given decision problem, with the primary purpose of minimizing computational effort to determine feasible trade-off points [2]. Wolpert, in 1997, proposed the theory that there is no free lunch, i.e., there cannot be one algorithm that will be most efficient for every problem to be solved [3]. Therefore, various optimization algorithms have been proposed and applied in different research fields in the past ten years.
Optimization algorithms mainly include two categories: gradient-based methods and metaheuristics. For continuous and linear problems, gradient-based methods can be used. For example, Zhadan uses the original dual Newton method to consider the linear semidefinite programming problem [4]; Vijayalakshmi used stochastic gradient descent to optimize the ANN model to predict the energy capacity ACs [5]. For more complex issues, metaheuristics are favored for their stability, flexibility, and better ability to jump out of local optima [6], such as the seagull optimization algorithm [7], particle swarm optimization algorithm [8], gray wolf optimization algorithm [9], and whale optimization algorithm [10].
Because of the great potential of metaheuristics in solving complex problems, Jiang developed an optimization algorithm called beetle antennae search (BAS). The algorithm was inspired by the beetle experiment at Cornell University [11]. The long beetle senses the difference in the smell of things according to the antennae’s fibers, draws the odor intensity map of the surrounding environment, and finds the direction of the odor according to the map [12]. Its most significant advantage is that the complexity involved is low, and the number of individuals is only one, which can solve the problem in a shorter time. However, the iterative result of the BAS algorithm is very dependent on the initial position of the beetle, and the number of individuals is only one, resulting in low efficiency and effectiveness of the optimization. Inspired by the swarm algorithm, Wang improved the BAS algorithm and expanded the individual into a swarm to become the beetle swarm optimization (BSO) algorithm [13]. Although the BSO algorithm solves the problem of low optimization effectiveness of the BAS algorithm, there are still problems of local optima and poor population diversity in iterations [14].
This paper proposes a beetle swarm optimization algorithm based on rebellious growth personality (RGP–BSO). First, we increase the rebellious character to improve the global search ability of the beetle herd and increase the growth character to enhance the power of the beetle herd to converge to the optimal value. Secondly, the ability of global search and local search of beetles is balanced through a personality selection strategy. Finally, two dynamic factors are introduced to promote the maturity of the character and further improve the convergence ability and accuracy of the algorithm. Using twelve benchmark functions to conduct simulation experiments, the algorithm of RGP–BSO has an extensive performance advantage compared with other optimization algorithms. The model’s performance is evaluated using MAPE, RMSE, and MAE in a practical problem of PM2.5 concentration prediction to explore the effectiveness of the RGP–BSO optimization algorithm on PM2.5 concentration prediction. The ELM model optimized by RGP–BSO has outstanding accuracy and stability with apparent advantages. With appropriate computational resources, high-quality solutions can be obtained, providing theoretical and methodological support for human travel patterns, governmental decision making, etc., and providing data support for the RGP–BSO optimization algorithm to perform better in practical applications.
2. Beetle Swarm Optimization Algorithm
The beetle swarm algorithm is inspired by the particle swarm algorithm and improved by the beetle search algorithm. The updated formula of the beetle swarm algorithm is [13]:
In the formula: is the th beetle, is the number of iterations, and is the position of the th beetle in the th iteration. is the velocity of the th beetle at the th iteration. is the increase in the moving position of the th beetle at the th iteration, constant [0, 1]. The speed update formula of the beetle swarm follows the speed update formula of the particle swarm optimization algorithm. The update of the position of the beetle is based on the search algorithm of the beetle, and the procedure is as follows:
In the formula: and are two positive numbers. and are two random numbers in the range [0,1]. is the adaptive inertia weight. is the best position experienced by the th beetle after iterations. is the global best position of the beetle herd at the th iteration. is the step size of the beetle at the th iteration. is a symbolic function that determines whether the search direction after the beetle is the left whisker or the right whisker. is the fitness function, i.e., the solution of the solution function at the position of . and are the positions of the right and left whiskers of the beetle, respectively. is the random orientation of the beetle after the beetle moves. The calculation method is as follows:
In the formula: represents the random function, and is the dimension of the problem to be optimized. represents the distance between the two antennas. To sum up, it can be seen that the Tianniu swarm algorithm is easy to fall into local optima when optimizing, and the ability to jump out of local optima is weak.
3. Improved Beetle Swarm Optimization Algorithm
Aiming at the problem the beetle herd algorithm—it has low precision and can easily fall into local optima—this paper proposes the beetle herd optimization algorithm with rebellious growth character (RGP–BSO).
3.1. Rebellious Growth Character
Inspired by the short flight ability of the beetle, the improved beetle swarm optimization algorithm is used to solve the problem wherein the beetle herd is prone to fall into local optima. When a beetle moves, it will actively share the location it has experienced with the group, which is used as the basis for updating the optimal site of the group. When a beetle moves, it may have a rebellious character. It will not focus more on the global optimal point and its individual optimal point but may envy the optimal point passed by other beetles in the population. Then, it uses the flying ability to randomly fly to the particular optimal moment of a certain beetle in the population. Then, the updated formula for the position of the left and right whiskers is as follows:
In the formula: is a random number, and is the individual optimal point experienced by the right whisker of the random th beetle in the th iteration. means that when the position of the right whisker of the beetle is updated, the position that he participates in after the update is no longer his optimal position. Instead, the optimal position is that of the original individual randomly selected individual in the herd, and the original beetle flies to the optimal position of individual after a short flight. is the personal optimal point shared by the left whisker of the random th beetle in the th iteration. The formula for growing rebellious character is as follows:
The rebellious character position movement formula is:
The formula for the position movement of the growth character is:
and are adaptive weights, and the value ranges of and are both [0, 0.5]. The primary role of is to converge to the global optimum, while the role of is to jump out of the local optimum and improve the global search ability. In the rebellious character, to ensure the power of the algorithm to jump out of the local optimum, it is necessary to ensure that is always maintained at the corresponding ratio. In the growth character, to keep the ability to converge to the optimum, it is essential to ensure that is maintained in a particular proportion. After many experiments, it is proved that the algorithm performs best when both and are kept at [0, 0.5]. As the number of iterations increases, the values of and become lower and lower until they reach 0. With a decrease in and , the proportion of in the rebellious character will gradually decrease, and the ratio will increase progressively. The global search ability of the rebellious character will become stronger and stronger. The proportion of in the growth personality will gradually increase, the ratio of Y will gradually decrease, and the movement trend of the growth character will tend progressively to the global best and converge to the global best.
3.2. Dynamic Factors of Personality Maturity
In order to make the character mature, the characteristics and abilities of each character in the later stage of the iteration are gradually enhanced. We accommodate solution details for problems that change with iterations. An adaptive inertia weight reduction strategy is introduced, and the formula is as follows:
In the formula: the constant is 0.5, the constant is 0, is the total number of iterations, and is the current iteration number. When is set to 0.5 and is set to 0, the value range of is [0, 0.5]. We substitute into of Formula (9) to gradually improve the global search ability of rebellious characters. Substituting into of Formula (10) is used to progressively enhance the growth character’s optimization precision.
3.3. Personality Choice Strategies
Each particle faces the problem in different ways in the swarm optimization algorithm. When only sticking to one method, it is easy to miss the optimal solution, increase the optimization time, and reduce the convergence speed. This paper introduces a personality selection strategy to allow each beetle to choose its optimization method in different positions and iterations.
When solving the maximum value problem:
When solving the minimum problem:
In the formula: is the fitness value of the th beetle in the th generation. is the average fitness value of the beetle herd in iterations. We solve for the minimum value, as an example, when the fitness value of the beetle in the th iteration is greater than the average fitness value. We prove that when the position of the beetle is not good, the beetle chooses a rebellious character, increasing the weight of individual best positions and the probability of flying into random beetles. When the fitness value of the th iteration is less than the average fitness value, it proves that the position of the beetle is acceptable, and the beetle chooses the growth character, focusing on the global optimum and the individual optimum.
3.4. Algorithm Process
The specific flow chart of the RGP–BSO algorithm is shown in Figure 1. The steps of the RGP–BSO algorithm are as follows:
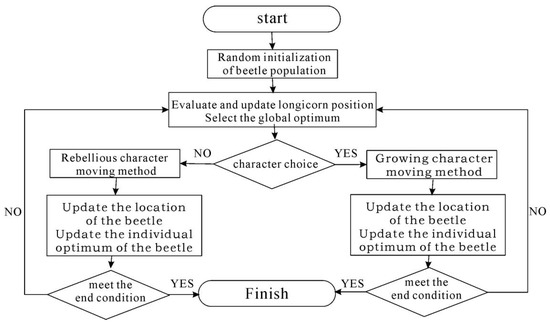
Figure 1.
Algorithm flow chart.
Step 1: Initialize the parameters of the beetle herd, including population number, number of iterations, initial position, initial speed, inertia weight, etc. Step 2: Evaluate the status of each beetle, select the globally optimal function, and calculate the average fitness of the beetle population. Step 3: According to Formula (12) or Formula (13), the fitness of each beetle is judged, and the appropriate character is selected. Step 4: According to the two characters of Formulas (9) and (10), update the position of the beetle and update the individual optima. Step 5: Determine whether the number of iterations k satisfies the end condition. If so, output the optimal global value. Otherwise, repeat Steps 2 to 5.
4. Simulation Experiment and Analysis
4.1. Experiment Setup
In order to verify the optimized performance of the RGP–BSO algorithm this paper, particle swarm optimization (PSO) [15], differential evolution (DE) [16], beetle antennae search (BAS) [17], beetle swarm optimization (BSO) [18], sparrow search algorithm (SSA) [19], and cuckoo Search (CS) [20], six algorithms in total, are compared on 12 typical benchmark functions. This comparison is performed to evaluate the algorithm optimization accuracy and convergence speed.
The 12 selected test functions are shown in Table 1. The search range and optimal value of the function are shown in the table. In order to ensure the accuracy of the experiment, the population size of all optimization algorithms is set to 50 and the maximum number of iterations is 100. After several experiments, we have demonstrated that the average performance of each optimization algorithm is more stable when the population size is set to 50. When the number of iterations is set to 100, each optimization algorithm converges to the global optimum or a local optimum, and too many iterations only increase the redundancy time of the operation. Therefore, to ensure the fairness of the experiment, we set the population to 50 and the number of iterations to 100. The simulation software used in this paper is Matlab2018.

Table 1.
Test function.
4.2. Algorithm Performance Analysis
The comparison of algorithm performance indicators is shown in Table 2. In the 12 test functions, each group of algorithms is executed 30 times and the optimal value (Best), the mean value (Mean), and the standard deviation (Std) of the 30 executions are obtained. The data in the analysis table can be obtained. The RGP–BSO algorithm shows strong optimization ability and convergence accuracy on both unimodal and multimodal functions, which corrects the problem of the BSO algorithm falling into local optima easily.
Table 2.
Algorithm optimization performance comparison.
For the functions f1, f3, f5, f6, f9, f10, and f12, the optimization accuracy of the RGP–BSO algorithm even reached 100%. However, in the f2 function, no algorithms found the global optimal solution of 0. The algorithm with the closest optimization value is the PSO algorithm. However, the standard deviation of the PSO algorithm is large and unstable. Although the optimal value of the RGP–BSO algorithm does not reach the accuracy of the PSO algorithm, the standard deviation is the smallest among the seven algorithms, showing good performance stability. For the function f11, although the optimization reached the optimal value, the standard deviation of the RGP–BSO algorithm is slightly inferior to the PSO algorithm. However, in the optimization comparison of the overall test function, RGP–BSO shows better optimization ability, convergence accuracy, and ability to jump out of local optima.
In order to reflect the convergence speed of the algorithms, the convergence curves of each algorithm for the 12 functions are shown in Figure 2. The convergence speed of the RGP–BSO and SSA algorithms is much higher than other algorithms when the convergence value is 0. However, it can be found that the SSA algorithm quickly falls into the local optimum when the convergence value is not 0, failing to converge to the globally optimum value. The RGP–BSO algorithm ensures the convergence speed, considers the convergence accuracy, and finds the optimal global solution in a concise number of iterations.
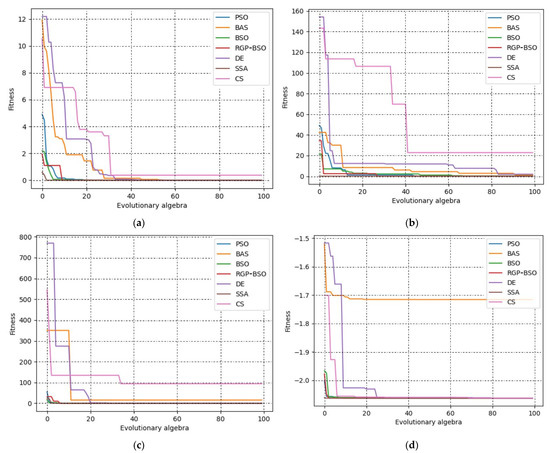
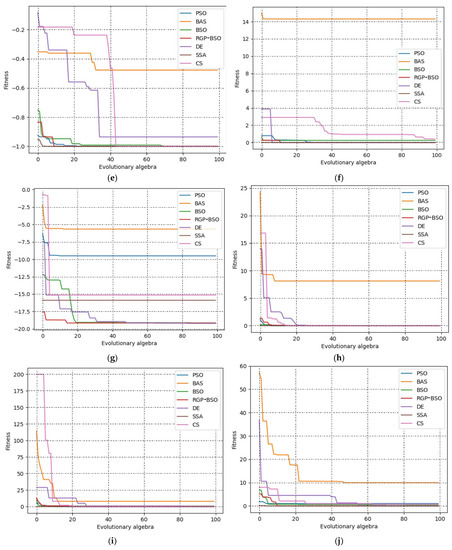
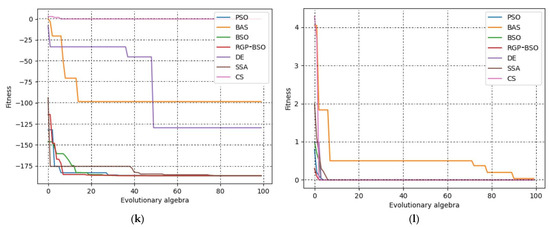
Figure 2.
Fitness curve. (a) f1 function. (b) f2 function. (c) f3 function. (d) f4 function. (e) f5 function. (f) f6 function. (g) f7 function. (h) f8 function. (i) f9 function. (j) f10 function. (k) f11 function. (l) f12 function.
5. Construction of RGP–BSO–ELM PM2.5 Concentration Prediction Model
In order to further verify the performance of the RGP–BSO optimization algorithm, PSO and BSO are used as comparative optimization algorithms. We optimize the ELM model to predict PM2.5 concentration. Most PM2.5 concentration predictions only consider time series or space series in the existing research. PM2.5 attention is spatially susceptible to external factors such as wind direction, wind speed, relative humidity, and temperature [21]. Temporally, PM2.5 concentration is affected by the accumulation of previous PM2.5 concentrations [22]. Therefore, Zhang proposed a PM2.5 concentration prediction framework based on the K-core idea and label distribution learning. The framework flow chart is shown in Figure 3.
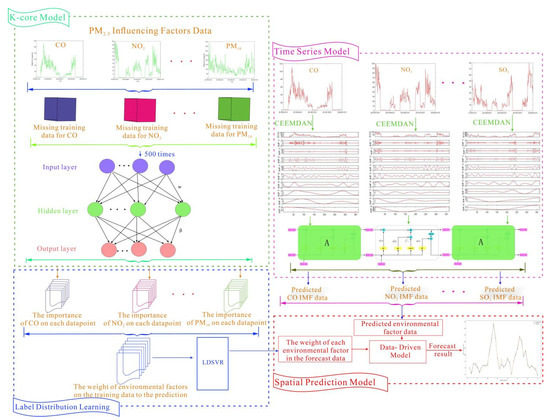
Figure 3.
PM2.5 forecasting spatiotemporal model frame diagram.
First, the label distribution support vector regression (LDSVR) [23] model was used to calculate the weight of each influencing factor on the PM2.5 concentration in the daily data. Secondly, complete ensemble empirical mode decomposition of adaptive noise (CEEMDAN) is used for the modal decomposition of PM2.5 concentration factors such as temperature, wind speed, and wind direction. Then, we used the time series forecasting model to predict the data of the influencing factors during the forecast days. Finally, the obtained weight ratio and influencing factor data are used for spatial prediction, and the PM2.5 concentration is obtained.
5.1. Research Data
This paper selects Jinan City, Shandong Province, China, as the research area. The data selected are the historical meteorological factors of Jinan in 2019 (CO, NO2, SO2, PM10, O3, wind speed, average air pressure, wind direction, average temperature, and relative humidity). The data of the last 35 days are used as the prediction data. The rest of the data are used as the training data.
5.2. RGP–BSO–ELM Model Construction
RGP–BSO optimizes the extreme learning machine (ELM) flow chart, as shown in Figure 4. Step 1: Randomize the position and velocity of the beetles, and evaluate the fitness values of all beetles based on the PM2.5 training data. Step 2: Evaluate the position of each beetle, select the globally optimal position, and calculate the average fitness of the beetle population. Step 3: According to Formula (12) or Formula (13), the fitness of each beetle is judged, and the appropriate character is selected. Step 4: According to the two characters of Formulas (9) and (10), update the position of the beetle and update the individual optima. Step 5: Determine whether the number of iterations k satisfies the end condition. If so, output the optimal global value. Otherwise, repeat Steps 2 to 5. Step 6: Substitute the parameters of the optimized ELM model into the ELM to construct an RGP–BSO–ELM model to predict the PM2.5 concentration.
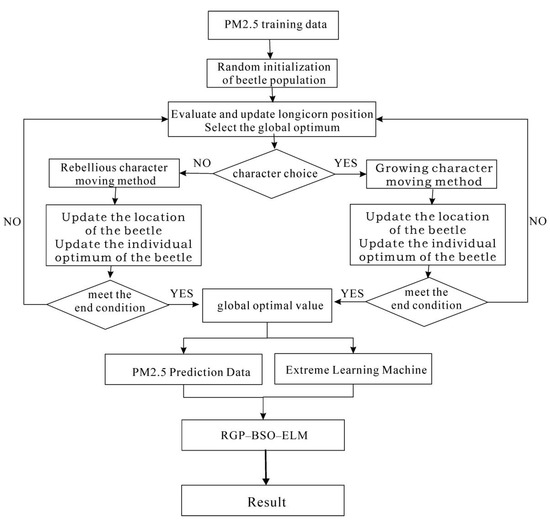
Figure 4.
RGP–BSO–ELM Framework Diagram.
5.3. Evaluation Indicators
This paper adopts MAE, MAPE, and RMSE as evaluation indicators. Their calculation formulas are as follows:
where: is the number of days to predict PM2.5 concentration, is the expected value of PM2.5 concentration, and is the actual value of PM2.5 concentration.
5.4. Forecast Result
The prediction results are shown in Figure 5, and the evaluation indicators are shown in Table 3. It can be seen from Figure 5 that the ELM prediction model without an optimization algorithm has significant error. The BSO–ELM, PSO–ELM, and RGP–BSO–ELM models can more accurately predict the changing trend of PM2.5 concentration, and the expected results are closer to the actual PM2.5 density. From Table 3, the RMSE of the RGP–BSO–ELM model is 2.8236, 2.0408, and 0.3778 smaller than that of ELM, BSO–ELM, and PSO–ELM, respectively. It has been proven that the RGP–BSO–ELM model has better prediction accuracy. At the same time, the RMSE index of RGP–BSO–ELM is the smallest, which demonstrates that the RGP–BSO–ELM model is more stable. The RGP–BSO–ELM model is superior to other models by comprehensive comparison.
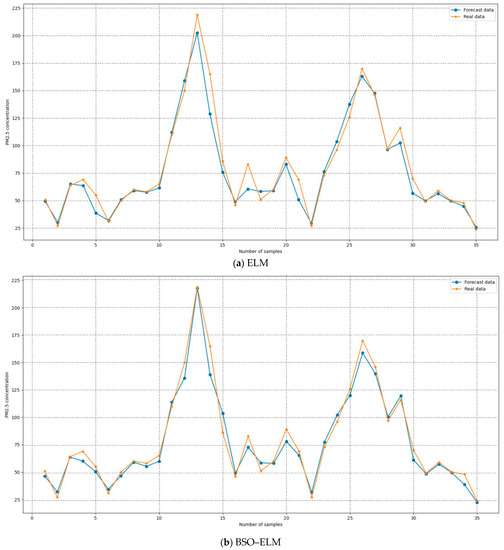
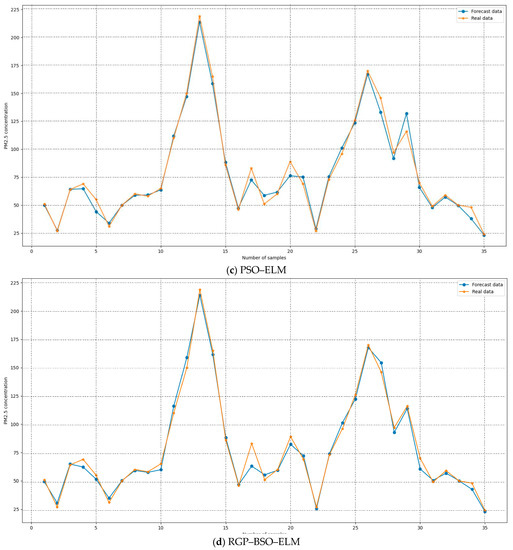
Figure 5.
Prediction result graph.
Table 3.
Model evaluation index results.
6. Conclusions
In order to solve the problems of slow convergence speed, low precision, and quickly falling into the local optima attributed to the BSO algorithm, this paper proposes an RGP–BSO algorithm based on rebellious growth character. The algorithm uses rebellious character and growth character to increase the algorithm’s global search ability and local search ability, adjust the understanding of the optimal position of the beetles, and change the weight of the direction of the beetles. A character selection strategy is designed to balance each beetle’s global search and local search, making it easier for the beetle herd to jump out of local optima, improving the optimization accuracy of the algorithm. The dynamic factor of character maturity is introduced to promote the maturity of the rebellious character and growth character, improve the characteristics of the beetle herd in the later stage, and further improve the optimization accuracy of the algorithm. We compared six algorithms, namely the PSO, BAS, BSO, SSA, DE, and CS algorithms, in 12 test function simulation experiments. Experiments show that the RGP–BSO algorithm has better convergence speed and optimization accuracy and dramatically improved the ability to jump out of local optima. By modeling the fundamental problem of PM2.5 concentration prediction, the RGP–BSO–ELM model has better prediction accuracy, more prominent accuracy and stability, and has obvious advantages.
In future work, we will apply the improved algorithm to other natural scenes and improve the algorithm. It can be seen from Figure 2 that although RGP–BSO has a good convergence speed overall, there are also cases where the convergence speed is slower than DE and SSA algorithms. The goal of our subsequent work is to improve the convergence speed of the algorithm further so that RGP–BSO no longer depends on the selection of the initial population so that the iteration speed can be improved. An additional goal lies in further reducing the running time of the RGP–BSO algorithm so that the algorithm has better time complexity in practical applications to meet complex industrial applications.
Author Contributions
Conceptualization, Y.Z. and Q.Y.; methodology, Y.Z.; software, Y.Z.; validation, Y.Z. and Q.Y.; formal analysis, Y.Z.; investigation, Y.Z.; resources, Y.Z.; data curation, Y.Z.; writing—original draft preparation, Y.Z.; writing—review and editing, Q.Y.; visualization, Y.Z.; supervision, Q.Y.; project administration, Q.Y.; funding acquisition, Q.Y. All authors have read and agreed to the published version of the manuscript.
Funding
The present study was funded by the National Natural Science Foundation of China (No: 71961001).
Institutional Review Board Statement
Not applicable.
Informed Consent Statement
Not applicable.
Data Availability Statement
The data presented in this study are available on request from the corresponding author.
Conflicts of Interest
The authors declare that they have no conflict of interest to report regarding the present study.
References
- Yang, C.; Luo, J.; Liu, C.; Li, M.; Dai, S.L. Haptics Electromyogrphy Perception and Learning Enhanced Intelligence for Teleoperated Robot. IEEE Trans. Autom. Sci. Eng. 2018, 16, 1512–1521. [Google Scholar] [CrossRef]
- Ghosh, T.; Martinsen, K. A Collaborative Beetle Antennae Search Algorithm Using Memory Based Adaptive Learning. Appl. Artif. Intell. 2021, 35, 440–475. [Google Scholar] [CrossRef]
- Wolpert, D.H.; Macready, W.G. No free lunch theorems for optimization. IEEE Trans. Evol. Comput. 1997, 1, 67–82. [Google Scholar] [CrossRef]
- Zhadan, V.G. Primal–Dual Newton Method with Steepest Descent for the Linear Semidefinite Programming Problem: Newton’s System of Equations. Comput. Math. Math. Phys. 2022, 62, 232–247. [Google Scholar] [CrossRef]
- Kaliyamoorthy, V.; Krishnasamy, V.; Kandasamy, N. Prediction of virtual energy storage capacity of the air-conditioner using a stochastic gradient descent based artificial neural network. Electr. Power Syst. Res. 2022, 208, 107879. [Google Scholar]
- Mirjalili, S.; Mirjalili, S.M.; Lewis, A.D. Grey Wolf Optimizer. Adv. Eng. Softw. 2014, 69, 46–61. [Google Scholar] [CrossRef]
- Yu, H.; Qiao, S.; Heidari, A.A.; Bi, C.; Chen, H. Individual Disturbance and Attraction Repulsion Strategy Enhanced Seagull Optimization for Engineering Design. Mathematics 2022, 10, 276. [Google Scholar] [CrossRef]
- Dahbi, E.K.; Elhamadi, T.; Amar, T.N. Optimization of the SIW cavity-backed slots antenna for X-band applications using the Particle Swarm Optimization algorithm. J. Electromagn. Waves Appl. 2022, 36, 928–939. [Google Scholar] [CrossRef]
- Zhang, L.; Gao, T.; Cai, G.; Hai, K.L. Research on electric vehicle charging safety warning model based on back propagation neural network optimized by improved gray wolf algorithm. J. Energy Storage 2022, 49, 104092. [Google Scholar] [CrossRef]
- Yu, D.; Zhang, X.; Tian, G.; Jiang, Z.; Liu, Z.; Qiang, T.; Zhan, C. Disassembly Sequence Planning for Green Remanufacturing Using an Improved Whale Optimisation Algorithm. Processes 2022, 10, 1998. [Google Scholar] [CrossRef]
- Jiang, X.; Li, S. BAS: Beetle Antennae Search Algorithm for Optimization Problems. Int. J. Robot. Control 2017, 1, 1. [Google Scholar] [CrossRef]
- Khan, A.H.; Cao, X.; Li, S.; Katsikis, V.N.; Liao, L. BAS-ADAM: An ADAM Based Approach to Improve the Performance of Beetle Antennae Search Optimizer. IEEE/CAA J. Autom. Sin. 2020, 7, 461–471. [Google Scholar] [CrossRef]
- Wang, T.; Yang, L. Beetle swarm optimization algorithm: Theory and application. arXiv preprint 2008, arXiv:1808.00206. [Google Scholar] [CrossRef]
- Wu, D.L.; Qin, T.W. A hybrid deep kernel incremental extreme learning machine based on improved coyote and beetle swarm optimization methods. Complex Intell. Syst. 2021, 7, 3015–3032. [Google Scholar] [CrossRef]
- Chen, Q.; Sun, J.; Palade, V.; Wu, X.; Shi, X. An improved Gaussian distribution based quantum-behaved particle swarm optimization algorithm for engineering shape design problems. Eng. Optim. 2022, 54, 743–769. [Google Scholar] [CrossRef]
- Zheng, L.; Luo, S. Adaptive Differential Evolution Algorithm Based on Fitness Landscape Characteristic. Mathematics 2022, 10, 1511. [Google Scholar] [CrossRef]
- Wang, Z.; Chen, G.; Tan, L. Optimization of stereo calibration parameters for the binocular camera based on improved Beetle Antennae Search algorithm. J. Phys. Conf. Ser. 2021, 2029, 012095. [Google Scholar] [CrossRef]
- Bhagavathi, H.; Rathinavelayatham, S.; Shanmugaiah, K.; Kanagaraj, K.; Elangovan, D. Improved beetle swarm optimization algorithm for energy efficient virtual machine consolidation on cloud environment. Concurr. Comput. Pract. Exp. 2022, 34, e6828. [Google Scholar] [CrossRef]
- Li, J.; Lei, Y.; Yang, S. Mid-long term load forecasting model based on support vector machine optimized by improved sparrow search algorithm. Energy Rep. 2022, 8, 491–497. [Google Scholar] [CrossRef]
- Xiong, Y.; Cheng, J.; Zhang, L. Neighborhood Learning-Based Cuckoo Search Algorithm for Global Optimization. Int. J. Pattern Recognit. Artif. Intell. 2022, 36, 2251006. [Google Scholar] [CrossRef]
- Shen, F.; Zhu, T.; Niu, M. Pro-inflammatory effects of airborne particulate matters in relation to biological and chemical composition. Chin. Sci. Bull. 2018, 63, 968–978. [Google Scholar] [CrossRef]
- Seng, D.; Zhang, Q.; Zhang, X.; Chen, G.; Chen, X. Spatiotemporal prediction of air quality based on LSTM neural network. Alex. Eng. J. 2021, 60, 2021–2032. [Google Scholar] [CrossRef]
- Geng, X.; Hou, P. Pre-Release Prediction of Crowd Opinion on Movies by Label Distribution Learning; AAAI Press: Palo Alto, CA, USA, 2015. [Google Scholar]


Publisher’s Note: MDPI stays neutral with regard to jurisdictional claims in published maps and institutional affiliations. |
© 2022 by the authors. Licensee MDPI, Basel, Switzerland. This article is an open access article distributed under the terms and conditions of the Creative Commons Attribution (CC BY) license (https://creativecommons.org/licenses/by/4.0/).