


Optimisation Configuration of Overhead-Line Segmentation Switch of a Distribution Network Based on Global Combination Criterion

School of Electrical Engineering, North China University of Water Resources and Electric Power, Zhengzhou 450011, China
*
Author to whom correspondence should be addressed.
Processes 2022, 10(10), 1976; https://doi.org/10.3390/pr10101976
Submission received: 28 August 2022
/
Revised: 21 September 2022
/
Accepted: 22 September 2022
/
Published: 1 October 2022
(This article belongs to the Topic Enabling Computing Techniques for Wide-Area Power System Applications)
Abstract
:Under certain constraints, the optimisation of the position and number of sectional switches in overhead lines in distribution networks can improve the reliability and economy of the power supply. Therefore, a global combination criterion is proposed to simultaneously evaluate the combination performance of multiple switch positions, which avoids the tedious traditional problem of adjusting only one switch position at a time and that can possibly fall into a local-optimum problem. We directly determine the optimal solution and ensure a global optimum. Firstly, the optimal switching position in each line segment is analysed as an alternative switching position. Subsequently, the optimal installation-position combination that corresponds to a given number of switches is determined according to the global combination criterion. If the constraints are satisfied, the number of switches is increased by one, and the optimal installation-position combination is then determined until the constraints are not satisfied. This process ensures not only the global optimum of the switch position but also the optimum number of switches. Finally, examples are given to demonstrate that the proposed method can further optimise the switch configuration. The utility model effectively improves the device utilisation rate, reduces the influence range of the fault, and improves power supply reliability.
1. Introduction
According to statistics, 80% of power-grid failures are caused by distribution network failures [1], and power outages caused by distribution network failures bring incalculable economic and social losses to the users. Therefore, the use of segmented switches is necessary to segment and isolate the distribution network. In the event of a fault, most users will not be affected by the segmented switches. However, the construction and maintenance of segment switches requires a large cost; thus, optimising the use of segment switches has become a critical issue [2,3]. Reference [4] analysed the single-feeder and multi-feeder respectively based on the reliability index. Reference [5] uses a genetic algorithm to solve, but because the model is nonlinear, it is difficult to guarantee the global optimality of this kind of algorithm. References [6,7] proposed a criterion on whether segmented switches should be installed, but only individually considered a single switch and did not consider the synergy among switches. Reference [8] summarised the optimal number of segments where the general expression was quantified. However, it was only applicable to the case where the users are evenly distributed. Reference [9] converts the proposed model into a mixed integer linear model, which increases the solution efficiency, but the accuracy is difficult to guarantee. In [10], a risk-based two-stage mixed integer linear programming (MILP) model was proposed to improve the flexibility of piecewise switching. Reference [11] introduced a routing analysis method to analyse the specific performance of different deployment scenarios of segment switches with external tie lines and internal tie lines, but the method is slightly more complicated for systems with fewer tie lines. Reference [12] considered the resilience improvement measures of the distribution network with the addition of automatic switches on the distribution lines in the planning problem, but the model did not consider the impact of manual switching on the power supply restoration process of the distribution network, and assumed automatic switching. The state and the reduction in node load can be controlled in real time, which relies on the highly automated power distribution system, which makes the model have certain limitations. Reference [13] proposed the concept of average load coefficient of station area line, established an optimization model for section switch and tie switch in stages, and obtained the optimal switch configuration scheme from the aspects of quantity, position and capacity. However, the optimal distribution in the target station area does not always mean that it is the global optimal solution. Reference [14] added adjustment operator and adjustment operator to the general genetic algorithm to optimize the distribution network switch configuration. Reference [15] establishes a subsection optimization model based on the concept of equipment life cycle cost (LCC), gives the recursive formula of the impact of adding subsection switches one by one under any switch configuration on the system outage cost, and uses discrete particle swarm optimization algorithm for optimization. Such intelligent algorithms in references [14,15] have been improved, but they still cannot guarantee 100% global optimization. Reference [16] proposed an optimization model for improving the resiliency of power distribution systems by upgrading some manual switches to remote-controlled switches. A weighted set cover is used to model the deployment problem and a greedy algorithm is chosen as the solution algorithm. Reference [17] uses a greedy algorithm and improved genetic algorithm to optimize the section switch respectively, but the greedy algorithm can only optimize the section switch on the trunk line, and the solution obtained by this method is not necessarily the optimal solution, but the solution speed by using Visual FoxPro program development tool combined with improved genetic algorithm is slow. Reference [18] uses an ant colony algorithm to solve the deployment model of segment switch. In general, such models based on intelligent algorithms are easy to formulate, but their solutions may fall into local optima. Reference [19] obtains reliability indexes based on interval fusion fault retrieval method, transforms them into economic indexes through the iear index method, and finally uses the greedy method to optimize the section switch configuration. However, it does not reflect the optimization of the number of switches. Reference [20] takes the minimum life cycle cost of the configuration scheme as the objective function and uses the binary differential evolution algorithm for analysis and calculation. Although the multi strategy evolution mode improves the search probability of the global optimal solution, the convergence speed is significantly reduced. Reference [21] comprehensively considers the actual engineering constraints such as line transfer capacity and transfer line length between substations, preliminarily selects the overall liaison structure of substation, puts forward the life cycle efficiency (LCE) index, and establishes the mathematical model with the maximum LCE index of distribution network switch planning scheme as the objective function. Reference [22] proposed a sample construction and sample local search algorithm, and on this basis, proposed a new iterative sample construction algorithm with path reconnection, which solved the problem of optimal switch allocation. However, when evaluating the constructed samples, only the expected energy not supply (EENS) is taken as the reliability index, without considering additional constraints such as minimizing the number of switching operations, customer priority, switching time or recovery cost. Reference [23] established a general model of M-segment and n-interconnection connection of medium voltage distribution network, and used the whole life cycle method to give feasible segmentation and interconnection configuration schemes under different boundary conditions. However, when the power supply model is constructed, each line is divided into m segments with equal length and the load is evenly distributed, which greatly affects the household hours affected by power failure, so the reliability index cannot be fully guaranteed. Reference [24] obtains the reliability index expression by calculating the fault incidence matrix and fault parameters, and then establishes a 0–1 integer quadratic constraint optimization model for segmented turnout configuration to optimize the segmented switch and tie line. For the configuration problem of remote-control section switches, reference [25] uses mixed integer linear programming to model the problem and effectively optimizes the configuration scheme of the section switch, but does not consider the combined optimization of section switch and tie line. Moreover, the installation of subsection switches on a line segment only includes one candidate position, while both the starting point and the end point are considered in the literature [26,27], and the method of planning subsection switches and tie lines at the same time is more economical and reasonable. References [28,29,30] proposed a three-stage optimisation algorithm for switch configuration, which first determined the switch alternative position and then installed the switch according to a single-switch-position criterion until the constraint conditions were not satisfied. These switches were then individually optimised. Although this method provided a certain degree of improvement compared with the traditional method, it still fell into the local optimum and failed to not only optimise the switch but also determine the quantity because it was determined in the second stage before the position optimisation. In other words, the calculation of the constraint index was not performed based on the final optimised switch position; thus, it was not optimal. Figure 1 shows that because the power loss of the same number of switches in the optimal and non-optimal positions is different, the optimal number of segments obtained when constrained by economics is also different. Therefore, the method used for determining the number of switches in [28,29,30] was not sufficiently accurate.
To further optimise the position and number of switches, the first step in the present study adopts the alternative switch positions proposed in [28,29,30]. Thus, the distribution of the switch positions is restricted within a limited range. Then, we individually analyse the presence or absence of contact lines and propose a corresponding global switch-combination criterion. The criterion is used to directly determine the best installation position combination corresponding to a given number of switches, which ensures global optimum. The main contributions of this paper are reflected in the following aspects:
- (1)
- By comprehensively considering reliability and economy, an optimisation algorithm for the distribution switch of an overhead line segment in a distribution network based on the global combination criterion is proposed, and the switch-configuration scheme is further optimised to effectively improve the utilisation rate of the equipment, reduce the scope of faults, and improve the power supply reliability.
- (2)
- Simultaneously, we determine multiple switch positions using a global combination criterion. Compared with [28,29] that employed a single-switch criterion to determine one switch at a time, the method of repeated iterative optimisation to determine the switch position is more direct. Further, it does not fall into a local optimum. The calculation speed is also very fast while ensuring global optimum.
- (3)
- This paper proposes to further optimise the number of switches based on the optimal switch position and reflects the optimisation effect of the method on the number of switches. The use of the optimised optimal switch-position data to determine the number of switches is obviously better than that in [28,29]. The number of switches determined by the switch-position data before optimisation is more accurate and reasonable.
2. Relevant Definition and Reliability-Index Selection
2.1. Related Definitions
- (1)
- Node: connection point of the feeder and distribution transformer. The connection point of the primary branch and trunk is defined as a node.
- (2)
- Line segment: a line that connects two nodes without a load is defined as a line segment.
- (3)
- Line power supply end: the end of a line section close to the main power supply (standby power supply) is defined as the main power supply end (backup power supply end) of a line section.
2.2. Power Supply Reliability Index
Currently, the commonly used indicators for evaluating the reliability of a distribution network [14] are the following: system average power outage duration index (SAIDI), system average power outage frequency index, user average power outage frequency index, and system power-shortage indicator [energy not supplied (ENS)], which is characterised by insufficient power supply in the system for a given time. If the aforementioned indicators are evaluated, the workload becomes large and the effect is not good because of the complex relationship among the indicators. This study comprehensively considers the user (the power outage time is shorter) and the power supply company (the lack of power supply is less). Comprehensive evaluations are made using the two indicators: SAIDI and ENS.
2.3. Power Supply Reliability Evaluation Method
The traditional method of distribution network reliability evaluation is adopted, namely, failure mode and effect analysis. This method uses component-reliability data to select the appropriate fault-judgment criteria and then divides the system status into normal operation and fault categories according to the criteria. It then performs reliability calculations. For calculation convenience, the model is simplified, and only the line faults are considered.
3. Constructing the Objective Function
3.1. Objective Function
According to SAIDI and ENS, the following multi-objective function is developed:
where,
- y—number of section switches
- R(y)—reliability comprehensive index value
- SAIDI(y)—SAIDI of y switches normalised before multiplying the weights
- ENS(y)—ENS for y switches, which is normalised before multiplying the weights
Weight of W1—SAIDI indicator, which can be changed according to the actual situation. This study considers it in a balanced manner and judged by experts, assumes a value of 0.5.
Weight of W2—ENS index, which can be changed according to the actual situation. This study considers it in a balance manner and assumes a value of 0.5.
3.2. Restrictions
- (1)
- Power system inequality constraints
The inequality-constraint conditions that ensure normal operation of the power system are expressed by the following formula:
S represents the user power, U represents the bus node voltage, I represents the branch current, and f represents the system frequency.
- (2)
- Power system equality constraints
The equality constraints that ensure normal operation of the power system are expressed by the following formula:
,, represent the power supply, line loss, and active power of the load, respectively, and ,, represent the power supply, line loss, and reactive power of the load, respectively.
- (3)
- Maximum effective-segment-condition constraints
To allow each additional switch to exert a considerable effect, the set constraint conditions are expressed as follows:
where represents the comprehensive-index value, which is reduced by adding one more switch, i.e., . is the minimum reduction rate that needs to be satisfied (here, 0.1).
- (4)
- Economic constraints
Here, c represents the cost of installing a switch, including post-maintenance expenses, and C0 represents the upper limit of the cost of this additional switch project.
- (5)
- Reliability constraints
Here, R0 represents the maximum reliability comprehensive-index value R(y). Exceeding this value means that the reliability requirements cannot be met.
4. Optimal Switch Configuration Based on Global Combination Criterion
4.1. Definition of Related Quantity
Figure 2 shows that the K1 and K2 switches divide the line into three sections. We let A1 be the length of the trunk line between switch K1 and power point, B1 be the total length of the branch lines in the A1 section trunk line, L1 be the sum of the lengths of A1 and B1, and A2 be the switch between K1 and K2. The length of the trunk line, i.e., B2 represents the sum of the total length of the branch lines in the A2 section of the trunk line, and L2 denotes the sum of the lengths of A2 and B2. A3 represents the length of the trunk line from switch K2 to the end of the line, and B3 denotes the length of the A3 section of the trunk line, i.e., the sum of the total length of the branch lines. L3 denotes the sum of the lengths of A3 and B3. The total number of users in L1 is denoted by N1. The total load is denoted as P1, which are the loads from C1 to C5. The total number of users in L2 is denoted by N2. The total load is denoted as P2, which are the loads from C6 to C10. The total number of users in L3 is denoted as N3, and the total load is represented by P3.
If the number of switches is increased to y, the switches are denoted as K1–Ky from left to right, i.e., the line is divided into y + 1 segments. Then, Li represents the trunk line between the i − 1 and i switches, which represents the total length of the branch line. Ni and Pi denote the number of users and load in Li (i = 1, 2, …, y + 1). When i = 1, Li represents the total length of the main and branch lines between K1 and the power point. When i = y + 1, Li denotes the total length of the main and branch lines from Ky to the end of the line.
4.2. Switch Global Combination Criterion
- (1)
- Criterion for global switch combination without a tie line
Figure 2 shows that for a single-ray ray path, the installation of switches will present different reliability characteristics at different positions. Here, the effect of the combined installation position of multiple switches on the global reliability is simultaneously investigated. We let L be the sum of L1, L2, and L3, i.e., the total length of the trunk and branch lines. We denote the total number of users in L as N and the total load as P. We also denote the total number of users in L1 as N1 and the total load as P1. The total number of users in L2 is denoted as N2, and the total load is denoted as P2. The total number of users in L3 is listed as N3, and the total load is listed as P3. We assume that two switches K1 and K2 are installed for the preliminary research.
By first considering only one reliability index, i.e., SAIDI, SAIDIbef before the switch installation can be expressed by the following formula:
Feeder SAIDIaft after the installation of the segment switch is expressed as
where:
- t1—time required for fault repair
- t2—Power-outage time in line B when line A fails. (The value of t2 when a circuit breaker is used as a switch is zero, and that of t2 when a load switch is used is the sum of the time required for the fault location and isolation and the time required for the switch to trip). Line A indicates the part that needs to be isolated and repaired after the fault. Line B indicates the part that can normally supply power after the fault is isolated.
- λ—Line failure rate
After the switch is installed, the reduced value of SAIDI, i.e., ΔSAIDI, is expressed by the following formula:
We can easily learn that when Equation (9) obtains the maximum value, the best effect and reliability are realised when two switches are installed, and the corresponding switch position at this time is the optimal switch position when two switches are installed.
When y switches are installed, the line is divided into y + 1 segments. Then,
Similarly, we can observe that when the maximum value is obtained in Equation (10), it indicates the optimal effect when y switches are installed. The reliability reaches the highest value, and the corresponding switch position at this time is the optimal switch position when y switches are installed.
λ, t1, t2, and N in Equations (9) and (10) do not change with the change in the switch position. They are all quantities and do not affect the distribution of the optimal switch position, which can be ignored when the maximum value is sought. We simply calculate the maximum value of
Similarly, if the reliability index considered is ENS, then the corresponding switch position, when
obtains the maximum value is the optimal switch position when y switches are installed.
If the two reliability indexes, namely, SAIDI and ENS, are comprehensively considered, they can be determined using Equation (11). When the value of Equation (11) is the largest, the comprehensive reliability reaches the highest value, and the corresponding switch position represents the comprehensive consideration of SAIDI and ENS, which is the optimal switch position under the two indicators.
In Equation (11), , (i = 1,2, …, y). Xi can be considered as a comprehensive indicator of the user load. Equation (11) can be used as a global switch-combination criterion for unconnected lines to determine the advantages and disadvantages of the global switch position combination.
- (2)
- Criterion for global combination of switches with tie lines
Figure 2 shows that, assuming a connection exist at the end of the line, feeder SAIDIaft after the section switch is installed is expressed as
The reduced value of the average power-outage duration of the system after the segment switch is installed, i.e., ΔSAIDI is
When y switches are installed, the line is divided into y + 1 segments. Then,
Similar to that without a connection, λ, t1, t2, and N in Equation (14) are all quantities. Then, the corresponding switch position when reaches the maximum value is the optimal switch position for y switches.
Similarly, when the considered reliability index is ENS, the corresponding switch position when achieves the maximum value is the optimal switch position when y switches are installed.
When the two reliability indexes of SAIDI and ENS are comprehensively considered, they can be determined according to the Equation (15). When the value of Equation (15) is the largest, the comprehensive reliability reaches the highest value, and the corresponding switch position denotes the comprehensive consideration of SAIDI and ENS. The optimal switch position under the two indicators is expressed as follows:
Equation (15) can be used as the global switch-combination criterion of the connected circuit to determine the advantages and disadvantages of the global switch-position combination.
- (3)
- Advantages of the global switch-combination criterion compared with the single-switch criterion
We consider the installation of four switches in a line with 15 alternative switch positions as an example. This condition is compared with the traditional step of selecting the switch positions using the single-switch criterion.
The switch position is traditionally selected using the single-switch criterion:
- All candidate position criteria are first calculated. A switch is then installed at the best point.
- After the installation of the first switch, the criteria for the remaining positions need to be recalculated. The maximum value is then determined, and the second switch is installed.
- Step b is repeated until four switches are installed.
- Due to the installation of the additional switches, the criterion for the position of the previously installed switch also changes and is not optimal. Thus, recalculating the position is necessary to individually find the optimal positions until no change in the switch position occurs. In addition, global optimality is not guaranteed.
We propose to use the switch-combination criterion to select the optimal switch position. We directly calculate the criteria of the C(15,4) combination schemes, determine the optimal value, i.e., the optimal position, and ensure global optimum.
Generally, the overhead lines of a medium-voltage distribution network are limited in terms of capacity, and user access and loads are few. To ensure global optimum, all combination schemes are searched using the enumeration method. A program written in the C language is run in Visual C++ 6.0, and we search for the C(15,4) combination scheme in approximately 2 s, which is relatively fast.
4.3. Alternate Switch Position
The alternative position of the switch is the position where the switch may also be installed. We analyse if the switch is installed in each line section, identify which position is the best in the line section, restrict the distribution of the switch position within a limited range, and significantly reduce the search volume while not reducing the accuracy. In this manner, the problem is transformed into a discrete combination-optimisation problem in which n switch alternative positions are first determined in the line, and y installed switches are then selected at the n positions.
According to the abovementioned analysis, the following alternative switch positions can be obtained with or without a tie switch.
- (1)
- No contact line section
According to Equation (11) and keeping the other conditions unchanged, when only the switch position in one line segment is used as a variable, the equation solution is the largest when the switch is installed at the power supply end. Therefore, for non-connected lines, the switch alternative position is located at each power end of the line segment, as marked with a solid black dot in Figure 3.
- (2)
- Link section is present
Similarly, according to Equation (15), this value is the largest when the switch in each line segment is installed at the main power supply terminal or backup power supply terminal. Therefore, for a connected line, the alternative position of the switch is at the main power supply terminal in each line segment, which is marked with a solid black dot in Figure 4.
4.4. Determination of the Installation Position and Number of Switches
- According to whether the line is connected or not, all alternative installation positions are regarded as undetermined positions. The number of switches is denoted as n, and initial switch number y is considered as one.
- We find the most suitable y positions among the n switch positions to install y switches. According to the connection of the line (zero) and the global combination criterion in Equation (15) [Equation (11)], the values of the C(n, y) combination schemes are calculated in sequence. The corresponding switch position is identified when the maximum value is found, which is the optimal switch position when y switches are installed.
- We determine whether the constraint condition is satisfied, i.e., if y = y + 1, step b is repeated; otherwise, step d is performed.
- We output the optimal position and number of y − 1 switches.
4.5. Algorithm Flow
The heuristic algorithm is based on the planning experience of the actual power grid, converts it into a certain logic rule, and then determines whether the segment switch is installed or not based on this logic rule. This paper also belongs to the heuristic algorithm. This paper proposes a global combination criterion to simultaneously judge the pros and cons of the combined effect of multiple switch positions, that is: find the most suitable y positions on the n switch candidate positions to install y switches. According to whether there is a connection or not, according to the global combination criterion of Equation (11) (Equation (15)), the enumeration method is used to calculate the values of C(n, y) combination schemes in turn, and the combination scheme with the maximum value is found, which is the optimal switch position when y switches are installed. This avoids the tediousness of traditionally adjusting only one switch position at a time and the local optimal problem that may fall into, and directly obtains the optimal solution and ensures the global optimality, so that the global optimal position of a given number of switches can be determined.
The number of switches is determined based on the optimal switch position. First, find the best combination of installation positions corresponding to a switch through the global combination criterion. If the constraint conditions (2) to (6) are satisfied, add one to the number of switches, and then find the best combination of installation positions under this number until if the constraints are not met, it is the total number of switches. The flow chart is as follows. This not only ensures the global optimization of the switch position, but also ensures the optimization of the number of switches. Finally, it is verified by two practical examples; the algorithm flow is as shown in Figure 5.
5. Calculation Example and Optimisation-Effect Analysis
5.1. Example 1
The method in this study is used to calculate and optimise the actual feeder data in reference [14] listed in Table 1 and to compare the effects. By considering λ as 0.05 times/(year·km), t1 = 3 h and t2 = 0. The considered reliability index is ENS.
Figure 6 shows the alternative positions of the switch without a tie line, and Figure 7 shows those with a tie line. The optimisation results are shown in the switch configuration scheme shown in Figure 8, Figure 9, Figure 10 and Figure 11 in which Figure 9 shows that with no tie. The optimal switch configuration scheme is shown in Figure 11 where contact occurs. Figure 8 shows the optimal switch position when only two switches are installed without a contact. Figure 10 shows the case when only two switches are installed without a contact.
Table 2 lists the comparison between the calculation optimisation results of the method used in the present study and that in [28,29]. Through the calculation, when the line is not connected, we install three switches to optimise the section, i.e., we divide the line into four sections. When four switches are installed, the optimal positions are at the power terminals of 6–10, 10–14, 17–19, and 21–23. The ENS is 3.513 MW·h/year, which is 3% lower than that in the three-switch ENS and satisfy constraint condition number (4). The optimal three switches are located at the power terminals of 6–10, 10–14, and 19–21, and the ENS is 3.593 MW·h/year. The method in [29] also installs three switches, but the positions of the switches are arranged at the power terminals of 4–6, 10–14, and 19–21; the ENS is 3.684 MW·h/year. The method used in the present study is the same as that in [29], i.e., the same number of switches. Thus, investment is the same, which can reduce ENS by 2.47%, and the system reliability is higher. Reference [28] chose to install only two switches for cost considerations, which were arranged at the 6–10 and 14–17 power terminals, and the ENS was 3.900 MW·h/year. However, the position was not optimal. The optimal position of the two switches determined by the method used in the present study is at the 10–14 and 19–21 power terminals, and the ENS is 3.851 MW·h/year. Compared with the switch-layout scheme in [28], the cost remains the same, and the ENS is reduced by 1.26%.
When the line is connected, the calculation reveals that installing five switches is best for segmentation, i.e., we divide the line into six segments. When six switches are installed, the reliability of the upgrade is too low to satisfy constraint condition number (4). The optimal positions of the five switches are at 4–6, 6–10, and 14–17 standby power terminals and 10–14 and 19–21 main power terminals. The ENS is 0.840 MW·h/year. The method employed in [28,29] was to install four switches. The switches in [28] were arranged at the 4–6, 6–10, and 17–19 standby power terminals and 10–14 main power terminal. The ENS was 1.055 MW·h/year. The switches used in [29] were arranged at the 4–6 and 10–14 standby power terminals and 10–14 and 19–21 main power terminals. The ENS was 1.117 MW·h/year. However, the position of the four switches was not optimal. The optimal position of the four switches determined by our study is located at the 4–6, 6–10, and 10–14 standby power terminals and the 19–21 main power terminal. ENS is 1.013 MW·h/year. Under the same number of switches, ENS is reduced by 3.98% compared with that in [28] and by 9.31% compared with that in [29]. The five-switch configuration scheme in the present study is 17.08% lower than the four-switch optimal scheme. Compared with the switch-layout scheme in [28,29], we install one more switch. ENS is reduced by 20.38% compared with that in [28] and by 24.80% compared with that in [29]. We can observe that although one more switch is installed, the ENS is significantly reduced and the reliability is significantly improved, which prove that the proposed scheme can effectively optimise the number of switches.
Table 3 is a chart detailing the various configuration conditions in this paper.

Table 3.
Condition and operation table.
| Example | Contact Line | Graphics | Configure |
|---|---|---|---|
| Example 1 (Actual feeder data in Reference 28) | no contact | Figure 6 | Alternative switch-position map |
| Figure 8 | Optimal switch-distribution map (two switches) | ||
| Figure 9 | Optimal switch-distribution map (three switches) | ||
| with contact | Figure 7 | Alternative switch-position map | |
| Figure 10 | Optimal switch-distribution map (four switches) | ||
| Figure 11 | Optimal switch-distribution map (five switches) | ||
| Example 2 (Actual feeder data in a certain place) | with contact | Figure 12 | Alternative switch-position map |
| Figure 13 | Optimal switch-distribution map |
5.2. Example 2
Table 4 lists the real feeder data of a certain place. The feeder is a connected feeder. The method in this study is used to optimise and compare the effects. The values of λ, t1, and t2 are the same as those in Example 1. The optimisation results are shown in Figure 13.
Table 5 lists the comparison of the results after optimisation of the comprehensive and single indexes after and before optimisation. The feeder is equipped with four segment switches before optimisation, which are arranged at the 2–4 and 11–14 standby power terminals and 7–11 and 16–20 main power supply terminals; ENS is 1.152 MW·h/year, and SAIDI is 0.2349 h/(house·year). The positions obtained by optimising using the comprehensive index by the method employed in the present study are shown in Figure 13, which are at the 4–7, 7–11, 14–16, and 16–20 standby power terminals and the 11–14 main power terminal. ENS is 0.8519 MW·h/year, and SAIDI is 0.1719 h/(household·year). Compared with the values before optimisation, only one more switch is installed, and ENS is reduced by 26.05%, SAIDI is reduced by 26.82%, and the comprehensive reliability index is reduced by 26.42%. We can observe that the reliability-index value is greatly reduced and the reliability is significantly improved.
Compared with the optimisation result under the SAIDI indicator, the optimisation result under the comprehensive indicator has slightly higher SAIDI but lower ENS. The two indicators are normalised and multiplied by their respective weights [W1 (SAIDI) = 0.5; W2 (ENS) = 0.5]. The obtained objective function value is lower, which is better. We can observe that the optimisation results under the comprehensive index are more comprehensive and reliable than that under the single index. Simultaneously, we prove that the method proposed in this paper can effectively optimise the number of switches under the ENS and SAIDI indexes and effectively optimise the number of switches under the comprehensive reliability index, which presents important applicability.
6. Conclusions
- (1)
- Considering the reliability and economy comprehensively, multiple switch positions are judged at the same time through the global combination criterion. Compared with the method of repeatedly iteratively optimizing and determining the switch position using the single switch criterion in literatures [28,29], it is not only more direct, and does not get stuck in a local optimum. When there is no tie switch in the first example, the method in this paper reduces the ENS by 2.47% compared with the literature [29], which effectively improves the utilization rate of the equipment.
- (2)
- This paper proposes to further optimize the number of switches based on the optimal switch position. In example 1, the ENS of this paper is reduced by 20.38% and 24.80% compared with the literature [28] and literature [29], respectively. In example 2, the comprehensive index of the method in this paper is reduced by 26.05%, SAIDI by 26.82%, and comprehensive reliability index by 26.42% compared with the ENS before optimization. It can be seen that it is obviously more reasonable to use the optimized optimal switch position data to determine the number of switches, which not only ensures the global optimum of the switch position, but also ensures the optimum number of switches, so that the reliability index value is greatly reduced and the reliability is significantly improved.
Author Contributions
W.C.: project administration, data curation, formal analysis, investigation, methodology; Z.L.: validation, writing—original draft; Y.L.: writing—review and editing. All authors have read and agreed to the published version of the manuscript.
Funding
This work was supported in part by the Academic Degrees and Graduate Education Reform Project of Henan Province (No.2021SJGLX078Y), the Key Scientific Research Projects Plan of Henan Higher Education Institutions (No.19A470006), and the Cultivation Plan of Young Backbone Teachers in Colleges and Universities of Henan Province (No.2019GGJS104).
Data Availability Statement
The data used to support the findings of this study are available from the corresponding author upon request.
Conflicts of Interest
The authors declare no conflict of interest.
References
- Zhang, W. Research on Index System and Evaluation Methods of Distribution Network Fault Outage Risk Assessment; North China Electric Power University: Beijing, China, 2014. (In Chinese) [Google Scholar]
- Heidari, A.; Agelidis, V.G.; Kia, M. Considerations of sectionalizing switches in distribution networks with distributed generation. IEEE Trans. Power Deliv. 2015, 30, 1401–1409. [Google Scholar] [CrossRef]
- Zhao, H.; Wang, Z.; Xie, K.; Li, W. Comparative study on reliability assessment methods for medium voltage distribution network. Electr. Power Autom. Equip. 2013, 37, 3295–3302. (In Chinese) [Google Scholar]
- Peng, H.; Zhang, J.; Wu, Y.; Sun, M.; Wang, Z. Segment optimization based on reliability index for mid voltage overhead eeder. Electr. Power Autom. Equip. 2017, 37, 184–190. (In Chinese) [Google Scholar]
- Alam, A.; Pant, V.; Das, B. Optimal placement of protective devices and switches in a radial distribution system with distributed generation. IET Gener. Transm. Distrib. 2020, 14, 4847–4858. [Google Scholar] [CrossRef]
- Wan, G.; Guo, X.; Ren, Z. Study on layout of disconnect switches of distributed system. Relay 2002, 30, 10–12. (In Chinese) [Google Scholar]
- Wan, G.; Ren, Z.; Jing, Y. Deployment of disconnected switches on main feeder. Proc. CSEE 2003, 23, 124–127+176. (In Chinese) [Google Scholar]
- Cao, H.; Chen, Y.; Wu, Y.; Gao, C.; Zhang, J.; Liu, Y. General quantitative expression of optimal segment number of MV feeder. Power Syst. Technol. 2019, 43, 2991–2997. (In Chinese) [Google Scholar]
- Sun, L.; Yang, H.; Ding, M. Mixed integer linear programming model of optimal placement for switching devices in distribution system. Autom. Electr. Power Syst. 2018, 42, 87–95. (In Chinese) [Google Scholar]
- Moradijoz, M.; Moradijoz, S.; Moghaddam, M.P.; Haghifam, M.R. Flexibility enhancement in active distribution networks through a risk-based optimal placement of sectionalizing switches. Reliab. Eng. Syst. Saf. 2020, 201, 106985. [Google Scholar] [CrossRef]
- Wang, C.; Pang, K.; Shahidehpour, M.; Wen, F.; Ren, H.; Liu, Z. Flexible Joint Planning of Sectionalizing Switches and Tie Lines Among Distribution Feeders. IEEE Trans. Power Syst. 2021, 37, 1577–1590. [Google Scholar] [CrossRef]
- Ma, S.; Su, L.; Wang, Z.; Qiu, F.; Guo, G. Resilience Enhancement of Distribution Grids Against Extreme Weather Events. IEEE Trans. Power Syst. 2018, 33, 4842–4853. [Google Scholar] [CrossRef]
- Zhang, M.; Qin, P.; Chen, Y.; He, S.; Wang, Z. Research on optimal configuration method of sectionalized and tie switches in low voltage distribution network. Power Capacit. React. Power Compens. 2020, 41, 138–144. [Google Scholar]
- Zhang, Y.; Hu, J. Application of self regulating genetic algorithm in optimal switch configuration of distribution network. Shanxi Electr. Power 2011, 5–8. [Google Scholar]
- Liu, L.; Jiang, X.; Cai, J.; Zheng, W. LCC oriented segmented optimization of medium voltage distribution network based on discrete particle swarm optimization. East China Power 2014, 42, 1684–1690. [Google Scholar]
- Xu, Y.; Liu, C.C.; Schneider, K.P.; Ton, D.T. Placement of remote-controlled switches to enhance distribution system restoration capability. IEEE Trans. Power Syst. 2015, 31, 1139–1150. [Google Scholar] [CrossRef]
- Liu, D. Reliability Analysis of Distribution Network and Research on Optimal Configuration of Section Switch and Fault Indicator; Beijing Jiaotong University: Beijing, China, 2015. [Google Scholar]
- Zhang, B.; Crossley, P. Reliability improvement using ant colony optimization applied to placement of sectionalizing switches. Energy Procedia 2017, 142, 2604–2610. [Google Scholar] [CrossRef]
- Yin, Y.; Zhang, G.; Ge, J.; Chu, K. Research on the optimization method of reliability index based on the configuration of the main feeder section switch of high-voltage distribution network. Tech. Autom. Appl. 2018, 37, 98–102+110. [Google Scholar]
- Yu, T.; Li, X. Optimal configuration of switches in distribution network based on LCC and improved BDE method. Electr. Meas. Instrum. 2015, 52, 96–100. [Google Scholar]
- Zhang, J.; Lin, H.; Cai, J. Research on Optimal Configuration of Rural Distribution Network Switches. Electrotech. Electric. 2015, 5–9, 15. [Google Scholar]
- Benavides, A.J.; Ritt, M.; Buriol, L.S.; França, P.M. An iterated sample construction with path relinking method: Application to switch allocation in electrical distribution networks. Comput. Oper. Res. 2013, 40, 24–32. [Google Scholar] [CrossRef]
- Wang, Z.; Luo, F.; Zhu, L.; Wei, Z. Mode segmentation and connection optimization configuration method for medium voltage distribution network. J. Electr. Power Syst. Autom. 2015, 27, 83–89. [Google Scholar]
- Zhang, T.; Wang, C.; Luo, F.; Li, P.; Yao, L. Optimal design of the sectional switch and tie line for the distribution network based on the fault incidence matrix. IEEE Trans. Power Syst. 2019, 34, 4869–4879. [Google Scholar] [CrossRef]
- Abiri-Jahromi, A.; Fotuhi-Firuzabad, M.; Parvania, M.; Mosleh, M. Optimized sectionalizing switch placement strategy in distribution systems. IEEE Trans. Power Deliv. 2011, 27, 362–370. [Google Scholar] [CrossRef]
- Jooshaki, M.; Karimi-Arpanahi, S.; Lehtonen, M.; Millar, R.J.; Fotuhi-Firuzabad, M. Electricity distribution system switch optimization under incentive reliability scheme. IEEE Access 2020, 8, 93455–93463. [Google Scholar] [CrossRef]
- Jooshaki, M.; Karimi-Arpanahi, S.; Lehtonen, M.; Millar, R.J.; Fotuhi-Firuzabad, M. Reliability-oriented electricity distribution system switch and tie line optimization. IEEE Access 2020, 8, 130967–130978. [Google Scholar] [CrossRef]
- Zhang, J. Research on Models and Algorithms of Sectionalizing Switch Placement of a Medium Voltage Overhead Line; Chongqing University: Chongqing, China, 2014. (In Chinese) [Google Scholar]
- Liao, Y.; Zhang, J.; Wang, Z.; Zhang, Y. Three-stage optimization algorithm for the sectionalizing switch placement of a medium voltage overhead line. Power Syst. Technol. 2018, 42, 3413–3419. (In Chinese) [Google Scholar]
- Liao, Y. Research on Three-Stage Optimization Methods of Switch Placement on a Medium Voltage Overhead Line; Chongqing University: Chongqing, China, 2018. (In Chinese) [Google Scholar]
Figure 1.
Optimal number of segments is affected by whether the switch position is optimal or not.
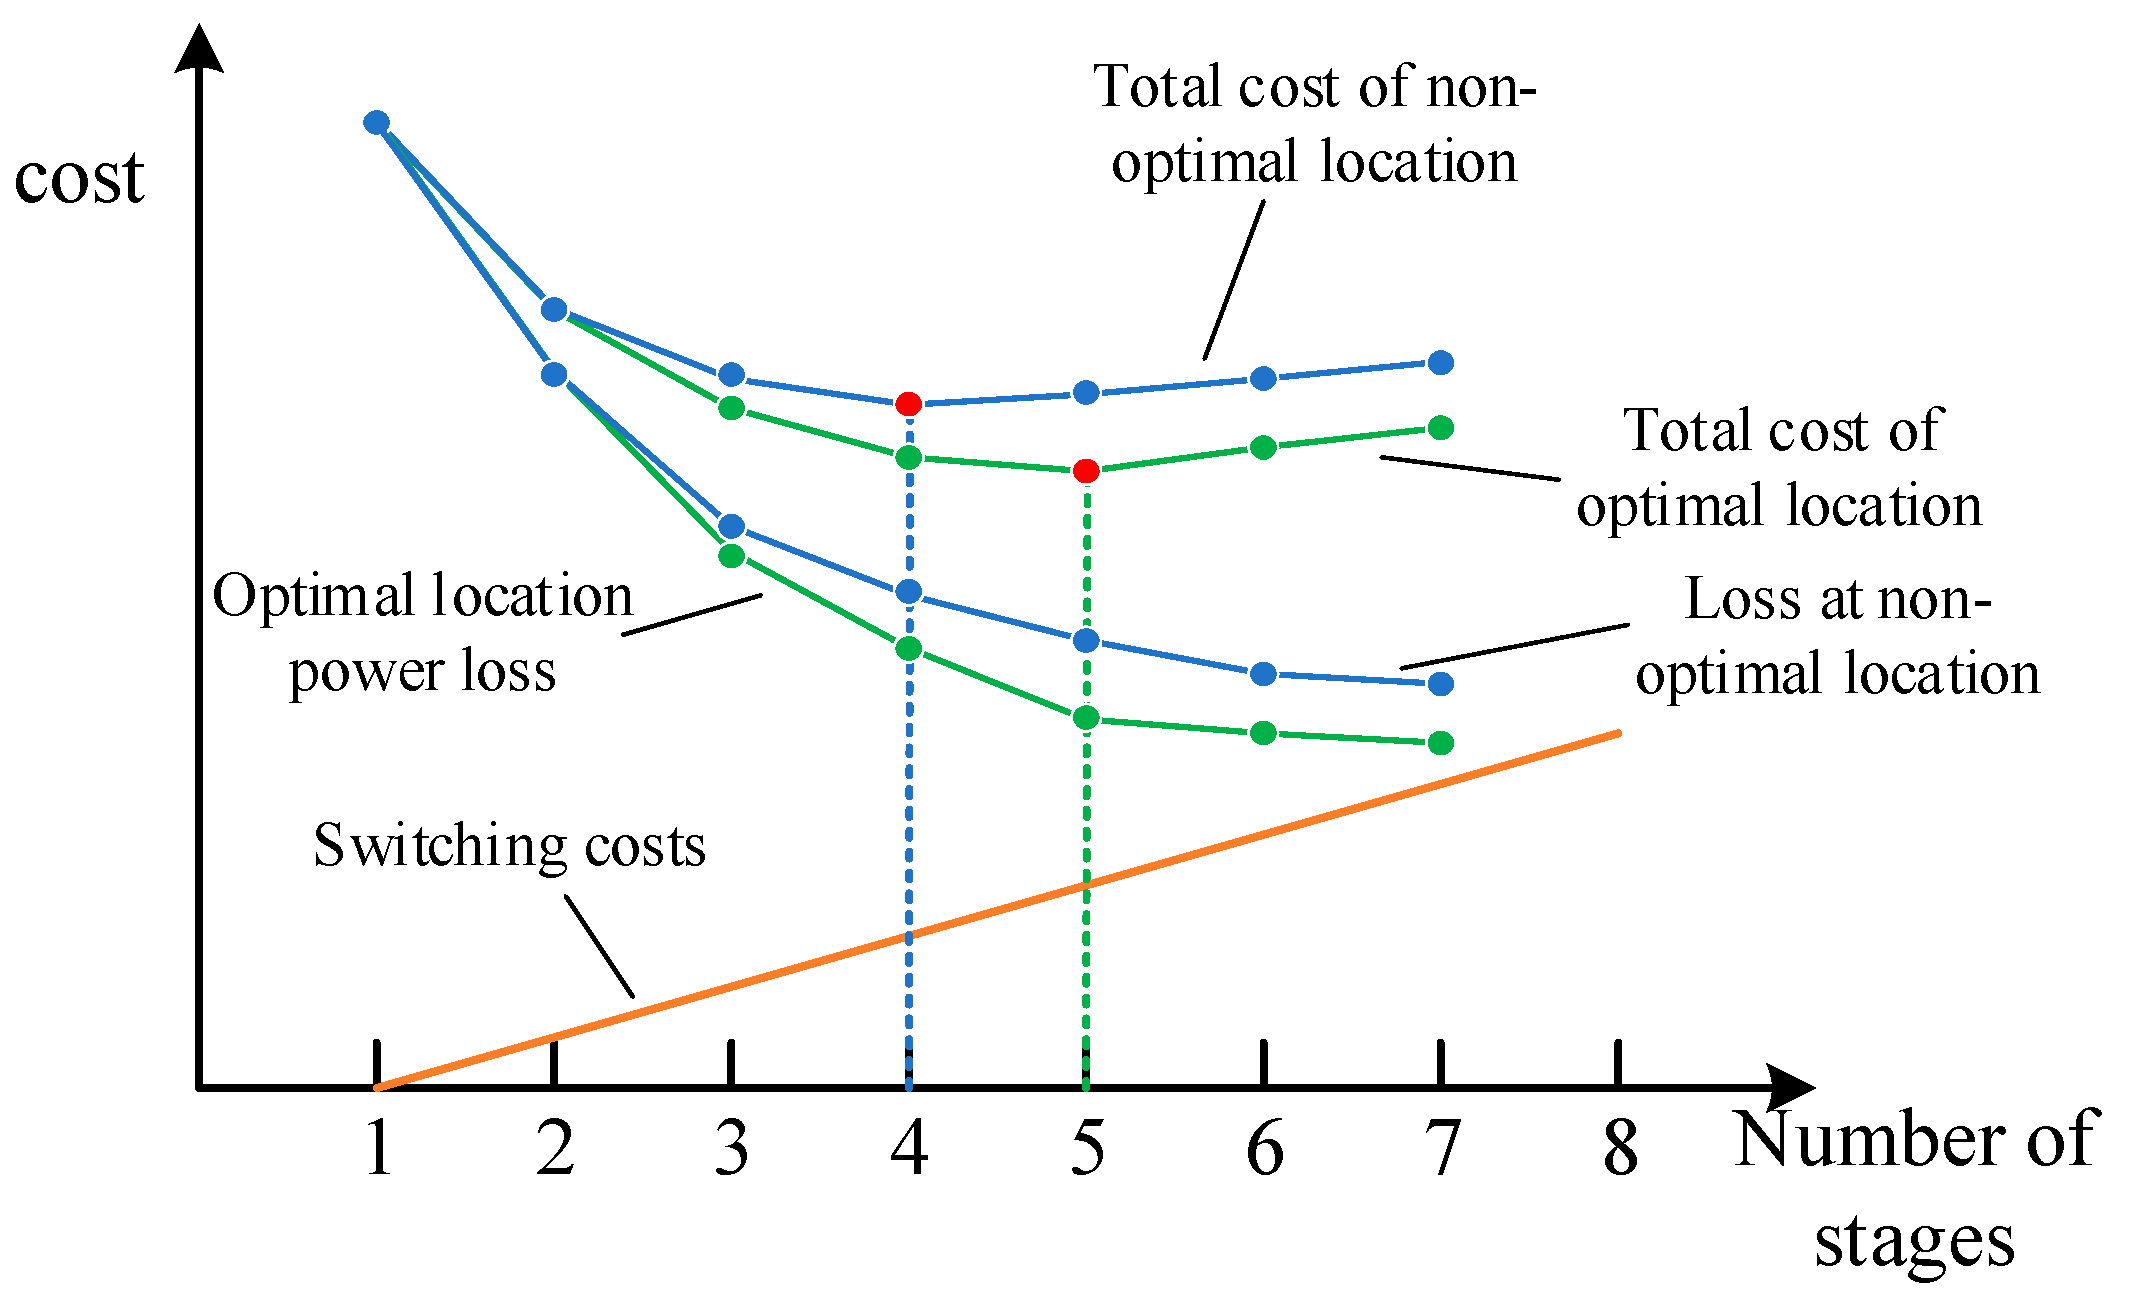
Figure 2.
Line segmentation diagram.

Figure 3.
Switch alternative-location diagram (no contact).
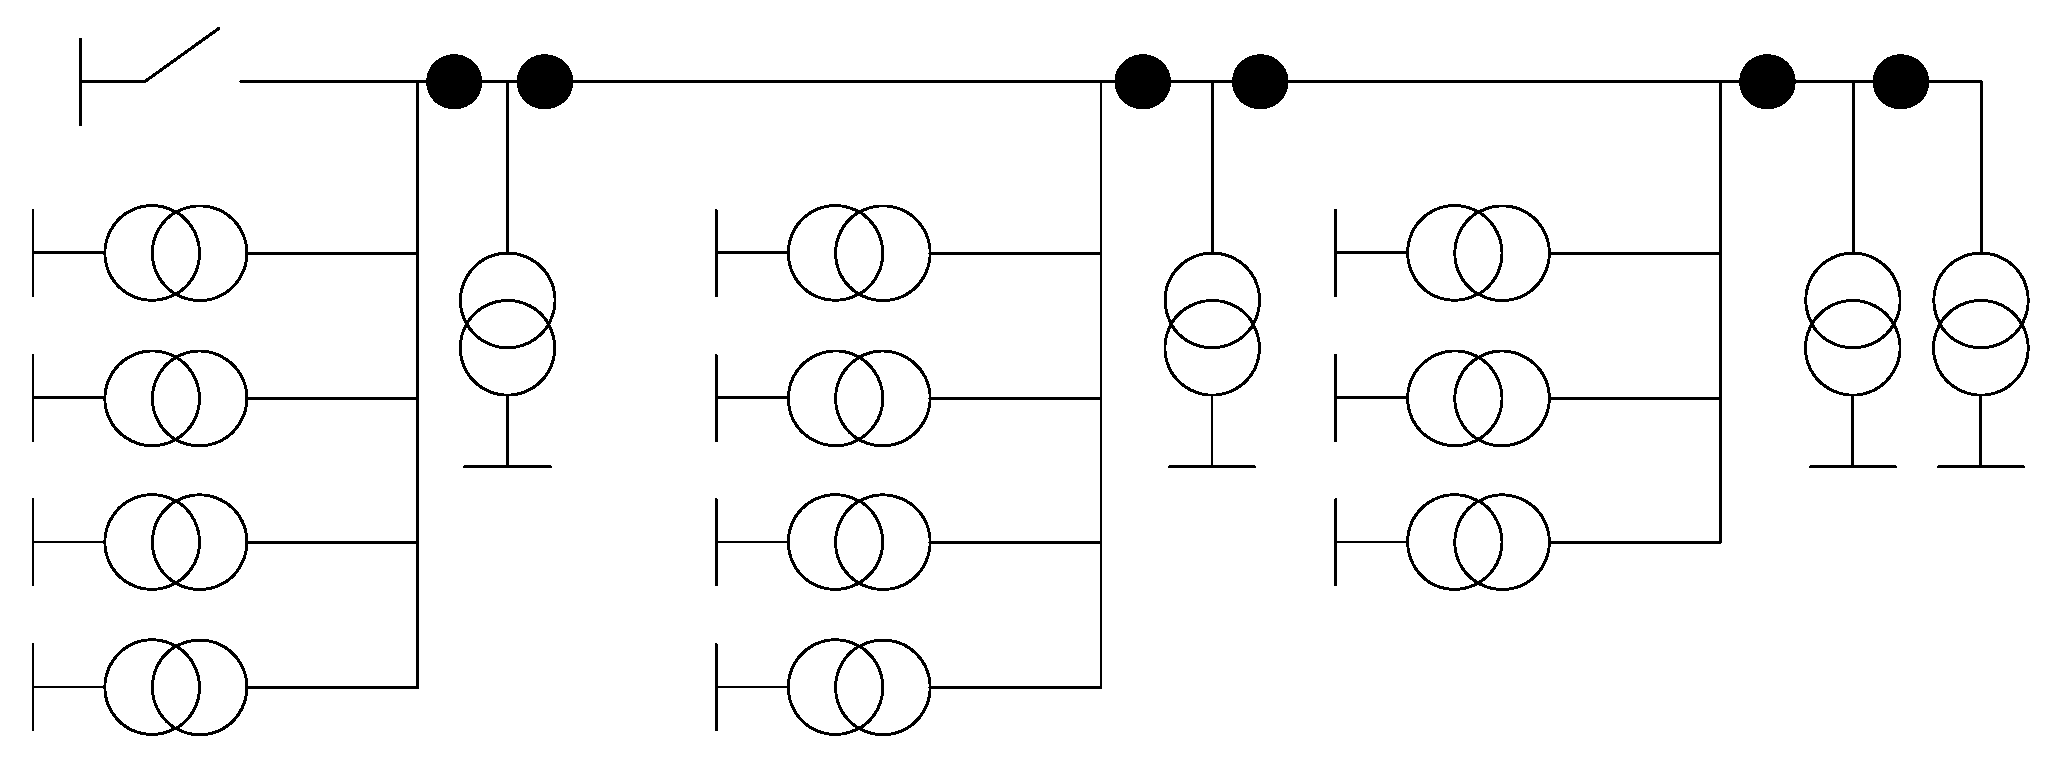
Figure 4.
Switch alternative-location diagram (with contact).

Figure 5.
Algorithm flowchart.
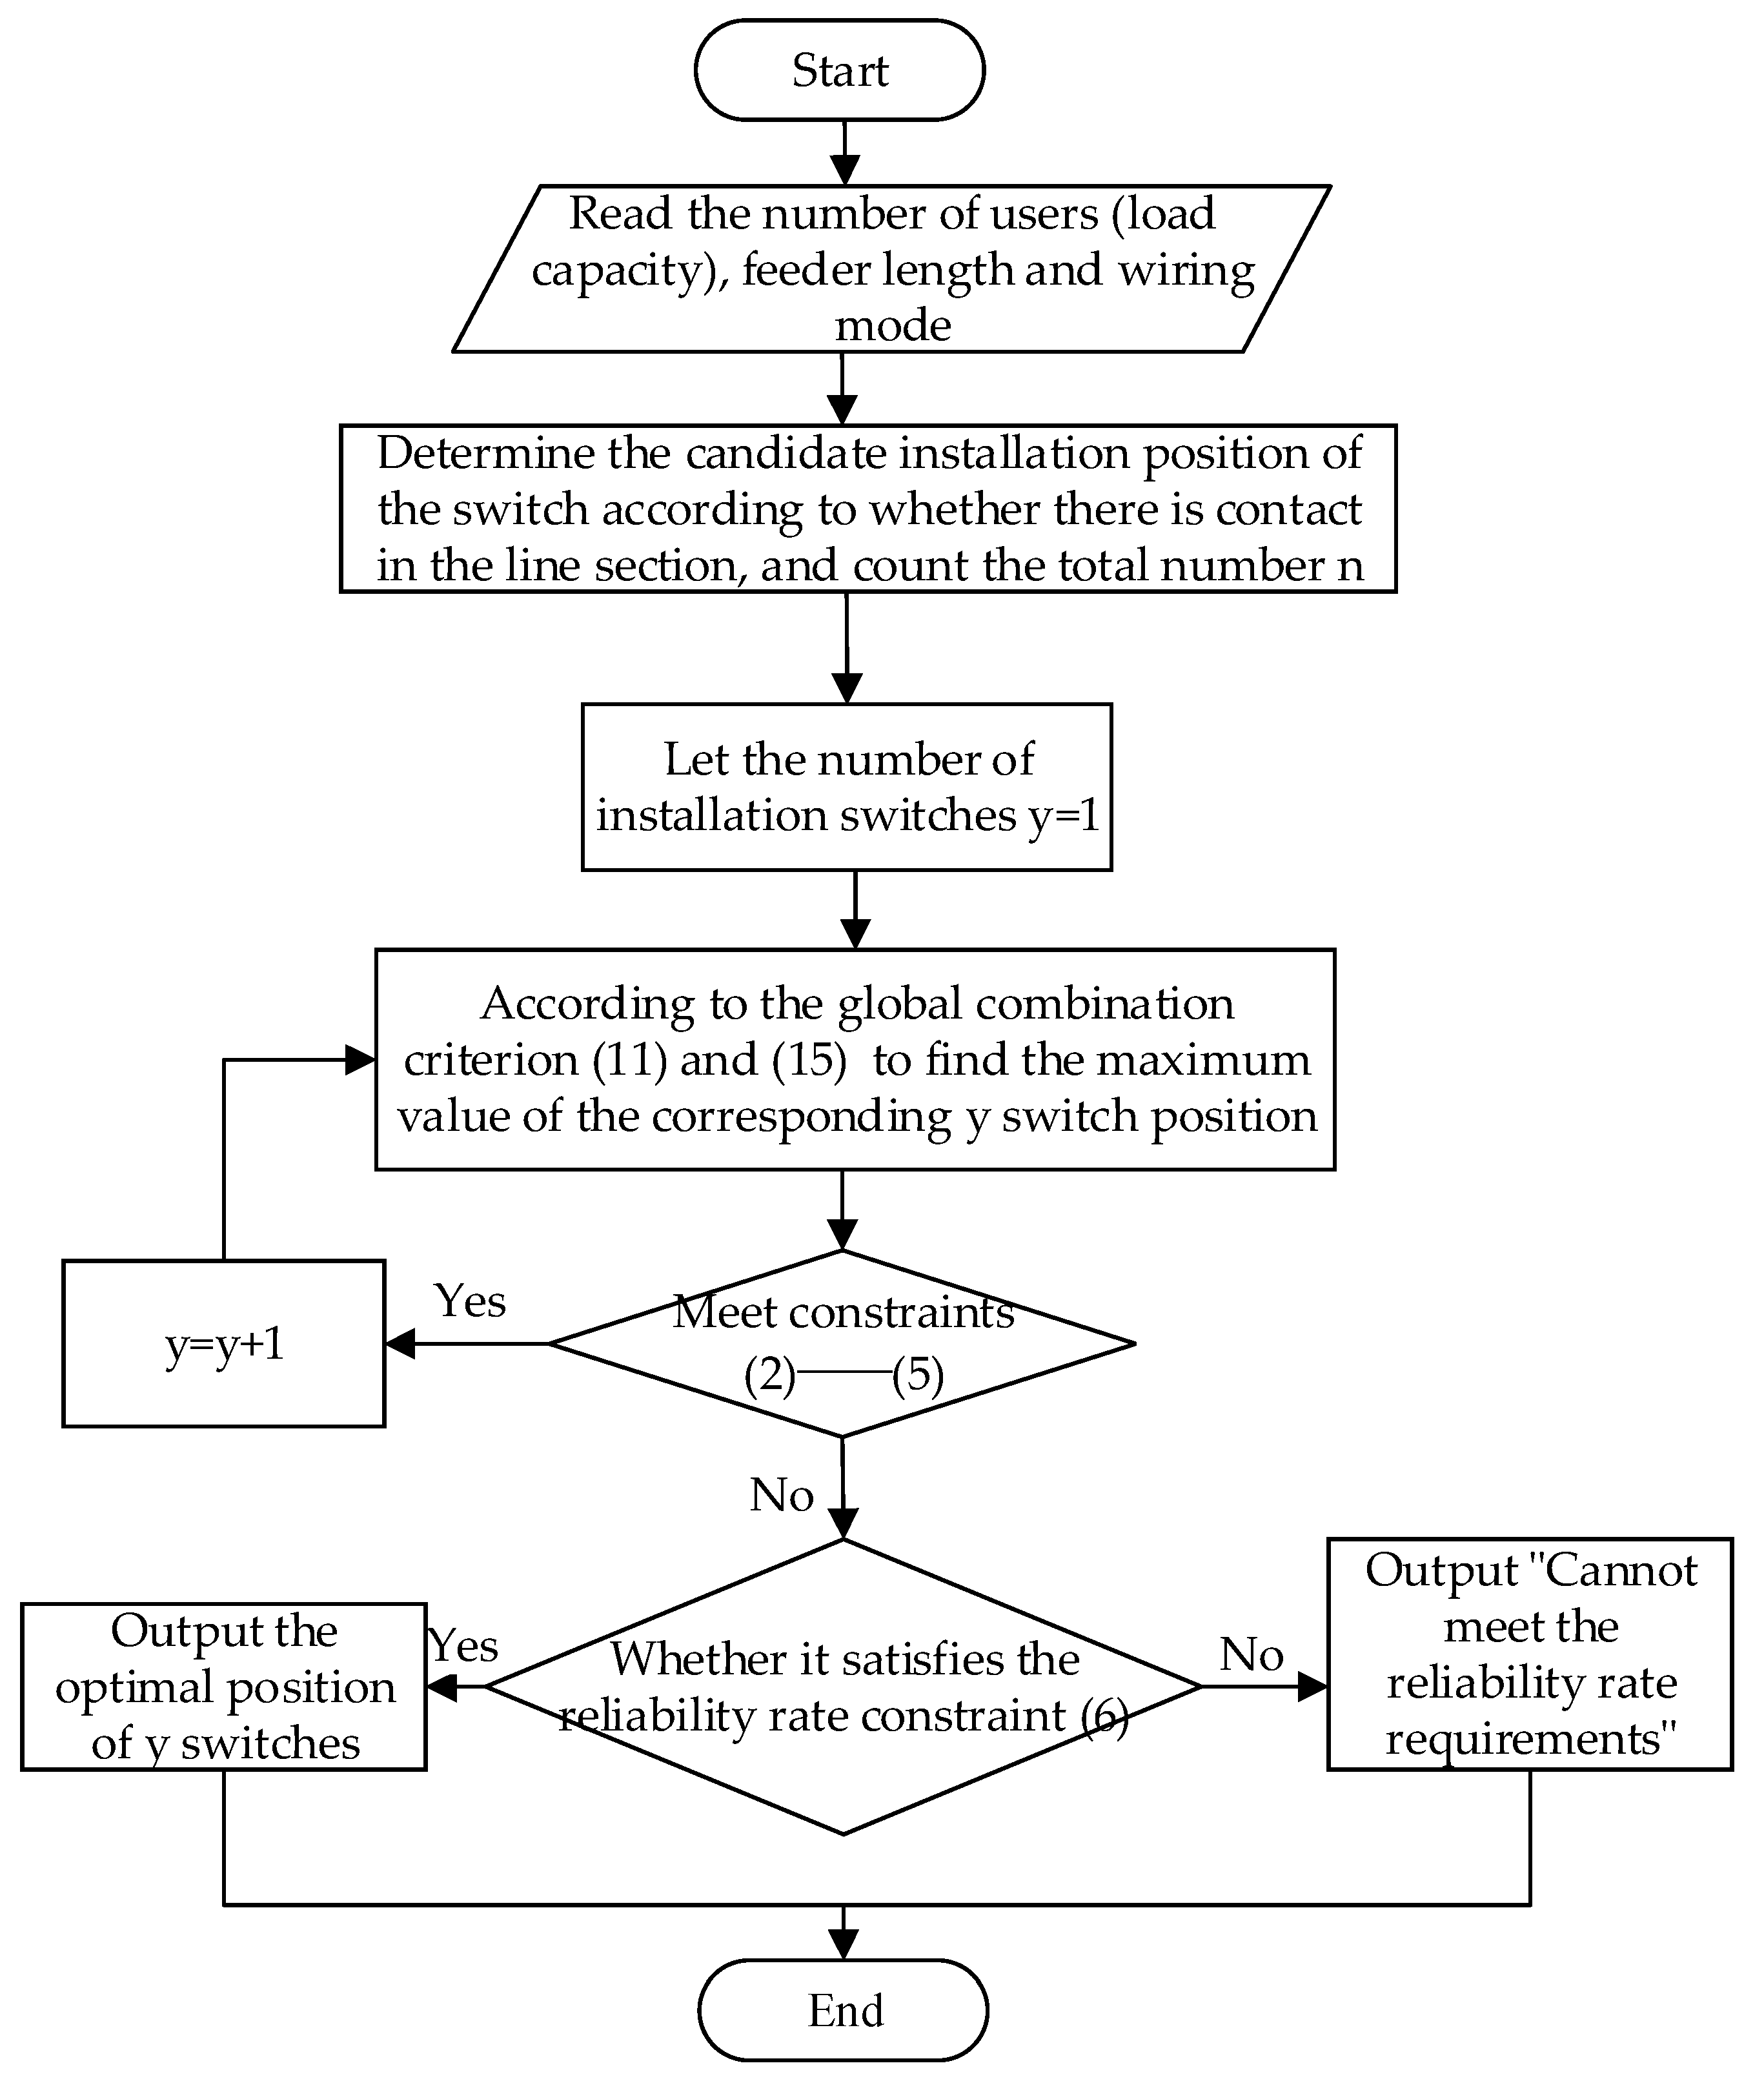
Figure 6.
Example 1: alternative switch-position map (no contact).

Figure 7.
Example 1: alternative switch-position map (with contact).

Figure 8.
Example 1: optimal switch-distribution map (no contact, two switches).

Figure 9.
Example 1: optimal switch-distribution map (no contact, three switches).
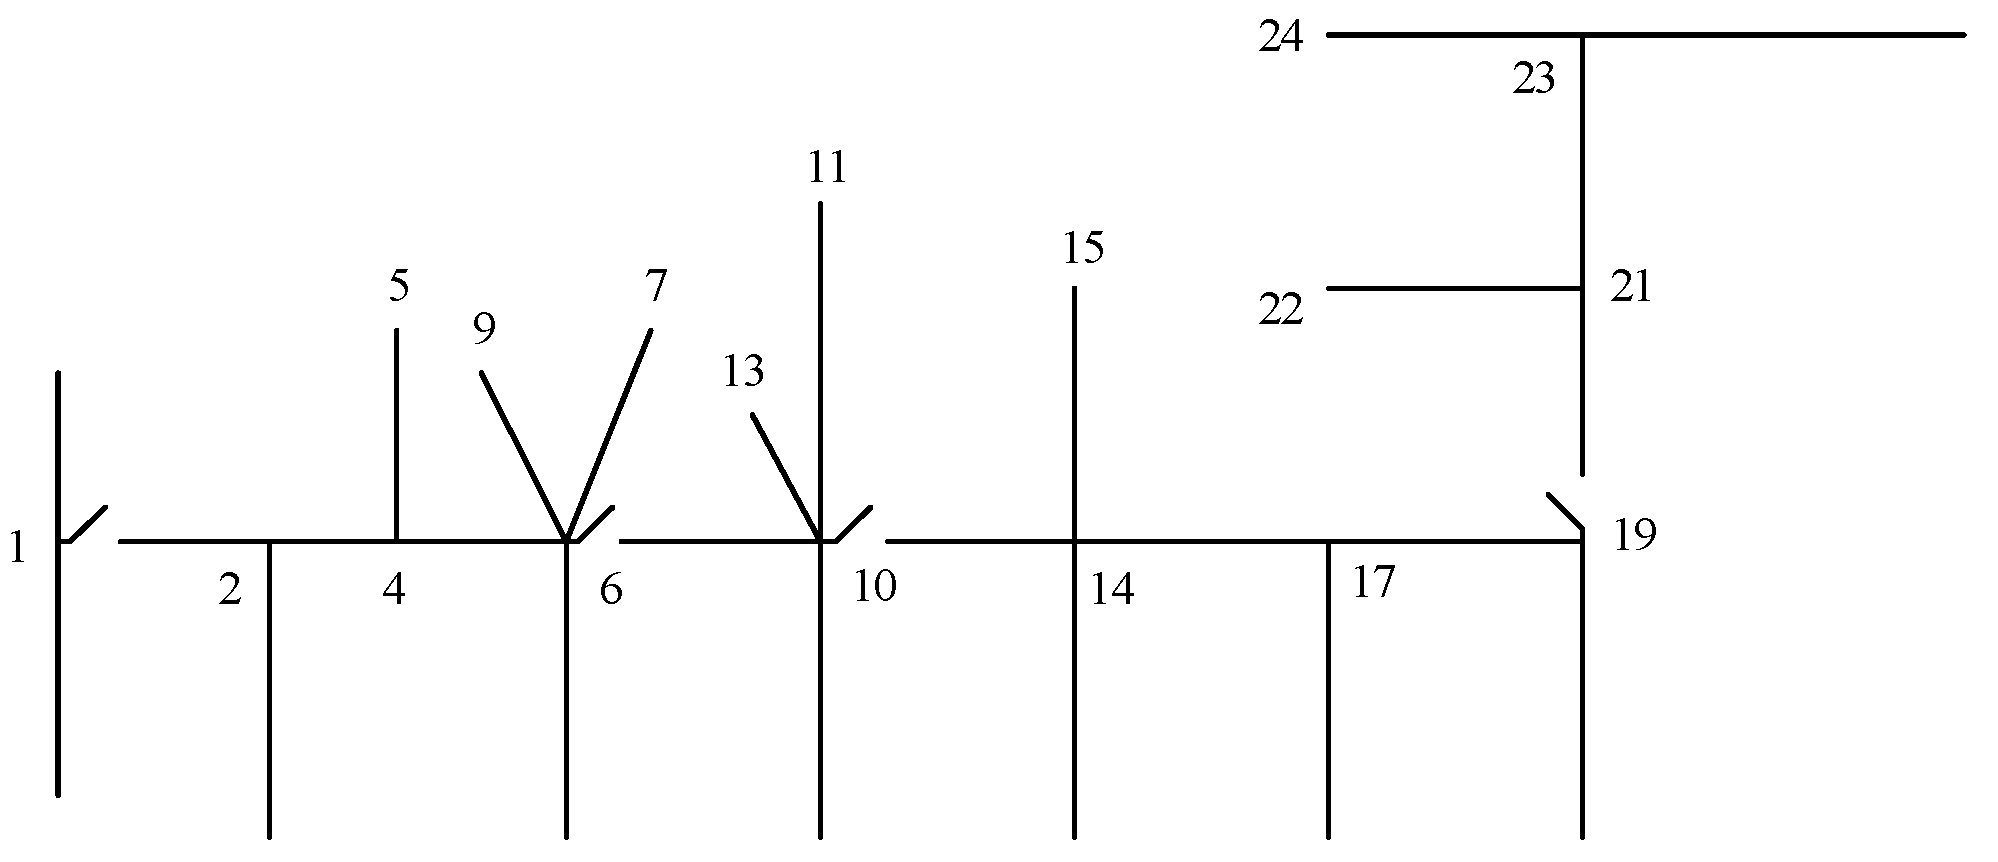
Figure 10.
Example 1: optimal switch-distribution map (with contact, four switches).
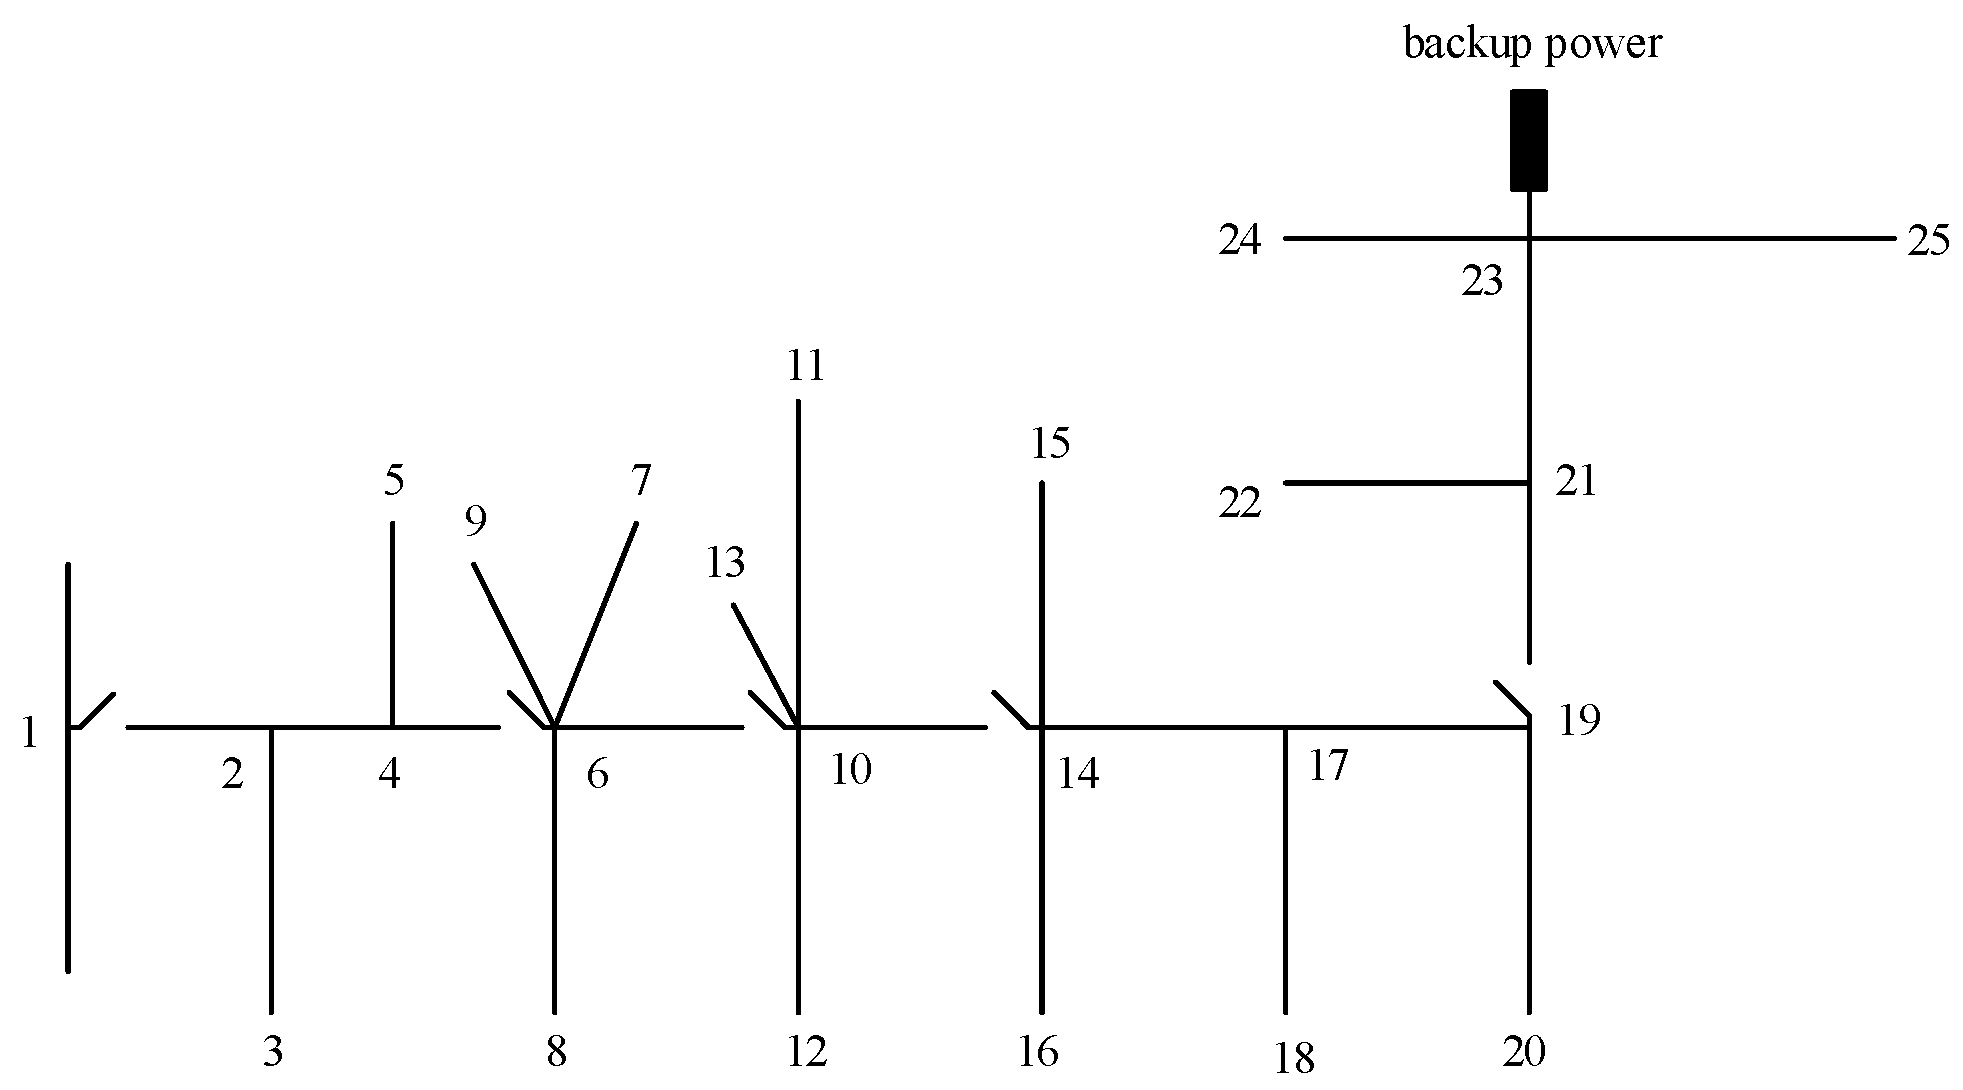
Figure 11.
Example 1: optimal switch-distribution map (with contact, five switches).

Figure 12.
Example 2: alternative switch-position map (with contact).
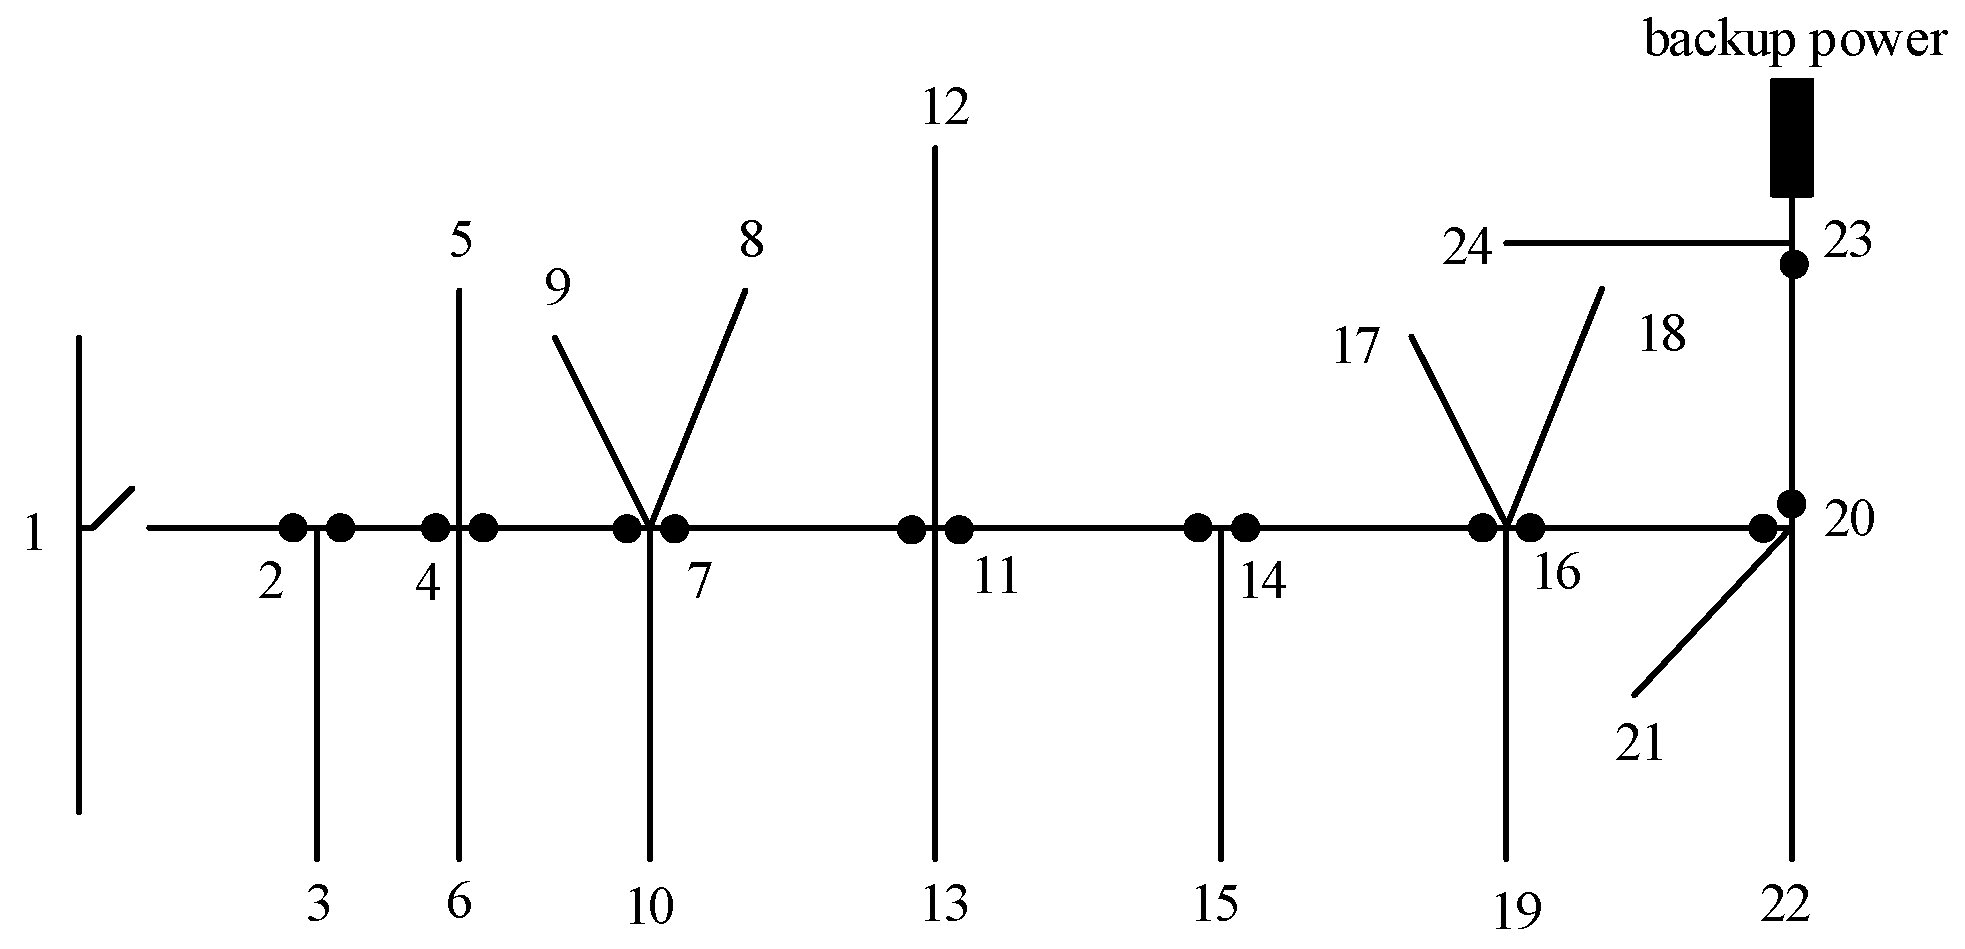
Figure 13.
Example 2: optimal switch-distribution map (with contact).
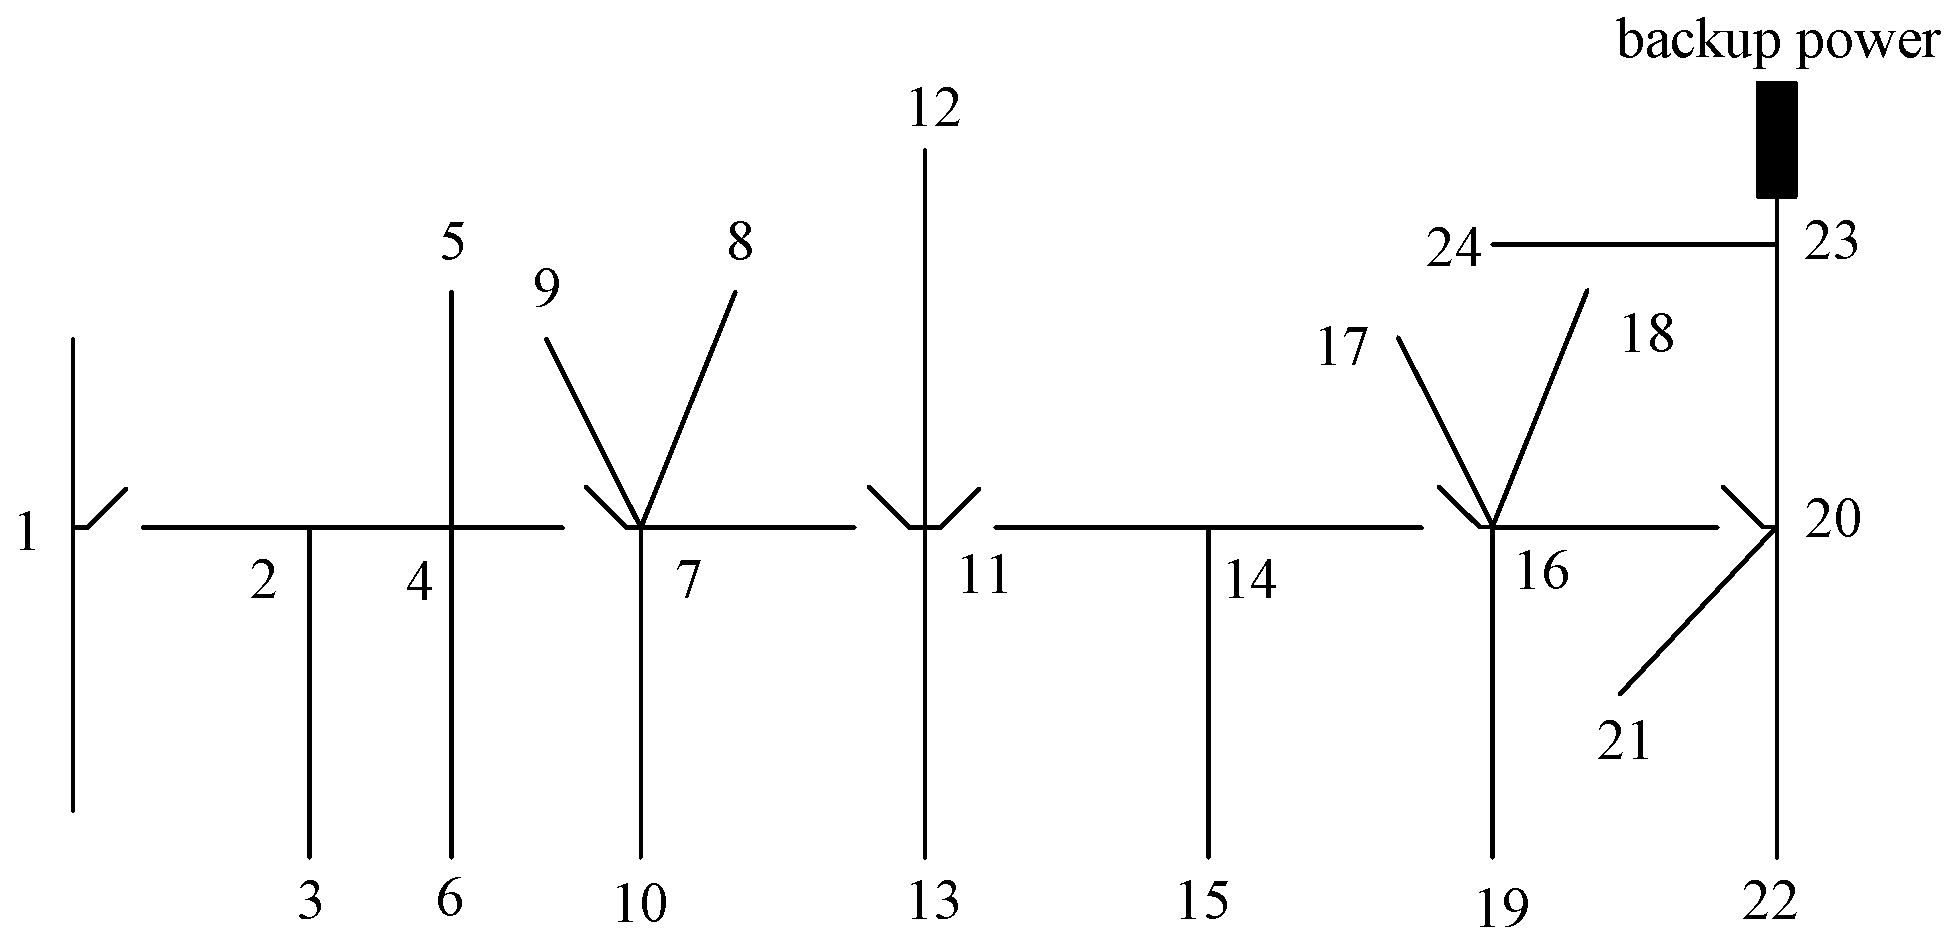
Table 1.
Piece of the actual feeder data.
| Starting Point | End | Line Length (km) | Load (kW) |
|---|---|---|---|
| 1 | 2 | 0.403 | |
| 2 | 3 | 0.120 | 192 |
| 2 | 4 | 0.524 | |
| 4 | 5 | 0.480 | 201 |
| 4 | 6 | 0.610 | |
| 6 | 7 | 0.000 | 134 |
| 6 | 8 | 0.220 | 201 |
| 6 | 9 | 0.000 | 128 |
| 6 | 10 | 0.263 | |
| 10 | 11 | 0.000 | 201 |
| 10 | 12 | 0.936 | 639 |
| 10 | 13 | 0.815 | 361 |
| 10 | 14 | 0.583 | |
| 14 | 15 | 0.000 | 658 |
| 14 | 16 | 0.400 | 201 |
| 14 | 17 | 0.195 | |
| 17 | 18 | 0.000 | 383 |
| 17 | 19 | 0.200 | |
| 19 | 20 | 0.200 | 639 |
| 19 | 21 | 0.204 | |
| 21 | 22 | 0.140 | 255 |
| 21 | 23 | 0.604 | |
| 23 | 24 | 0.000 | 255 |
| 23 | 25 | 0.400 | 243 |
Table 2.
Example 1: comparison of the switch position-optimisation result.
| Wiring Mode | Method | Switch Position | ENS (MW·h/Year) |
|---|---|---|---|
| No contact | Present study | 10–14 Power terminal 19–21 Power terminal | 3.851 |
| Reference [14] | 6–10 Power terminal 14–17 Power terminal | 3.900 | |
| Present study | 6–10 Power terminal 10–14 Power terminal 19–21 Power terminal | 3.593 | |
| Reference [15] | 4–6 Power terminal 10–14 Power terminal 19–21 Power terminal | 3.684 | |
| With contact | Present study | 4–6 Standby power terminal 6–10 Standby power terminal 10–14 Standby power terminal 19–21 Main power terminal | 1.013 |
| Reference [14] | 4–6 Standby power terminal 6–10 Standby power terminal 10–14 Main power terminal 17–19 Standby power terminal | 1.055 | |
| Reference [15] | 4–6 Standby power terminal 10–14 main power terminal 10–14 Standby power terminal 19–21 Main power terminal | 1.117 |
Table 4.
Piece of real feeder data in a certain place.
| Starting Point | End | Line Length (km) | Load (kW) | Number of Users (Household) |
|---|---|---|---|---|
| 1 | 2 | 0.604 | ||
| 2 | 3 | 0.204 | 204 | 53 |
| 2 | 4 | 0.420 | ||
| 4 | 5 | 0.000 | 142 | 41 |
| 4 | 6 | 0.231 | 246 | 72 |
| 4 | 7 | 0.368 | ||
| 7 | 8 | 0.000 | 436 | 137 |
| 7 | 9 | 0.273 | 234 | 83 |
| 7 | 10 | 0.852 | 174 | 66 |
| 7 | 11 | 0.497 | ||
| 11 | 12 | 0.000 | 387 | 132 |
| 11 | 13 | 0.465 | 589 | 203 |
| 11 | 14 | 0.373 | ||
| 14 | 15 | 0.742 | 628 | 258 |
| 14 | 16 | 0.405 | ||
| 16 | 17 | 0.295 | 291 | 139 |
| 16 | 18 | 0.000 | 336 | 115 |
| 16 | 19 | 0.300 | 283 | 93 |
| 16 | 20 | 0.520 | ||
| 20 | 21 | 0.000 | 335 | 102 |
| 20 | 22 | 0.380 | 278 | 92 |
| 20 | 23 | 0.434 | ||
| 23 | 24 | 0.000 | 377 | 127 |
Table 5.
Example 2: comparison of the switch-position optimisation results.
| Considered Indicators | Switch Position | SAIDI (h/ (Household Year)) | ENS (MW·h/ Year) | Value of the Objective Function under the Composite Indicator (Normalised) |
|---|---|---|---|---|
| Optimal under comprehensive index | 4–7 Standby power terminal 7–11 Standby power terminal 11–14 Main power terminal 14–16 Standby power terminal 16–20 Standby power terminal | 0.1719 | 0.8519 | 0.155902 |
| Optimal under ENS index | 4–7 Standby power terminal 7–11 Standby power terminal 11–14 Main power terminal 14–16 Standby power terminal 16–20 Standby power terminal | 0.1719 | 0.8519 | 0.155902 |
| Optimum under SAIDI | 4–7 Standby power terminal 7–11 Standby power terminal 11–14 Main power terminal 14–16 Standby power terminal 16–20 Power terminal | 0.1707 | 0.8582 | 0.155938 |
| Before optimisation | 2–4 Standby power terminal 7–11 Main power terminal 11–14 Standby power terminal 16–20 Main power terminal | 0.2349 | 1.152 | 0.211868 |
Publisher’s Note: MDPI stays neutral with regard to jurisdictional claims in published maps and institutional affiliations. |
© 2022 by the authors. Licensee MDPI, Basel, Switzerland. This article is an open access article distributed under the terms and conditions of the Creative Commons Attribution (CC BY) license (https://creativecommons.org/licenses/by/4.0/).
Share and Cite
MDPI and ACS Style
Cao, W.; Li, Z.; Li, Y. Optimisation Configuration of Overhead-Line Segmentation Switch of a Distribution Network Based on Global Combination Criterion. Processes 2022, 10, 1976. https://doi.org/10.3390/pr10101976
AMA Style
Cao W, Li Z, Li Y. Optimisation Configuration of Overhead-Line Segmentation Switch of a Distribution Network Based on Global Combination Criterion. Processes. 2022; 10(10):1976. https://doi.org/10.3390/pr10101976
Chicago/Turabian StyleCao, Wensi, Zhaohui Li, and Yuxiang Li. 2022. "Optimisation Configuration of Overhead-Line Segmentation Switch of a Distribution Network Based on Global Combination Criterion" Processes 10, no. 10: 1976. https://doi.org/10.3390/pr10101976
Note that from the first issue of 2016, this journal uses article numbers instead of page numbers. See further details here.