Review

Hydrogen Production from Biomass and Organic Waste Using Dark Fermentation: An Analysis of Literature Data on the Effect of Operating Parameters on Process Performance

1
Chemical Processes and Materials Group, School of Engineering, University of Aberdeen, Aberdeen AB24 3UE, UK
2
Department of Statistics, The Higher Institute of Applied and Economic Sciences (ISSAE-CNAM), Beirut 1103 2100, Lebanon
*
Author to whom correspondence should be addressed.
Processes 2022, 10(1), 156; https://doi.org/10.3390/pr10010156
Submission received: 13 December 2021 / Revised: 9 January 2022 / Accepted: 10 January 2022 / Published: 13 January 2022
(This article belongs to the Topic Anaerobic Digestion Processes)

Abstract

:
In the context of hydrogen production from biomass or organic waste with dark fermentation, this study analysed 55 studies (339 experiments) in the literature looking for the effect of operating parameters on the process performance of dark fermentation. The effect of substrate concentration, pH, temperature, and residence time on hydrogen yield, productivity, and content in the biogas was analysed. In addition, a linear regression model was developed to also account for the effect of nature and pretreatment of the substrate, inhibition of methanogenesis, and continuous or batch operating mode. The analysis showed that the hydrogen yield was mainly affected by pH and residence time, with the highest yields obtained for low pH and short residence time. High hydrogen productivity was favoured by high feed concentration, short residence time, and low pH. More modest was the effect on the hydrogen content. The mean values of hydrogen yield, productivity, and content were, respectively, 6.49% COD COD−1, 135 mg L−1 d−1, 51% v/v, while 10% of the considered experiments obtained yield, productivity, and content of or higher than 15.55% COD COD−1, 305.16 mg L−1 d−1, 64% v/v. Overall, this study provides insight into how to select the optimum operating conditions to obtain the desired hydrogen production.

1. Introduction

Anaerobic digestion (AD) is an established process used across the world for the conversion of biomass and organic waste into methane, a renewable energy vector [1,2,3]. While the use of AD to produce methane is an established commercial process, to the best of our knowledge, there are, to date, no full-scale processes in which AD, also called dark fermentation (DF) in this case, is used for the primary purpose to produce the intermediates of the process, i.e., hydrogen and short-chain organic acids (SCOAs). This is despite the large volume of recent research, at lab or pilot scale, on DF to produce these intermediates [4].
Anaerobic digestion consists of several steps. Hydrolysis of polymeric biomass components, e.g., proteins, to their monomers is the first step and is often rate limiting [4]. During the second step, also called acidogenesis, various compounds (hydrogen, SCOAs, alcohols) are produced as intermediates. Generally, in conventional AD, these compounds are converted to methane in the final step of methanogenesis. However, the intermediates produced in the second step can be more economically valuable than the end product methane [5].
This study focuses on the use of AD or DF to produce hydrogen. Hydrogen gas is considered a replacement for fossil fuels in the future because of its environmental and socio-economic advantages [6]. To date, hydrogen has been produced at a commercial scale at global rates, in the order of 50 million tons per year, and is mainly used in chemical synthesis, e.g., for ammonia and methanol synthesis and hydrogenation reactions. There is increasing interest in the use of hydrogen as a renewable energy vector when produced from water electrolysis using renewable electricity. However, currently, most of the hydrogen produced comes from natural gas, which is a non-renewable, therefore non-sustainable, fossil resource, at least in the medium-to-long term [7].
The production of hydrogen from DF of biomass or organic waste has several environmental advantages, compared with its production from natural gas or from water electrolysis. Compared with the use of natural gas, DF uses renewable resources or, even better, wastes that need to be treated. To produce hydrogen, the DF of organic waste can represent the first stage of the waste treatment and valorisation process. In addition, and in contrast with the chemical synthesis of hydrogen from natural gas (steam methane reforming), DF uses mild temperatures close to ambient values and does not need the external addition of metal catalysts, with clear environmental benefits. Compared with the use of water electrolysis, DF is less energy intensive. Considering several renewable energy scenarios for the UK, our recent study has shown that energy from organic waste, including hydrogen production from DF, could potentially provide up to ~30% of the heating and transport energy in this country [8].
However, despite the potential environmental benefits, hydrogen production from DF of biomass and organic waste is still limited at the lab or pilot scale [9]. In order to have a successful commercial process, it is necessary to maximise the hydrogen yield, productivity, and content in the fermentation gas. High yield is important to maximise the hydrogen produced from a given mass of biomass/waste. High volumetric productivity corresponds to a high hydrogen production rate per unit volume of the reactor and is therefore essential to minimise the volume of the equipment and the capital costs of the process. Hydrogen content in the fermentation gas should also be maximised to minimise the separation costs due to the removal of other components, usually mainly carbon dioxide.
Many process parameters can affect hydrogen yield, productivity, and content. The feedstock concentration is expected to affect hydrogen productivity while potentially also affecting the yield because of inhibition effects. The residence time can affect the extent of biomass degradation and the possible conversion of hydrogen into methane by methanogenic microorganisms. The residence time also can directly affect the process productivity. As with any other biological process, DF can be affected by pH and temperature.
This study aims to analyse literature data on hydrogen production from DF, investigating the effect of the main process parameters, i.e., feedstock concentration, residence time, pH, and temperature on hydrogen yield, productivity, and content in the fermentation gas. The study aims to develop a quantitative analysis of the data, also using a statistical multi-linear regression model. Overall, this study contributes to understanding which parameters are more important in determining the performance of DF and provides insight into how to choose the process parameters to obtain the desired performance.

2. Materials and Methods

2.1. Data Prospection

Articles were researched using the words ‘organic waste’, ‘dark fermentation’, and ‘hydrogen gas’, then filtering all those which could provide enough information on the process conditions and data results, to be able to evaluate the parameters of interest. The list of all the studies considered, with the operational parameters investigated, and analysed process parameters, is reported in Table S1 of the Supplementary Materials [10,11,12,13,14,15,16,17,18,19,20,21,22,23,24,25,26,27,28,29,30,31,32,33,34,35,36,37,38,39,40,41,42,43,44,45,46,47,48,49,50,51,52,53,54,55,56,57,58,59,60,61,62,63,64].
After data collection, 55 articles (339 experiments) were used to analyse the effect on hydrogen yield (% COD COD−1), hydrogen productivity (mg L−1 d−1), and hydrogen content (% v/v) of various experimental parameters—namely, operation mode, substrate composition, substrate concentration or total chemical oxygen demand (tCOD gCOD L−1), experimental length for batch mode experiments, and hydraulic retention time for a continuous mode, which were merged into one parameter named residence time (d), temperature (°C), pH, inoculum pretreatment or methanogens inhibition, and substrate pretreatment. Hydrogen yield was defined as the hydrogen produced per unit of substrate fed (% COD COD−1). Hydrogen productivity was defined as the hydrogen produced per unit reactor volume per unit time (mg L−1 d−1), and hydrogen content was defined as the hydrogen content in the biogas (% v/v).
In the calculation of the yield in COD units, hydrogen was converted using the factor 8 g COD g H2−1, derived from the stoichiometry of hydrogen oxidation. When the COD of the feedstock was not reported in the papers, it was estimated from the composition of the feedstocks (Table 1).

2.2. Regression Modelling and Statistical Analysis

The normality of the hydrogen yields, hydrogen productivity, and content was carried out using the Anderson–Darling test. The test is appropriate to test normality for relatively large samples sizes (n) (i.e., larger than 10). The Anderson–Darling test rejects the hypothesis of normality when the p-value is less than or equal to 0.05.
Non-parametric tests (the Kendall rank test for continuous variable and the Kruskal–Wallis rank test for categorical variables) were performed to check if there is a significant relationship between the dependent (hydrogen yield, productivity, and content) and independent variables (temperature, pH, residence time, substrate concentration, substrate type, substrate pretreatment, and methanogens’ inhibition). The data coding of each independent variable are listed as follow:
  • Operating mode: continuous (CN), batch (BA);
  • Residence time (RT): RT1 ≤ 2 d, 2 d < RT2 ≤ 10 d, RT3 > 10 d;
  • Substrate concentration as total chemical oxygen demand (tCOD);
  • Substrate type: soluble substrates (SS) made up of single substrates or synthetic models of wastewaters, non-soluble substrates (SNS) made up of biomass, sludge, or organic/food waste;
  • Pretreatment of the substrate: yes (SY), no (SN);
  • Methanogens’ inhibition: yes (IY), no (IN);
  • Temperature: mesophilic (Tm), thermophilic (Tt);
  • pH: acidic (pHa < 6), neutral (6 ≤ pHn ≤ 8), alkaline (pHb > 8).
Total chemical oxygen demand is the only continuous independent variable, and the other 7 independent variables are categorial. These categorical variables take values of 0 or 1.
The relationship between the continuous variable tCOD with hydrogen yield, content, and productivity was tested with Kendall’s tau test, to understand the strength of the relationship between the two variables. Kendall’s tau-b (τb) correlation coefficient is a non-parametric measure of the association that exists between two variables and identifies its direction, either negative or positive, on at least an ordinal scale. Kendall’s tau-b values are divided into the following four categories:
  • τb < ±0.10, very weak;
  • ±0.10 < τb < 0.19, weak;
  • ±0.20 < τb < 0.29, moderate;
  • ≥−0.30, strong.
The relationship between the categorical variables (pH, temperature, residence time, substrate type, substrate pretreatment, and methanogens’ inhibition) with hydrogen yield, productivity, and content was tested with Kruskal–Wallis one-way analysis of variance test by ranks. The test compares two or more independent variables from identical or different sample sizes and identifies whether the samples are originally from the same or from a different distribution. Kendall’s tau-b and Kruskal–Wallis constitute one of the bivariate analysis forms of quantitative analysis (or non-parametric analysis) (Table S2).
Afterwards, modelling was performed to correlate the effect of each operating parameter (independent variables) with hydrogen yield (% COD COD−1), hydrogen productivity (mg L−1 d−1), and hydrogen content (% v/v) as a response (dependent variables). The general linear model was performed using RStudio software 4.1.2 and calculated according to the ‘ellipse’ model (Table S3). The initial full regression model was developed according to Equation (1).
Y = Constant + A1 × pHa + A2 × pHn + A3 × pHb + B1 × Tm + B2 × Tt + C × tCOD + D1 × SS + D2 × SNS + E1 × SN + E2 × SY + F1 × IN + F2 × IY + G1 × BA + G2 × CN + I1 × RT1 + I2 × RT2 + I3 × RT3
where A1, A2, A3, B1, B2, C, D1, D2, E1, E2, F1, F2, G1, G2, I1, I2, and I3 represent the model coefficients, which take the same unit as the dependent variable yield, productivity, and content.
To choose the best fit model, a backward elimination approach was used, starting with all independent variables, removing each variable one by one each time. The most statistically insignificant variables were removed first, and their loss did not affect the model fit. The process was repeated until no further variables can be removed without significantly and statistically altering the model fit. The significance of the variables was determined depending on the p-value. This later was divided into the following five categories:
-
Highly significant ‘***’: 0 ≤ p-value < 0.001;
-
Fairly significant ‘**’: 0.001 ≤ p-value < 0.01;
-
Significant ‘*’: 0.01 ≤ p-value < 0.05;
-
Non-significant ‘’: 0.05 ≤ p-value < 0.1;
-
Highly non-significant ‘no symbol’: p-value ≥ 0.1.

3. Results and discussion

3.1. General Observation and Descriptive Statistics

Table 2 shows various types of substrates used in the considered studies in the literature. The most frequent type of substrates was pure substrates, followed by biomass, food waste, and organic waste.

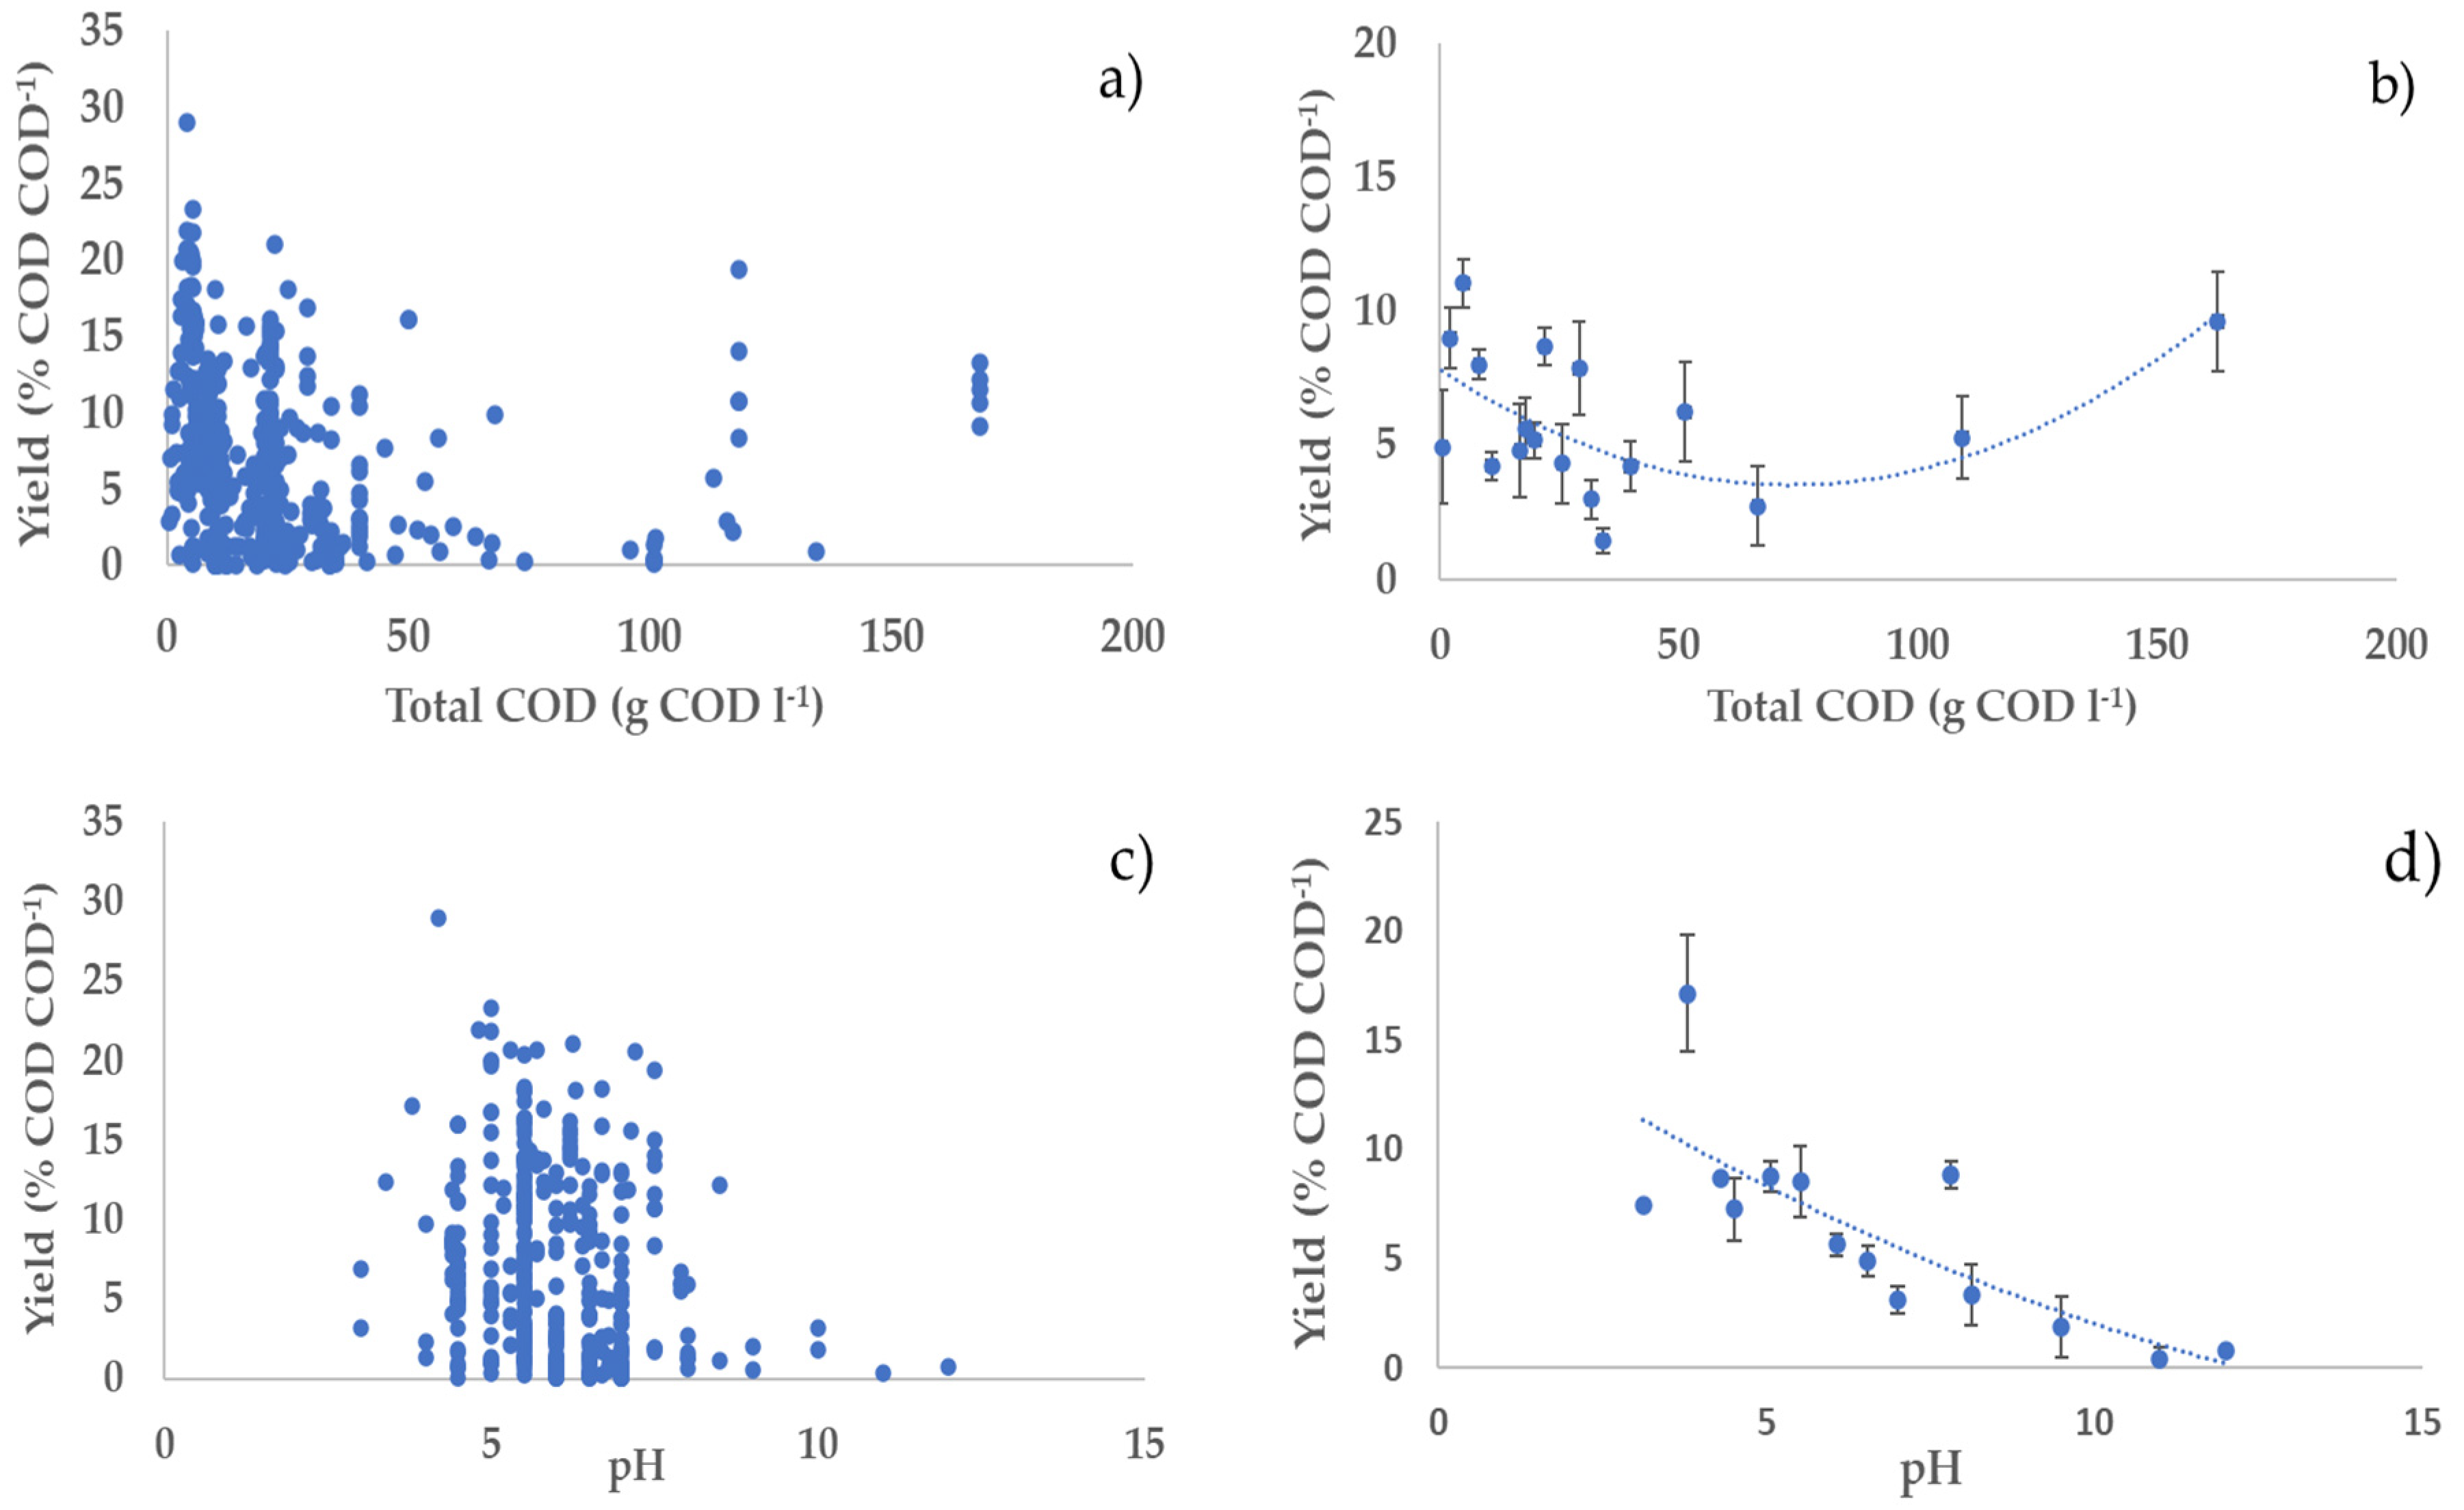
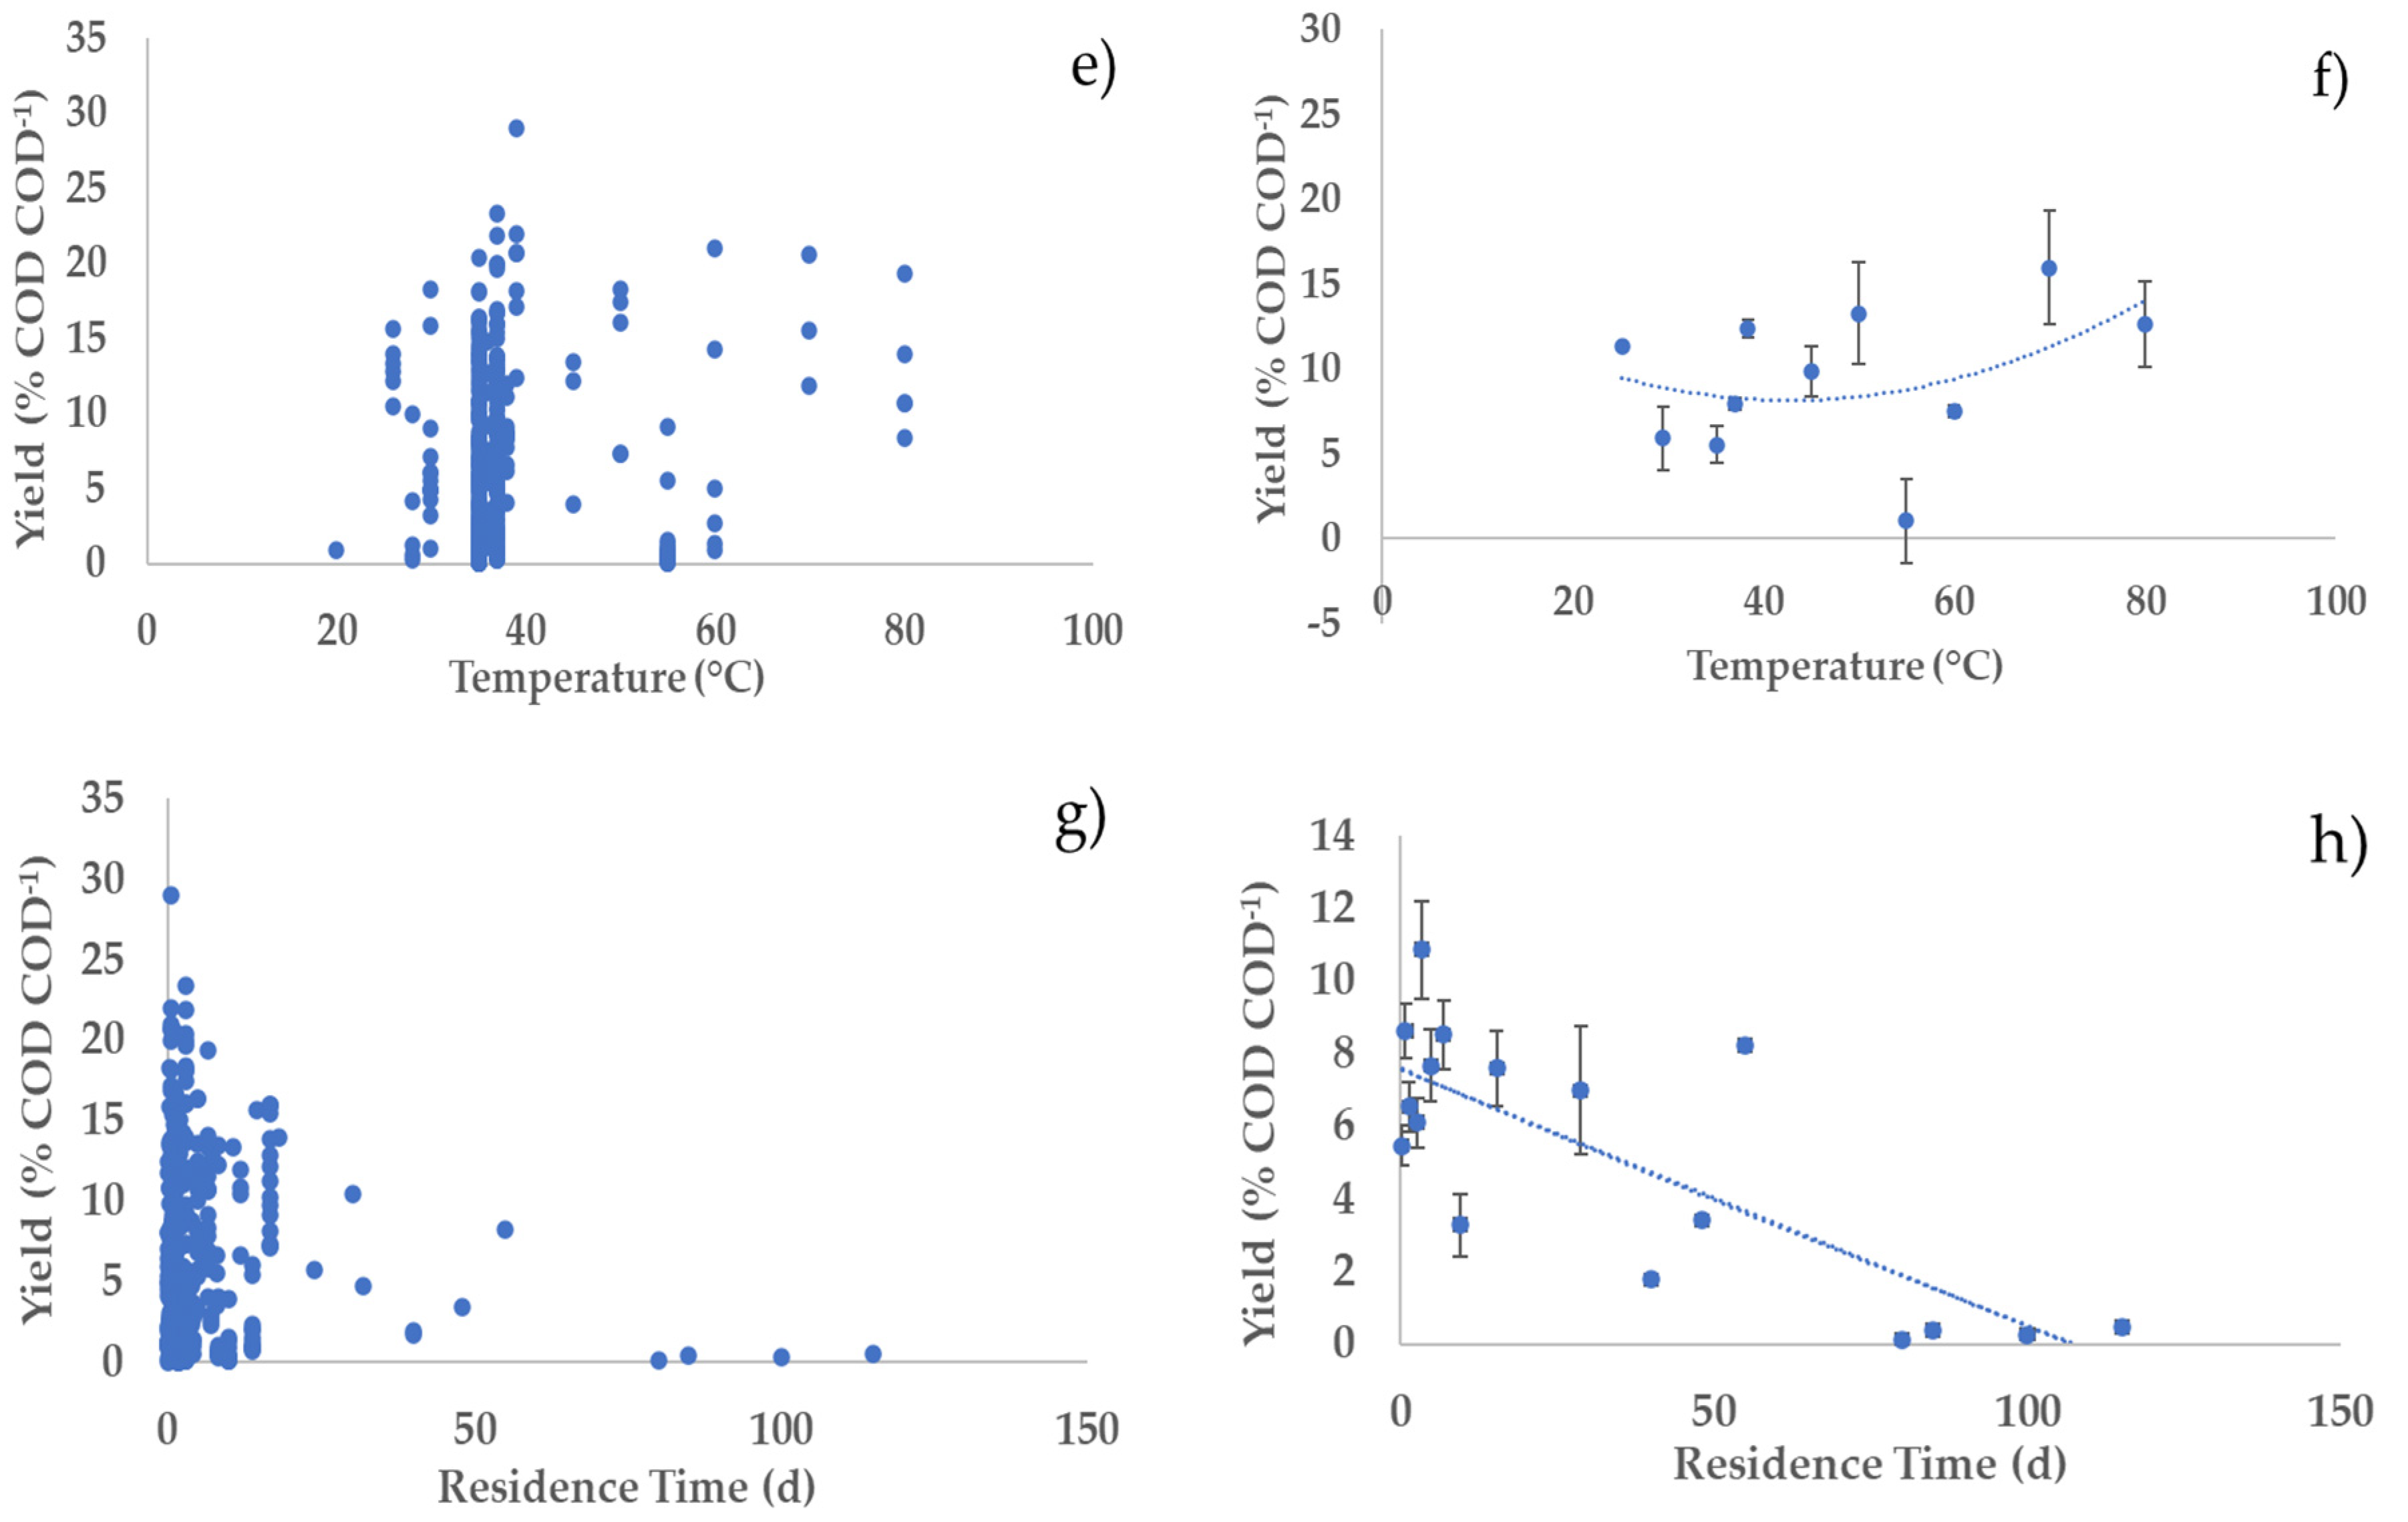
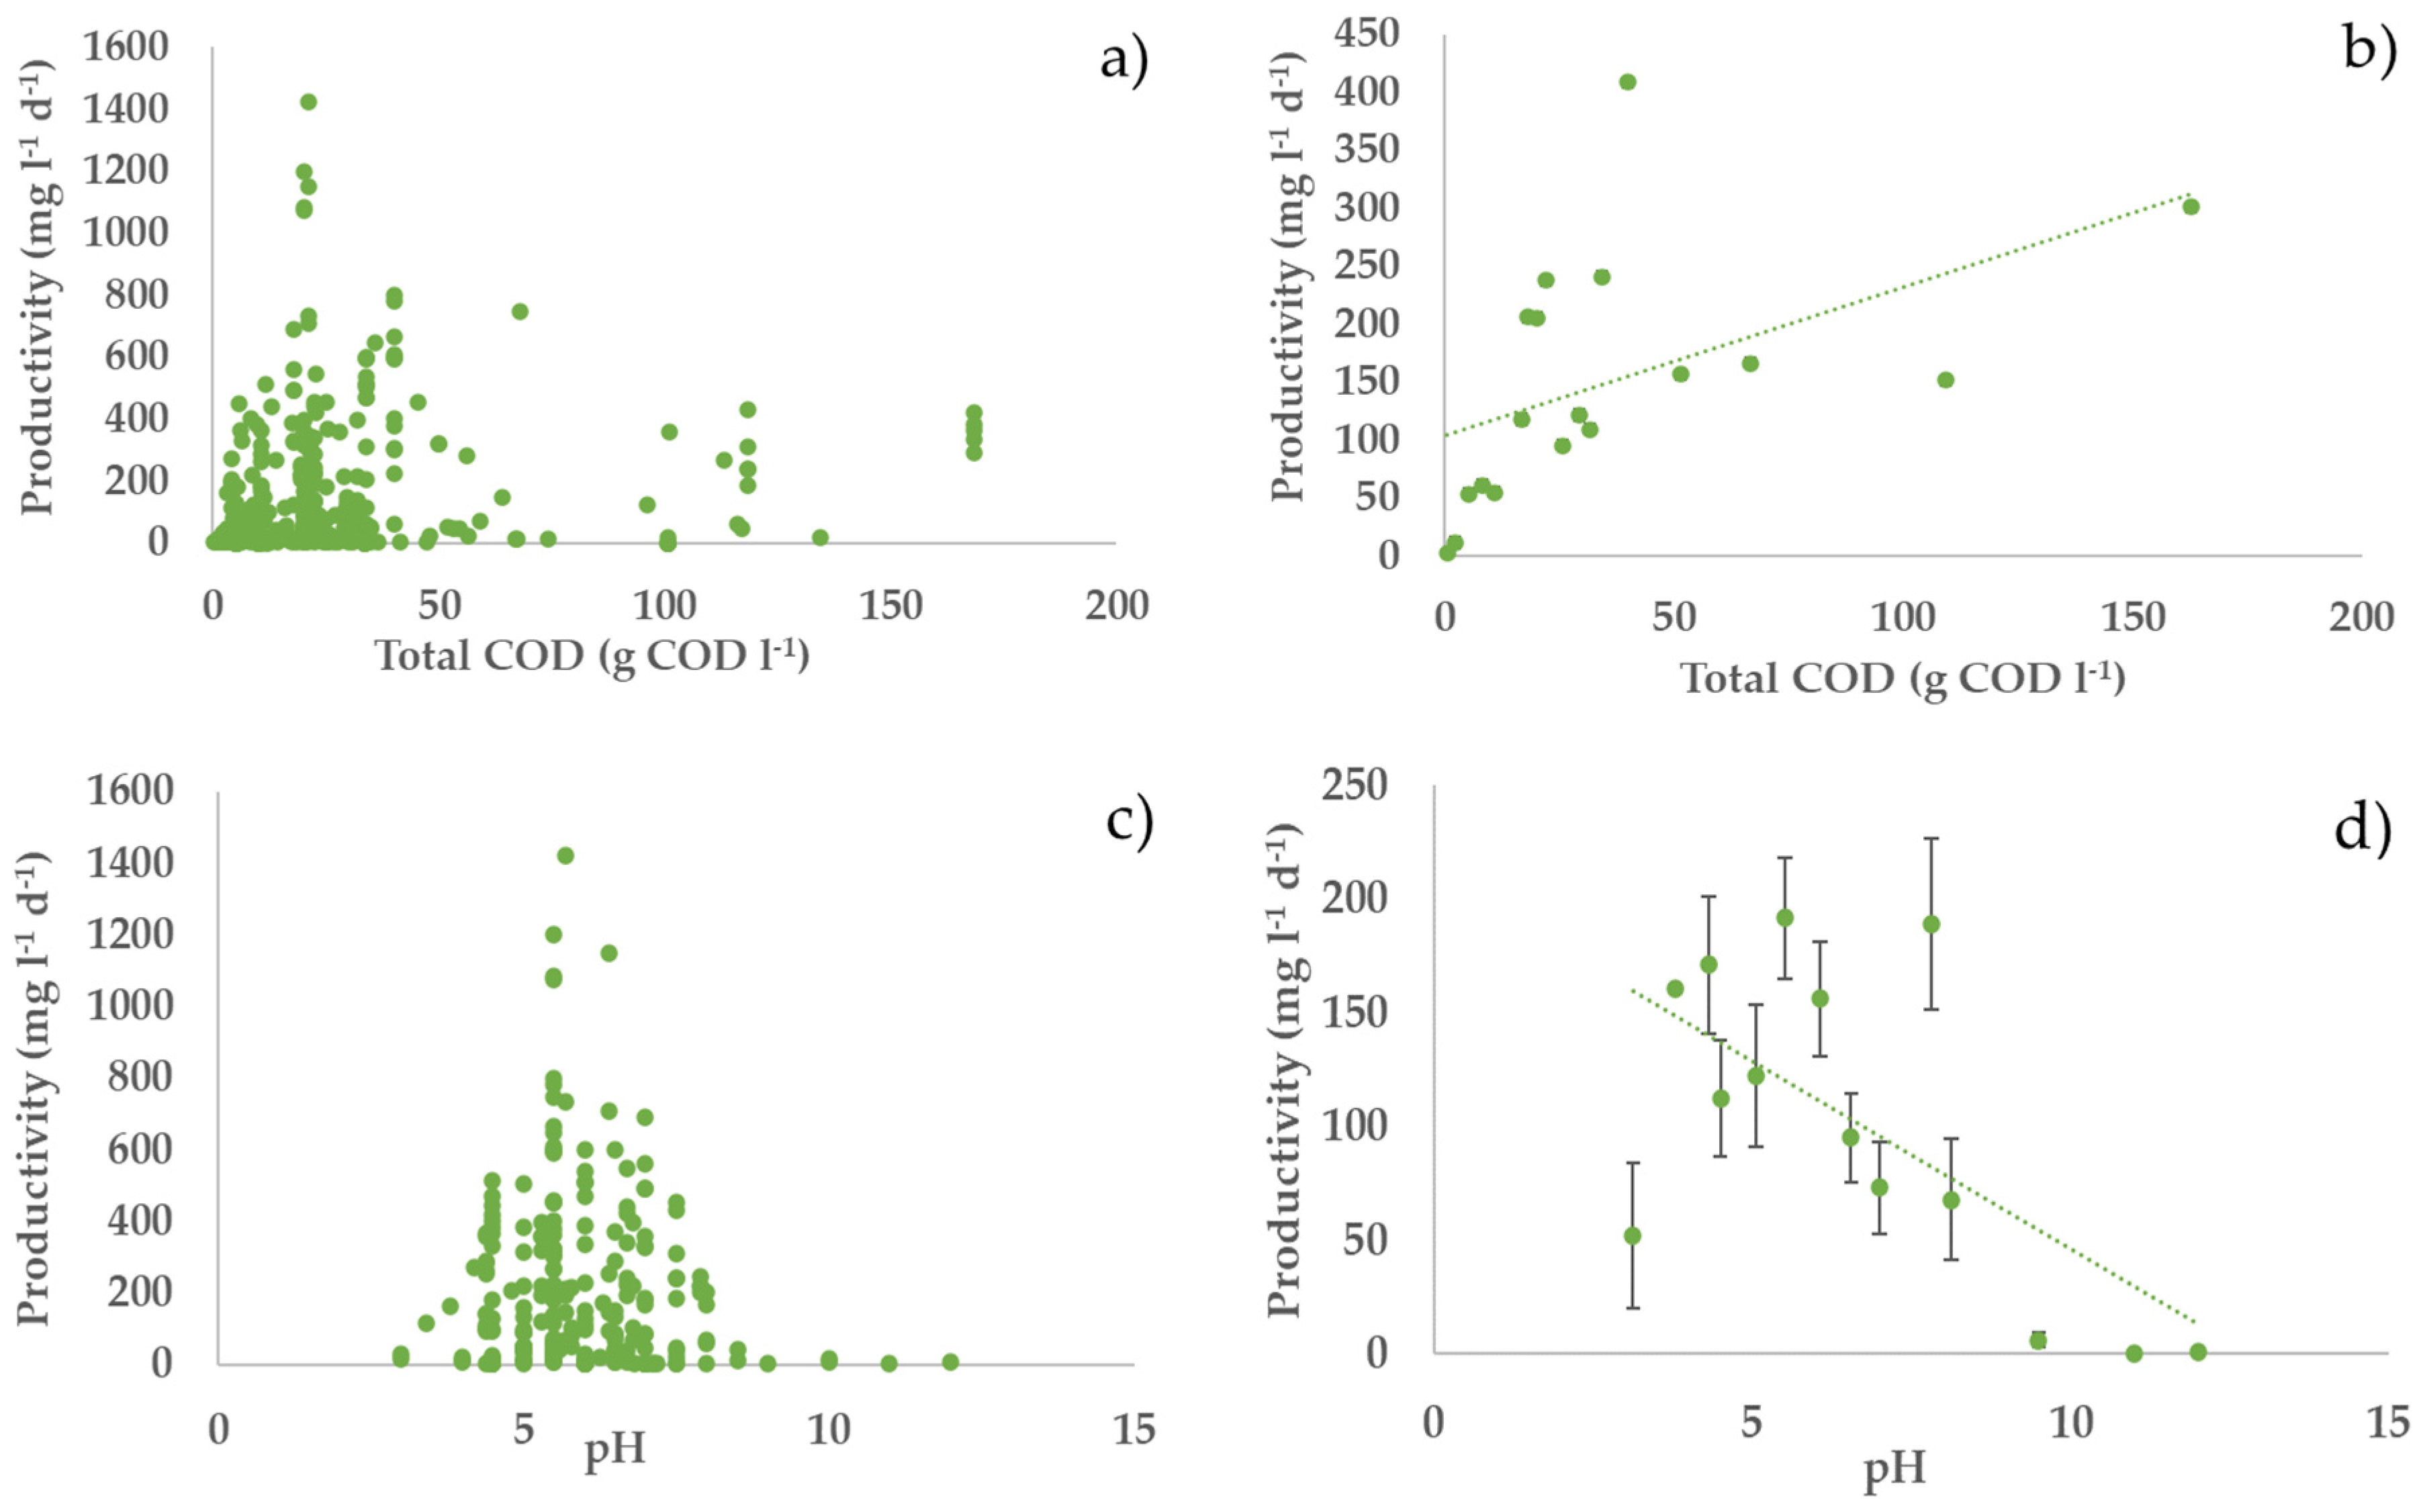
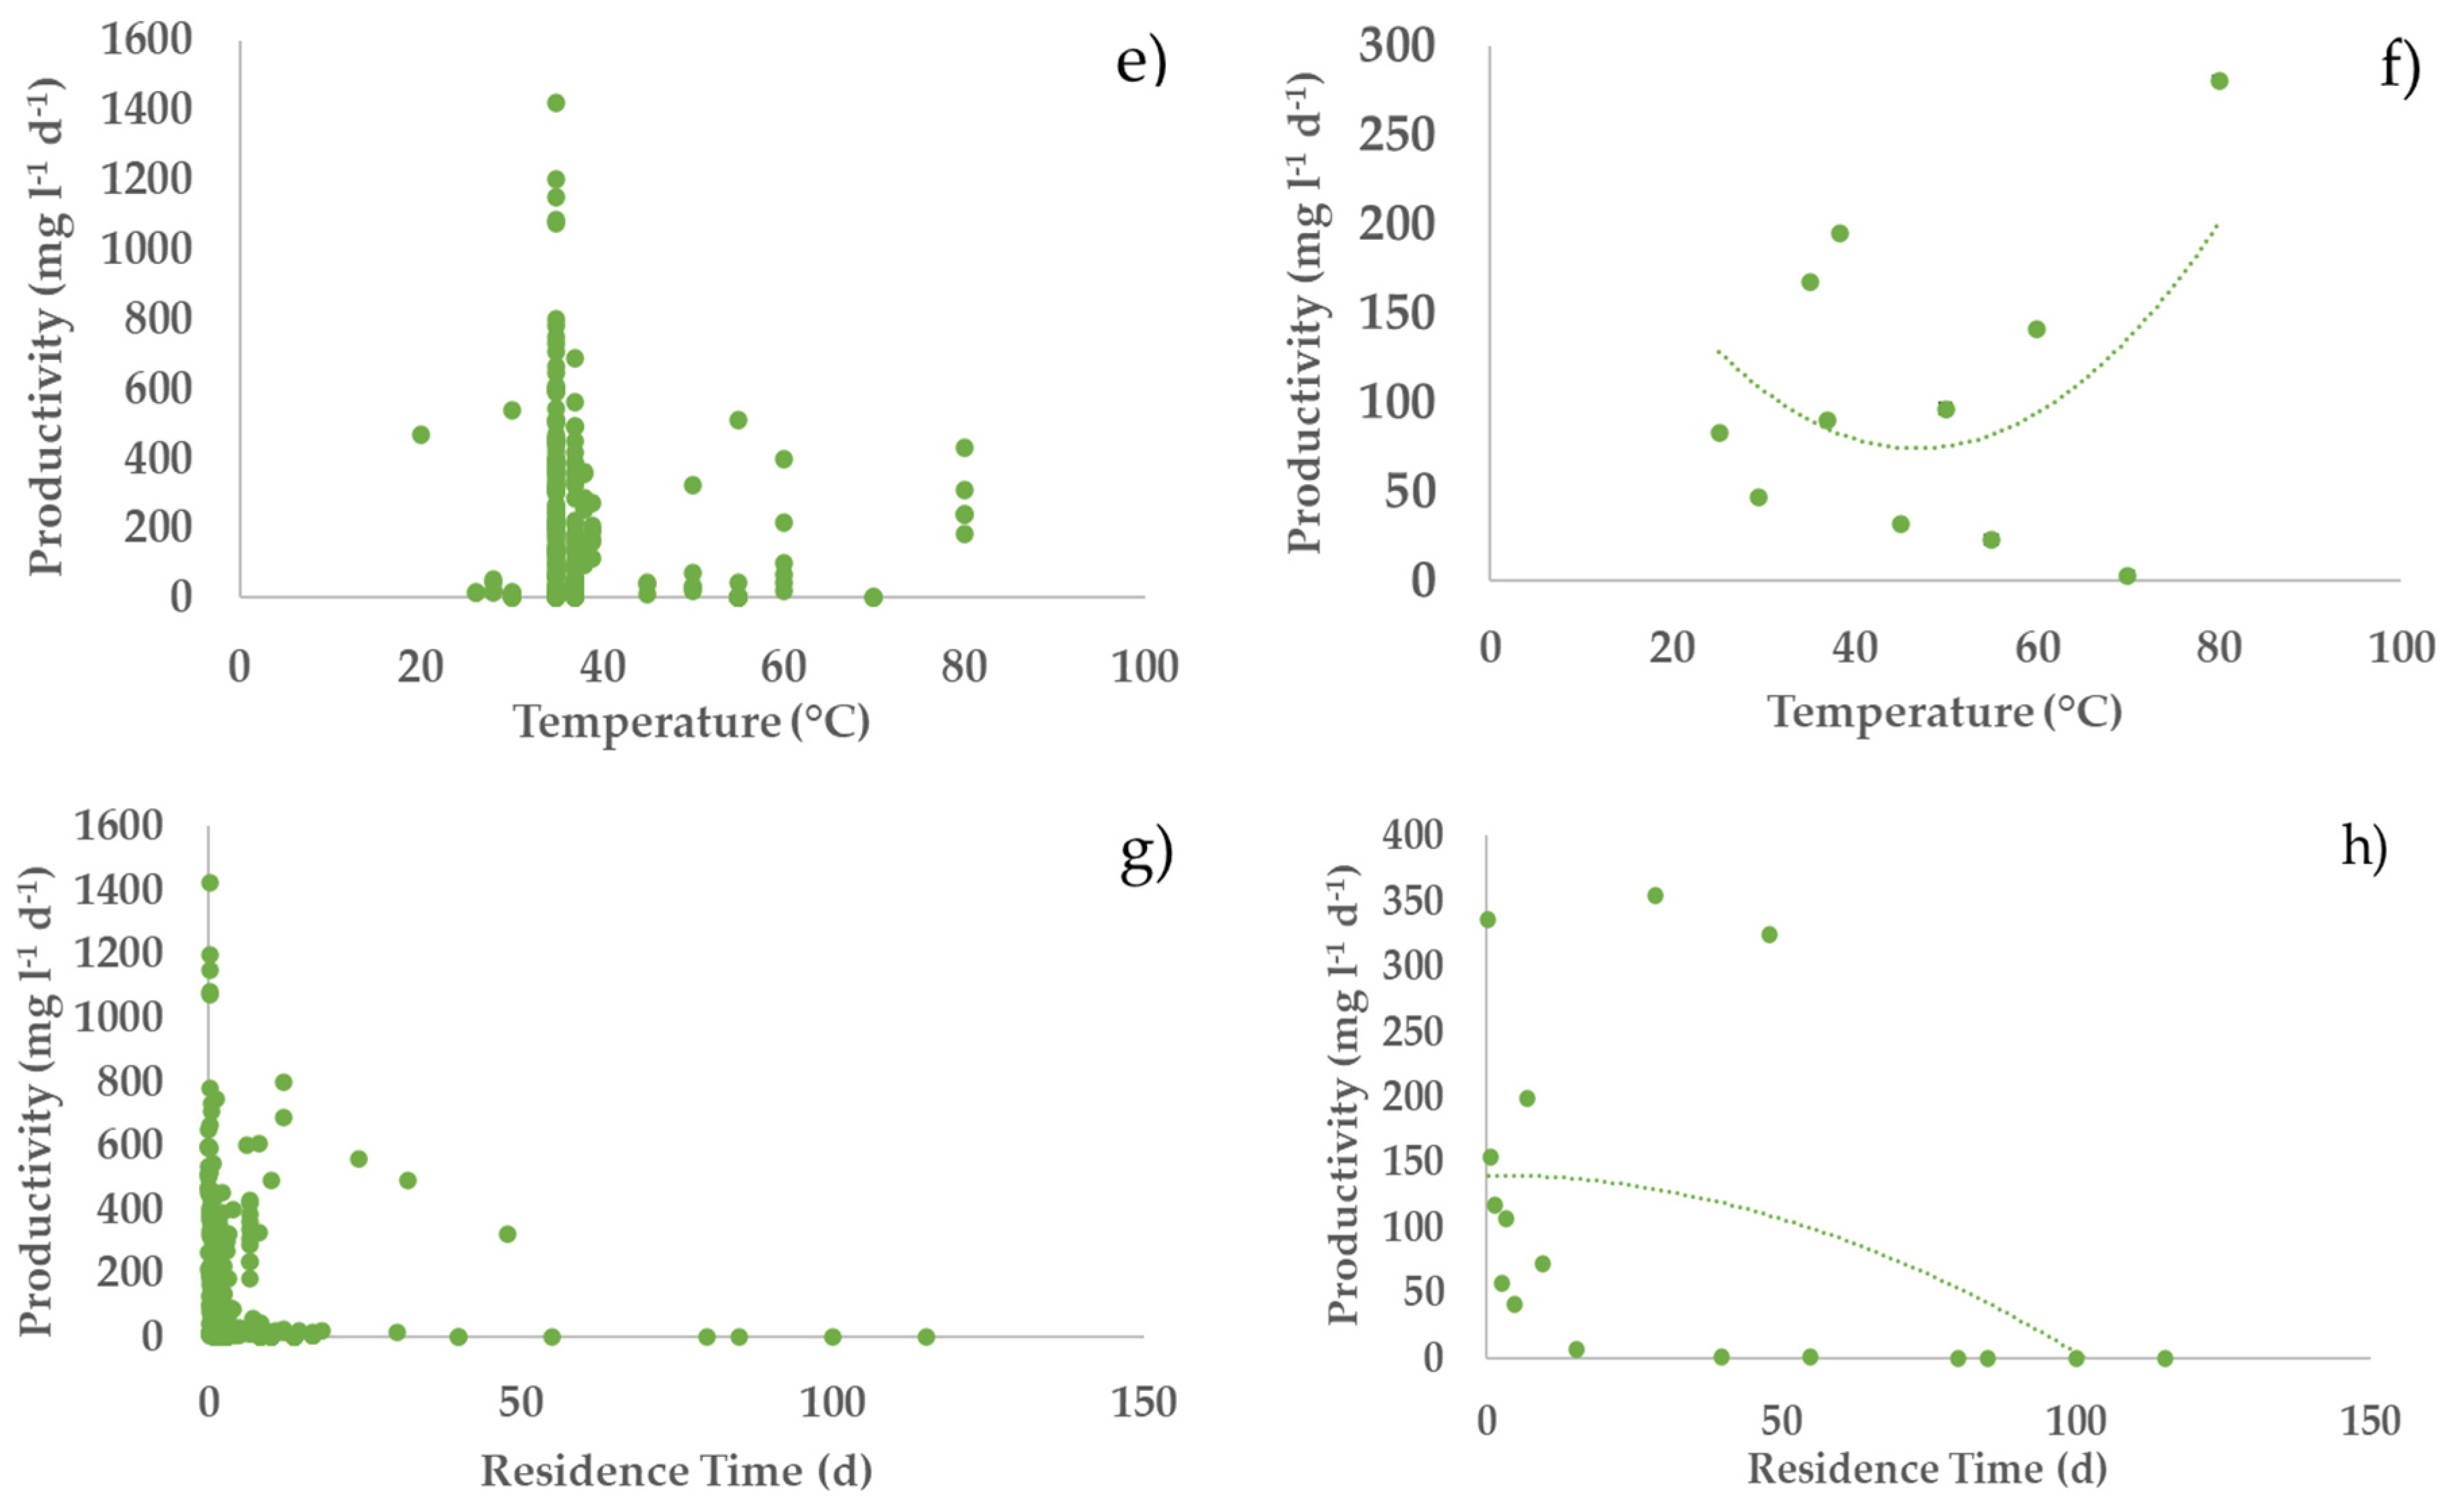
3.2. Profiles of the Performance Variables vs. Operating Parameters

The relationship between the process performance variables (hydrogen yield, productivity, and content) and the operating parameters (tCOD, pH, temperature, and residence time) is shown in Figure 1, Figure 2 and Figure 3. Parts (a,c,e,g) of Figure 1, Figure 2 and Figure 3 show all the literature data, while parts (b,d,f,h) show average values for each narrow range of the operating parameters.
Qualitative observations that can be made from Figure 1, Figure 2 and Figure 3 are as follows: The hydrogen yield (Figure 1) is relatively unaffected by substrate concentration in the feed and by the temperature. Additionally, it is negatively affected by higher pH values and higher residence time. The highest hydrogen yields (29% COD COD−1) were reached with 4 g COD L−1 sucrose-rich wastewaters, under mesophilic conditions (39 °C), at pH 4.2, and in continuous mode, with a hydraulic retention time of 0.50 d [20]. These experiments were carried out without the need for substrate pretreatment since they used simple substrates.
The hydrogen productivity (Figure 2) generally seems to increase as the feed concentration increases and is relatively unaffected by temperature. Generally, productivity undergoes a decreasing trend as the pH and the residence time increase; however, there are large variations in the literature data. The highest productivity (1422 mg L−1 d−1) was achieved using glucose as substrate, under mesophilic conditions (35 °C), at acidic pH 5.7, and carried out in continuous mode, with a hydraulic retention time of 0.25 d [68].
The hydrogen content in biogas (Figure 3) seems relatively constant in a wide range of the operating parameters and is only negatively affected by large values of the substrate concentration, alkaline pH, and high temperature.

3.3. Descriptive Statistics and Performances

Table 3 shows mean and 90th percentile values for the process performance variables from the considered experimental data. The meaning of the 90th percentile values is that 10% of the considered experiments obtained yield, productivity, and content higher than the specified values.
The mean value of hydrogen yields (6.49% COD COD−1) and hydrogen productivities (135 mg L−1 d−1) were much lower than the 90th percentile value (15.55% COD COD−1, 305.16 mg L−1 d−1). This confirms what is observed in Figure 1 and Figure 2—that the values of hydrogen yields and productivities are spread over a wide range in the literature. Only 10% of the considered studies obtained a hydrogen yield of 15.55% or higher and hydrogen productivity of 305.16 mg L−1 d−1 or higher. Only 2% and 6% of the experiments reached higher values of hydrogen yields (>20% COD COD−1) and productivities (>500 mg l−1 d−1), respectively. These results confirm the need for more studies to improve hydrogen production from wastewaters and organic waste. Unlike hydrogen yields and productivities, the hydrogen content does not vary considerably, as we noticed relatively close values between mean (51%), 90th percentile (64%), and highest value registered (72%).
In order to gain further insight on the effect of operating parameters on process performance, Table 4 shows the mean values of the operating parameters in the experiments that gave the best performance, i.e., in the experiments where the hydrogen yield, productivity, and content were at or above the 90th percentile. The mean operating parameters for the best experiments were compared with the mean operating parameters for all experiments.
Compared with the parameters of all of the experiments, the highest hydrogen yields were obtained with lower substrate concentration (mean value 14.23 vs. 23 gCOD L−1), shorter residence time (3.57 vs. 5.02 d), slightly lower pH (5.62 vs. 5.96), and a higher temperature (40.05 vs. 37.98 °C). The highest productivities were obtained with higher substrate concentrations (33.91 gCOD L−1) and lower residence time (3.10 d). However, the mean temperature in the experiments with the best performance was similar to the mean temperature in all the experiments, indicating that this parameter had only a modest effect on process performance, at least in the considered experimental studies. The highest hydrogen content in the biogas is linked with a slightly lower substrate concentration than hydrogen productivities (28.47 mg L−1 d−1), a longer residence time (6.23 d), a higher temperature (39.91 °C), and a lower pH (4.39).

3.4. Bivariate Analysis

The data failed the normality test (p-value < 0.05), which means that the data did not fit the normal distribution. Therefore, parametric tests could not be performed, and the data were analysed using non-parametric tests or bivariate analysis. Operational parameters were correlated with process performance parameters, and the relationship between tCOD, and production rate showed moderate strength (p-value < 0.05, τb = 0.238) using Kendal τb test. The correlation between the categorial operating parameters with process performance parameters showed that there is no significant difference (p-value < 0.05) between the different groups of the following parameters: pH (pHa, pHb, pHn), substrate composition (SS, SNS), operating mode (CN, BA), residence time (RT1, RT2, RT3), and substrate pretreatment (SY, SN).

3.5. Multi-Linear Regression Model

Afterwards, a general multi-linear fitting model with all the operational parameters was calculated for each process parameter.

3.5.1. Hydrogen Yield

Table 5 reveals the calculated correlation between hydrogen yields and the operating parameters of dark fermentation. Afterwards, the statistically insignificant terms (p-value > 0.05) were discarded, and the simplified model (Equation (2)) was calculated.
Yield (% COD COD−1) = 6.93 + 1.4 × pHa − 1.05 × pHn − 1.39 × pHb + 1.2 × SS − 1.19 × SNS
The operating parameters significantly affecting hydrogen yields are pH (pHa, pHn, pHb) and whether the substrate in the feed is soluble or non-soluble (SS, SNS). Acidic pH (pHa) has a positive correlation with hydrogen yield, unlike neutral and alkaline pH (pHn, pHb), which have a negative correlation. Hydrogen yield shows a positive correlation with soluble substrates (SS) and a negative correlation with non-soluble substrates (SNS). The model predicts an important effect of pH. For example, assuming a feed composed of soluble substrates, the model predicts a yield of 9.53% at acidic pH and only 6.2% at alkaline pH, confirming the effect of pH on the hydrogen yield already observed in Figure 1d.

3.5.2. Hydrogen Productivity

Table 6 shows the correlation between hydrogen productivity and operation parameters.
After the statistically insignificant terms (p-value > 0.05) were discarded, the simplified model (Equation (3)) was calculated.
Productivity (mg L−1 d−1) = 96.72 + 64.13 × pHa + 1.7 × tCOD + 46.38 × Tm + 107.34 × SS − 21.09 × SNS + 53.9 × IY + 29.87 × SN + 174.52 × CN + 111.81 × RT1
Acidic pH has a positive correlation with hydrogen productivity. Similarly, hydrogen productivity is also positively correlated with substrate concentration, mesophilic temperatures, soluble substrates in the feed, inhibition of methanogens, continuous mode, and short residence time (RT1). Insoluble substrates have negative effects on hydrogen productivity. The relatively large values of the coefficients for continuous flow and short residence time (174.52 and 111.81 d, respectively), indicate the large effect of these process parameters, which, for the residence time, is also evident from Figure 2h.

3.5.3. H2 Content

Table 7 presents the correlation between hydrogen content and operation parameters.
After the statistically insignificant terms (p > 0.05) were discarded, the simplified model (Equation (4)) was calculated.
Hydrogen content (% v/v) = 53.96 − 4.34 × pHb − 0.09 × tCOD − 3.71 × Tt − 5.49 SY
Hydrogen content is significantly negatively correlated with alkaline pH (pHb), substrate concentration (tCOD), thermophilic temperature (Tt), and substrate pretreatment (SY). However, comparing the coefficients in Equation (4) with the coefficients in Equations (2) and (3), it is evident that the effect of the operating parameters on hydrogen content is modest, compared with their effect on yield and productivity. For example, assuming a feed of 10 gCOD L−1, with mesophilic conditions and no pretreatment of the substrate, the model predicts that alkaline pH reduces the hydrogen content in the biogas only from 53.06% (at acidic or neutral pH) to 48.72%. The model, therefore, confirms the evidence from Figure 3 that process parameters have relatively little influence on the hydrogen content in the biogas.

4. General Discussion

In this section, the findings of this study are compared with other studies in the literature (Section 4.1), and the implications of this study for process optimisation are discussed (Section 4.2).

4.1. Comparison with Other Studies in the Literature

Various studies have investigated the effect of different operating parameters on hydrogen production, focusing on one or two operating parameters. The results were not widely reproducible due to the range of operating conditions, the nature of the inoculum, and the substrate used. Therefore, the importance of our study is to combine and analyse the results of previous studies to identify general trends and optimal factors affecting hydrogen production.
Previous studies have highlighted the importance of pH on the performance of dark fermentation and hydrogen production. The pH can affect the metabolic pathway of fermentative bacteria, especially hydrogen-producing bacteria, and influence hydrogenase activity [69,70]. While fermentation of organic compounds occurs at a pH range between 4 and 9, hydrogen-consuming bacteria or methanogens have an optimal pH range between 6.8 and 8 [71,72]. This can explain the finding of our analysis which indicates that acidic pH is the most favourable for hydrogen production with dark fermentation.
Regarding the temperature, most of the studies in the literature on dark fermentation have used mesophilic conditions. Thermophilic conditions have many disadvantages over microbial growth which will negatively affect hydrogen production. The increase in temperature involves cellular growth inhibition, thermal denaturation of proteins especially enzymes, decrease in extracellular polymeric substances, and most of all increase in energy cost [73]. However, our analysis shows that, although there is a rather weak positive effect of mesophilic conditions, hydrogen production with high yield is also possible under thermophilic conditions, e.g., high hydrogen yields (20 and 21% COD COD−1) were obtained at 70 and 60 °C, respectively, under neutral pH (Figure 1, Figure 2 and Figure 3; parts e,f).
Concerning the residence time, Liu et al. observed a decrease in gas (hydrogen and methane) production during AD of organic household solid waste, by thermophilic microorganisms at 70 °C, when the residence time was decreased from 6 d to 1 d [74]. Furthermore, hydrogen production yields were higher at shorter HRT (2 h), in continuous mode using a concentrated substrate, slightly acidic pH, and high temperature (55 °C) [13]. Similarly, an increase in hydrogen production rate was observed when HRT decreased from 8 h to 1 h [75]. An optimal HRT of 2 h resulted in the highest hydrogen production during the AD of cassava wastewater in an anaerobic fluidised bed reactor at 28 °C. On the other hand, Ziara et al. achieved the highest hydrogen yields (0.85 mol H2/mol lactate) by fermenting lactate wastewater at 45 °C for 180 h, with an initial pH of 8.5 [39]. Additionally, this study confirms the impact of short residence time on hydrogen yields, productivity, and content (Figure 1, Figure 2 and Figure 3; parts g,h). However, one experiment conducted by Yu et al. noted an increase in hydrogen yield, from 1.74 mol H2/mol hexose to 2.14 mol H2/mol hexose, when HRT increased from 2 h to 24 h [13]. The outcomes depend on the nature of substrate, its solubility, availability, and on the nature of the inoculum. To further improve hydrogen yields from the AD of organic waste and wastewaters, it is important to take into consideration all the parameters discussed above as complementary and not individual parameters.

4.2. Process Considerations

Although the performance of a hydrogen production process with DF will be highly dependent on the specific feedstock used, this study offers some general insight on how to optimise process parameters to maximise process performance. Generally, higher substrate concentration in the feedstock should be preferred, as it tends to give higher hydrogen productivities with a relatively small impact on hydrogen yield and content in the biogas. Acidic pH values should be preferred over neutral and alkaline values. Indeed, acidic pH values generally tend to give higher yields, with relatively little, but still positive effects on hydrogen productivity and content. pH control to acidic values seems an interesting strategy to maximise hydrogen production by reducing the conversion of hydrogen into methane. It is interesting to observe that DF naturally tends to be acidic due to the production of SCOAs; therefore, it is likely that an acidic pH can be maintained without the addition of pH balancing chemicals, which increases the attractiveness and environmental sustainability of this process. As far as the temperature is concerned, our analysis indicates that hydrogen production using AD is relatively unaffected by temperature in a wide range, 30–60 °C, with some indication of a slightly better performance at the lowest end of this range. From the process point of view, this indicates that mesophilic conditions should generally be preferred to thermophilic conditions, because of the lower energy consumption to maintain the temperature of the digester. Our analysis indicates that residence time should be maintained at relatively low values to maximise hydrogen production. Indeed, low residence time contributes to washing out the methanogens, which, in turn, contributes to increasing hydrogen yield. Notably, low residence time means smaller volumes of the reactors, which has a direct positive impact on the volumetric productivity, as observed in our analysis. Furthermore, smaller reactors also contribute to decreasing the capital and operating costs of the process.
Another process variable that tends to favour hydrogen production is the nature of the feedstock, with soluble substrates tending to give higher yield and productivity than insoluble substrates. Overall, the pretreatment of the substrate and the inhibition of methanogenesis seem to have only a modest effect on the process. It is interesting to observe that continuous fermentation seems to have a relatively large positive effect on productivity.
The most favourable conditions for hydrogen production identified in this analysis—namely, high substrate concentration, acidic pH, and short residence time—should be targets of more research effort to optimise the process for full-scale commercialisation. Clearly, the economics and sustainability of the process should also be investigated. On the other hand, it is worth noting that only less than 3% of the considered studies investigated hydrogen production from municipal wastewaters. Although municipal wastewaters are typically diluted, their conventional aerobic treatment is energy intensive, and an anaerobic process with hydrogen production in the first stage and methane production in the second stage would represent an interesting alternative to current processes. This also deserves further investigation.

5. Conclusions

A large volume of literature is being published on the use of DF for hydrogen production. This study identified the general effects of operating parameters on the process performance of dark fermentation, which was characterised by the hydrogen yield, productivity, and content in the biogas. Although the results in the literature were highly scattered due to the different feedstocks and operating conditions used, generally, the best process performance was obtained at relatively acidic pH, short residence time, and high substrate concentration. Soluble substrate and continuous operating mode also generally gave better process performance. Working under optimised conditions can significantly enhance hydrogen production, and more studies on process optimisation are required for the successful commercialisation of this process.

Supplementary Materials

The following supporting information can be downloaded at: https://www.mdpi.com/article/10.3390/pr10010156/s1, Table S1: The list of all the studies considered, with the operational parameters investigated, and analysed process parameters. CN: continuous, BA: batch, Table S2: Kruskal–Wallis analysis between categorical parameters (pH, substrate composition, temperature, operating mode, residence time, methanogen’s inhibition, substrate pretreatment) and process performance parameters (hydrogen yield, production rate, and content), Table S3: R script (RStudio 4.1.2).

Author Contributions

Conceptualisation, D.D. and R.N.M.; methodology, R.N.M. and N.M.; investigation, data curation, and writing—original draft preparation, R.N.M. and N.M.; writing—review and editing, D.D. and R.N.M.; visualisation, supervision, and funding acquisition, D.D. All authors have read and agreed to the published version of the manuscript.

Funding

This study was funded by the Scottish Government’s Hydro Nation scholars’ program, which funded Rita Noelle Moussa’s PhD scholarship (Grant code 10222).

Conflicts of Interest

The authors declare no conflict of interest. The funders had no role in the design of the study; in the collection, analyses, or interpretation of data; in the writing of the manuscript, or in the decision to publish the results.

References

  1. De Bere, L. Anaerobic digestion of solid waste: State-of-the-art. Water Sci. Technol. 2000, 41, 283–290. [Google Scholar] [CrossRef]
  2. Mata-Ãlvarez, J. Biomethanization of the Organic Fraction of Municipal Solid Wastes; IWA publishing: London, UK, 2002; Volume 4. [Google Scholar]
  3. Zupančič, G.D.; Uranjek-Ževart, N.; Roš¡, M. Full-scale anaerobic co-digestion of organic waste and municipal sludge. Biomass Bioenergy 2008, 32, 162–167. [Google Scholar] [CrossRef]
  4. Ghyoot, W.; Verstraete, W. Anaerobic digestion of primary sludge from chemical pre-precipitation. Water Sci. Technol. 1997, 36, 357–365. [Google Scholar] [CrossRef]
  5. Kleerebezem, R.; Joosse, B.; Rozendal, R.; Van Loosdrecht, M.C.M. Anaerobic digestion without biogas? Rev. Environ. Sci. Bio/Technol. 2015, 14, 787–801. [Google Scholar] [CrossRef] [Green Version]
  6. Das, D. Advances in biohydrogen production processes: An approach towards commercialization. Int. J. Hydrogen Energy 2009, 34, 7349–7357. [Google Scholar] [CrossRef]
  7. Dionisi, D.; Silva, I.M.O. Production of ethanol, organic acids and hydrogen: An opportunity for mixed culture biotechnology? Rev. Environ. Sci. Bio/Technol. 2016, 15, 213–242. [Google Scholar] [CrossRef]
  8. Pinto, S.; Jamshidi Far, A.; Dionisi, D. Land and water requirements for the supply of renewable heating and transport energy using anaerobic digestion and water electrolysis. A case study for the UK. Sustain. Energy Technol. Assess. 2021, 48, 101636. [Google Scholar] [CrossRef]
  9. Dahiya, S.; Chatterjee, S.; Sarkar, O.; Mohan, S.V. Renewable hydrogen production by dark-fermentation: Current status, challenges and perspectives. Bioresour. Technol. 2021, 321, 124354. [Google Scholar] [CrossRef]
  10. Ueno, Y.; Otsuka, S.; Morimoto, M. Hydrogen production from industrial wastewater by anaerobic microflora in chemostat culture. J. Ferment. Bioeng. 1996, 82, 194–197. [Google Scholar] [CrossRef]
  11. Lay, C.; Wu, J.; Hsiao, C.; Chang, J.; Chen, C.; Lin, C. Biohydrogen production from soluble condensed molasses fermentation using anaerobic fermentation. Int. J. Hydrogen Energy 2010, 35, 13445–13451. [Google Scholar] [CrossRef]
  12. Ren, N.; Li, J.; Li, B.; Wang, Y.; Liu, S. Biohydrogen production from molasses by anaerobic fermentation with a pilot-scale bioreactor system. Int. J. Hydrogen Energy 2006, 31, 2147–2157. [Google Scholar] [CrossRef]
  13. Yu, H.; Zhu, Z.; Hu, W.; Zhang, H. Hydrogen production from rice winery wastewater in an upflow anaerobic reactor by using mixed anaerobic cultures. Int. J. Hydrog. Energy Biohydrog. 2002, 27, 1359–1365. [Google Scholar] [CrossRef]
  14. Lin, C.Y.; Lay, C.H. A nutrient formulation for fermentative hydrogen production using anaerobic sewage sludge microflora. Int. J. Hydrogen Energy 2005, 30, 285–292. [Google Scholar] [CrossRef]
  15. Roychowdhury, S.; Cox, D.; Levandowsky, M. Production of hydrogen by microbial fermentation. Int. J. Hydrogen Energy 1988, 13, 407–410. [Google Scholar] [CrossRef]
  16. Kataoka, N.; Miya, A.; Kiriyama, K. Studies on hydrogen production by continuous culture system of hydrogen-producing anaerobic bacteria. Water Sci. Technol. 1997, 36, 41–47. [Google Scholar] [CrossRef]
  17. Zhang, T.; Liu, H.; Fang, H.H.P. Biohydrogen production from starch in wastewater under thermophilic condition. J. Environ. Manag. 2003, 69, 149–156. [Google Scholar] [CrossRef]
  18. Jung, K.; Kim, D.; Shin, H. Continuous fermentative hydrogen production from coffee drink manufacturing wastewater by applying UASB reactor. Int. J. Hydrogen Energy 2010, 35, 13370–13378. [Google Scholar] [CrossRef]
  19. Mu, Y.; Yu, H.; Wang, Y. The role of pH in the fermentative hydrogen production from an acidogenic granule-based reactor. Chemosphere 2006, 64, 350–358. [Google Scholar] [CrossRef] [PubMed]
  20. Mu, Y.; Yu, H. Biological hydrogen production in a UASB reactor with granules. I: Physicochemical characteristics of hydrogen-producing granules. Biotechnol. Bioeng. 2006, 94, 980–987. [Google Scholar] [CrossRef]
  21. Chang, F.; Lin, C. Biohydrogen production using an up-flow anaerobic sludge blanket reactor. Int. J. Hydrogen Energy 2004, 29, 33–39. [Google Scholar] [CrossRef]
  22. Yu, H.; Mu, Y. Biological hydrogen production in a UASB reactor with granules. II: Reactor performance in 3-year operation. Biotechnol. Bioeng. 2006, 94, 988–995. [Google Scholar] [CrossRef] [PubMed]
  23. Noike, T. Biological Hydrogen Production of Organic Wastes—Development of the Two-Phase Hydrogen Production Process; International Symposium on Hydrogen and Methane Fermentation of Organic Wastes: Tokyo, Japan, 2002; pp. 31–39. [Google Scholar]
  24. Kotsopoulos, T.A.; Zeng, R.J.; Angelidaki, I. Biohydrogen production in granular up-flow anaerobic sludge blanket (UASB) reactors with mixed cultures under hyper-thermophilic temperature (70 degrees C). Biotechnol. Bioeng. 2006, 94, 296–302. [Google Scholar] [CrossRef]
  25. Arriaga, S.; Rosas, I.; Alatriste-Mondragón, F.; Razo-Flores, E. Continuous production of hydrogen from oat straw hydrolysate in a biotrickling filter. Fuel Energy Abstr. 2011, 36, 3442–3449. [Google Scholar] [CrossRef]
  26. Li, J.; Li, B.; Zhu, G.; Ren, N.; Bo, L.; He, J. Hydrogen production from diluted molasses by anaerobic hydrogen producing bacteria in an anaerobic baffled reactor (ABR). Int. J. Hydrogen Energy 2005, 32, 3274–3283. [Google Scholar] [CrossRef]
  27. Chen, C.; Lin, C.; Lin, M. Acid-base enrichment enhances anaerobic hydrogen production process. Appl. Microbiol. Biotechnol. 2002, 58, 224–228. [Google Scholar] [PubMed]
  28. Guo, W.; Ren, N.; Chen, Z.; Liu, B.; Wang, X.; Xiang, W.; Ding, J. Simultaneous biohydrogen production and starch wastewater treatment in an acidogenic expanded granular sludge bed reactor by mixed culture for long-term operation. Int. J. Hydrogen Energy 2008, 33, 7397–7404. [Google Scholar] [CrossRef]
  29. Guo, L.; Lu, M.; Li, Q.; Zhang, J.; She, Z. A comparison of different pretreatments on hydrogen fermentation from waste sludge by fluorescence excitation-emission matrix with regional integration analysis. Int. J. Hydrogen Energy 2015, 40, 197–208. [Google Scholar] [CrossRef]
  30. Arooj, M.F.; Han, S.; Kim, S.; Kim, D.; Shin, H. Continuous biohydrogen production in a CSTR using starch as a substrate. Int. J. Hydrogen Energy 2008, 33, 3289–3294. [Google Scholar] [CrossRef]
  31. Chen, S.; Lee, K.; Lo, Y.; Chen, W.; Wu, J.; Lin, C.; Chang, J. Batch and continuous biohydrogen production from starch hydrolysate by Clostridium species. Int. J. Hydrogen Energy 2008, 33, 1803–1812. [Google Scholar] [CrossRef]
  32. Datar, R.; Huang, J.; Maness, P.; Mohagheghi, A.; Czernik, S.; Chornet, E. Hydrogen production from the fermentation of corn stover biomass pretreated with a steam-explosion process. Int. J. Hydrogen Energy 2007, 32, 932–939. [Google Scholar] [CrossRef]
  33. Pattra, S.; Sangyoka, S.; Boonmee, M.; Reungsang, A. Bio-hydrogen production from the fermentation of sugarcane bagasse hydrolysate by Clostridium butyricum. Int. J. Hydrogen Energy 2008, 33, 5256–5265. [Google Scholar] [CrossRef]
  34. Ntaikou, I.; Gavala, H.N.; Kornaros, M.; Lyberatos, G. Hydrogen production from sugars and sweet sorghum biomass using Ruminococcus albus. Int. J. Hydrogen Energy 2008, 33, 1153–1163. [Google Scholar] [CrossRef]
  35. Wang, Z.; Shao, S.; Zhang, C.; Lu, D.; Ma, H.; Ren, X. Pretreatment of vinegar residue and anaerobic sludge for enhanced hydrogen and methane production in the two-stage anaerobic system. Int. J. Hydrogen Energy 2015, 40, 4494–4501. [Google Scholar] [CrossRef]
  36. Sagnak, R.; Kargi, F.; Kapdan, I.K. Bio-hydrogen production from acid hydrolyzed waste ground wheat by dark fermentation. Int. J. Hydrogen Energy 2011, 36, 12803–12809. [Google Scholar] [CrossRef]
  37. Chu, C.; Tung, L.; Lin, C. Effect of substrate concentration and pH on biohydrogen production kinetics from food industry wastewater by mixed culture. Int. J. Hydrogen Energy 2013, 38, 15849–15855. [Google Scholar] [CrossRef]
  38. Zhu, H.; Beland, M. Evaluation of alternative methods of preparing hydrogen producing seeds from digested wastewater sludge. Int. J. Hydrogen Energy 2006, 31, 1980–1988. [Google Scholar] [CrossRef]
  39. Ziara, R.M.M.; Miller, D.N.; Subbiah, J.; Dvorak, B.I. Lactate wastewater dark fermentation: The effect of temperature and initial pH on biohydrogen production and microbial community. Int. J. Hydrogen Energy 2019, 44, 661–673. [Google Scholar] [CrossRef]
  40. Khanal, S.K.; Chen, W.; Li, L.; Sung, S. Biological hydrogen production: Effects of pH and intermediate products. Int. J. Hydrogen Energy 2004, 29, 1123–1131. [Google Scholar] [CrossRef]
  41. Yang, H.; Shao, P.; Lu, T.; Shen, J.; Wang, D.; Xu, Z.; Yuan, X. Continuous bio-hydrogen production from citric acid wastewater via facultative anaerobic bacteria. Int. J. Hydrogen Energy 2006, 31, 1306–1313. [Google Scholar] [CrossRef]
  42. Chang, J.; Wu, J.; Wen, F.; Hung, K.; Chen, Y.; Hsiao, C.; Lin, C.; Huang, C. Molecular monitoring of microbes in a continuous hydrogen-producing system with different hydraulic retention time. Int. J. Hydrogen Energy 2006, 33, 1579–1585. [Google Scholar] [CrossRef]
  43. Liu, Y.; Yu, P.; Song, X.; Qu, Y. Hydrogen production from cellulose by co-culture of Clostridium thermocellum JN4 and Thermoanaerobacterium thermosaccharolyticum GD17. Int. J. Hydrogen Energy 2008, 33, 2927–2933. [Google Scholar] [CrossRef]
  44. Thong, S.; Prasertsan, P.; Karakashev, D.; Angelidaki, I. Thermophilic fermentative hydrogen production by the newly isolated Thermoanaerobacterium thermosaccharolyticum PSU-2. Int. J. Hydrogen Energy 2008, 33, 1204–1214. [Google Scholar] [CrossRef]
  45. Wang, X.; Jin, B.; Mulcahy, D. Impact of carbon and nitrogen sources on hydrogen production by a newly isolated Clostridium butyricum W5. Int. J. Hydrogen Energy 2008, 33, 4998–5005. [Google Scholar] [CrossRef]
  46. Vatsala, T.M.; Raj, S.M.; Manimaran, A. A pilot-scale study of biohydrogen production from distillery effluent using defined bacterial co-culture. Int. J. Hydrogen Energy 2008, 33, 5404–5415. [Google Scholar] [CrossRef]
  47. Fang, H.H.P.; Li, C.; Zhang, T. Acidophilic biohydrogen production from rice slurry. Int. J. Hydrogen Energy 2006, 31, 683–692. [Google Scholar] [CrossRef]
  48. Hussy, I.; Hawkes, F.R.; Dinsdale, R.; Hawkes, D.L. Continuous Fermentative Hydrogen Production from a Wheat Starch Co-Product by Mixed Microflora. Biotechnol. Bioeng. 2003, 84, 619–626. [Google Scholar] [CrossRef]
  49. Davila-Vazquez, G.; Alatriste-Mondragón, F.; de León-Rodríguez, A.; Razo-Flores, E. Fermentative hydrogen production in batch experiments using lactose, cheese whey and glucose: Influence of initial substrate concentration and pH. Int. J. Hydrogen Energy 2008, 33, 4989–4997. [Google Scholar] [CrossRef]
  50. Wang, C.C.; Chang, C.W.; Chu, C.P.; Lee, D.J.; Chang, B.V.; Liao, C.S. Producing hydrogen from wastewater sludge by Clostridium bifermentans. J. Biotechnol. 2003, 102, 83–92. [Google Scholar] [CrossRef]
  51. Liu, H.; Fang, H.H. Hydrogen production from wastewater by acidogenic granular sludge. Water Sci. Technol. J. Int. Assoc. Water Pollut. Res. 2002, 47, 153–158. [Google Scholar] [CrossRef]
  52. Han, H.; Wei, L.; Liu, B.; Yang, H.; Shen, J. Optimization of biohydrogen production from soybean straw using anaerobic mixed bacteria. Int. J. Hydrogen Energy 2012, 37, 13200–13208. [Google Scholar] [CrossRef]
  53. Wang, Y.; Ping, A.; Hu, C.; Zhang, Y. Effects of various pretreatment methods of anaerobic mixed microflora on biohydrogen production and the fermentation pathway of glucose. Int. J. Hydrogen Energy 2011, 36, 390–396. [Google Scholar] [CrossRef]
  54. Fangkum, A.; Reungsang, A. Biohydrogen production from sugarcane bagasse hydrolysate by elephant dung: Effects of initial pH and substrate concentration. Int. J. Hydrogen Energy 2011, 36, 8687–8696. [Google Scholar] [CrossRef]
  55. Cui, M.; Yuan, Z.; Zhi, X.; Wei, L.; Shen, J. Biohydrogen production from poplar leaves pretreated by different methods using anaerobic mixed bacteria. Int. J. Hydrogen Energy 2010, 35, 4041–4047. [Google Scholar] [CrossRef]
  56. Chen, C.; Chuang, Y.; Lin, C.; Lay, C.; Sen, B. Thermophilic dark fermentation of untreated rice straw using mixed cultures for hydrogen production. Int. J. Hydrogen Energy 2012, 37, 15540–15546. [Google Scholar] [CrossRef]
  57. Sreela-or, C.; Imai, T.; Plangklang, P.; Reungsang, A. Optimization of key factors affecting hydrogen production from food waste by anaerobic mixed cultures. Int. J. Hydrogen Energy 2011, 36, 14120–14133. [Google Scholar] [CrossRef]
  58. Kim, D.; Kim, S.; Kim, H.; Kim, M.; Shin, H. Sewage sludge addition to food waste synergistically enhances hydrogen fermentation performance. Bioresource Technol. 2011, 102, 8501–8506. [Google Scholar] [CrossRef] [PubMed]
  59. Okamoto, M.; Miyahara, T.; Mizuno, O.; Noike, T. Biological hydrogen potential of materials characteristic of the organic fraction of municipal solid wastes. Water Sci. Technol. 2000, 41, 25–32. [Google Scholar] [CrossRef] [PubMed]
  60. Li, D.; Yuan, Z.; Sun, Y.; Kong, X.; Zhang, Y. Hydrogen production characteristics of the organic fraction of municipal solid wastes by anaerobic mixed culture fermentation. Int. J. Hydrogen Energy 2009, 34, 812–820. [Google Scholar] [CrossRef]
  61. Kim, S.; Han, S.; Shin, H. Feasibility of biohydrogen production by anaerobic co-digestion of food waste and sewage sludge. Int. J. Hydrogen Energy 2004, 29, 1607–1616. [Google Scholar] [CrossRef]
  62. Chen, W.; Chen, S.; Kumar Khanal, S.; Sung, S. Kinetic study of biological hydrogen production by anaerobic fermentation. Int. J. Hydrogen Energy 2006, 31, 2170–2178. [Google Scholar] [CrossRef]
  63. Nguyen, T.D.; Han, S.J.; Kim, J.P.; Kim, M.S.; Oh, Y.K.; Sim, S.J. Hydrogen production by the hyperthermophilic eubacterium, Thermotoga neapolitana, using cellulose pretreated by ionic liquid. Int. J. Hydrogen Energy 2008, 33, 5161–5168. [Google Scholar] [CrossRef]
  64. Kyazze, G.; Dinsdale, R.; Guwy, A.J.; Hawkes, F.R.; Premier, G.C.; Hawkes, D.L. Performance characteristics of a two-stage dark fermentative system producing hydrogen and methane continuously. Biotechnol. Bioeng. 2007, 97, 759–770. [Google Scholar] [CrossRef] [PubMed]
  65. Henze, M. (Ed.) Wastewater Treatment: Biological and Chemical Processes, 3rd ed.; Springer: Berlin, Germany; New York, NY, USA, 2002. [Google Scholar]
  66. Dionisi, D.; Bolaji, I.; Nabbanda, D.; Silva, I.M.O. Calculation of the potential production of methane and chemicals using anaerobic digestion. Biofuels Bioprod. Biorefining 2018, 12, 788–801. [Google Scholar] [CrossRef]
  67. Grady, L.; Daigger, G.; Love, N.; Filipe, C. (Eds.) Biological Wastewater Treatment, 3rd ed.; IWA Publishing: London, UK, 2011. [Google Scholar]
  68. Lin, C.; Chang, R. Hydrogen production during the anaerobic acidogenic conversion of glucose. J. Chem. Technol. Biotechnol. 1999, 74, 498–500. [Google Scholar] [CrossRef]
  69. Dabrock, B.; Bahl, H.; Gottschalk, G. Parameters Affecting Solvent Production by Clostridium pasteurianum. Appl. Environ. Microbiol. 1992, 58, 1233–1239. [Google Scholar] [CrossRef] [PubMed] [Green Version]
  70. Lay, J.J. Modeling and optimization of anaerobic digested sludge converting starch to hydrogen. Biotechnol. Bioeng. 2000, 68, 269–278. [Google Scholar] [CrossRef]
  71. Lay, J.; Li, Y.; Noike, T. Influences of pH and moisture content on the methane production in high-solids sludge digestion. Water Res. 1997, 31, 1518–1524. [Google Scholar] [CrossRef]
  72. Temudo, M.F.; Kleerebezem, R.; van Loosdrecht, F.A.U.; van Loosdrecht, M. Influence of the pH on (open) mixed culture fermentation of glucose: A chemostat study. Biotechnol. Bioeng. 2007, 98, 69–79. [Google Scholar] [CrossRef]
  73. Lee, K.; Lin, P.; Chang, J. Temperature effects on biohydrogen production in a granular sludge bed induced by activated carbon carriers. Int. J. Hydrogen Energy 2006, 31, 465–472. [Google Scholar] [CrossRef]
  74. Liu, D.; Zeng, R.J.; Angelidaki, I. Effects of pH and hydraulic retention time on hydrogen production versus methanogenesis during anaerobic fermentation of organic household solid waste under extreme-thermophilic temperature (70 °C). Biotechnol. Bioeng. 2008, 100, 1108–1114. [Google Scholar] [CrossRef]
  75. Amorim, N.C.S.; Alves, I.; Martins, J.S.; Amorim, E.L.C. Biohydrogen production from cassava wastewater in an anaerobic fluidized bed reactor. Braz. J. Chem. Eng. 2014, 31, 603–612. [Google Scholar] [CrossRef]
Figure 1. Relationships between hydrogen yield and operational parameters: (a,c,e,g) all considered experiments; (b,d,f,h) average values of experiments in each narrow range (width maximum 20%) of the operating parameters (error bars indicate the standard error) with second-order polynomial curve. The polynomial curve is only used to visualise the general trend, without any statistical significance.
Processes 10 00156 g001aProcesses 10 00156 g001b
Figure 2. Relationships between hydrogen productivity and operational parameters: (a,c,e,g) all considered experiments; (b,d,f,h) average values of experiments in each narrow range (width maximum 20%) of the operating parameters (error bars indicate the standard error) with second-order polynomial curve. The polynomial curve is only used to visualise the general trend, without any statistical significance.
Processes 10 00156 g002aProcesses 10 00156 g002b
Figure 3. Relationships between hydrogen content in biogas and operating parameters: (a,c,e,g) all the considered experiments; (b,d,f,h) average values of experiments in each narrow range (width maximum 20%) of the operating parameters (error bars indicate the standard error) with second-order polynomial curve. The polynomial curve is only used to visualise the general trend, without any statistical significance.
Processes 10 00156 g003aProcesses 10 00156 g003b
Table 1. Conversion factors used in this study.
Conversion UnitConversion FactorReference
gCOD gVS−1 carbohydrates1.13[65]
gCOD gVS−1 proteins1.6[65]
gCOD gVS−1 lipids2.03[65,66]
gCOD gDS−1 wastewaters 1.2[67]
Table 2. Frequency and percentage of substrate types, grouped by category.
Substrate CategoryFrequencyPercentage
Pure substrate (glucose, sucrose, starch)9628.2
Biomass (oat straw, corn, sugarcane, wheat, soybean, rice, cellulose)7923.2
Food waste (bean curd manufacturing, molasses, vinegar, mixed food waste)4713.8
Organic waste (waste ground wheat, waste potato starch, rice slurry, sugarcane bagasse, and poplar leaves4212.3
Carbohydrate-rich wastewater (sugar factory, condensed molasses, and sucrose-rich wastewater)226.5
Industrial wastewater (rice winery, coffee drink manufacturing, brewery, citric acid, and distillery wastewaters)216.2
Synthetic wastewater133.8
Wastewater sludge102.9
Municipal wastewater102.9
Table 3. Mean, with standard error (in bracket), and 90th percentile values of process performance parameters.
Performance ParameterMean90th Percentile
Hydrogen yield (% COD COD−1)6.49 (0.27)15.55
Hydrogen productivity (mg L−1 d−1)135.49 (9.96)305.16
Hydrogen content in biogas (% v/v)51.00 (0.39)64.00
Table 4. Mean values of operating parameters, with standard error (in bracket), for process performance parameters above 90th percentile compared with those of all experiments.
All ExperimentsHighest Hydrogen Yields
(% COD COD−1)
Highest Hydrogen Productivities
(mg L−1 d−1)
Highest Hydrogen Content (% v/v)
Substrate concentration (g COD L−1)23.00 (1.32)14.23 (3.04)33.91 (4.22)28.47 (5.92)
Residence time (d)5.02 (0.53)3.57 (0.74)3.10 (1.00)6.23 (0.64)
Temperature (°C)37.98 (0.40)40.05 (1.66)37.98 (1.32)39.91 (2.47)
pH5.96 (0.05)5.62 (0.13)5.85 (0.12)4.39 (0.77)
Table 5. Correlation between hydrogen yields and operation parameters. Symbols annotation: Highly significant ‘***’: 0 ≤ p-value < 0.001; fairly significant ‘**’: 0.001 ≤ p-value < 0.01; significant ‘*’: 0.01 ≤ p-value < 0.05; non-significant ‘’: 0.05 ≤ p-value < 0.1; highly non-significant‘no symbol’: p-value ≥ 0.1.
ParametersEstimate±SEt-Valuep-Value
Intercept6.930.3619.48<2 × 10⁻¹⁶ ***
pHa1.40.532.650.008 **
pHn−1.050.26−4.016.20 × 10−5 ***
pHb−1.930.67−2.090.04 *
tCOD−0.020.01−1.930.05
SS1.20.512.340.02 *
SNS−1.190.27−4.459.03 × 10−6 ***
Tm−0.320.46−0.670.49
Tt−0.740.45−1.660.98
CN0.120.60.20.85
BA−0.360.24−1.470.14
RT1−0.160.53−0.30.76
RT2−0.450.28−1.610.11
RT3−0.0070.3−0.0250.98
IY−0.640.48−1.340.18
IN0.050.320.160.87
SY−0.810.6−1.340.18
SN−0.250.26−0.950.34
Table 6. Correlation between hydrogen productivity and operation parameters. Symbols annotation: Highly significant ‘***’: 0 ≤ p-value < 0.001; fairly significant ‘**’: 0.001 ≤ p-value < 0.01; significant ‘*’: 0.01 ≤ p-value < 0.05; non-significant ‘’: 0.05 ≤ p-value < 0.1; highly non-significant ‘no symbol’: p-value ≥ 0.1.
ParametersEstimate±SE t-Valuep-Value
Intercept96.7212.67.672.24 × 10−14 ***
pHa64.1318.73.436.12 × 10−4 ***
pHn9.389.281.010.31
pHb−28.7623.67−1.220.25
tCOD1.690.364.752.14 × 10−6 ***
SS107.3418.165.913.73 × 10−9 ***
SNS−21.099.49−2.220.03 *
Tm46.3816.212.860.004 **
Tt−11.8315.88−0.750.46
CN174.5221.088.28<2 × 10⁻¹⁶ ***
BA−13.138.6−1.530.13
RT1111.8118.755.962.72 × 10−9 ***
RT2−12.429.97−1.250.21
RT3−13.269.76−1.360.17
IY53.916.853.20.001 **
IN−2.1511.34−0.190.85
SY−5.521.13−0.260.79
SN29.878.593.485.14 × 10−4 ***
Table 7. Correlation between hydrogen content and operation parameters. Symbols annotation: Highly significant ‘***’: 0 ≤ p-value < 0.001; fairly significant ‘**’: 0.001 ≤ p-value < 0.01; significant ‘*’: 0.01 ≤ p-value < 0.05; non-significant ‘’: 0.05 ≤ p-value < 0.1; highly non-significant ‘no symbol’: p-value ≥ 0.1.
ParametersEstimate±SE t-Valuep-Value
Intercept53.961.1646.23<2 × 10⁻¹⁶ ***
pHa−1.631.67−0.970.33
pHn−1.110.91−1.230.22
pHb−4.341.18−3.670.0003 ***
tCOD−0.090.03−3.480.0005 ***
SS−2.931.65−1.780.07
SNS−1.220.88−1.380.17
Tm−1.781.50−1.180.24
Tt−3.711.26−2.940.003 **
CN3.002.921.030.30
BA−0.911.48−0.610.54
RT1−1.711.66−1.030.31
RT2−1.940.94−2.060.04 *
RT3−1.130.97−1.170.24
IY−3.091.50−2.050.04 *
IN−0.171.24−0.140.89
SY−5.492.07−2.650.008 **
SN−0.120.80−0.150.88
Publisher’s Note: MDPI stays neutral with regard to jurisdictional claims in published maps and institutional affiliations.

