Article

Enabling Virtual Sensing as a Service

1
Department of Computing, Imperial College London, London SW7 2AZ, UK
2
Data Science Institute, Imperial College London, London SW7 2AZ, UK
*
Author to whom correspondence should be addressed.
Informatics 2016, 3(2), 3; https://doi.org/10.3390/informatics3020003
Submission received: 12 January 2016 / Revised: 9 March 2016 / Accepted: 22 March 2016 / Published: 29 March 2016
(This article belongs to the Special Issue Big Data and Analytics for Healthcare)

Abstract

:
In many situations, placing a physical sensor in the ideal position in or on the human body to acquire sensing data is incredibly difficult. Virtual sensors, in contrast to physical sensors, can provide indirect measurements by making use of other available sensor data. In this paper, we demonstrate a virtual sensing application developed as a service on top of a cloud-based health sensor data management platform called Wiki-Health. The proposed application “implants” virtual sensors in the human body by integrating environmental, geographic and personal sensor data with physiological models to compute temperature estimations of various parts of the body. The feasibility of the proposed virtual sensing service is supported by a case study. The ability to share computational models relevant to do calculations on measured data on the go is also discussed.

1. Introduction

Virtual sensors, in contrast to physical sensors, can provide indirect measurements by making use of other available sensor data, models and knowledge. There have been a few proof-of-concept studies, examining the feasibility of virtual sensors for various applications. Stéphant et al. [1] used linear and nonlinear models to develop virtual sensors to simulate and compare vehicle sideslip angle with actual road tests. Kusiak et al. [2] constructed a virtual wind-speed sensor for wind turbines by using models built from historical wind-farm data and data-mining algorithms. Raveendranathan et al. [3] proposed a virtual sensor framework in the gait analysis domain, aimed at enabling real-time activity and posture recognition. In another study, van Beek et al. [4] simulated the time trials of athletes in the Tour de France with various physiological and mechanical models.
The issue of core body temperature and the problems associated with measuring it outside of controlled laboratory conditions make it an interesting area for exploring virtual sensing applications. Human core body temperature is a vital sign indicative of one of the body’s most basic functions. Workers in many occupations are at risk from illness brought on by exposure to extreme temperature conditions, including construction builders, telecommunication linemen, fire fighters, transport drivers, athletes, workers in refrigerated warehouses, and military crews. Exposure to hot and cold environments is not only hazardous to our health but at times may also be life threatening [5], especially when combined with the stress of intensive workloads. Environmental conditions in which the core body temperature becomes too high or too low can lead to conditions, such as hyperthermia and hypothermia. Being able to monitor human core body temperature and other vital signs can provide a way of reducing the risk for workers in high risk occupations who are exposed to extreme hot or cold conditions.
Although a variety of wearable sensor devices have been developed in recent years that offer the potential for capturing different physiological parameters in real-time, monitoring core body temperature over time is problematic, since placing physical sensors such as esophageal or rectal probes at the ideal location to measure body temperature is not feasible [6]. Compared to core temperature, external environmental measurements and alternate physiological parameters, such as heart rate are easier to record. In this study, we propose a virtual sensing service that estimates human body temperatures by integrating human physiological models with measurable sensor data.
In our previous work [7,8], we explored the potential for sensors use in healthcare data acquisition and presented the key components of Wiki-Health—a cloud-based personal health sensor data management platform. To demonstrate the feasibility of using the Wiki-Health platform to track and discover change-signals collected from wireless sensors, which could act as early warning signals to indicate potential health issues, we presented an Electrocardiography (ECG)-based health monitoring model and service on top of the Wiki-Health platform for personal ECG beat abnormality detection.
For this study, we present the next evolution in the on-going development of Wiki-Health with a focus on the design and implementation of a virtual sensing application deployed as a service on top of the Wiki-Health platform to utilize the functionalities of Wiki-Health and integrate human physiological models with collected data from available sensor readings in order to compute and simulate virtual sensor readings of human body temperatures. The proposed service demonstrates the feasibility and potential of using the Wiki-Health framework to make health-related knowledge discovery more readily available to the general public.

2. Background and Related Work

2.1. Sensor Data Management Systems

The pervasive use of mobile phones and the rising adoption of sensing devices enabling people to collect data at any time or place is leading to a torrent of sensor data. A considerable number of studies have been undertaken that focus on managing sensor data storage and queries. Traditional sensor management systems, such as TinyDB [9], Aurora [10], and COUGAR [11], offer limited support for collaboration, but in many cases, their data processing abilities are no longer able to cope with the high volumes of data now being collected. Meanwhile, cloud computing is developing into a promising resource to deliver infrastructure, platforms and applications as services in a scalable, low-cost manner. Implementing cloud computing technologies appropriately can aid service providers in improving the efficiency of operations, sharing information, improving collaboration, and managing expenditures. For example, Sensor-Cloud [12] enables an infrastructure on which users can share different physical sensors with others through the implementation of virtual sensors. Commercial sensor network platforms, such as Xively [13] and ThingSpeak [14], have also taken off in recent years. They provide online scalable sensor data management platforms that allow users to connect sensor devices and applications through a web-based application programming interface (API). However, none of these platforms yet provide sufficient support for running computationally intensive analysis algorithms.

2.2. Collaboration and Crowdsourcing for Sensors
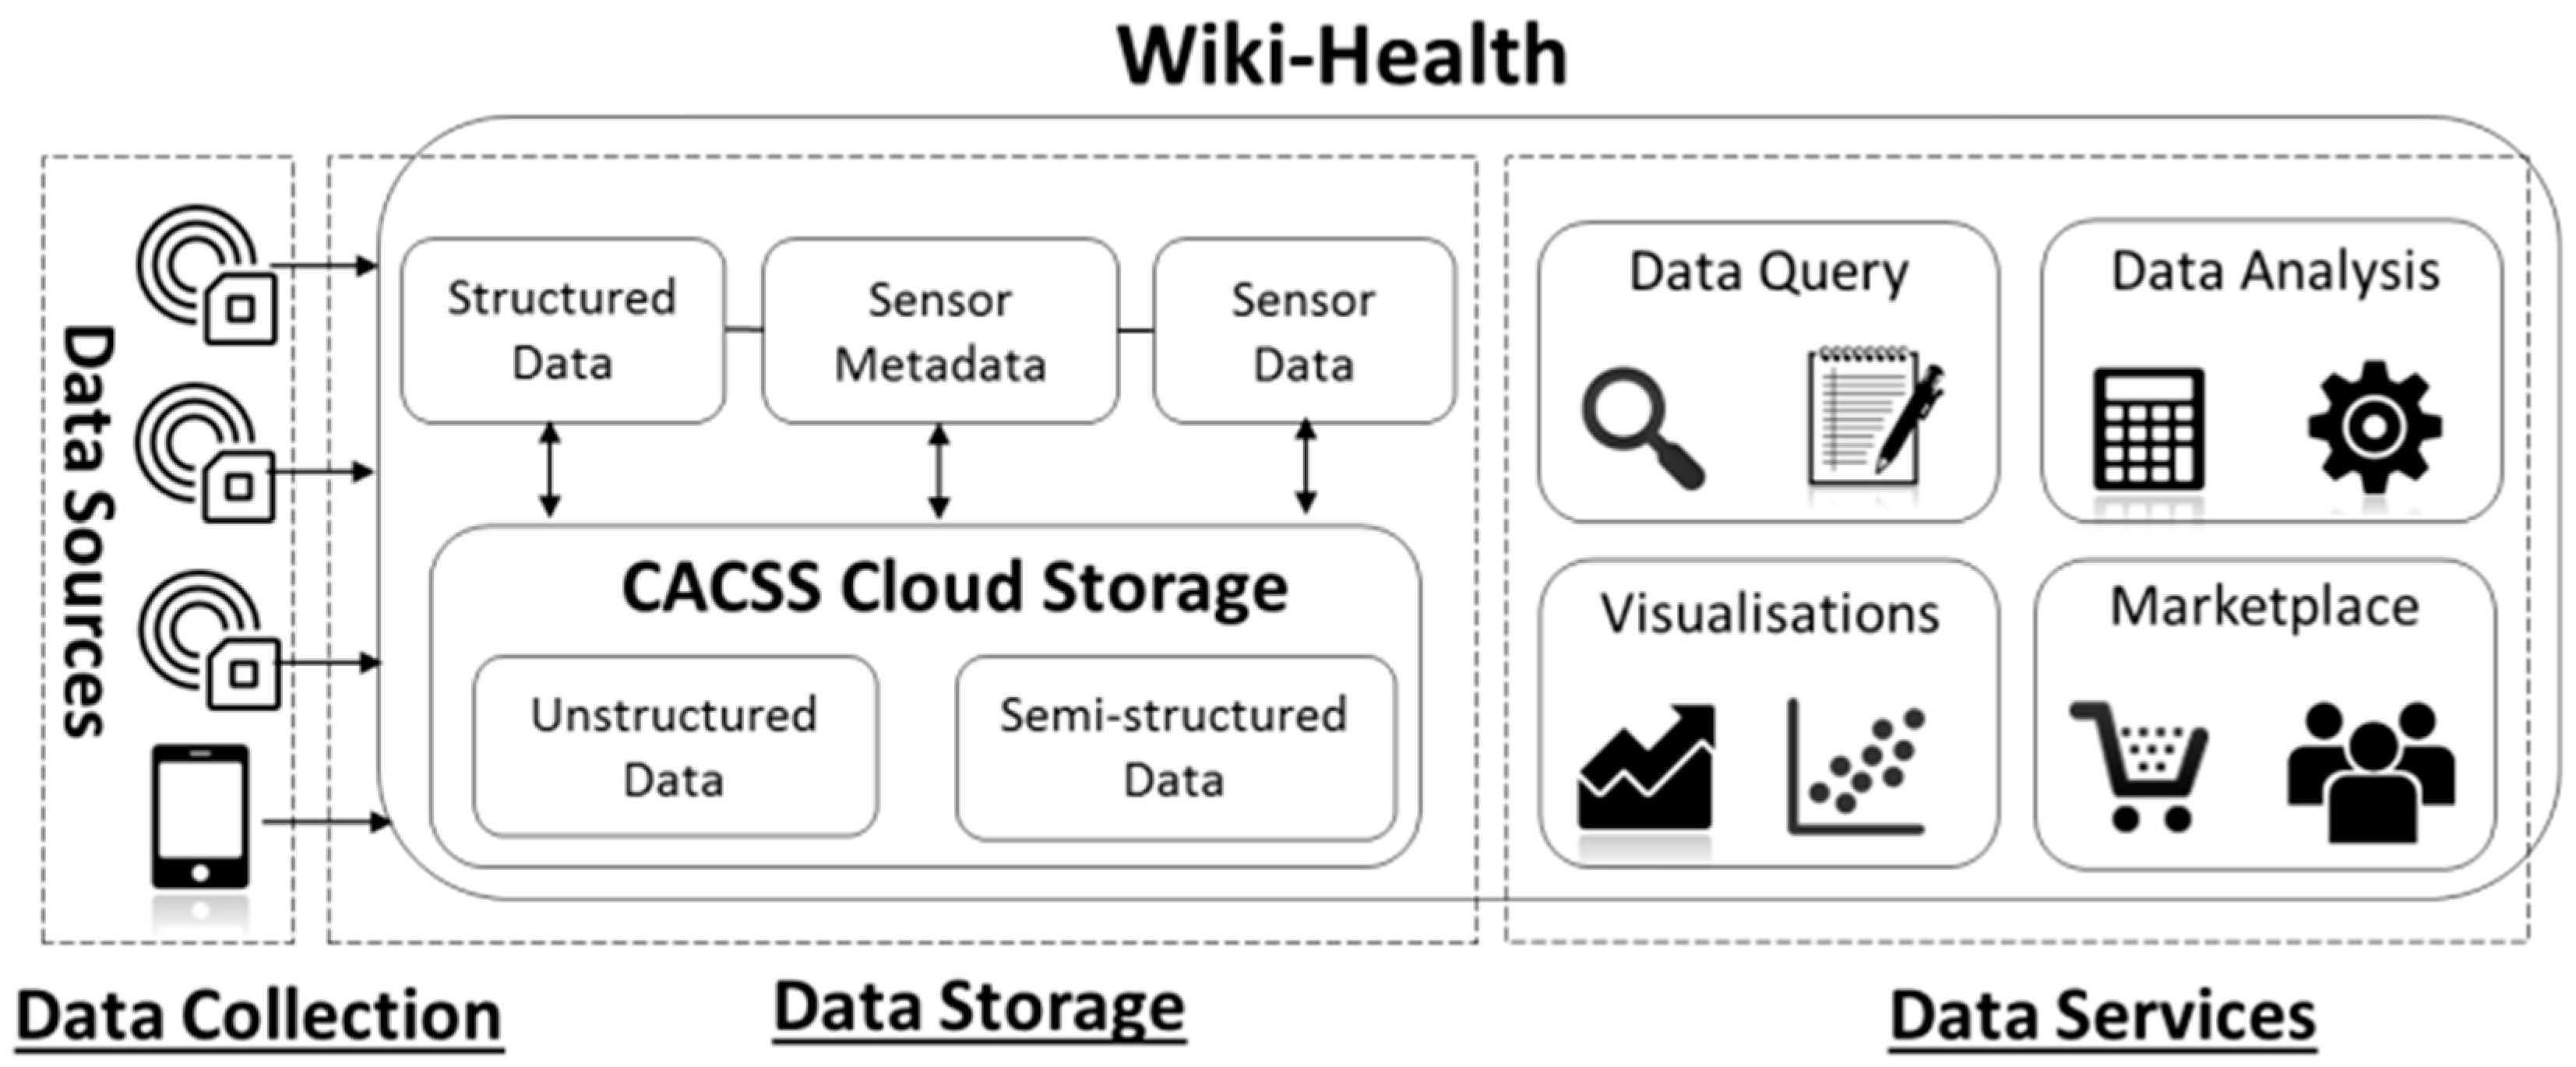
Data aggregation and the incorporation of sensor data management with crowdsourcing via online collaboration offer great potential for the healthcare sector; we envision these approaches will offer unique opportunities for the development of novel and innovative e-health applications.
The work in Reference [15] presents a SmartPhoto framework to rate the quality of crowd-sourced photos based on the geographical and geometrical information including the smartphone’s orientation, position and all related parameters of the built-in camera. The ShopProfiler [16] is an automatic profiling system with associated models to utilize crowd-sourced sensor readings from mobile phones to refine floor plans and characterize shops in terms of location, category and name with little human intervention. Artikis et al. [17] proposed a system for heterogeneous stream processing and crowdsourcing supporting intelligent urban traffic management. The system is able to detected complex events related to the urban traffic using the data collected from different sensors. The work in [18] introduces an approach of adopting a large number of GPS trajectories from multiple users to discover the correlation between users and locations, and mine interesting locations and classical travel sequences. Welbourne et al. [19,20] proposed a crowdfunded and crowdsourced methodology that uses crowdfunding to finance the collection of mobile datasets by paying participants who contribute their data. Collected data and survey responses are securely uploaded and stored on their server where researchers can access and analyse them throughout the course of the study.

3. Wiki-Health

Wiki-Health is designed to tackle some of the key challenges of managing and making use of the big data collected from contemporary sensor devices. It provides a unified solution for collecting, storing, tagging, retrieving, searching, and analyzing health sensor data. For reference, the architecture of Wiki-Health is presented in Figure 1. A detailed description is documented in our previous papers [7,8]. In this paper only the key components relevant to data services will be discussed.

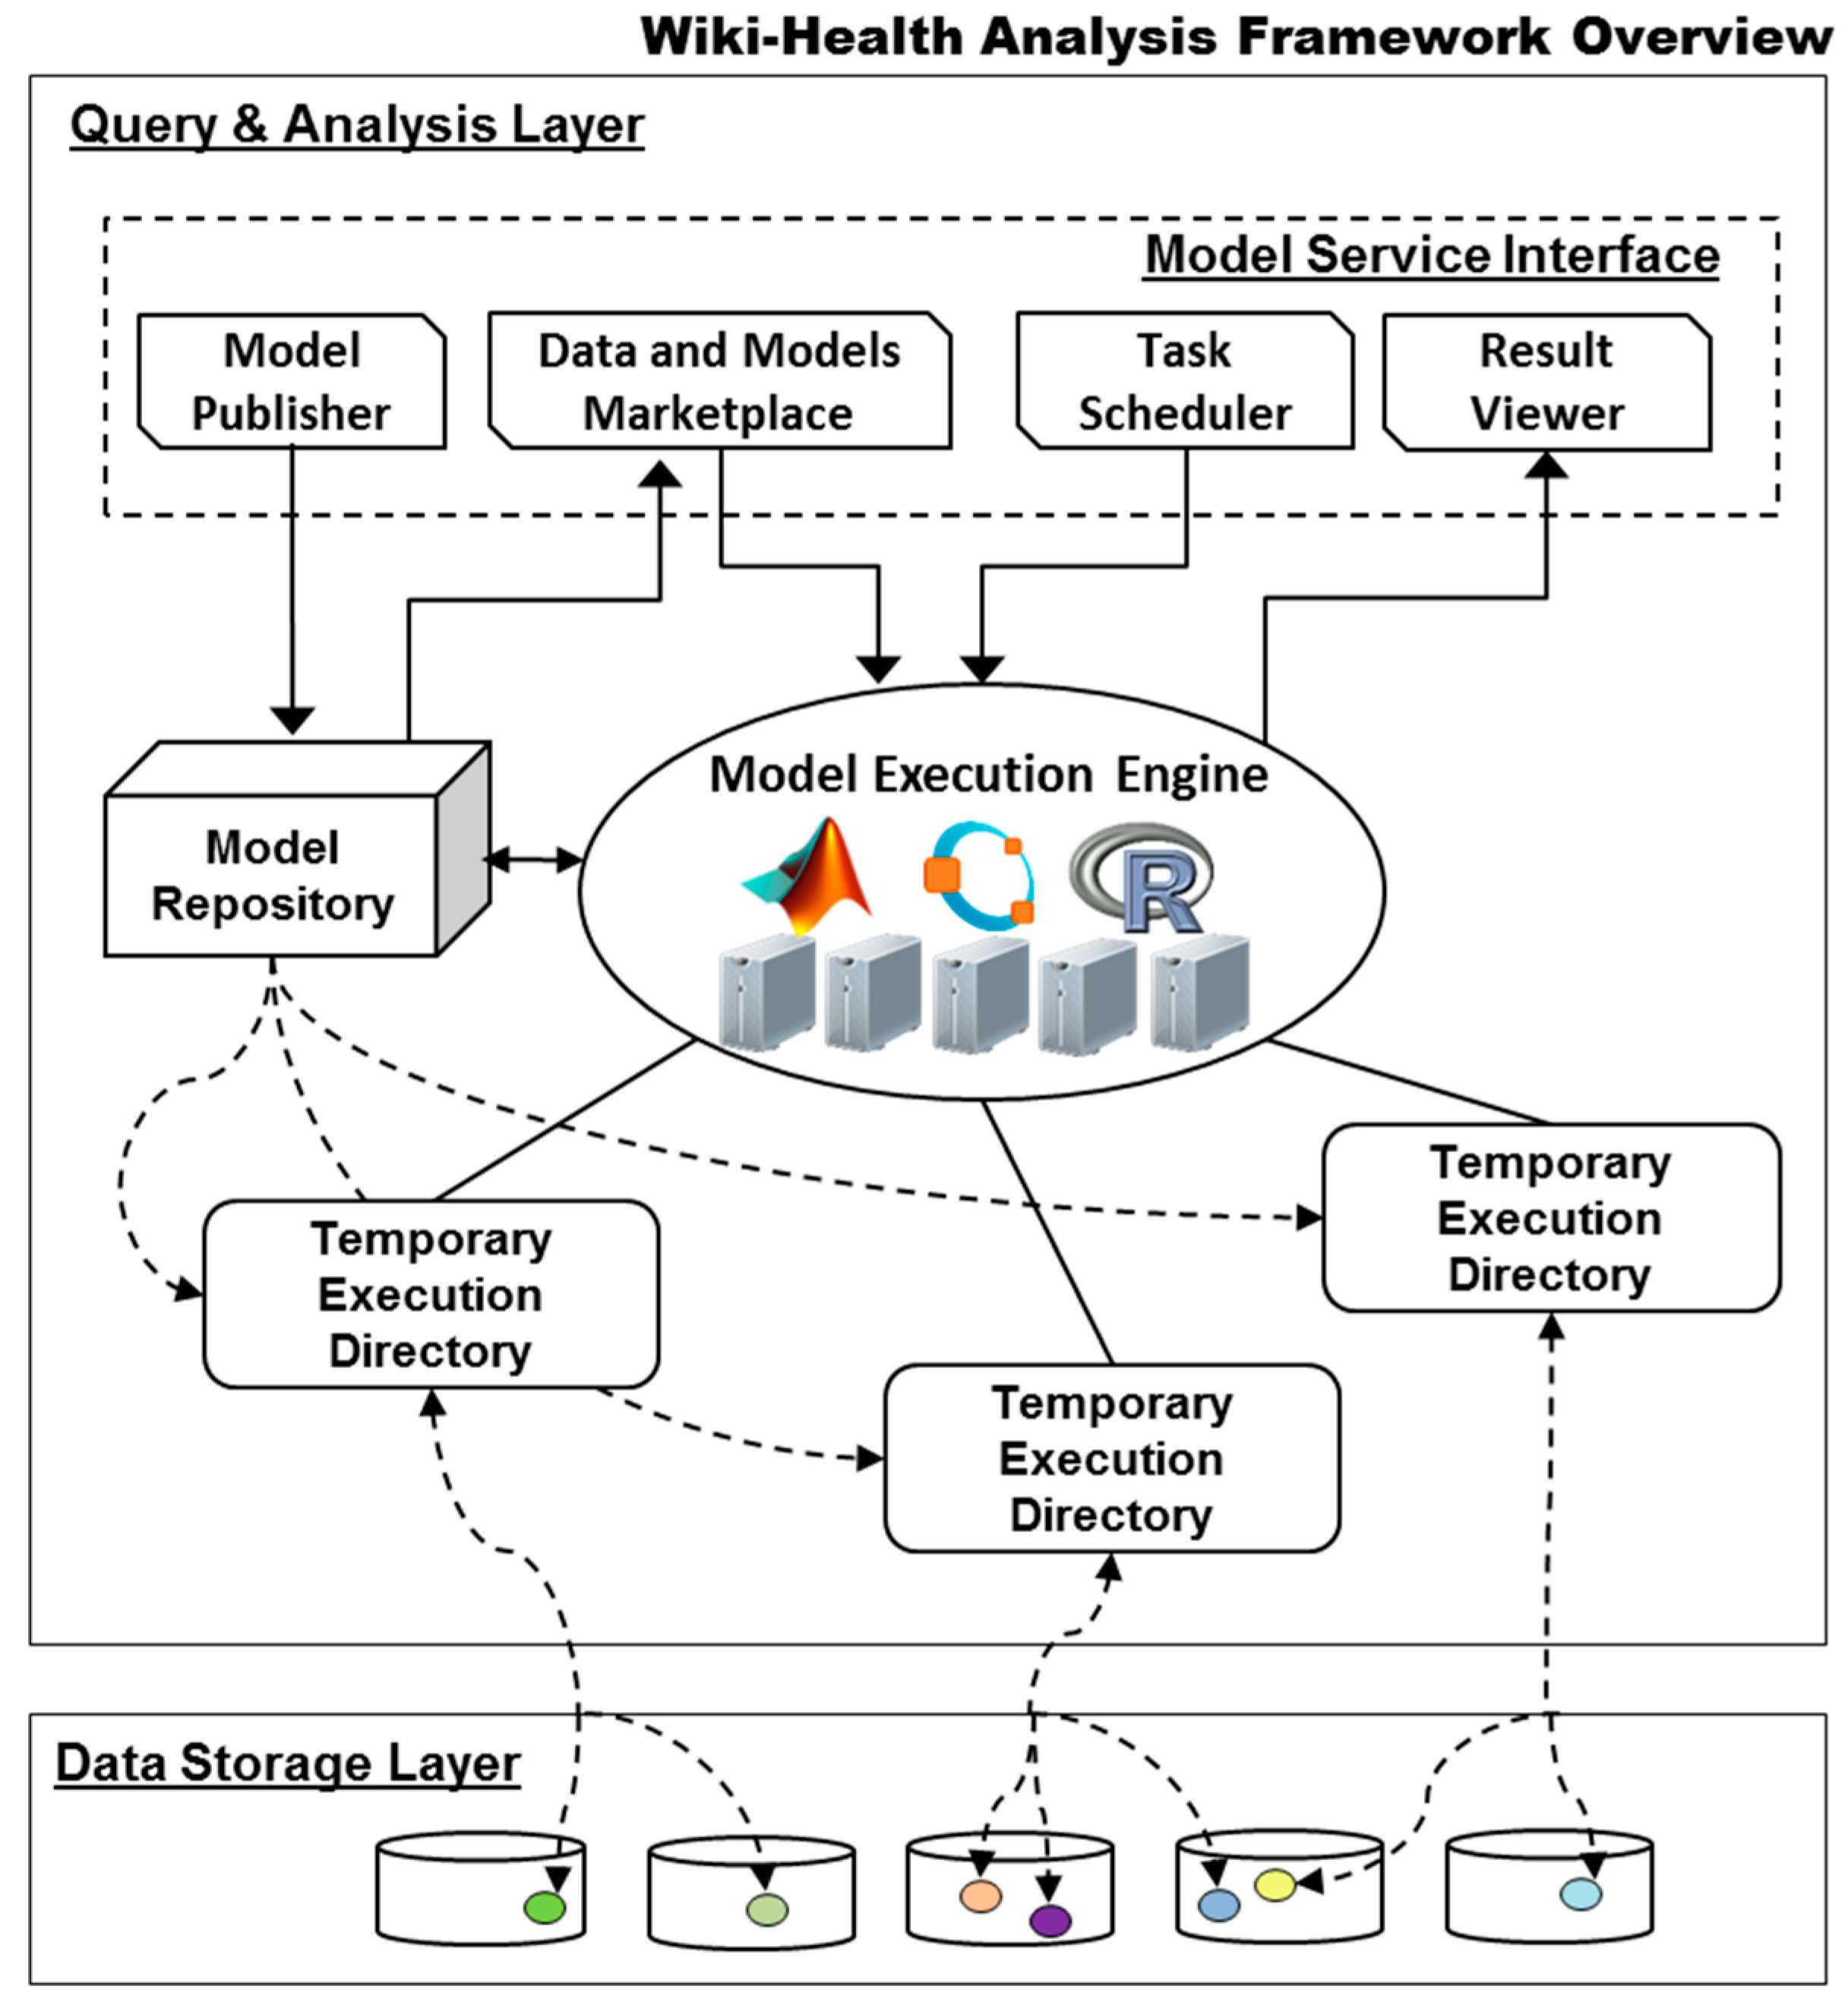
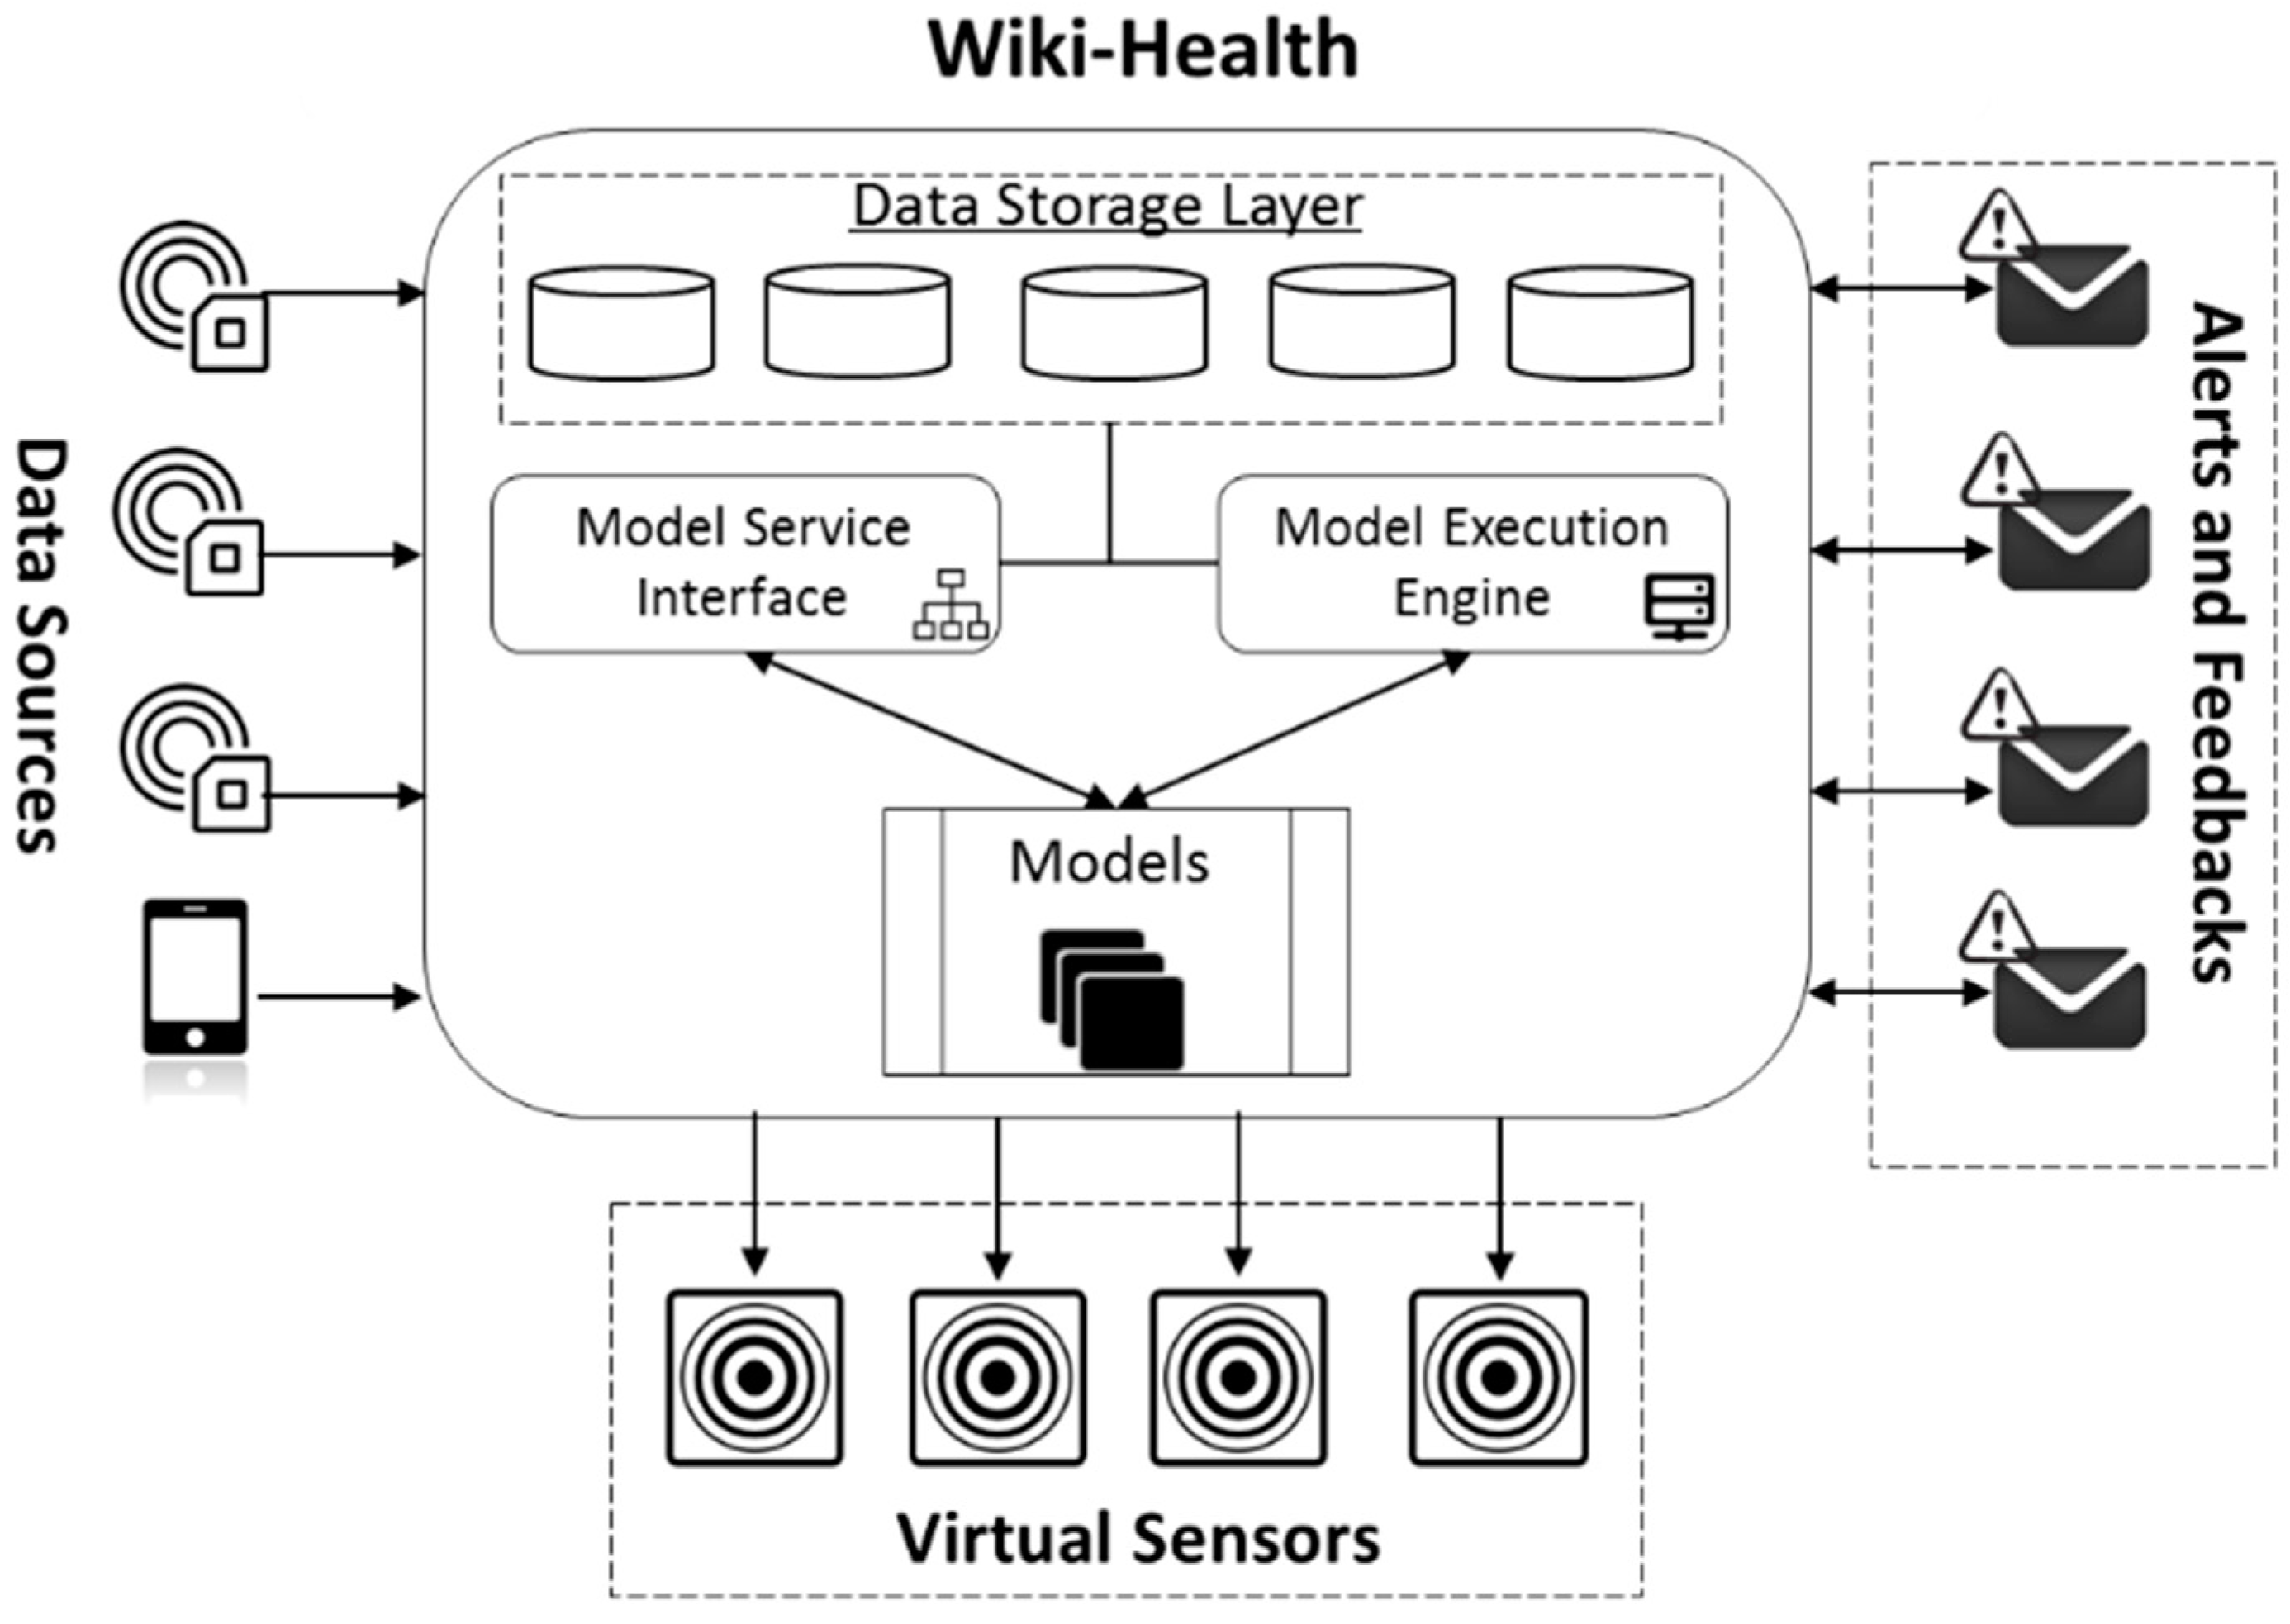
3.1. Wiki-Health Analysis Framework

The Wiki-Health Analysis Framework (WHAF) proposes an ecosystem that supports scientists, developers, and professionals (service vendors) in publishing their data analysis models as utilities in the cloud, and one that also allows users to access those services and utilize their collected sensor data without any expert knowledge. Figure 2 shows the overview of WHAF which consists of the following key elements: the Model Execution Engine, Model Publisher, Data and Models Marketplace, Task Scheduler, Result Viewer, and Model Repository.
Model Publisher provides both web page and API access for model vendors to publish their models as services. To publish a model, developers need to describe what the model service will do; specify the required permissions for accessing user’s data, detail the terms and conditions of the model service, upload all the function files for the model to execute; define the formats of all the input and output parameters for the Main Function; and finally, set the price and how it is charged according to usage. Currently, we have implemented pay-per-use and one-off pricing models for the proof of concept.
The Data and Models Marketplace allows data and analysis models to be traded as commodities between service vendors and service users.
Task Scheduler is used to schedule the model execution tasks to the Model Execution Engine. Result Viewer provides an interface for service users and vendors to visualize and obtain analysis results and logs. Model Repository is used to store all user and system defined functions, analysis models, and associated files published through the Model Publisher.
Model Execution Engine (MEE) is designed to deliver services for executing data analysis models in cloud environments and preserving execution codes within existing problem solving environments like MATLAB [21], Octave [22] and R [23]. The Temporary Execution Directory (TED) is created for each MEE task to be used as the working directory for executing the model and hosting the data migrated through the Data Storage Layer. For different model environments, we write different wrapper functions that handle the inputs and outputs for the Main Function accordingly.
For each model, key information related to the execution such as filename, inputs, outputs and actions for the Main Function needs to be defined by the service vendor. Service users only need to map the inputs and outputs to their sensor data for using the published services. At the end of each task, MEE conducts the corresponding actions defined either by the service publisher or the user—such as persisting output data through the Data Storage Layer to the underlying databases, and triggers message alerts.

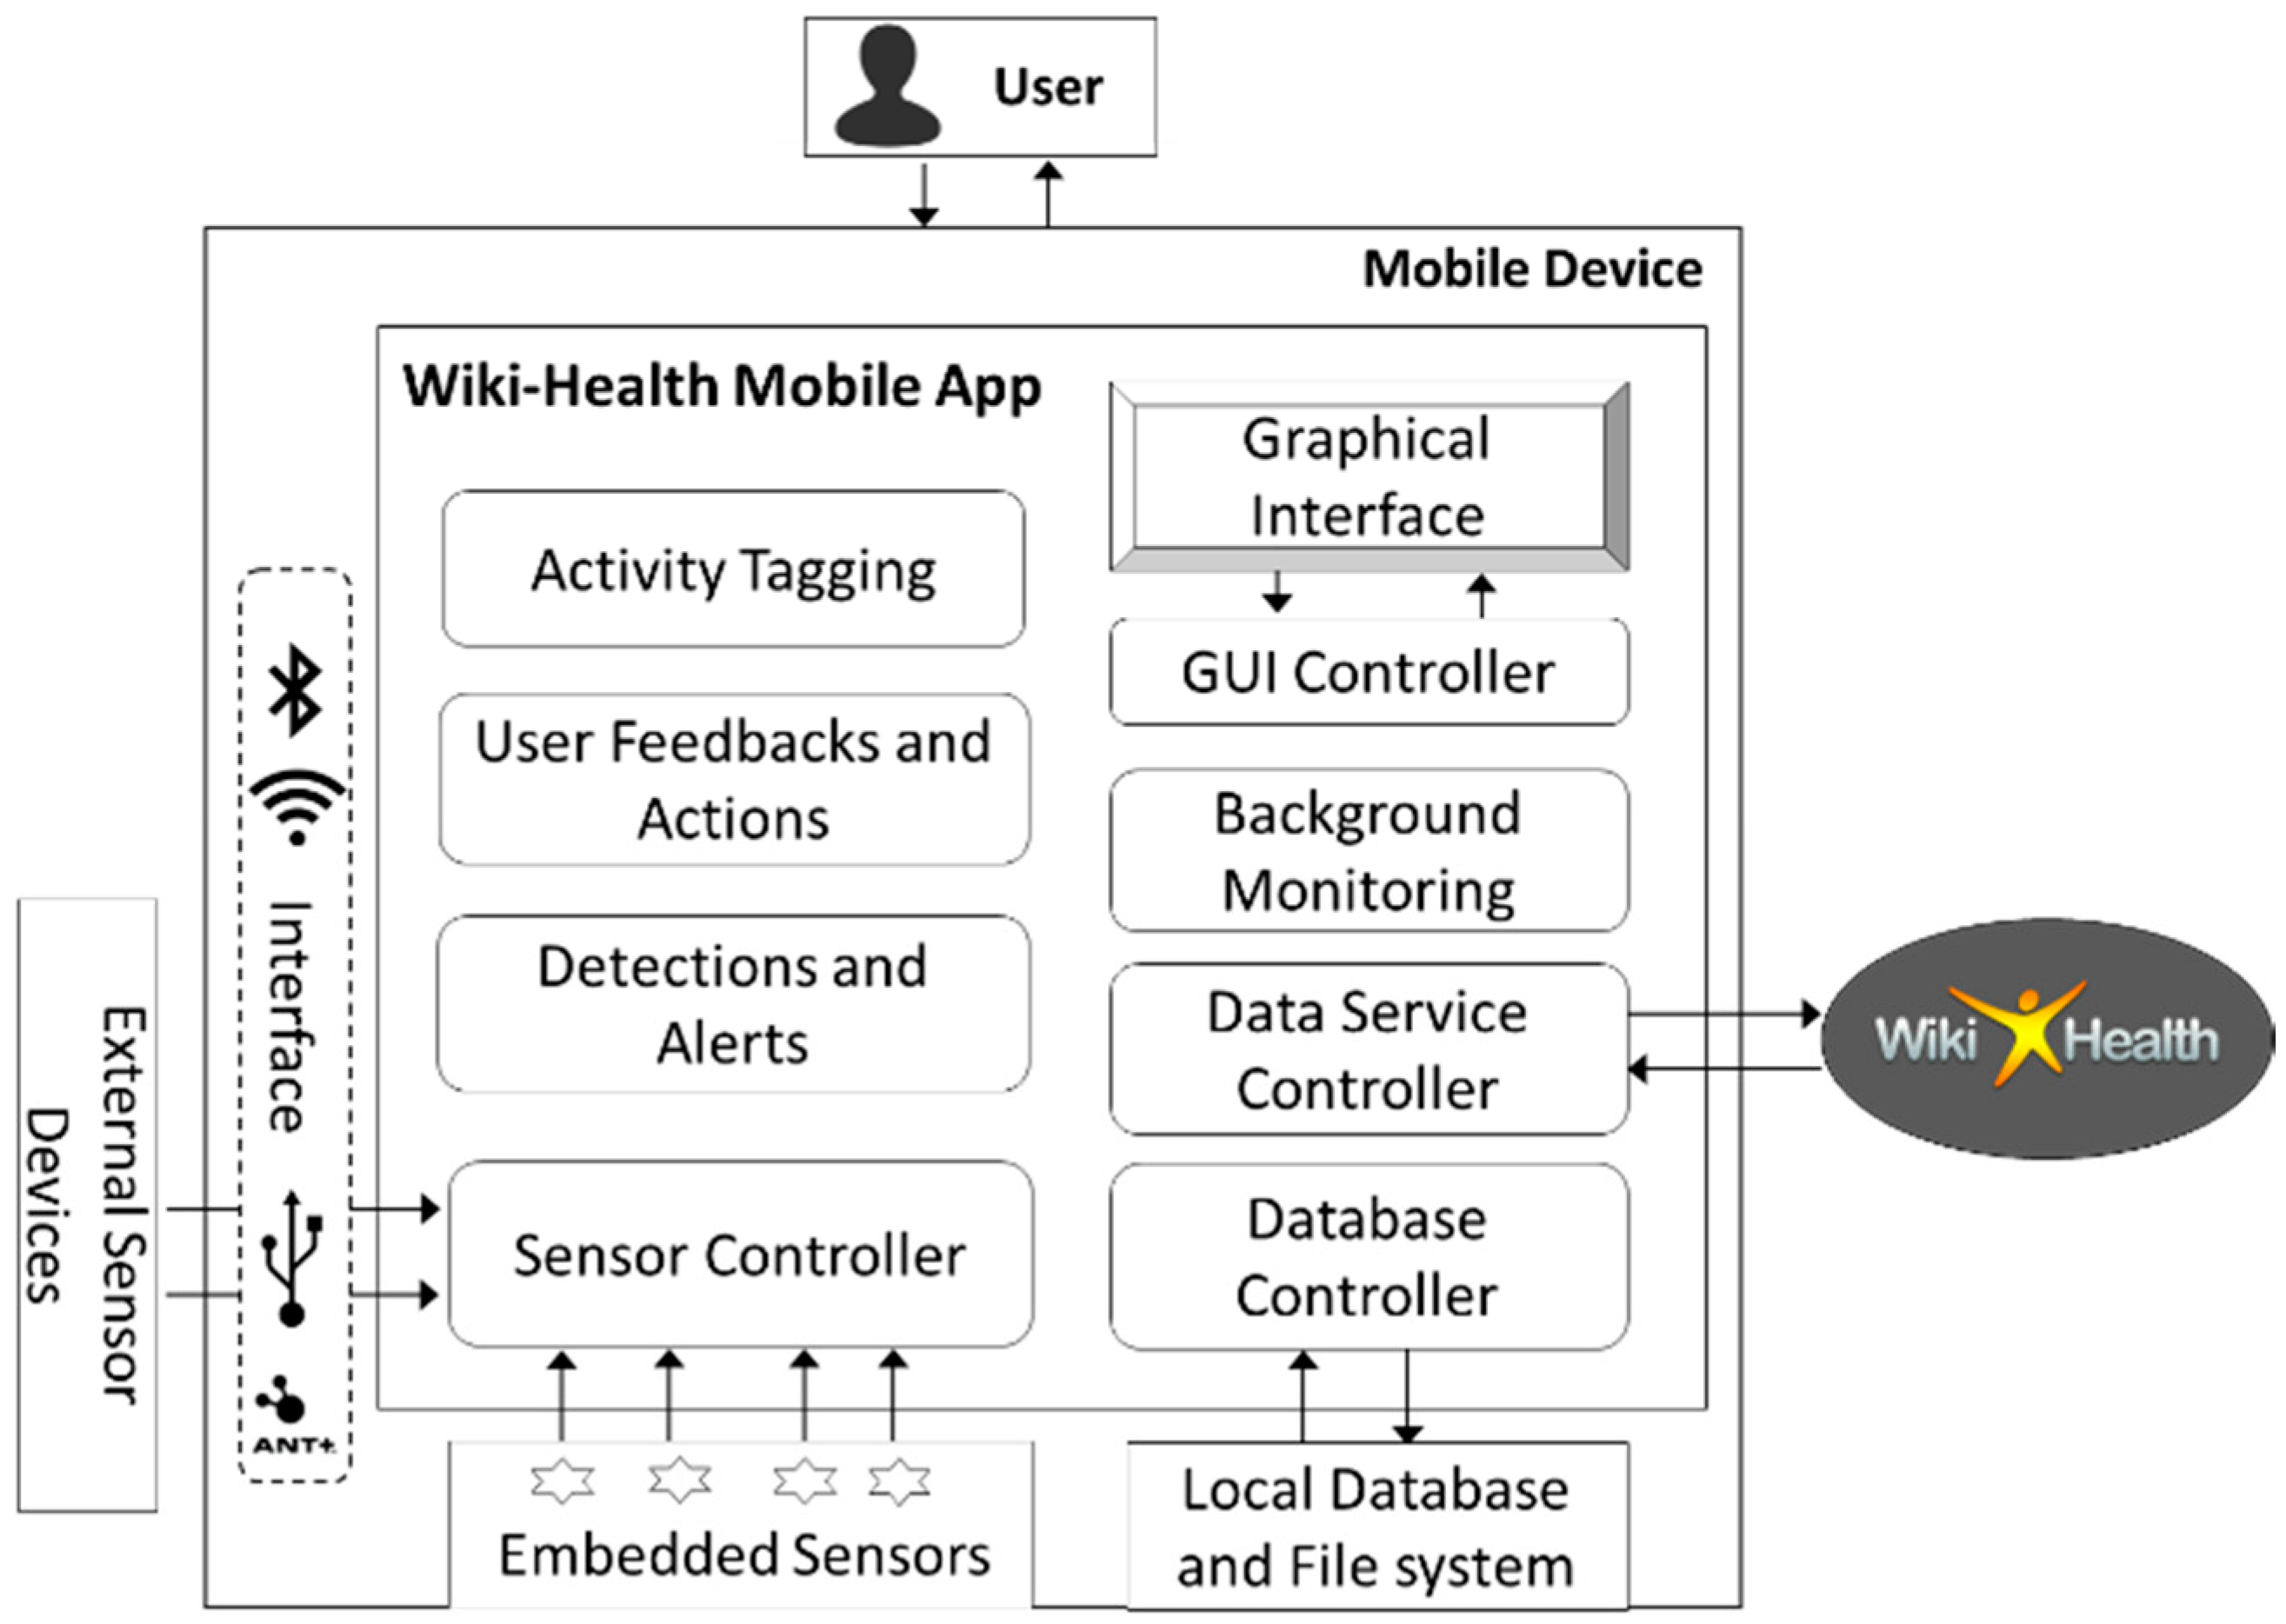
3.2. Wiki-Health Mobile App

Labelling, tagging or annotating sensor data is often useful for identifying the correct event, stimulus or cause associated with a corresponding sequence of sensor data. Such labels are useful for data analysis algorithms. Therefore, we have developed a mobile application as part of the platform to help users collect and tag sensor data from smartphones. The application can also be used to trigger alerts and interact with feedback from Wiki-Health through the platform API. As shown in Figure 3, the design of the mobile app can be divided into the following mechanisms:
Background monitoring—provides all the necessary functions responsible for the periodic acquisition of measurements from the sensors of the device and their storage in the local database. Users can select the sensors for monitoring in the background and how frequently data is collected and stored.
Activity labelling—refers to the mechanism of giving users the ability to enter information about their activities. It allows them to tag and enter additional information about their activities during specific hours of a selected date. Such information is annotated and linked to the collected sensor data and stored in the local database.
Data uploading—is the mechanism containing all of the operations related to the communication between the application and the remote storage space. Users can choose whether to automatically upload the collected data to Wiki-Health periodically or store the data locally in a private database from the application before uploading to Wiki-Health through the API. The latter option is designed to improve privacy control—users can remove any unwanted collected data, so that only user-selected data will be uploaded. In addition, since uploads might not to be performed regularly by the user—as well as in cases where the sampling rate of the sensor is high—it is possible to store a large amount of data in the local database. To send the data efficiently, the collected data is divided into small chunks and sent successively. Data stored in the local database is deleted only if the upload has been successful, so as to prevent data loss during unexpected events.

3.3. Virtual Sensing as a Service Overview

Virtual sensors can be useful in many situations such as simulating the performance of athletes and workers under extreme physical conditions; obtaining real-time indirect measurements using other measured variables and triggering alerts. For this study, virtual sensors are constructed as a new service layer adopting the functionalities of Wiki-Health platform (as shown in Figure 4). Data collected from the Wiki-Health Mobile App and physical sensors can be used for data analysis and simulation purposes. For end users, the enabling of a virtual sensing service with Wiki-Health requires almost no knowledge of the computation. The user only needs to select the service from the data and models marketplace and configure the mappings of inputs and outputs, such as selecting the physical sensor streams to be used for the virtual sensing service and entering the mobile phone number or email address of the health supervisor for triggered alerts.
In the following sections, we illustrate the thermoregulatory and physiological models derived for calculating core temperature in humans and demonstrate how these models can be integrated with available measurable sensors to implement the proposed virtual sensing service.

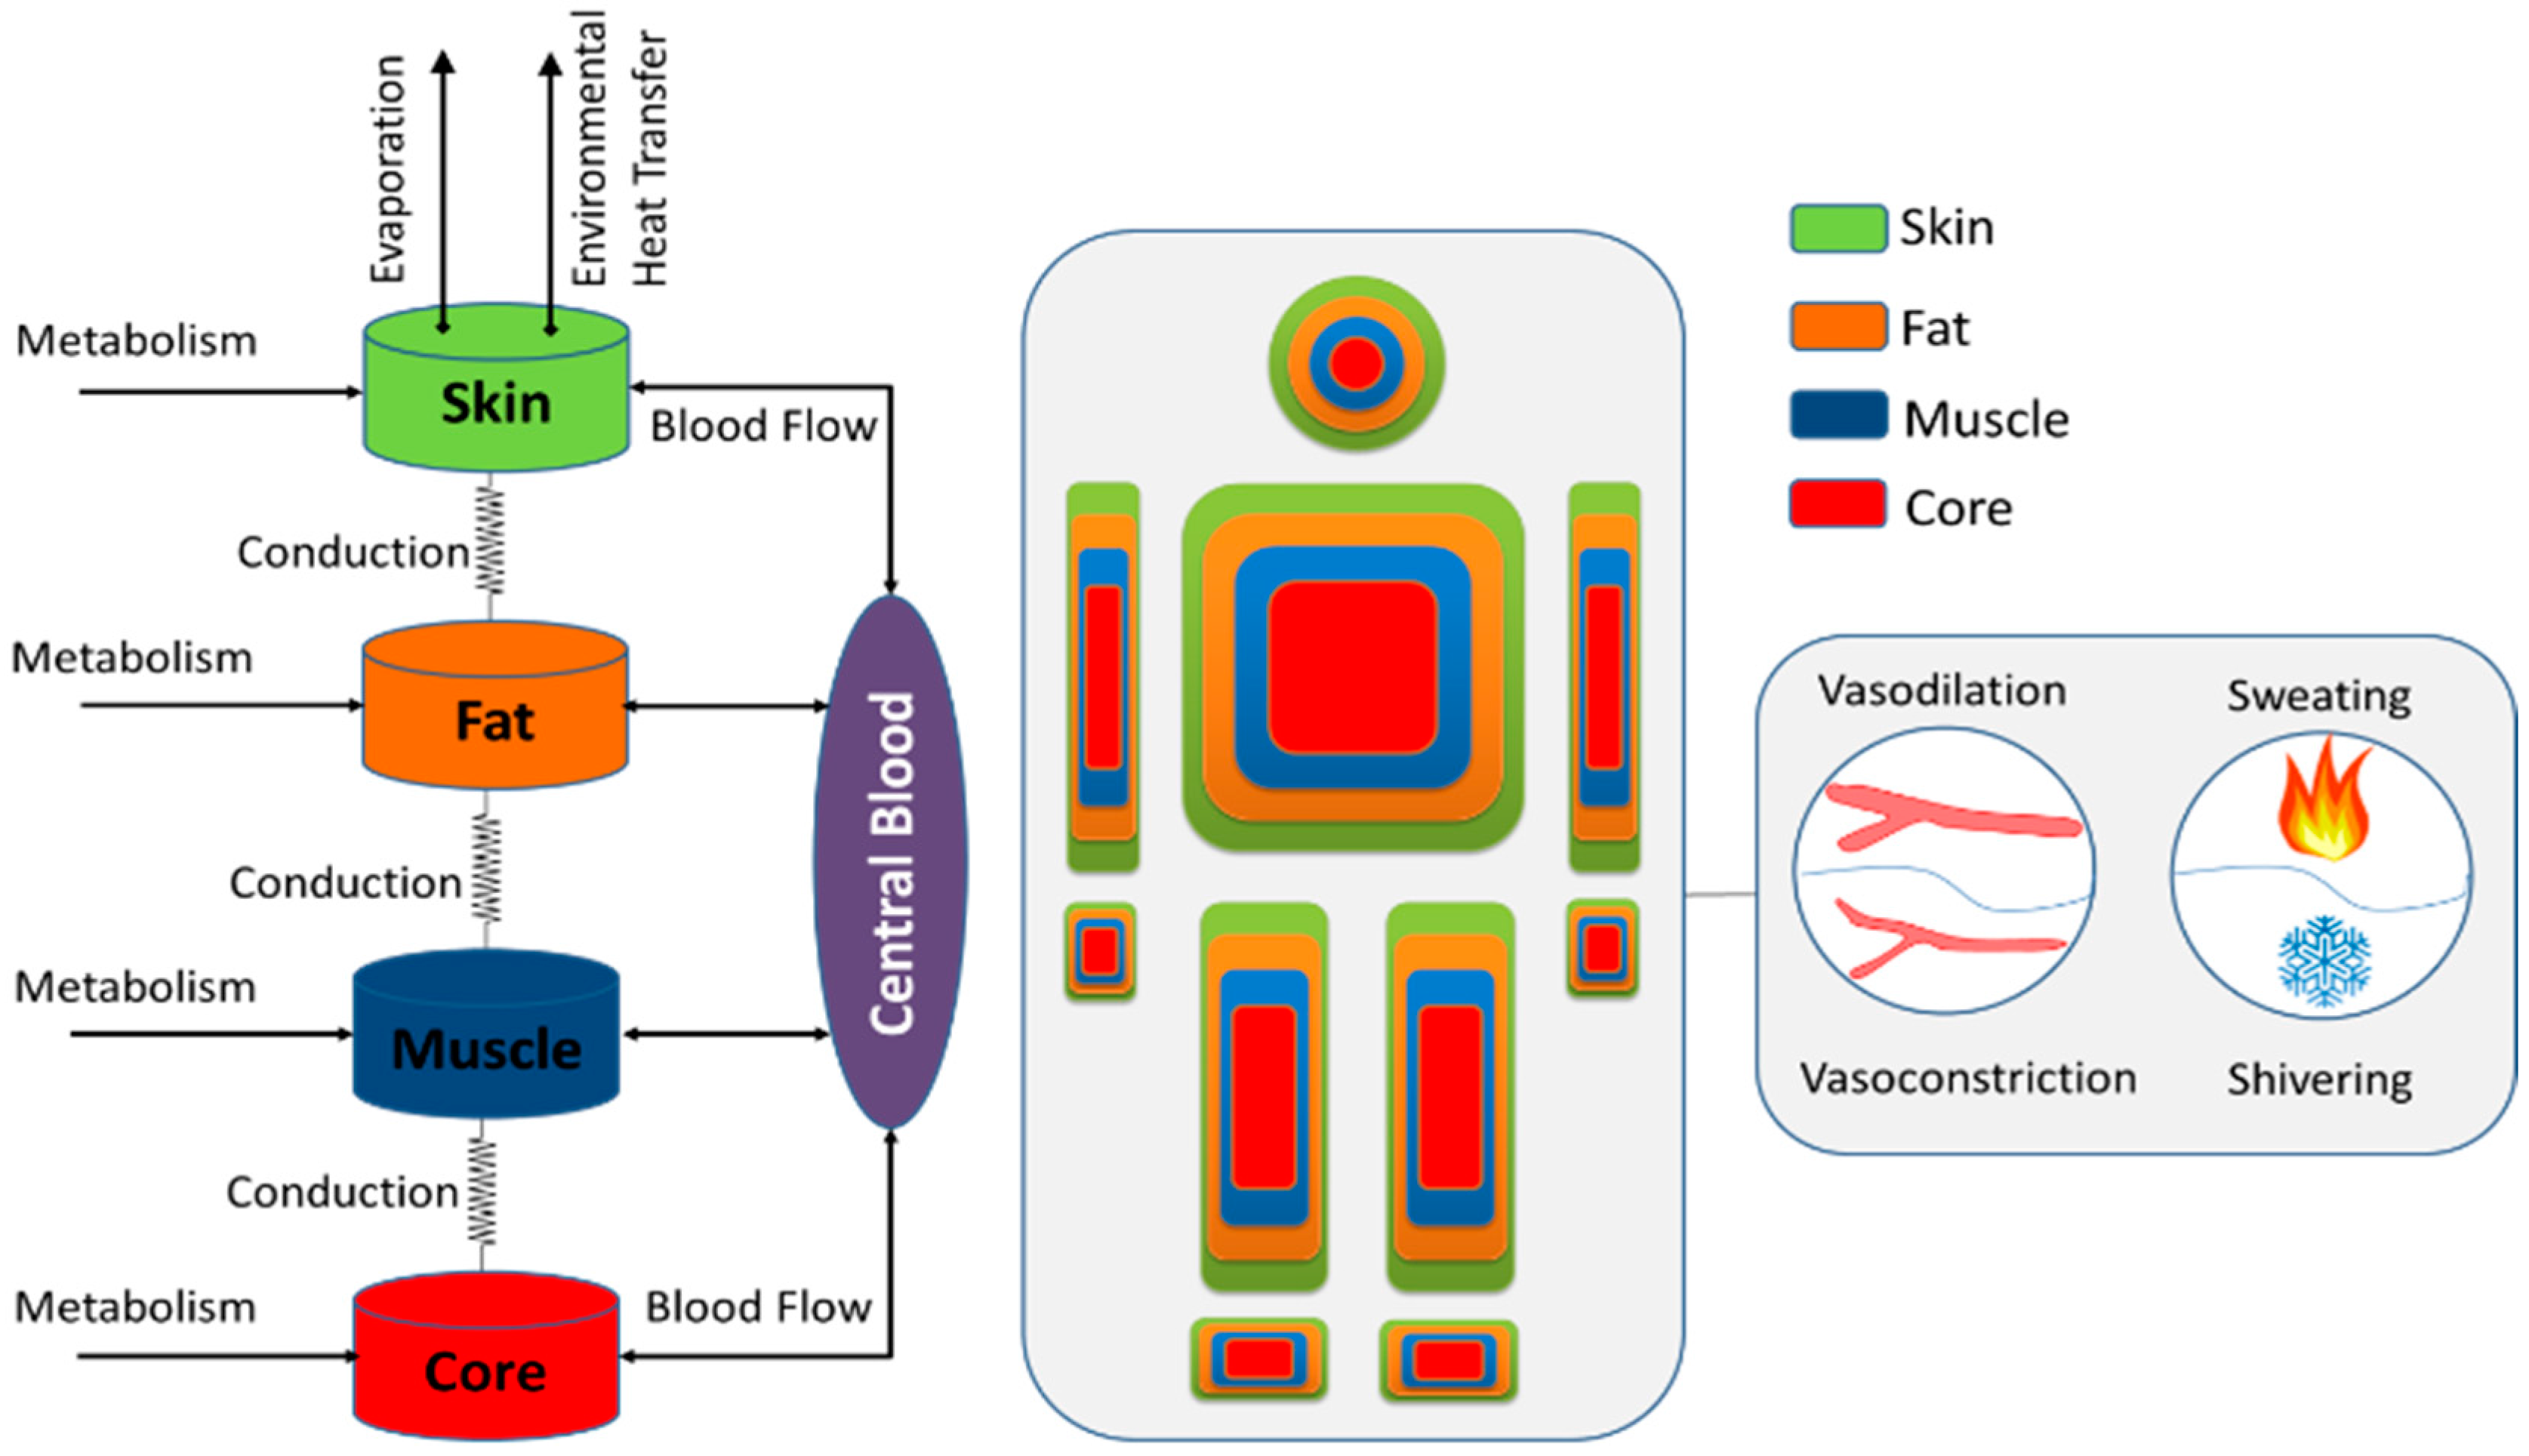
4. Full Body Model Associated with Human Temperature and Energy Transformations

Humans, like other mammals, are able to maintain a constant body temperate in different environments. The thermoregulatory system of the human body is a complex, sophisticated system that detects, interprets and reacts to changes in internal and external environment conditions. The mechanisms of thermoregulation are designed to keep us healthy within narrow temperature limits, generally between 36.5 and 37.5 °C [24]. Humans might experience both physiological and psychological signs related to temperature fluctuations beyond the normal range. Human body temperature can be affected by many factors, such as climate, illness, physical activity level, emotions, age and clothing. Understanding the state of the thermoregulatory system in humans can help save time and effort in identifying potential health risks. Considerable research has already been performed by scientists in the area of modelling, simulating and predicting thermoregulatory behaviours in humans.
A mathematical multi-node model of human physiology proposed by Stolwijk [25] and employed by NASA in the Apollo program, has been one of the most influential works in this area, serving as the basis of understanding with which many physiology researchers have been to obtain a deeper insights into the principles of the human thermoregulatory model. It is chosen as the fundamental physiology model for the virtual sensing service in this study.
In this section, some key equations and parameters of Stolwijk’s model are presented. Details of the remaining parameters and functions can be found in the original paper [25].

4.1. The Controlled System

In Stolwijk’s model, two separate systems are proposed: the controlled system and the control system. The controlled system of the human body consists of six segments: head ( i = 1 ), trunk ( i = 2 ), arms ( i = 3 ), hands ( i = 4 ), legs ( i = 5 ) and feet ( i = 6 ). Each of these segments has four layers: skin, fat, muscle and core. In total, they contribute to 24 nodes (as shown in Figure 5). Central blood is considered the 25th node, flowing through the other 24 nodes and exchanging heat with the tissue.
Table 1 and Table 2 illustrate some of the constants and parameters that are used for the model, where N is the number of the node ranging from 1 to 25. For each node N , C [ N ] is the heat capacity of the node, Q B [ N ] is the basal metabolic heat production of the node, E B [ N ] is the basal evaporative heat loss including the respiratory heat loss from the trunk core, B F B [ N ] is the basal effective blood flow of the node and T C [ N ] is the thermal conductance between two adjacent nodes ( N and N + 1 ). The basic principle of the heat exchange for any node can be written as:
H F [ N ] = H e a t   P r o d u c t i o n ( H P ) H e a t   L o s s ( H L )
H P =   M e t a b o l i c   H e a t   P r o d u c e d
H L =   C o n v e c t i o n + C o n d u c t i o n + R a d i a t i o n + E v a p o r a t i o n
where H F represents the heat gain or loss of node N . For different nodes, heat can be gained or lost through the following processes: convective heat exchange with the central blood, conductive heat exchange with adjacent nodes, and radiant and evaporative heat exchange with the environment. For core nodes, muscle nodes, fat nodes, skin nodes and the central blood node, H F can be calculated using following formulae for each value, respectively:
H F [ i ] = Q [ i ] E [ i ] B C [ i ] T D [ i ]
H F [ i + 1 ] = Q [ i + 1 ] B C [ i + 1 ] + T D [ i ] T D [ i + 1 ]
H F [ i + 2 ] = Q [ i + 2 ] B C [ i + 2 ] + T D [ i + 1 ] T D [ i + 2 ]
H F [ i + 3 ] = Q [ i + 3 ] B C [ i + 3 ] E [ i + 3 ] + T D [ i + 2 ] H [ i ] × ( T [ i + 3 ] T A I R )
H F [ 25 ] = N = 1 24 B C [ N ]
where H [ i ] = ( H R [ i ] + H C [ i ] × ( V A I R 0.1 ) ) × S [ i ]
The conductive heat transfer T D from node N to node N + 1 can be written as follows:
T D [ N ] = T C [ N ] × ( T [ N ] T [ N + 1 ] )
The convective heat transfer B C can be calculated using the following formula:
B C [ N ] = B F [ N ] × ( T [ N ] T [ 25 ] )
For any object, the relationship between the heat transferred ( Δ H T ), the change in temperature ( Δ T ) , and heat capacity ( C ) can be determined as follows:
Δ T = Δ H T C
Therefore, the rate of change in temperature of any node i can be calculated by:
Δ T [ N ] = H F [ N ] C [ N ]

4.2. The Controlling System

In Stolwijk’s model, the controlling system consists of thermal sensors throughout the body. The brain receives signals from the sensors and sends commands to various effector systems. The difference between reference signals that can be seen as the thresholds for initiating effector responses, and the received signals of actual temperature is regarded as the error signal [26]. If body temperature is elevated beyond reference, a positive error is generated. Consequently, the system will send commands to various organs to promote heat loss through sweating and vasodilation. If the temperature is decreased and lower than the reference, negative error is obtained. The system will try to preserve body heat through vasoconstriction and shivering.

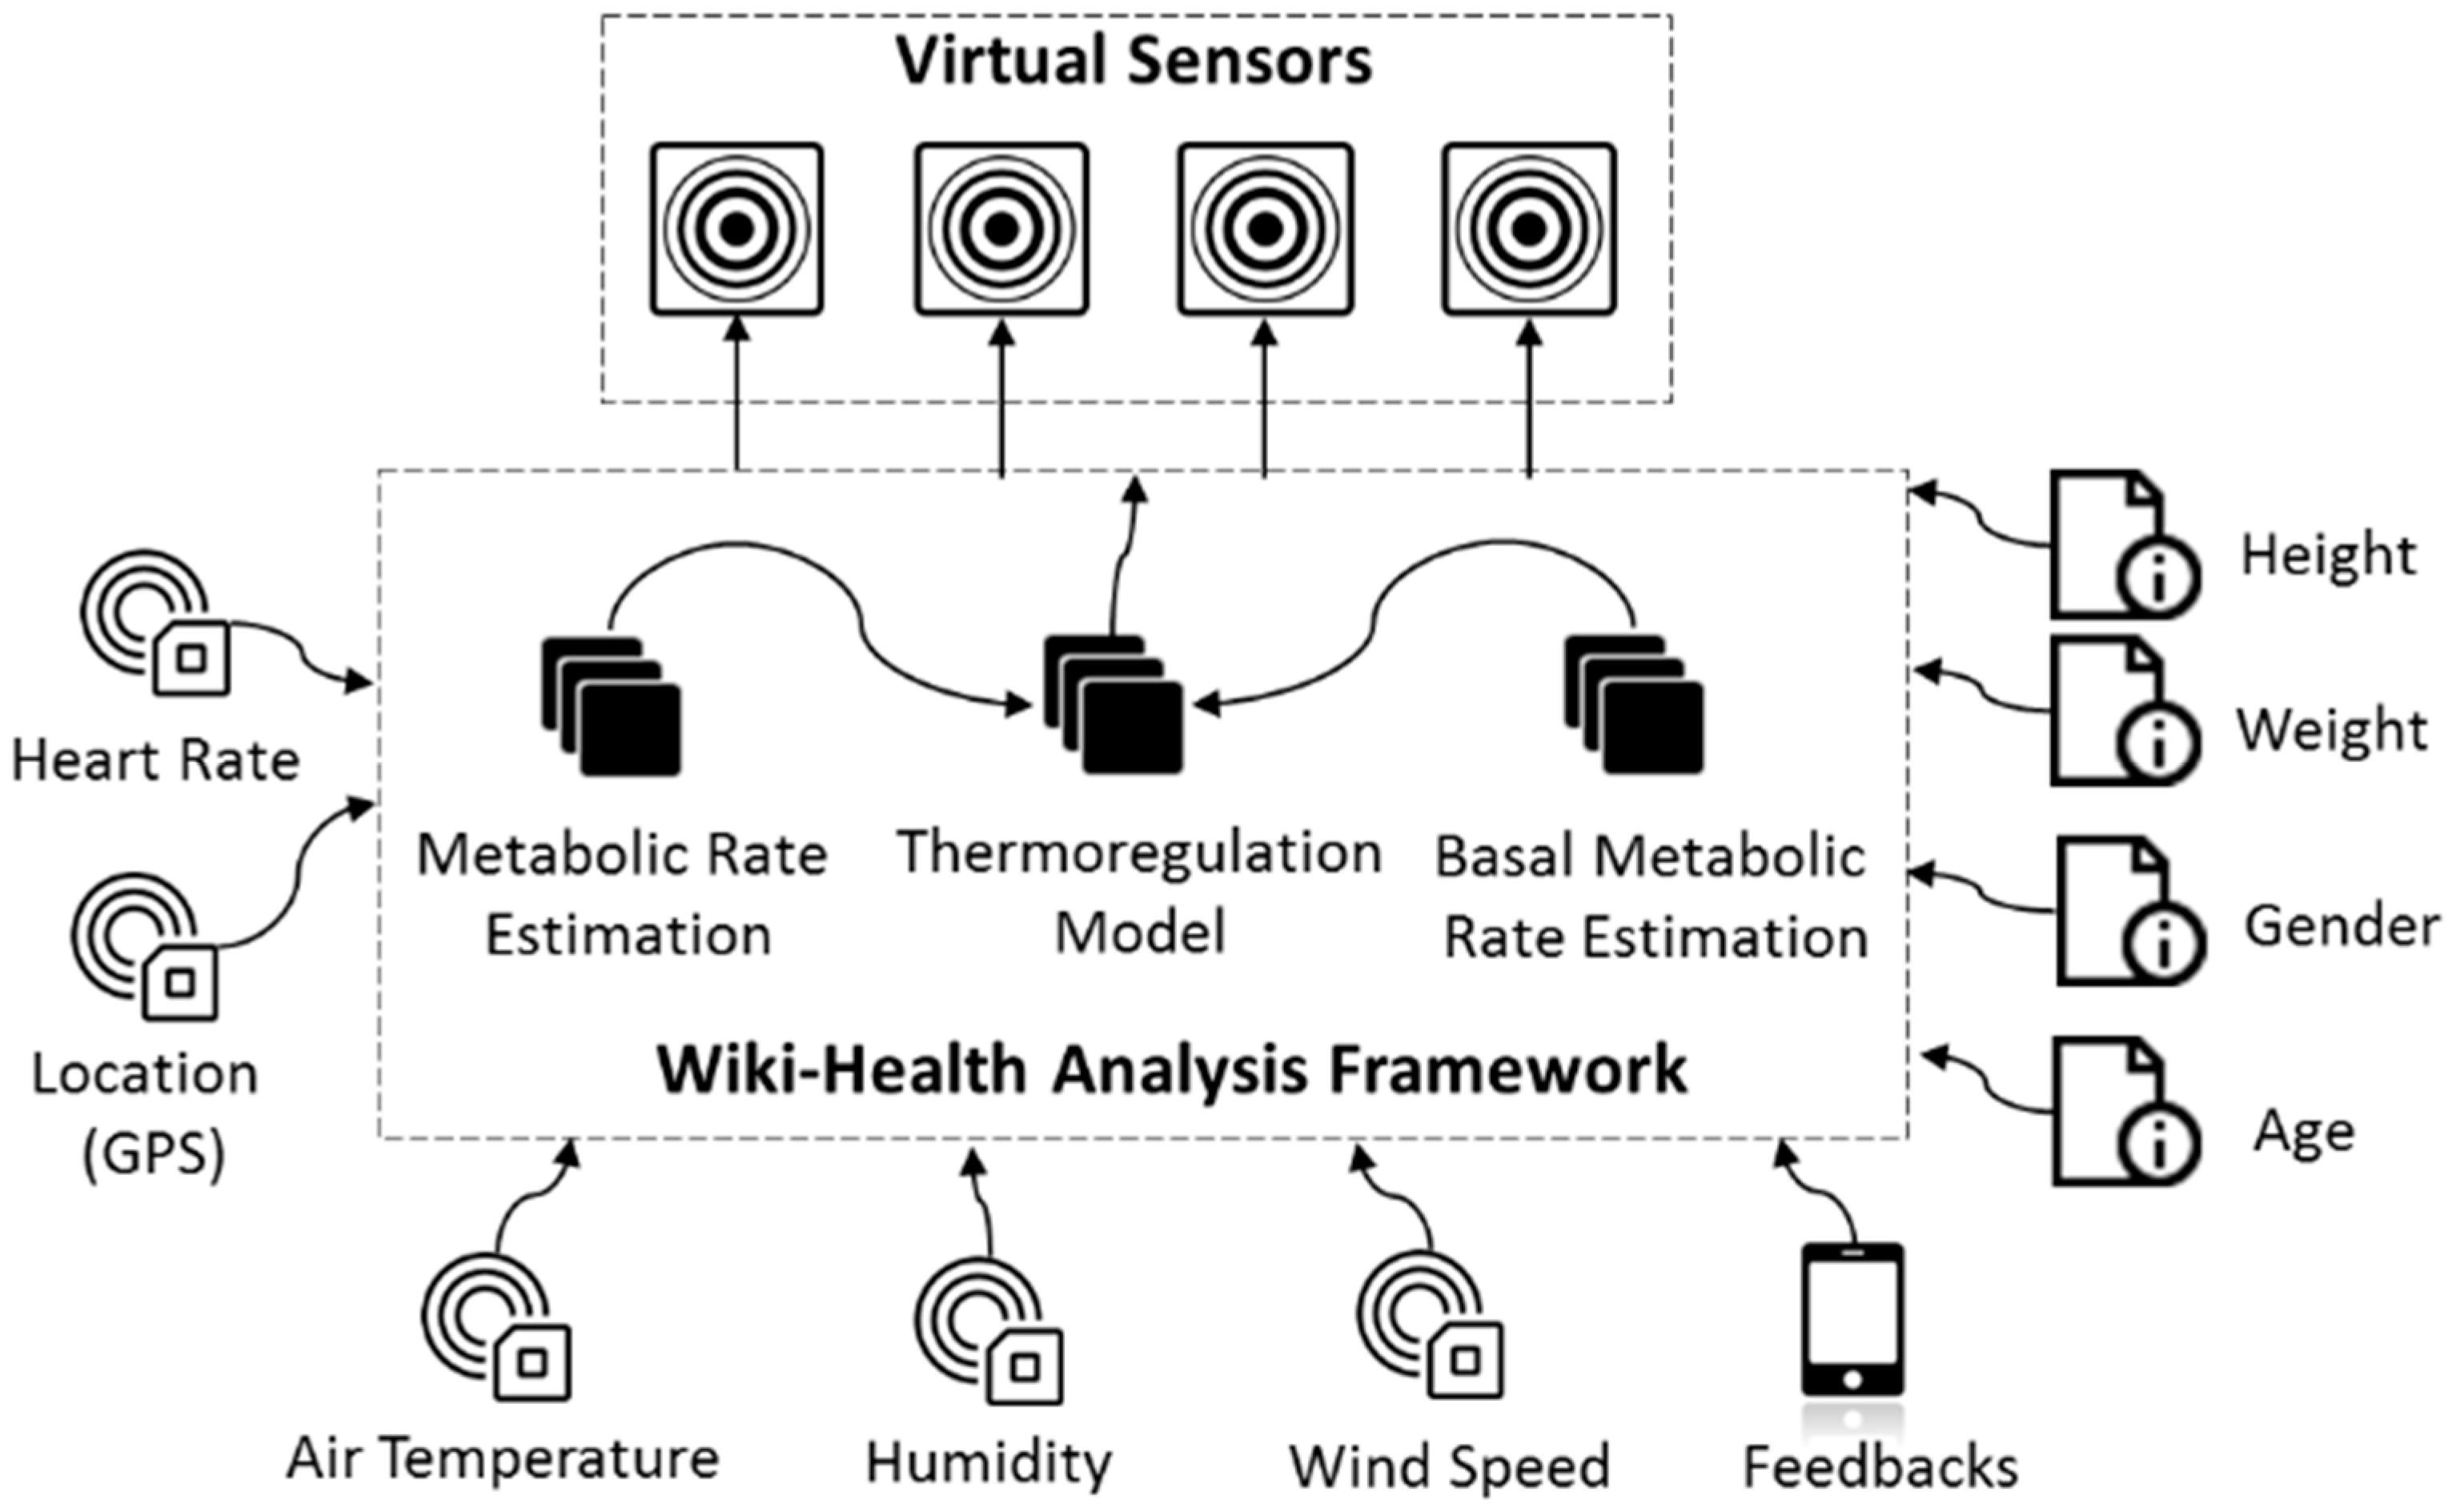
5. Model Integration and Implementation

To simulate the thermoregulation of the human body under different environmental conditions and physical activities, the original model proposed by Stolwijk [25] requires inputs of air temperature, air velocity, relative humidity in the environment, metabolic rate created by external work, basal metabolic rate and the initial body temperatures of all the nodes. Many constants such as the surface area of each body segment and heat capacitance of each body node are based on a male subject with a body weight of 74.4 kg and height of 172 cm. To obtain accurate simulation results, the input parameters required by the model need to be set accurately. A previous limitation of this approach was that, up until recently, many of these parameters were hard to measure and record in real-time.
The recent development of modern technologies such as cloud computing, wearable sensor devices and big data have provided the means necessary for continuous, non-intrusive monitoring of physiological signals, vital signs and environmental conditions. In this section, we describe the proposed approach, which integrates different models and takes inputs from various data sources to compute and simulate virtual temperature sensor readings of various parts of the body.

5.1. Heart Rate Based Metabolic Rate Estimation

To estimate the metabolic rate (WORKM) required by Stolwijk’s model, we use the equations based on the mixed model proposed by Keytel et al. [27], which were derived from physical exercise experiments performed on 115 individuals. The equations have been adapted into the following form:
WORKM = 60 × 1 4.184 ( ( 55.0969 + 0.6309 × H + 0.1988 × W + 0.2017 × A )   + ( 20.4022 + 0.4472 × H 0.1263 × W + 0.074 × A ) × ( 1 G ) ) × G
where H is the heart rate (beat per minute), W is the body weight in kg, and A is the age in years. G is the gender (0 for females and 1 for males), and WORKM is the estimation of the work rate in terms of total heat production in kcal/h.

5.2. Basal Metabolic Rate Estimation

The Basal Metabolic Rate (BMR) is the rate of energy needed while resting in a neutral temperature environment during the post-absorptive state. In such a state, the energy is only sufficient for maintaining the function of vital organs, including heart, lungs, liver, intestine, kidneys, sex organs, nervous system, muscles, skin and brain. The Resting Metabolic Rate (RMR) is closely related to the BMR, and measurements of this parameter are usually taken under less restricted conditions. To estimate BMR, we use the equations for predicting RMR that were proposed by Mifflin et al. [28], derived from the data of 498 heathy subjects obtained using indirect calorimetry. For our purpose, the original equations were converted into the following form:
B M R = 1 24 ( 9.99 × W + 6.25 × H T 4.92 × A + 5 × G 161 × ( 1 G ) )
where H T stands for the body height of the subject in centimetres, W is the body weight in kg, A is the age in years. G is the gender, 0 for females and 1 for males, BMR is the estimation of basal metabolic rate (kcal/h).

5.3. Personal Sensor Data

The latest generation of professional wearable health sensors can easily connect to smartphones and track a significant number of physiological parameters. For example, using the Wiki-Health Mobile App and a heart rate monitor, such as Zephyr [29], heart rate measurements can be easily obtained for estimation about the work rate ( WORKM ) in Part A. Basic information of the user such as age, weight and height can also be stored in the Wiki-Health platform.

5.4. Environmental and Geographic Data

Environmental conditions influence human health and lifestyles in a variety of ways. Environmental data covers a range of factors such as weather conditions, climate change, air quality, food quality, traffic flows, levels of different kinds of pollutants, pests and parasites, radiations, and natural disasters. Traditionally, many of these environmental conditions were rarely measured or could be only measured by government agencies. With modern advances such as the Internet of Things and social networks, more and more environmental conditions can be measured directly at an individual level and integrated to provide an overall understanding of local conditions.
Geographic information such as altitude, terrain, and the location of buildings and roads provide extra contextual information for our activities. Many third party databases are now available which allow users to access different types of environmental and geographic information, such as OpenWeatherMap and Weather Underground [30,31,32,33].

5.5. Virtual Sensing Service

All of the human physiological models previously mentioned in this paper have been implemented as functions in MATLAB/Octave, which have then been uploaded into Wiki-Health’s model repository and published as a virtual sensing service in the data and models marketplace. As shown in Figure 6, the proposed virtual sensing service takes physical and environmental sensor data such as heart rate, locations, humidity and wind speed as inputs and computes the simulated readings of virtual sensors of whole body temperatures and metabolic rates.
For users, obtaining the readings from the virtual sensing service provided by Wiki-Health requires almost no knowledge of the specific computation. The user only needs to select the service from the data and models marketplace, then configure the mappings of inputs and outputs, such as selecting the heart rate data stream to be used for the virtual sensing service.

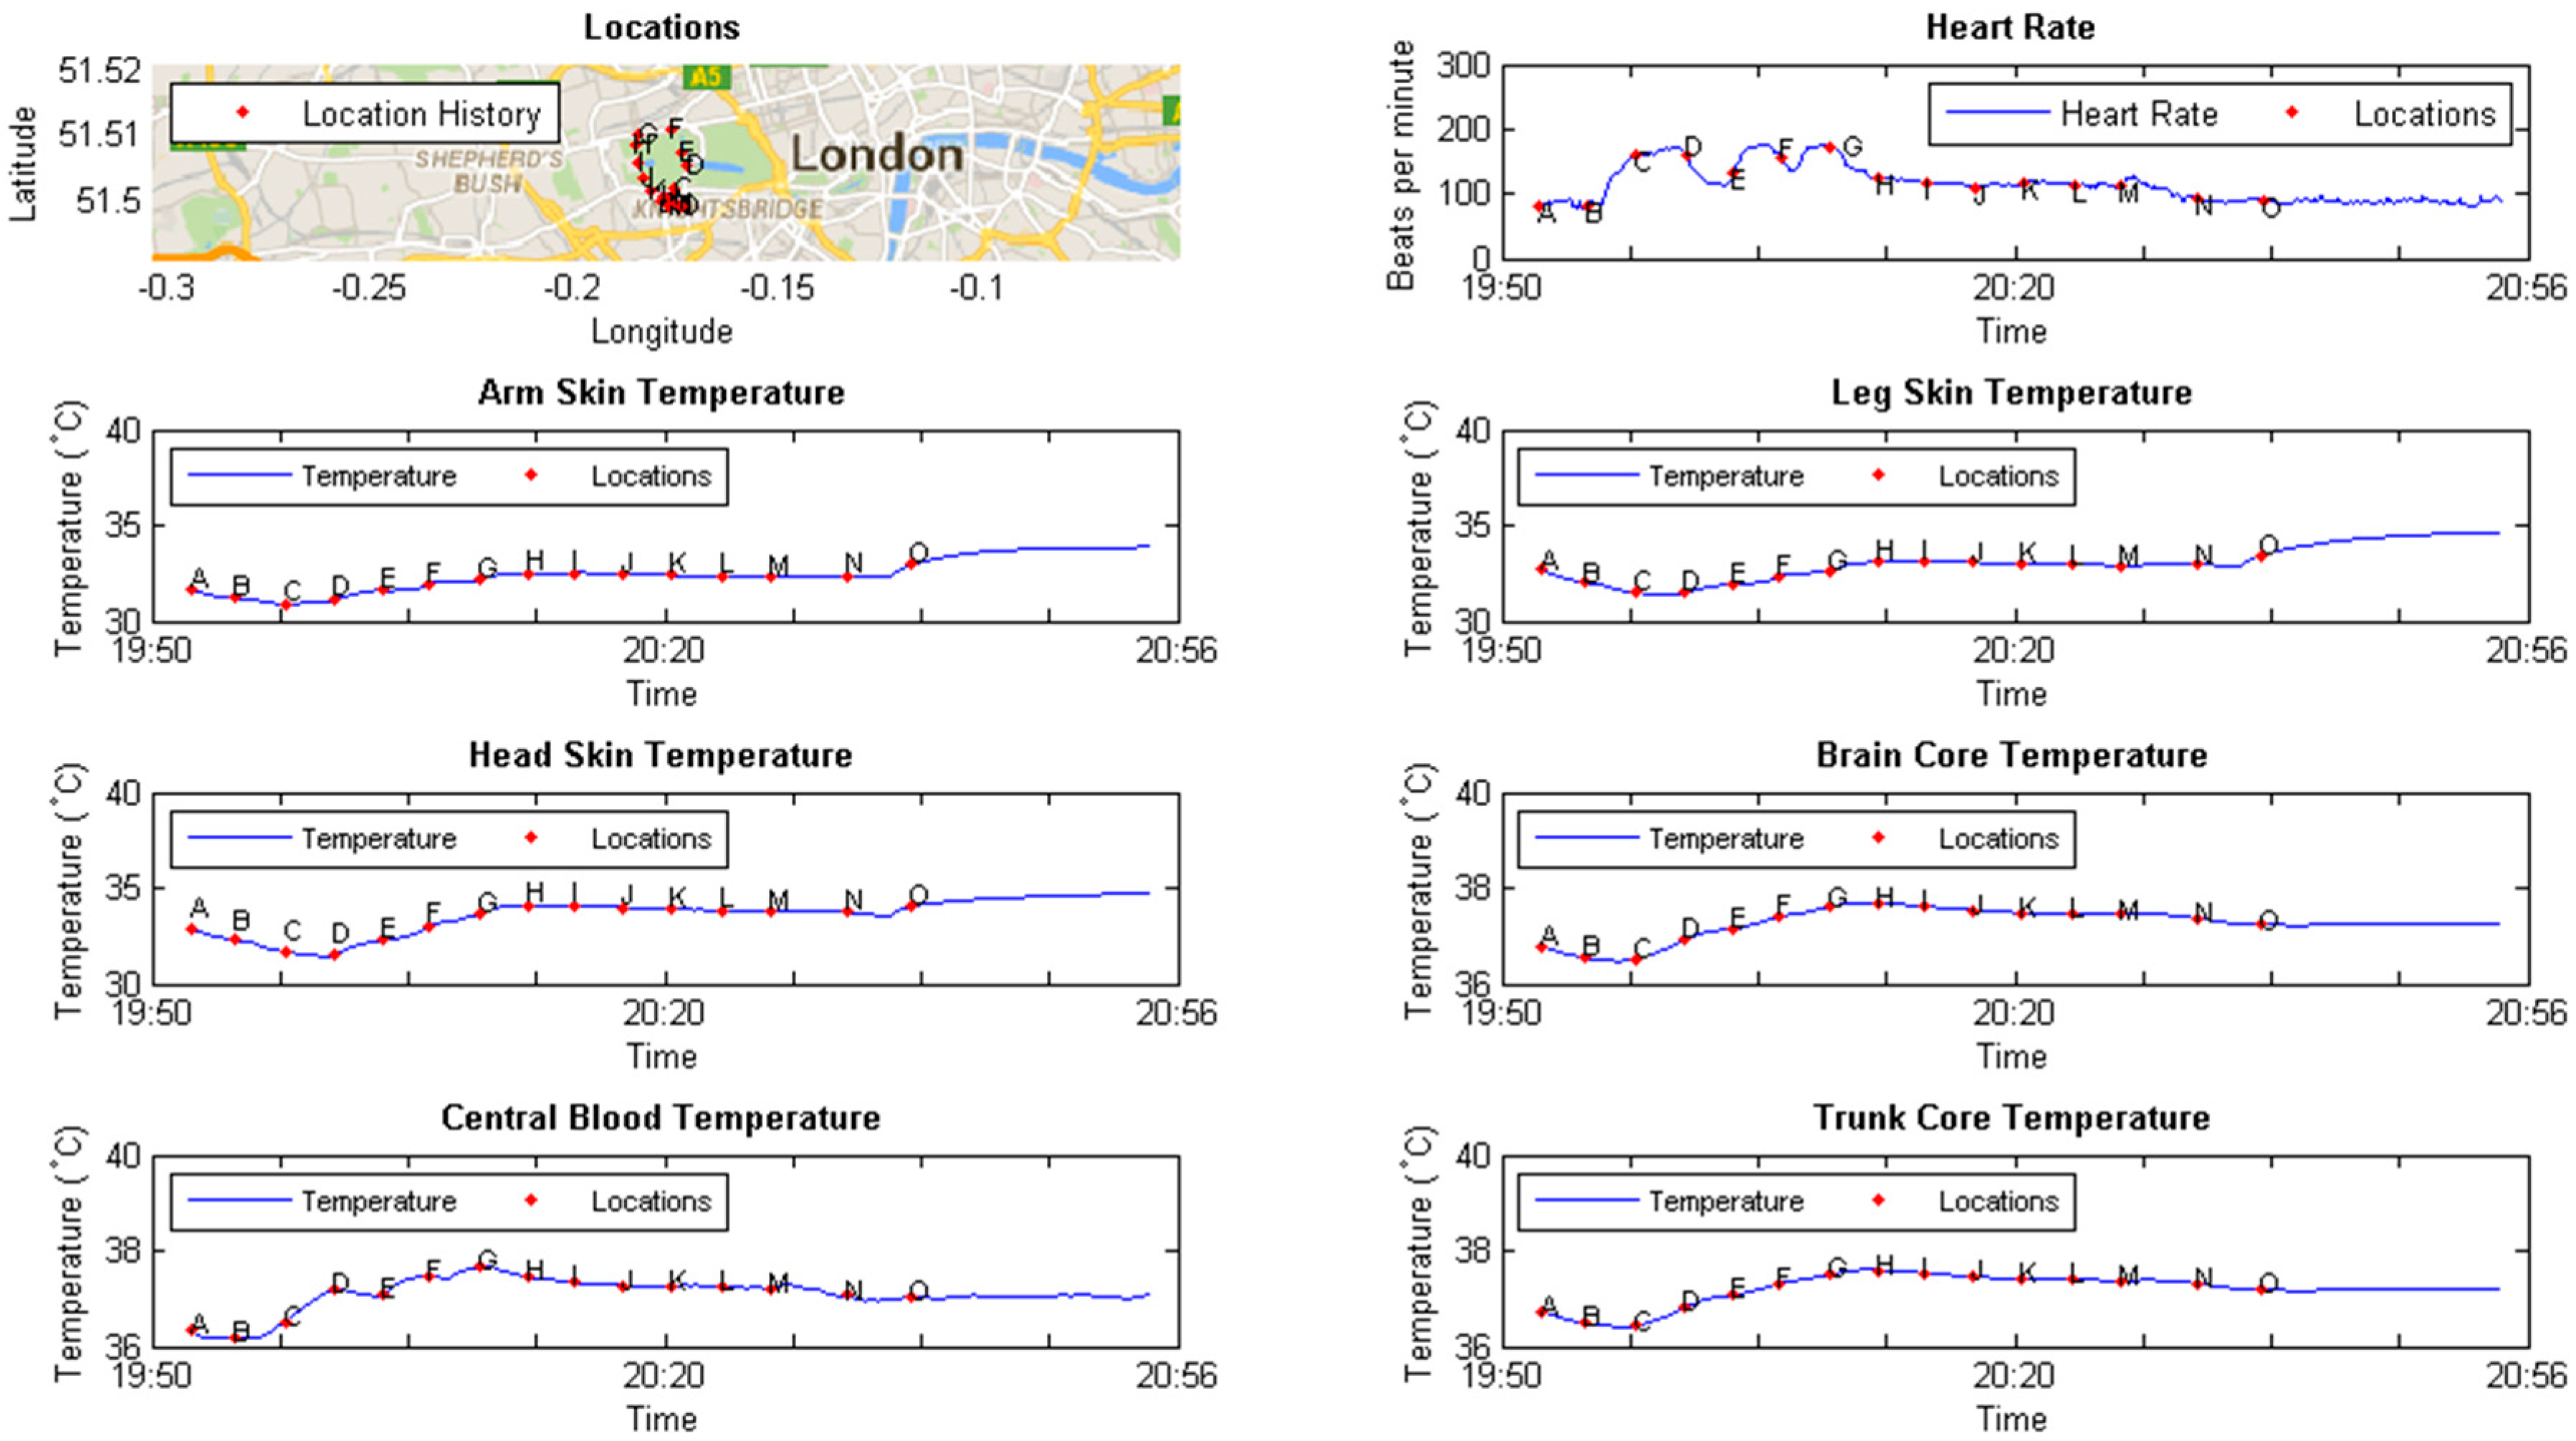
6. Experimental Evaluation

The performance of the Wiki-Health platform under different workloads has already been examined in our previous papers [7,8]. The experimental protocol in this study is inspired by experimental approaches from existing human thermoregulatory studies such as [25,34,35]. The aim of the experiments in this section is to demonstrate the possibility and feasibility of using Wiki-Health for developing health-related applications rather than validating the accuracy of these models.

6.1. Participants and Setup
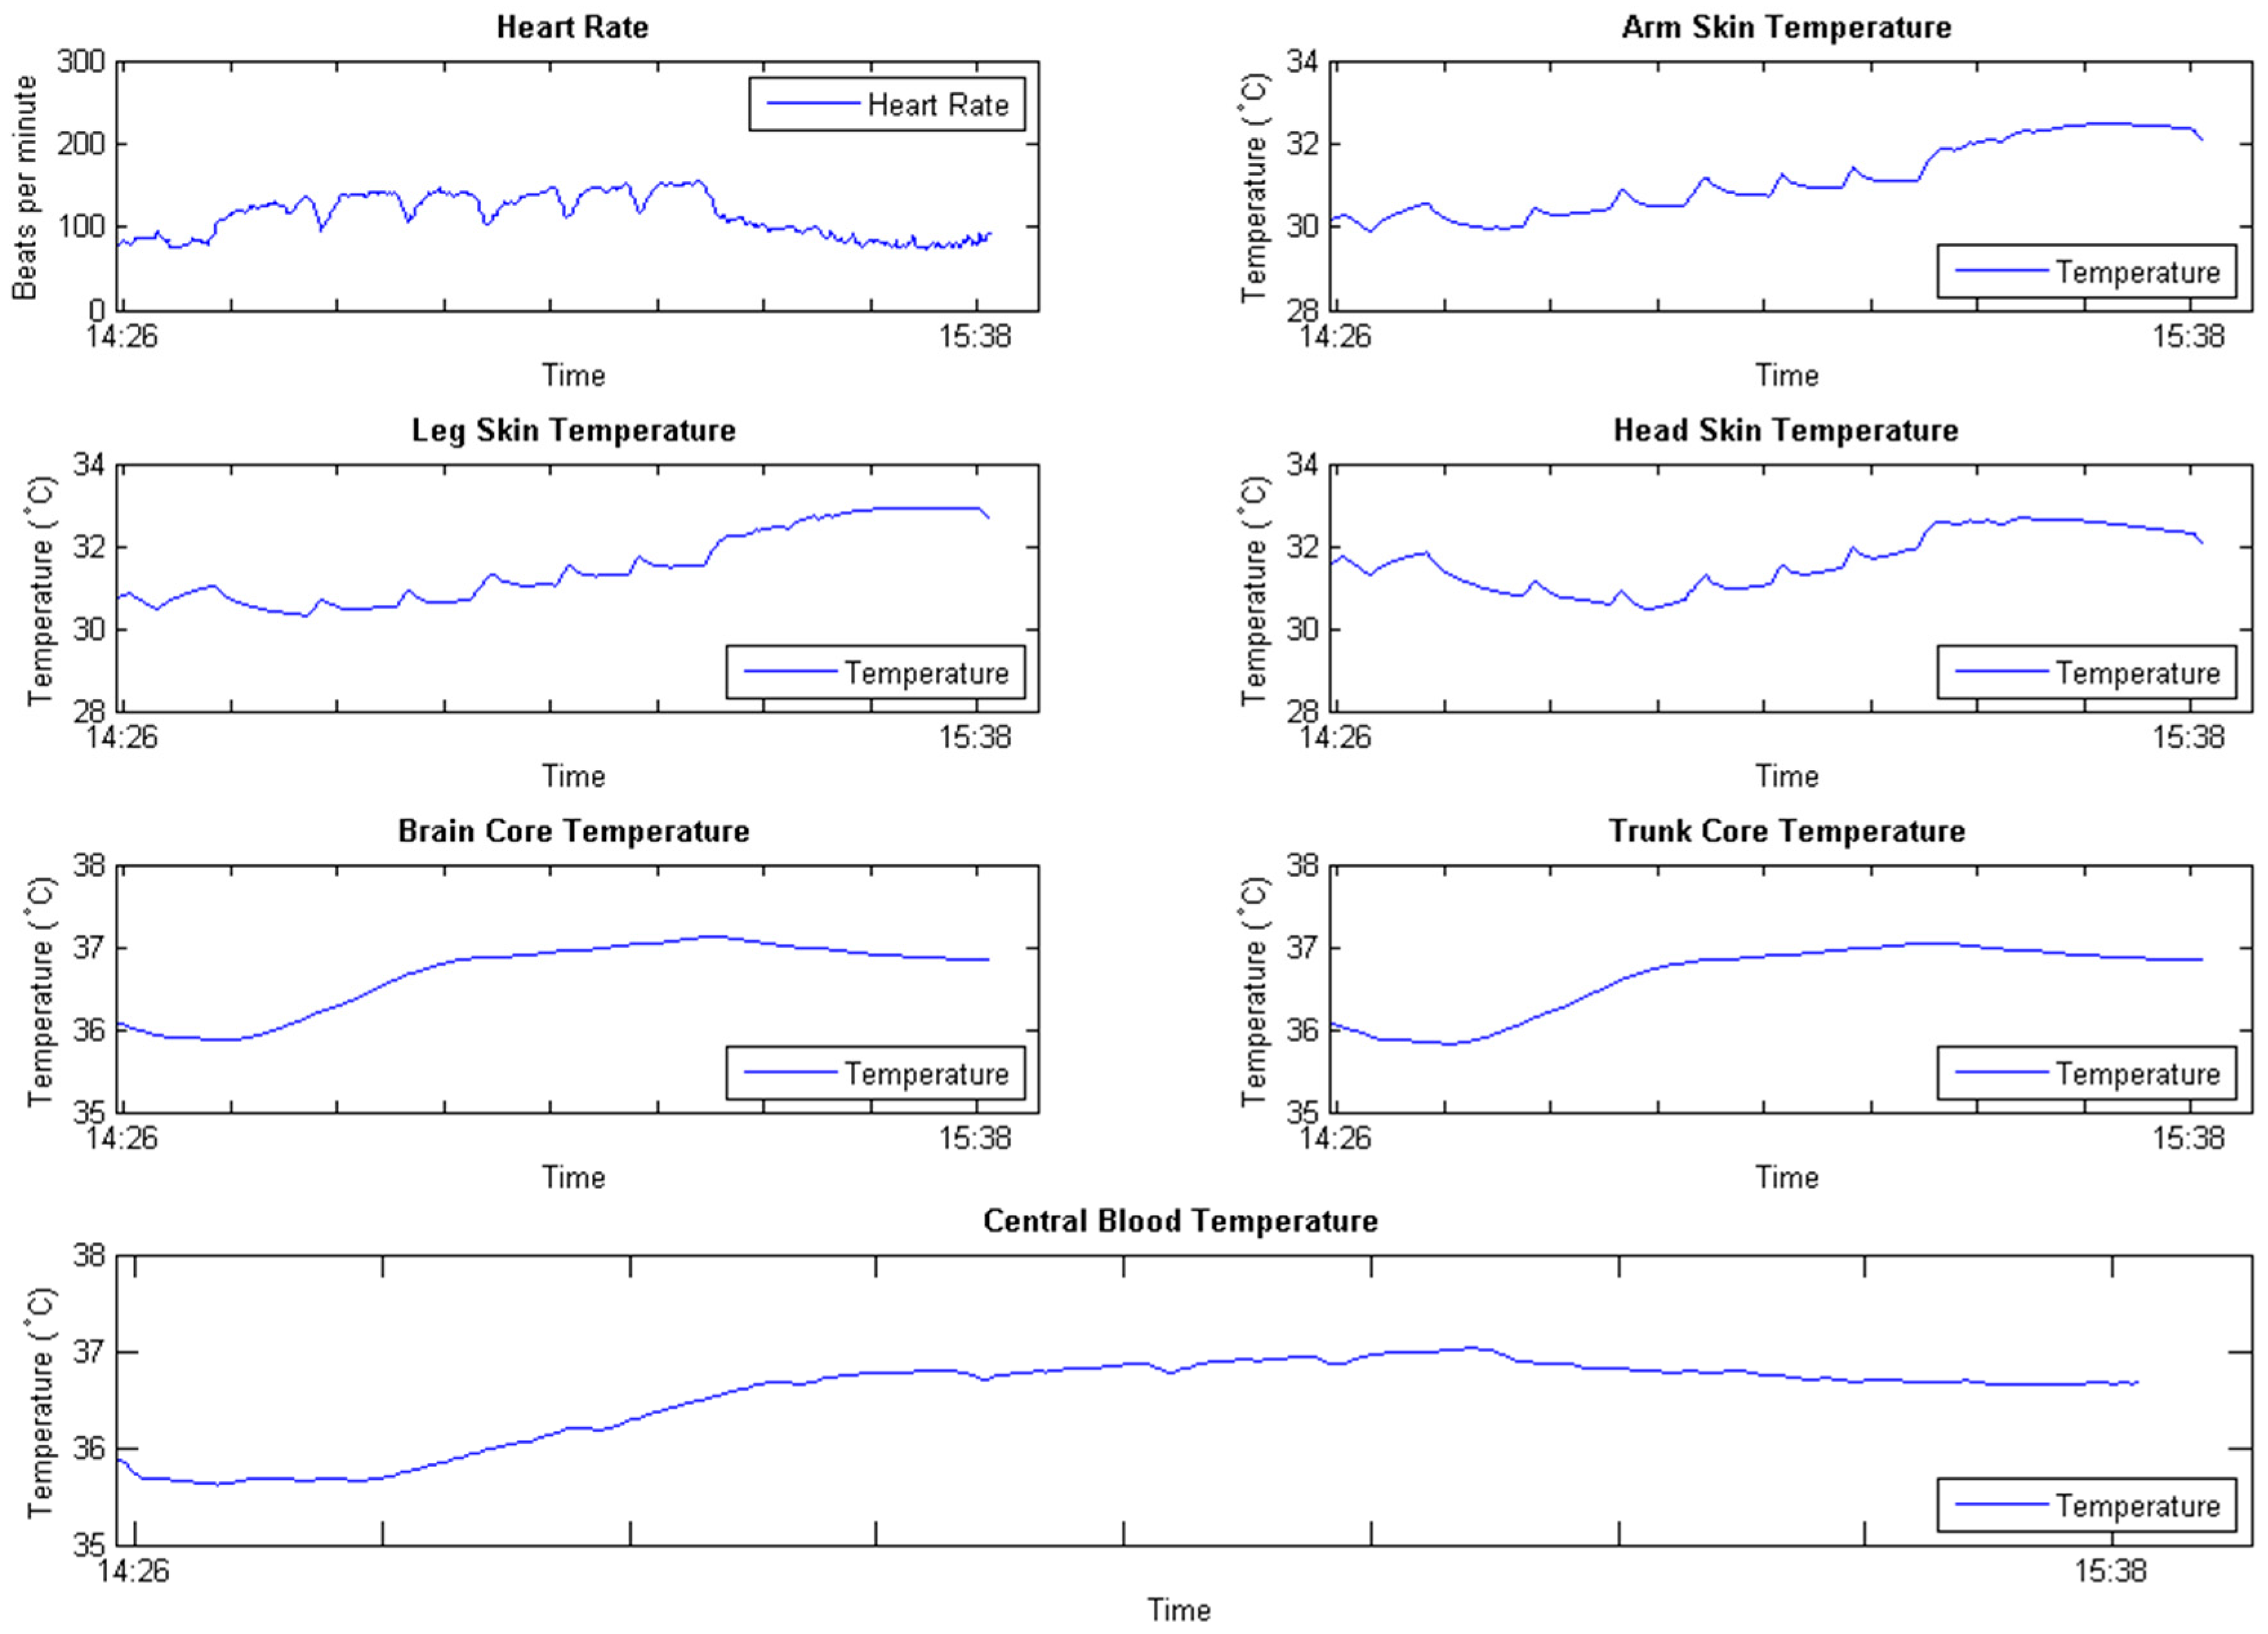
Two subjects participated in the experiments: A 27-year-old male adult (weight 80 kg, height 185 cm) and a 26-year-old female adult (weight 45 kg, height of 163 cm). A Zephyr heart rate belt [29] was used to measure the heart rate and instantaneous speed, and it was connected to a smartphone through Bluetooth. The subjects wore both devices during the experiment. The smartphone was installed with the Wiki-Health App to record and upload the physical measurements of heart rate, instantaneous speed, and the subject’s physical location.
The male subject was asked to perform the following tasks in order: walk from Imperial College to a nearby park, then either walk or run freely in the park before walking back to the college and remaining in the office for twenty minutes. The outdoor temperature, humidity and wind speed were approximately 27 °C, 57%–61%, and 4.47 m/s, respectively.
The female subject was asked to perform the following tasks inside an indoor gym: to either run or walk on a cross trainer machine for approximately forty minutes, then to sit on a chair to rest for twenty minutes. The room temperature and humidity in the gym were stable at about 22.3 °C and 50%, respectively.
No fluids were consumed during either experiment. The duration of both experiments was approximately one hour.

6.2. Results

Figure 7 illustrates the results obtained from the male subject. The top left graph in the figure shows the location change traces of the subject, marked with letters in alphabetical order, while the top right graph shows the heart rate at different times and locations. The rest of the graphs show the virtual sensor predicted values at different times and locations used to evaluate the proposed approach. Similar results obtained from the female subject are depicted in Figure 8. Since the subject was in the same location as the male subject throughout the experiment, the location traces were not plotted. The graphs of heart rate and predicted virtual sensor readings for various parts of the body are also shown.
The case study demonstrates that by using the proposed service, we are able to generate our own models for inferring temperature readings with 25 virtual sensors “imbedded” in various parts of the body.

7. Conclusion

We present a novel virtual sensing application that is deployed as a service on top of the Wiki-Health platform. The proposed service adopts the functionalities of Wiki-Health and integrates environmental and geographic data, personal sensor data, and physiological models to compute and simulate virtual temperature sensor readings of various parts of the body. The proposed service application demonstrates the feasibility of using Wiki-Health framework to enable better utilization and understanding of vast amounts of sensor data from difference sources and shows potential for developing virtual sensors for use in data acquisition on the platform. The approach we proposed is an example of the use of Wiki-Health, and there may be other human body models in existence that could potentially be used as part of this platform.
A possible direction for future work is the addition of another process of data assimilation (e.g., Ensemble Kalman Filter [36]) in the virtual sensing application, so that physical measurements of body temperatures can be incorporated into the virtual sensing model to balance the uncertainty in the data and in the prediction. We also plan to carry out more experiments to evaluate our virtual sensing approach with physical sensor measurements and to find ways to improve the simulation accuracy.

Acknowledgments

This research is partially supported by the Innovative R&D Team Support Program of Guangdong Province (NO. 201001D0104726115), China.

Author Contributions

Yang Li implemented the whole system and analysis tools; Yang Li wrote the paper; Yang Li and Ioannis Pandis designed and performed the experiments; Yang Li and Ioannis Pandis analysed the data; Yike Guo contributed the key ideas of analysis framework and methodology.

Conflicts of Interest

The authors declare no conflict of interest.

References

  1. Stephant, J.; Charara, A.; Meizel, D. Virtual sensor: Application to vehicle sideslip angle and transversal forces. IEEE Trans. Ind. Electron. 2004, 51, 278–289. [Google Scholar] [CrossRef]
  2. Kusiak, A.; Zheng, H.; Zhang, Z. Virtual wind speed sensor for wind turbines. J. Energy Eng. 2010, 137, 59–69. [Google Scholar] [CrossRef]
  3. Raveendranathan, N.; Galzarano, S.; Loseu, V.; Gravina, R.; Giannantonio, R.; Sgroi, M.; Jafari, R.; Fortino, G. From modeling to implementation of virtual sensors in body sensor networks. IEEE Sens. J. 2012, 12, 583–593. [Google Scholar] [CrossRef]
  4. Van Beek, J.H.; Supandi, F.; Gavai, A.K.; de Graaf, A.A.; Binsl, T.W.; Hettling, H. Simulating the physiology of athletes during endurance sports events: Modelling human energy conversion and metabolism. Philos. Trans. R. Soc. A Math. Phys. Eng. Sci. 2011, 369, 4295–4315. [Google Scholar] [CrossRef] [PubMed]
  5. Bouchama, A.; Knochel, J.P. Heat stroke. New Engl. J. Med. 2002, 346, 1978–1988. [Google Scholar] [CrossRef] [PubMed]
  6. Gunga, H.-C.; Sandsund, M.; Reinertsen, R.E.; Sattler, F.; Koch, J. A non-invasive device to continuously determine heat strain in humans. J. Therm. Biol. 2008, 33, 297–307. [Google Scholar] [CrossRef]
  7. Yang, L.; Li, G.; Yike, G. Enabling health monitoring as a service in the cloud. In Proceedings of 2014 IEEE/ACM 7th International Conference on Utility and Cloud Computing, UCC’14, London, UK, 8–11 December 2014; pp. 127–136.
  8. Li, Y.; Guo, Y. Wiki-health: From quantified self to self-understanding. Gener. Comput. Syst. 2015, 56, 333–359. [Google Scholar] [CrossRef]
  9. Madden, S.R.; Franklin, M.J.; Hellerstein, J.M.; Hong, W. Tinydb: An acquisitional query processing system for sensor networks. ACM Trans. Database Syst. 2005, 30, 122–173. [Google Scholar] [CrossRef]
  10. Abadi, D.J.; Carney, D.; Çetintemel, U.; Cherniack, M.; Convey, C.; Lee, S.; Stonebraker, M.; Tatbul, N.; Zdonik, S. Aurora: A new model and architecture for data stream management. The VLDB J. 2003, 12, 120–139. [Google Scholar] [CrossRef]
  11. Yao, Y.; Gehrke, J. The cougar approach to in-network query processing in sensor networks. ACM Sigmod Rec. 2002, 31, 9–18. [Google Scholar] [CrossRef]
  12. Yuriyama, M.; Kushida, T. Sensor-cloud infrastructure-physical sensor management with virtualized sensors on cloud computing. In Proceedings of 2010 13th International Conference on Network-Based Information Systems (NBiS), Takayama, Japan, 4–16 September 2010; pp. 1–8.
  13. ThingSpeak. Available online: http://thingspeak.com (accessed on 24 March 2016).
  14. Xively. Available online: https://xively.com (accessed on 1 July 2015).
  15. Wang, Y.; Hu, W.; Wu, Y.; Cao, G. Smartphoto: A resource-aware crowdsourcing approach for image sensing with smartphones. In Proceedings of the 15th ACM international symposium on Mobile ad hoc networking and computing, MobiHoc’14, Philadelphia, PA, USA, 11–14 August 2014; pp. 113–122.
  16. Guo, X.; Chan, E.C.; Liu, C.; Wu, K.; Liu, S.; Ni, L.M. Shopprofiler: Profiling shops with crowdsourcing data. In Proceedings of 2014 IEEE Proceedings, INFOCOM, Toronto, ON, Canada, 27 April–2 May 2014; pp. 1240–1248.
  17. Artikis, A.; Weidlich, M.; Schnitzler, F.; Boutsis, I.; Liebig, T.; Piatkowski, N.; Bockermann, C.; Morik, K.; Kalogeraki, V.; Marecek, J. Heterogeneous stream processing and crowdsourcing for urban traffic management. In Proceedings of 17th International Conference on Extending Database Technology (EDBT), Athens, Greece, 24–28 March 2014; pp. 712–723.
  18. Zheng, Y.; Zhang, L.; Xie, X.; Ma, W.-Y. Mining interesting locations and travel sequences from GPS trajectories. In Proceedings of the 18th International Conference on World Wide Web, Madrid, Spain, 20–24 April 2009; pp. 791–800.
  19. Welbourne, E.; Tapia, E.M. Crowdsignals: A call to crowdfund the community’s largest mobile dataset. In Proceedings of the 2014 ACM International Joint Conference on Pervasive and Ubiquitous Computing: Adjunct Publication, Seattle, WA, USA, 13–17 September 2014; pp. 873–877.
  20. Welbourne, E.; Wu, P.; Bao, X.; Munguia-Tapia, E. Crowdsourced mobile data collection: Lessons learned from a new study methodology. In Proceedings of the 15th Workshop on Mobile Computing Systems and Applications, Santa Barbara, CA, USA, 26–27 February 2014; p. 2.
  21. MathWorks. Matlab: The Language of Technical Computing (Desktop Tools and Development Environment), 7th ed.; The MathWorks Inc.: Natick, MA, USA, 2005; Volume 9. [Google Scholar]
  22. GNU Octave. Available online: http://www.gnu.org/software/octave/ (accessed on 1 July 2015).
  23. R Development Core Team. R: A Language and Environment for Statistical Computing; R Foundation for Statistical Computing: Vienna, Austria, 2013. [Google Scholar]
  24. Reith, J.; Jorgensen, H.; Pedersen, P.; Nakamaya, H.; Jeppesen, L.; Olsen, T.; Raaschou, H. Body temperature in acute stroke: Relation to stroke severity, infarct size, mortality, and outcome. Lancet 1996, 347, 422–425. [Google Scholar] [CrossRef]
  25. Stolwijk, J.A. A Mathematical Model of Physiological Temperature Regulation in Man; National Aeronautics and Space Administration: Washington, DC, USA, 1971.
  26. Havenith, G. Interaction of clothing and thermoregulation. Exog. Dermatol. 2003, 1, 221–230. [Google Scholar] [CrossRef]
  27. Keytel, L.; Goedecke, J.; Noakes, T.; Hiiloskorpi, H.; Laukkanen, R.; van der Merwe, L.; Lambert, E. Prediction of energy expenditure from heart rate monitoring during submaximal exercise. J. Sports Sci. 2005, 23, 289–297. [Google Scholar] [CrossRef] [PubMed]
  28. Mifflin, M.D.; St Jeor, S.; Hill, L.A.; Scott, B.J.; Daugherty, S.A.; Koh, Y. A new predictive equation for resting energy expenditure in healthy individuals. Am. J. Clin. Nutr. 1990, 51, 241–247. [Google Scholar] [PubMed]
  29. Zephyr. Available online: http://www.zephyranywhere.com (accessed on 1 July 2015).
  30. OpenWeatherMap. Available online: http://www.openweathermap.org (accessed on 1 July 2015).
  31. Weather Underground. Available online: http://www.wunderground.com (accessed on 1 July 2015).
  32. Google Map. Available online: http://maps.google.com (accessed on 1 July 2015).
  33. Haklay, M.; Weber, P. Openstreetmap: User-generated street maps. IEEE Perv. Comput. 2008, 7, 12–18. [Google Scholar] [CrossRef]
  34. Hardy, J.; Stolwijk, J. Partitional calorimetric studies of man during exposures to thermal transients. J. Appl. Phys. 1966, 21, 1799–1806. [Google Scholar]
  35. Young, A.J.; Muza, S.R.; Sawka, M.N.; Gonzalez, R.R.; Pandolf, K.B. Human thermoregulatory responses to cold air are altered by repeated cold water immersion. J. Appl. Phys. 1986, 60, 1542–1548. [Google Scholar]
  36. Houtekamer, P.L.; Mitchell, H.L. Data assimilation using an ensemble kalman filter technique. Mon. Weather Rev. 1998, 126, 796–811. [Google Scholar] [CrossRef]
Figure 1. The overall system architecture of Wiki-Health.
Informatics 03 00003 g001
Figure 2. The architecture of Wiki-Health analysis framework.
Informatics 03 00003 g002
Figure 3. Architecture of the Wiki-Health Mobile App.
Informatics 03 00003 g003
Figure 4. The proposed implementation of virtual sensors on Wiki-Health.
Informatics 03 00003 g004
Figure 5. The multi-node model of human body temperature regulation.
Informatics 03 00003 g005
Figure 6. Current implementation of virtual sensors formed by integrating different models and various data sources together.
Informatics 03 00003 g006
Figure 7. Analysis results from the proposed virtual sensing service containing location traces, heart rate measurements, and virtual temperature sensor readings of various parts of the body.
Informatics 03 00003 g007
Figure 8. Analysis results from the proposed virtual sensing service containing heart rate measurements, and virtual temperature sensor readings of various parts of the body (female subject).
Informatics 03 00003 g008
Table 1. Definition of symbols in the human body temperature regulation model.
SymbolMeaningUnit
T [ N ] Temperature of node N °C
Q [ N ] Total metabolic heat production in node N kcal/h
E [ N ] Total evaporative heat loss from node N kcal/h
B C [ N ] Convective heat transfer between central blood and node N kcal/h
T D [ N ] Conductive heat transfer between node N and adjacent node N + 1 kcal/h
H R [ N ] Radiant heat transfer coefficient of segment N kcal/m2/h/°C
H C [ N ] Convective and conductive heat transfer coefficient of segment N kcal/m2/h/°C
H [ N ] Total combined heat transfer coefficient of segment i kcal/h/°C
S Total surface area of segment i m2
V A I R Air velocitym/s
T A I R The temperature of surrounding environment°C
Table 2. Constants and parameters used in the human body temperature regulation model.
Node (N)Segment (i)LayerC (kcal/°C)QB (kcal/°C)EB (kcal/°C)BFB (L/H)TC (Kcal/H/°C)
1HeadCore2.2212.840.0045.001.38
2Muscle0.330.100.000.1211.40
3Fat0.220.110.000.1313.80
4Skin0.240.080.631.440.00
5TrunkCore9.8245.389.00210.001.37
6Muscle16.155.000.006.004.75
7Fat4.252.130.002.5619.80
8Skin1.210.403.252.100.00
9ArmCore1.410.700.000.841.20
10Muscle3.040.950.001.148.90
11Fat0.580.170.000.2026.20
12Skin0.430.131.200.500.00
13HandCore0.140.080.000.105.50
14Muscle0.060.200.000.249.65
15Fat0.090.030.000.049.90
16Skin0.170.050.452.000.00
17LegCore4.242.230.002.699.00
18Muscle9.172.860.003.4312.40
19Fat1.430.430.000.5264.00
20Skin1.080.322.852.850.00
21FeetCore0.230.130.000.1614.00
22Muscle0.060.020.000.0217.70
23Fat0.130.040.000.0514.10
24Skin0.220.070.623.000.00
25Central Blood2.25n/an/an/an/a

