Least Quartic Regression Criterion to Evaluate Systematic Risk in the Presence of Co-Skewness and Co-Kurtosis


Department of Statistical Sciences, Università Cattolica del Sacro Cuore, Largo Gemelli 1, 20123 Milan, Italy
*
Author to whom correspondence should be addressed.
Risks 2020, 8(3), 95; https://doi.org/10.3390/risks8030095
Submission received: 23 July 2020
/
Revised: 25 August 2020
/
Accepted: 2 September 2020
/
Published: 8 September 2020
(This article belongs to the Special Issue Financial Networks in Fintech Risk Management II)
Abstract
:This article proposes a new method for the estimation of the parameters of a simple linear regression model which is based on the minimization of a quartic loss function. The aim is to extend the traditional methodology, based on the normality assumption, to also take into account higher moments and to provide a measure for situations where the phenomenon is characterized by strong non-Gaussian distribution like outliers, multimodality, skewness and kurtosis. Although the proposed method is very general, along with the description of the methodology, we examine its application to finance. In fact, in this field, the contribution of the co-moments in explaining the return-generating process is of paramount importance when evaluating the systematic risk of an asset within the framework of the Capital Asset Pricing Model. We also illustrate a Monte Carlo test of significance on the estimated slope parameter and an application of the method based on the top 300 market capitalization components of the STOXX® Europe 600. A comparison between the slope coefficients evaluated using the ordinary Least Squares (LS) approach and the new Least Quartic (LQ) technique shows that the perception of market risk exposure is best captured by the proposed estimator during market turmoil, and it seems to anticipate the market risk increase typical of these periods. Moreover, by analyzing the out-of-sample risk-adjusted returns we show that the proposed method outperforms the ordinary LS estimator in terms of the most common performance indices. Finally, a bootstrap analysis suggests that significantly different Sharpe ratios between LS and LQ yields and Value at Risk estimates can be considered more accurate in the LQ framework. This study adds insights into market analysis and helps in identifying more precisely potentially risky assets whose extreme behavior is strongly dependent on market behavior.
1. Introduction
Traditional linear regression models based on the normality assumption neglect any role in the higher moments of the underlying distribution. This approach is not justified in many situations where the phenomenon is characterized by strong non-normality like outliers, multimodality, skewness and kurtosis. Although this situation may occur in many circumstances, quantitative finance is a field where the consequences of non-normality are particularly relevant and may affect dramatically the investors’ decisions. Consider, for instance, the Capital Asset Pricing Model (henceforth CAPM; see (Sharpe 1964; Lintner 1965)), a well-known equilibrium model, which assumes that investors construct their portfolio on the basis of a trade-off between the expected return and the variance of the returns of the market portfolio. In the traditional CAPM framework, a regression slope reflects the exposure of an asset to systematic risk, indicating how fluctuations in the returns are related to movements of the market as a whole. In its original formulation based on Least Squares estimation, CAPM is restricted to the first two moments of the empirical distribution of historical returns; however, due to the complexity of the corresponding generating process, this simple model often fails in detecting risk premia. Many papers in the financial literature heavily criticize such an approach emphasizing the role of co-moments to account for non-normal extreme events in investors’ decisions. Such an approach leads to a series of modifications that incorporate the consideration of higher moments of the distribution of returns (Barone-Adesi et al. 2004). A completely different approach to modeling extreme financial events is based on the notion of the copula (Trivedi and Zimmer 2005). For an application to financial data, see (Nikoloulopoulos et al. 2012).
Our findings contribute to the literature in the following way. We propose a new linear regression estimation criterion, the Least Quartic criterion, which is based on a quartic loss function in place of the usual quadratic specification considered in the ordinary LS. It represents an extension of the ordinary LS criterion that, in non-Gaussian situations, provides slope coefficient estimations that outperform the ordinary LS in terms of out-of-sample risk-adjusted performance. This allows us to show how higher moments can be formally taken into account redefining the estimation criterion even in the presence of co-skewness and co-kurtosis, as it occurs in many practical circumstances. Along with the detailed description of the methodology, we examine in particular its application to finance. In particular, within the CAPM framework, we show that using the LQ criterion, it is possible to provide a measure of each asset’s systematic risk which accounts for non-normality by incorporating higher-order moments. This finding adds insights into market analysis and helps in identifying more precisely potentially risky assets whose extreme behavior is strongly dependent on market behavior.
The article is organized as follows. Section 2 is devoted to a literature review on the role of higher moments in financial risk evaluation, useful to provide the reader with the framework within which the results of the proposed methodology could be interpreted. The methodology of our proposal is reported in Section 3. Specifically, in Section 3.1 we formally introduce various definitions of co-skewness and co-kurtosis and we clarify their statistical nature with particular reference to the analysis of systematic risk. Section 3.2 is devoted to our proposal: a regression estimator which involves the minimization of the fourth power of the regression errors. In Section 4, we illustrate an application of the proposed methodology using some real data referring to the returns of the top 300 market capitalization components of the STOXX® Europe 600. Specifically, an empirical comparison between the linear and quartic estimators is pointed out. Finally, Section 5 concludes.
2. The Role of Higher Moments in Financial Risk Measurement
The traditional theory of CAPM uses essentially a Least Square linear regression strategy to measure the relationship between returns of an asset in relation to the market, thus providing a measure of the so-called systematic risk. In this respect, only the first two moments of the joint distribution between the asset and the market are relevant in the analysis (Sharpe 1964; Lintner 1965; Mossin 1966). In the last decades, many papers have recognized the shortcomings associated with such an approach (starting from the criticism contained, e.g., in (Fama and French 1992)), and extended it so as to incorporate considerations linked to the higher-order moments of the generating probability distributions. In particular, some authors (e.g., (Ranaldo and Favre 2005; Jondeau and Rockinger 2006)) agree on the fact that the use of a pricing model limited to the first two moments may be misleading and may wrongly indicate insufficient compensation for the investment. They thus indicate that a higher-moment approach is more appropriate to detect non-linear relationships between assets and portfolio returns while accommodating for the specific risk–return payoffs. The financial literature is very rich in contributions that include considerations related to the third moment. For instance, papers like Kraus and Litzenberger (1976, 1983), Barone-Adesi and Talwar (1983), Barone-Adesi (1985), Sears and Wei (1988), Rubinstein (1994) and Harvey and Siddique (2000) propose a three-moment CAPM which includes the third-order moment. More recently papers like Barberis and Huang (2008), Brunnermeier et al. (2007), Mitton and Vorkink (2007), Boyer et al. (2010), Green and Hwang (2012) and Byun and Kim (2016) empirically document that the skewness of individual assets may have an influence on portfolio decisions. Moreover, the paper of Jondeau et al. (2019) investigates the ability of the average asymmetry in individual stock returns prediction.
Rather surprisingly, comparatively less attention has been paid to the role of the fourth moment. In this respect, Krämer and Runde (2000) show evidence of leptokurtic stock returns, while, more recently, Conrad et al. (2013) discuss the role of (risk-neutral) skewness and kurtosis showing that they are strongly related to future returns.
Co-moments of the asset’s distribution with the market portfolio have also been recognized as influencing investors’ expected returns. In this respect, Hwang and Satchell (1999), Harvey and Siddique (1999, 2000) and Bakshi et al. (2003) introduce the idea of co-moments analysis in financial market risk evaluation, while Beaulieu et al. (2008) propose exact inference methods for asset pricing models with unobservable risk-free rates and co-skewness, and Dittmar (2002) tests explicitly the influence of co-skewness and co-kurtosis on investors’ decisions, showing that systematic kurtosis is better than systematic skewness in explaining market returns.
Fang and Lai (1997) and Christie-David and Chaudhry (2001) describe a model where the excess returns are expressed as a function of the covariance, of the co-skewness and of the co-kurtosis between the returns of a risky asset and those of the investor’s portfolio. They show that volatility is an insufficient measure of risk for risk-averse agents and that systematic skewness and systematic kurtosis increase the explanatory power of the return generating process of future markets. Their empirical results agree on the fact that investors are averse both to variance and kurtosis in their portfolio requiring higher excess rates as compensation. The papers by Fang and Lai (1997) and Christie-David and Chaudhry (2001) have the merit of introducing, in a formal way, the consideration of co-skewness and co-kurtosis in a CAPM framework, showing their empirical relevance in explaining risk premia. In this paper, we follow the same approach showing how higher moments considerations can be formally taken into account, redefining the estimation criterion of the fundamental systematic risk regression. Further references to the use of higher moments in analyzing future markets may be found in Levy (1969), Badrinath and Chatterjee (1988), Hwang and Satchell (1999), Fernandez-Perez et al. (2018) and Liu et al. (2020), among others. Other approaches related to higher-order considerations in the evaluation of risk may be found in the extreme value approach suggested by McNeil and Frey (2000), in the idea of bivariate Value at Risk (VaR) by Arbia (2003) and in the tail VaR introduced by Bargès et al. (2009).
A totally different approach to model tail financial events is based on the notion of the copula; see papers like Nikoloulopoulos et al. (2012), Dissmann et al. (2013), So and Yeung (2014), Kim et al. (2013) and Cortese (2019) for recent examples in the financial literature. For other recent approaches to modeling anomalous tails of financial events see, Zhang and Huang (2006), McElroy and Jach (2012) and So and Chan (2014) among others. Furthermore, it should be remarked that a large part of the financial econometrics literature (e.g., (Brooks et al. 2005; Dubauskas and Teresienė 2005)) has considered models based on conditional higher moments which have essentially extended the ARCH formulation of Engle (1982).
3. Methodology
In what follows, we present the methodology of our approach. First, we introduce some formal definitions of co-skewness and co-kurtosis that will be used later while discussing an augmented version of the CAPM which takes into account higher moments of the distribution of returns. Then we describe our proposal, the Least Quartic criterion, a new regression interpolation criterion that takes into account higher-order moments characteristics in non-normal situations.
3.1. Co-Moments
Let us consider two random variables X and Y. The generic bivariate moment of order centered around the mean is defined as , where and . Similarly, the standardized bivariate moment of order centered around the mean is defined as , with and analogously for . Starting from these definitions, the co-skewness of a bivariate distribution is defined formally as the mixed moments of orders r and s such that , that is and . In a bivariate normal distribution , see (Kendall et al. 1983; Kotz et al. 2000); however, in general non-normal distributions, we have, conversely, and μ2,1 ∈ ℜ. The corresponding standardized moment is defined as and similarly for . Figure 1 illustrates graphically the behavior of positive and negative co-skewness showing the two density functions and the associated scatter diagrams.
In finance, for the systematic co-skewness of a joint distribution, a slightly different version of the standardized moment is usually considered which is defined by the term (Christie-David and Chaudhry 2001; Fang and Lai 1997; Harvey and Siddique 1999, 2000). Always referring to the financial interpretation, from Figure 1 it can be argued that, in general, investors will tend to avoid positive right-tail co-skewness (involving cases of big losses when the market also experiences big losses) and to favor instead left-tail positive co-skewness (involving cases of big revenues when the market also experiences big revenues). Prudential investors will prefer negative co-skewness to mitigate the risk of losses when the markets perform badly.
In a similar way, the co-kurtosis of a bivariate distribution is defined by the mixed moments of orders r and s such that . Co-kurtosis can, therefore, assume three different manifestations defined respectively by the mixed moments , and whose behavior is likely to be correlated in empirical situations. In a bivariate normal distribution with the correlation coefficient , we have that and analogously for , see (Kendall et al. 1983; Kotz et al. 2000). In non-Gaussian distributions, we have, instead, and . The corresponding standardized moment is defined as and similarly for . A measure of excess co-kurtosis (with respect to the bivariate normal distribution) is intuitively provided by the expression and similarly for . Analogously, we can look at co-kurtosis through the mixed moment . In a bivariate normal distribution, we have that , see (Kendall et al. 1983; Kotz et al. 2000). Conversely, in non-Gaussian distributions, we have . The corresponding standardized moment is defined as and the relative measure with respect to the bivariate normal distribution is provided by the quantity . In the financial literature, the systematic co-kurtosis of a risky asset has been often defined as a modified version of the standardized (3,1) moment given by (Christie-David and Chaudhry 2001; Fang and Lai 1997) while the joint moment of order (2,2) has been completely neglected. The range of possible situations that may arise here is more complex than those considered for co-skewness. Figure 2 illustrates graphically only some of the possible cases where positive and negative co-kurtosis may emerge in empirical circumstances. Again, finance provides interesting substantive interpretations of the co-kurtosis parameters. In fact, looking at Figure 2, one may argue that, generally speaking, investors prefer negative co-kurtosis that reduces the chances of big losses when markets perform badly. This conclusion is in accordance with the speculations of Fang and Lai (1997) and Christie-David and Chaudhry (2001) on investors’ behavior in the presence of kurtosis.
3.2. The Least Quartic Criterion
A new regression interpolation criterion that takes into account higher-order moments characteristics in non-normal situations is now introduced. Alternative estimation approaches that account for the presence of non-normality and outliers in regression may be found in the contributions of Theil (1950) and Sen (1968) among others.
The LQ criterion consists of a simple optimization procedure that provides a closed form for the slope regression coefficient estimator, like the ordinary LS. In particular, it represents an extension of the ordinary LS criterion. Indeed, in the Gaussian distribution case, the estimators reduce to the ordinary LS solution. In non-Gaussian situations, the proposed procedure provides estimators that outperform the ordinary LS in terms of out-of-sample risk-adjusted performance.
According to CAPM, let us consider the simple linear regression model where the -th asset return, for , is modeled by
where is the CAPM slope coefficient, while and are the historical returns of the -th asset and the market, respectively, at a given point in time expressed in terms of deviations from their respective expected values. Let us assume that is non-stochastic and that the error term obeys some non-Gaussian distribution characterized by excess kurtosis.
To find the optimal interpolating line, in place of the familiar Least Squares criterion based on a quadratic loss function, let us define a quartic loss function
An economic-theoretical motivation for the choice of a least quartic criterion may be found in the financial literature discussed in Section 2 and in particular in the empirical findings of Fang and Lai (1997) and Christie-David and Chaudhry (2001) related to investors averseness to portfolio kurtosis. The quartic loss function can be seen as a particular case of the general multivariate loss function proposed by Alp and Demetrescu (2010) to model skewness, fat tails, non-ellipticity and tail dependence of financial data. Higher-order loss functions (e.g., of order six) could be obviously considered, but the results are more difficult to interpret.
By expanding Equation (2) we have
In the above expression, and represent the kurtosis of the market and the -th asset returns; whereas, and represent the measures of co-kurtosis described in Section 3.1. For the sake of simplifying the notation, henceforth, the subscript i for the co-moments involving is omitted.
Figure 3 reports an example of a quartic polynomial which, in general, identifies a curve with two relative minima and one maximum. However, in the specific case we are examining, the polynomial to be minimized is subject to a series of constraints deriving from the intrinsic nature of the problem. In particular, the polynomial parameters referring to the kurtosis and the co-kurtosis are bound to be positive by definition.
In order to evaluate the minimum of the loss function, let us now set to zero the first derivative of Equation (3). We obtain:
which leads to
This equation admits two imaginary roots and one root in the real field. The real solution is expressed through the following equation (Jacobson 2009):
where
We will refer to the value in (5) as to the Least Quartic estimator of the CAPM regression slope. It can be proved that in the bivariate normal distribution case (Kendall et al. 1983) where the values of the co-moments are the ones reported in Section 3.1 the real solution of Equation (3), which is reported in expression (5), reduces to the ordinary Least Squares solution.
From Equation (4) we can derive the second-order condition:
and this quantity is negative, thus identifying a minimum of the loss function, only if
Intuitively, since the loss function is a way of finding the best fit of a linear function to a cloud of points, it only admits a minimum in the real field in that we can always imagine a curve that is infinitely far from the cloud of points. So, the real solution reported in Equation (5) is a minimum.
To test the significance of the Least Quartic slope estimator, lacking the exact sampling distribution of , we can resort to a Monte Carlo approach. To achieve this aim, we need to specify a plausible non-Gaussian form for the error term in Equation (1), which includes (positive or negative) extra kurtosis. A general formulation for non-normal error terms would involve, for instance, assuming , with representing an Exponential Power Distribution with zero location parameter, unitary scale parameter and shape parameter (Subbotin 1923). For , the corresponds to the standard Normal distribution (excess kurtosis = 0), for it leads to the Laplace distribution (positive excess kurtosis), for the distribution converges point-wise to the uniform distribution characterized by negative excess kurtosis. Given the hypothesis that the independent variable is non-stochastic, this will also be the distribution of . The Monte Carlo test will then proceed as follows. We simulate independent draws from a with zero location parameter, unitary scale parameter and a value of the shape parameter which implies the empirically observed excess kurtosis. We then calculate the joint moments , ,, and on the basis of the simulated data under the null hypothesis that , and we combine them using (5) to obtain the estimate . Finally, we replicate m times the simulation thus deriving an empirical distribution for to be used in hypothesis testing. An asymmetric version of could alternatively be exploited (for an application in finance, see (Zhu and Zinde-Walsh 2009)).
4. Least Quartic vs. Least Squares Estimators: An Empirical Comparison
In this section the Least Quartic criterion is illustrated with reference to the top 300 market capitalization STOXX® Europe 600 index stocks, covering the period from January 2001 to December 2016. Based on daily quotes, log-returns are computed. The unconditional distribution of all the considered daily returns series, and the benchmark itself, fall outside the normal distribution schema, thus confirming the conclusions of most empirical studies. Both Kolmogorov–Smirnov and Shapiro–Wilks tests reject the hypothesis of normality with more than 1% significance level for all returns series. The observed deviations from the Gaussian provide the main justification for using the proposed LQ method in beta estimation; this is reinforced by the marked prevalence of negative skew (65% of the assets) and of positive excess kurtosis (95% of the assets). Almost all values of both skewness and kurtosis are significantly different from the Gaussian distribution reference values at the usual significance levels.
Since the LQ model evaluates higher-order moments of returns, the analysis moves to investigate the joint third-moment characteristics (the standardized co-skewness, expressed by the parameters and ) and the joint fourth-moment characteristics (the standardized co-kurtosis expressed by the parameters , and ). As expected, there is a high and significant correlation between the two co-skewness measures and between the three co-kurtosis parameters. Figure 4 depicts the pattern of the co-skewness and co-kurtosis parameters over the whole historical period for a selected sample asset. Generally speaking, observing Figure 4 the departure from bivariate normality and the related linearity paradigm is evident.
As a consequence, a simple ordinary LS estimator can be highly unsatisfactory if one wants to explain the complex links of dependence between each asset returns and the market. In Figure 5, the slope coefficients calculated using the traditional CAPM expression based on the Least Squares method () and the alternative Least Quartic technique illustrated in Section 3 () are compared for the same sample asset. We obtain that all LS estimates are significant at the 5% significance level. Moreover, to test the significance of the estimator, we employ the Monte Carlo procedure setting the shape parameter to corresponding to an excess kurtosis = 2.0702, which is the value observed for the STOXX® Europe 600 index over the whole sample period. All estimates are significantly different from zero with less than 5% significance level. Looking at the two patterns showed in Figure 5, it is clear that the perception of market risk exposure is best captured by the LQ estimator during market turmoil, like the recent financial crisis in 2007 and the sovereign debt crisis in 2011.
Moreover, the LQ estimator seems to anticipate the market risk increase typical during periods of crisis, since LQ estimates are consistently higher than the corresponding LS ones one year before the crisis starts. This behavior is typical of many of the 300 assets examined.
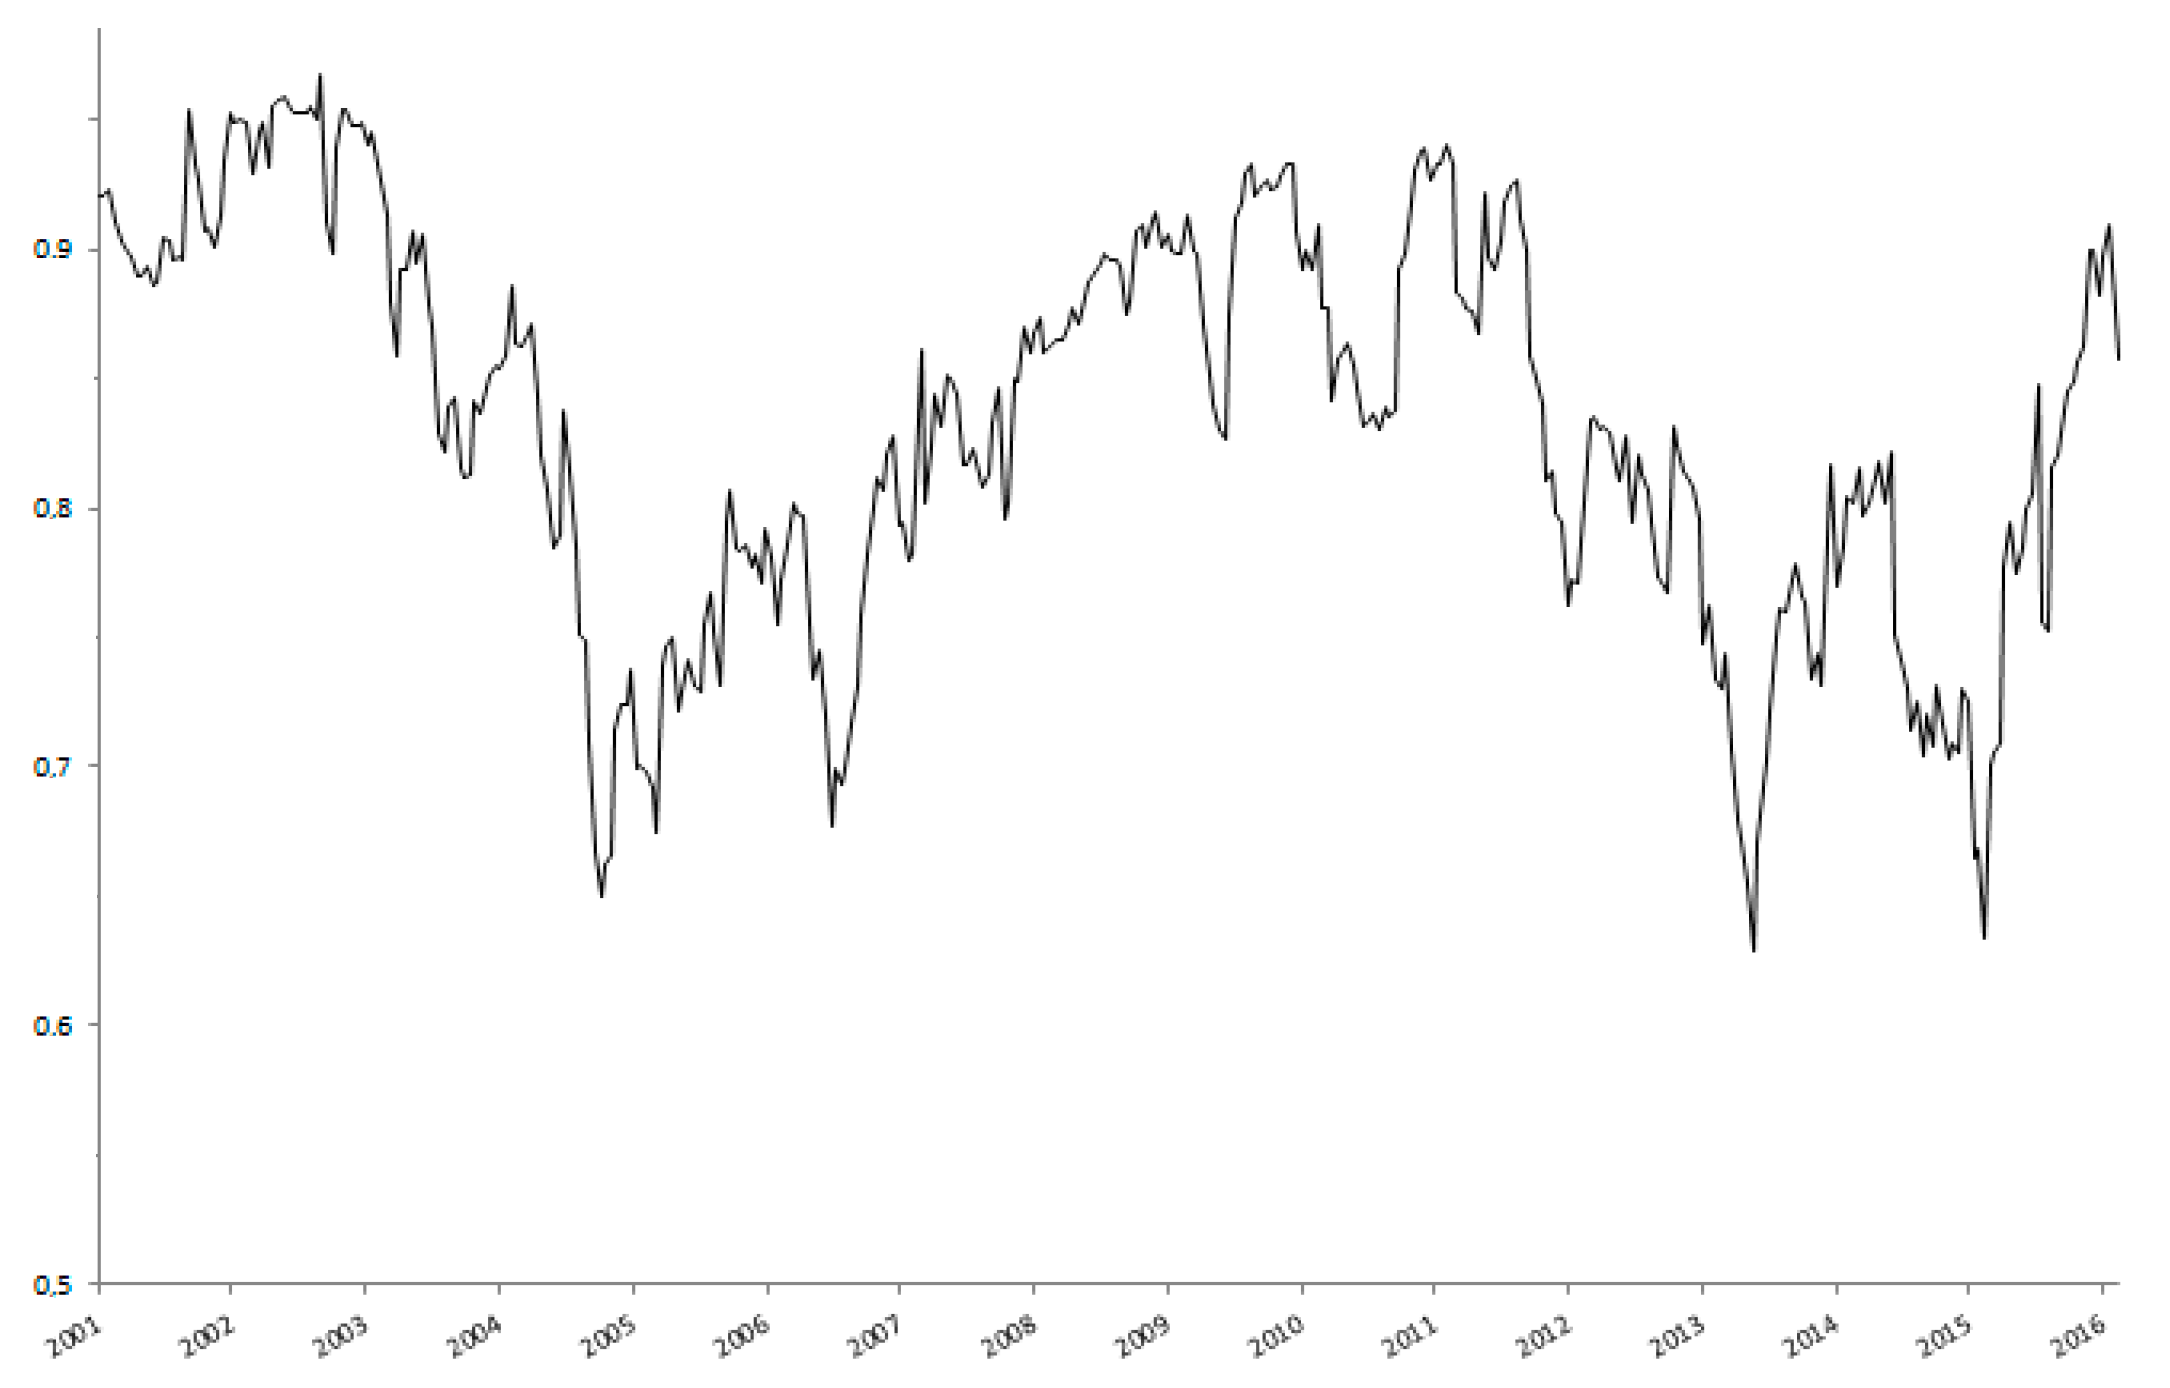
Since betas provide a quick framework for portfolio systematic risk analysis, in making the comparison, we first focus on how individual stocks are ranked according to the two types of estimators. Spearman’s rank-order correlation between LS and LQ classifications is used for this task. Figure 6 reports the pattern of the coefficient showing that, in general, the ordinal two rankings remain largely unchanged in many historical periods: specifically, the resulting statistics are significant at the 1% level in 97% of the data points tested. Nevertheless, if we consider only the top 10% of the LS ranking, for example, the stocks with the highest market risk when the linear estimator is considered, a significant change is reported in all the considered historical periods, since—on average—only 38% of the stocks are present at the same time in both rankings.
The main question that can be addressed is whether the least quartic approach is able to outperform traditional Least Squares techniques in terms of out-of-sample risk-adjusted performance. In the context of traditional asset allocation, investors can set up different strategies in terms of the desired beta exposure, since all the information they need is the betas of the underlying assets. To compare empirically the two estimators, we assume an investment strategy that passively follows the market (i.e., a beta equal to one). In this context, we consider two different strategies on a set of 1000 simulated portfolios each containing a random sub-set of N = 30 stocks. In the first one, the investor considers the whole historical period, with a length of , where is the data point where the out-of-sample analysis starts at the end of 2015. In the second one, a “rolling sample” methodology is used. In each rebalancing period ( the rolling sample approach follows, for each portfolio , two steps:
- estimate the optimal vector of weights using the estimation window composed of the previous daily returns of each component, where is the rolling window length (three different equal-sized sections of 100–200 and 500 data points are tested);
- compute the returns for the following out-of-sample window, which ends at , keeping fixed the optimal set of weights.
Portfolio optimization is assumed to start at , which represents the first rolling window, whereas is the total number of rebalancing periods. is necessary to arrange the last out-of-sample frame. The length of the rebalancing period was set at one month (20 business days).
In order to evaluate which asset allocation works the best, five statistical indicators—taken from a large set of traditional investment tools that are globally considered useful to evaluate portfolio risk and returns—are considered: the out-of-sample mean return (for a better reading average, returns are rebased on an annualized basis in the following part of the paper), standard deviation, negative semi deviation Sharpe ratio and correlation with the benchmark STOXX® Europe 600 Index:
Since we are assuming passive equivalent portfolios, the resulting out-of-sample returns should result in a high correlation with the Market Index.
In addition, in order to give insight on the transaction costs associated with each strategy, we compute a measure of portfolio turnover based on the variability of the optimal weights evaluated at each rebalancing period, which is defined by:
In Table 1, some basic statistics (averaged over the 1000 runs) for the simulated portfolios are reported. The main result is that, on average, the LQ optimization strategies outperform the LS alternative with consistently higher mean returns, lower variability and higher values both of the Sharpe ratio and of the correlation with the STOXX® Europe 600 index. The outcomes from the rolling strategies are coherent with those of the whole period, experiencing better indicators when the window length increases and significantly improving the strategies’ overall out-of-sample annualized return and risk-adjusted performance measured by the Sharpe ratio. In terms of turnover, not surprisingly, we find that the value of decreases with for all the employed strategies; however, in this case, the LQ approach does not differ significantly from the LS solution.
Results in Table 1 are confirmed by the raw frequency counts having values for each indicator that are better in the LQ framework (see Table 2): a heuristic indication of LQ relative advantage is provided since benefits from lower risk (e.g., lower and ) are achieved while not reducing returns.
To assess the statistical significance of the difference in Sharpe ratios among the linear and quartic estimators, we finally provide a two-sided p-value which is evaluated using the bootstrapping methodology suggested by Ledoit and Wolf (2008). We firstly re-sample the data (with an average block size of five) by selecting 500 bootstrap samples containing observations that were randomly chosen from the original sample of log-returns of the top 300 market capitalization STOXX® Europe 600 index stocks. Secondly, we fit an LQ regression model and calculate a regression coefficient from each bootstrap sample (in other words we obtain 500 bootstrap replicates of the regression coefficients obtained with the proposed procedure). Thirdly, we obtain the bootstrap estimates of standard errors of the regression parameters and compute the empirical p-values. If we consider statistical significance at the 5% level, in around 93% of the cases LQ regression coefficient estimates are significant. Finally, the null hypothesis is tested. Around 80% of the simulations yielded significantly different Sharpe ratios at the 5% significance level. Specifically, since the Sharpe ratio is simply the return per unit of risk (represented by the standard deviation), the higher it is, the better the combined performance of risk and return. Therefore, this ratio minimizes the probability that a future portfolio return falls below the risk-free rate. Moreover, since leptokurtic and asymmetric distributions often occur in financial time series, we can assume that if, in the regression coefficient estimates, we also take into account third and fourth moments of returns, we may obtain a better measurement of risk. The fact that the bootstrap hypothesis testing leads to the rejection of the null hypothesis that in most of the cases examined, suggests that the risk assessment obtained using our proposed method outperforms the classic one. In particular, the risk estimation made using the Sharpe ratio based on the quartic estimator is better than the one obtained using the ordinary LS procedure in 85% of the analyzed time series. Moreover, if we consider a 95% VaR over a one-day holding horizon and we backtest the loss forecasted by Value-at-Risk compared to the actual ones, we observe that in 93% of the time series considered the frequency of exceedances is consistent with the specified confidence level when the LQ estimator is used. The accuracy reduces to 72% when the LS one is taken into account. Consequently, VaR estimates are more accurate in the LQ framework.
5. Conclusions
Considerations related to the third and fourth moments characteristics within a regression framework are extremely relevant in many applied fields and particularly in market risk analysis. In this paper, we present a discussion on the statistical nature of co-skewness and co-kurtosis and we introduce a new criterion to estimate a linear regression model parameter, based on a quartic loss function. Along with a detailed description of the methodology, which is very general, we examine its application to quantitative finance. Specifically, since the unknown form of the asset returns distribution is unlikely to be described by the first two moments only, the advantage of the proposed procedure is to provide an evaluation of market risk within the CAPM framework by taking into account third and fourth moments. The potential of the method is illustrated with reference to a case study focused on the top 300 market capitalization components of the STOXX® Europe 600. The empirical analysis, based on the least quartic estimation of the slope coefficient, adds insights into market analysis and helps in identifying more precisely potentially risky assets whose extreme behavior is strongly dependent on the market behavior. By comparing the slope coefficients calculated using the traditional CAPM expression based on the ordinary LS method and the alternative LQ technique, it emerges that the perception of market risk exposure is best captured by the LQ estimator during market turmoil (e.g., the financial crisis in 2007 and the sovereign debt crisis in 2011). The out-of-sample analysis, based on 1000 simulated portfolios, also shows how the LQ criterion in most cases outperforms the traditional LS optimization strategy with consistently higher mean returns, lower variability and higher values both of the Sharpe ratio and of the correlation with the STOXX® Europe 600 index. Finally, through the bootstrapping methodology, we show that the VaR and risk estimation obtained using the Sharpe ratio based on the quartic estimator are better than those obtained using the ordinary LS procedure in most of the time series analyzed at the 5% significance level.
Author Contributions
Conceptualization, G.A.; methodology, G.A., R.B., S.F.; formal analysis, R.B., S.F.; data curation, R.B.; writing—review and editing, S.F. All authors have read and agreed to the published version of the manuscript.
Funding
This research received no external funding.
Conflicts of Interest
The authors declare no conflict of interest.
References
- Alp, Tansel, and Matei Demetrescu. 2010. Joint forecasts of Dow Jones stocks under general multivariate loss function. Computational Statistics and Data Analysis 54: 2360–71. [Google Scholar] [CrossRef] [Green Version]
- Arbia, Giuseppe. 2003. Bivariate Value-at-risk. Statistica 62: 231–47. [Google Scholar]
- Badrinath, Swaminathan G., and Sangit Chatterjee. 1988. On measuring skewness and elongation in common stock return distributions: The case of the market index. The Journal of Business 61: 451–72. [Google Scholar] [CrossRef]
- Bakshi, Gurdip, Nikunj Kapadia, and Dilip Madan. 2003. Stock return characteristics, skew laws, and the differential pricing individual equity options. Review of Financial Studies 16: 101–43. [Google Scholar] [CrossRef]
- Barberis, Nicholas, and Ming Huang. 2008. Stock as lotteries: The implications of probability weighting for security prices. American Economic Review 98: 2066–100. [Google Scholar] [CrossRef] [Green Version]
- Bargès, Mathieu, Hélène Cossette, and Etienne Marceau. 2009. TVaR-based capital allocation with copulas. Insurance: Mathematics and Economics 45: 348–61. [Google Scholar] [CrossRef] [Green Version]
- Barone-Adesi, Giovanni, and Prem P. Talwar. 1983. Market Models and Heteroscedasticity of Residual Security Returns. Journal of Business & Economic Statistics 1: 163–68. [Google Scholar]
- Barone-Adesi, Giovanni, Patrick Gagliardini, and Giovanni Urga. 2004. Testing Asset Pricing anomalies with Coskewness. Journal of Business and Economic Statistics 22: 474–85. [Google Scholar] [CrossRef]
- Barone-Adesi, Giovanni. 1985. Arbitrage equilibrium with skewed asset returns. Journal of Financial and Quantitative Analysis 20: 299–313. [Google Scholar] [CrossRef]
- Beaulieu, Marie-Claude, Jean-Marie Dufour, and Lynda Khalaf. 2008. Finite sample multivariate tests of asset pricing models with coskewness. Computational Statistics and Data Analysis 53: 2008–21. [Google Scholar] [CrossRef]
- Boyer, Brian, Todd Mitton, and Keith Vorkink. 2010. Expected idiosyncratic skewness. Review of Financial Studies 23: 169–202. [Google Scholar] [CrossRef]
- Brooks, Chris, Simon P. Burke, Saeed Heravi, and Gita Persand. 2005. Autoregressive conditional kurtosis. Journal of Financial Econometrics 3: 399–421. [Google Scholar] [CrossRef] [Green Version]
- Brunnermeier, Markus K., Christian Gollier, and Jonathan A. Parker. 2007. Optimal beliefs, asset prices, and the preference for skewed returns. American Economic Review. 97: 159–65. [Google Scholar] [CrossRef] [Green Version]
- Byun, Suk-Joon, and Da-Hea Kim. 2016. Gambling preference and individual equity option returns. Journal of Financial Economics 122: 155–74. [Google Scholar] [CrossRef]
- Christie-David, Rohan, and Mukesh Chaudhry. 2001. Coskewness and cokurtosis in futures markets. Journal of Empirical Finance 8: 55–58. [Google Scholar] [CrossRef]
- Conrad, Jennifer, Robert F. Dittmar, and Eric Ghysels. 2013. Ex ante skewness and expected stock returns. Journal of Finance 68: 85–124. [Google Scholar] [CrossRef] [Green Version]
- Cortese, Federico Pasquale. 2019. Tail dependence in financial markets: A dynamic copula approach. Risks 7: 116. [Google Scholar] [CrossRef] [Green Version]
- Dissmann, Jeffrey, Eike C. Brechmann, Claudia Czado, and Dorota Kurowicka. 2013. Selecting and estimating regular vine copulae and application to financial returns. Computational Statistics and Data Analysis 59: 52–69. [Google Scholar] [CrossRef] [Green Version]
- Dittmar, Robert F. 2002. Nonlinear pricing kernels, kurtosis preference, and evidence from the cross section of equity returns. Journal of Finance 57: 369–403. [Google Scholar] [CrossRef]
- Dubauskas, Gediminas, and Deimantė Teresienė. 2005. Autoregressive conditional skewness and kurtosis and Jarque Bera statistics in Lithuanian stock market measurement. ISSN Engineering Economics 5: 19–24. [Google Scholar]
- Engle, Robert F. 1982. Autoregressive Conditional Heteroscedasticity with Estimates of the Variance of United Kingdom Inflation. Econometrica 50: 987–1007. [Google Scholar] [CrossRef]
- Fama, Eugene F., and Kenneth R. French. 1992. The cross section of expected returns. Journal of Finance 59: 427–65. [Google Scholar] [CrossRef]
- Fang, Hsing, and Tsong-Yue Lai. 1997. Cokurtosis and capital asset pricing. The Financial Review 32: 293–307. [Google Scholar] [CrossRef]
- Fernandez-Perez, Adrian, Bart Frijns, Ana-Maria Fuertes, and Joelle Miffre. 2018. The skewness of commodity futures returns. Journal of Banking & Finance 86: 143–58. [Google Scholar]
- Green, T. Clifton, and Byoung-Hyoun Hwang. 2012. IPO as lotteries: Expected skewness and first-day returns. Management Science 58: 432–44. [Google Scholar] [CrossRef] [Green Version]
- Harvey, Campbell R., and Akhtar Siddique. 1999. Autoregressive conditional skewness in asset pricing tests. Journal of Financial and Quantitative Analysis 34: 465–487. [Google Scholar] [CrossRef]
- Harvey, Campbell R., and Akhtar Siddique. 2000. Conditional skewness in asset pricing tests. Journal of Finance 3: 1263–95. [Google Scholar] [CrossRef]
- Hwang, Soosung, and Stephen E. Satchell. 1999. Modeling emerging market risk premia using higher moments. International Journal of Finance & Economics 4: 271–96. [Google Scholar]
- Jacobson, Nathan. 2009. Basic Algebra, 2nd ed. Mineola, NY: Dover, vol. 1. [Google Scholar]
- Jondeau, Eric, and Michael Rockinger. 2006. Optimal portfolio allocation under higher moments. European Financial Management 12: 29–55. [Google Scholar] [CrossRef] [Green Version]
- Jondeau, Eric, Qunzi Zhang, and Xiaoneng Zhu. 2019. Average skewness matters. Journal of Financial Economics 134: 29–47. [Google Scholar] [CrossRef]
- Kendall, Maurice George, Alan Stuart, and J. Keith Ord. 1983. The Advanced Theory of Statistics. London: Griffin, vol. 1. [Google Scholar]
- Kim, Daeyoung, Jong-Min Kim, Shu-Min Liao, and Yoon-Sung Jung. 2013. Mixture of D-vine copulas for modeling dependence. Computational Statistics and Data Analysis 64: 1–19. [Google Scholar] [CrossRef]
- Kotz, Samuel, Narayanaswamy Balakrishnan, and Norman L. Johnson. 2000. Continuous Multivariate Distributions. Models and Applications. Hoboken: John Wiley and Sons. [Google Scholar]
- Krämer, Walter, and Ralf Runde. 2000. Peaks or tails: What distinguishes financial data? Empirical Economics 25: 665–71. [Google Scholar] [CrossRef] [Green Version]
- Kraus, Alan, and Robert H. Litzenberger. 1976. Skewness preference and the valuation of risky assets. Journal of Finance 31: 1085–100. [Google Scholar]
- Kraus, Alan, and Robert Litzenberger. 1983. On the distributional conditions for a consumption oriented three moment CAPM. Journal of Finance 38: 1381–91. [Google Scholar] [CrossRef]
- Ledoit, Oliver, and Michael Wolf. 2008. Robust performance hypothesis Testing with the Sharpe ratio. Journal of Empirical Finance 15: 850–59. [Google Scholar] [CrossRef] [Green Version]
- Levy, Haim. 1969. A utility function depending on the first three moments. Journal of Finance 20: 587–615. [Google Scholar] [CrossRef]
- Lintner, John. 1965. Security Prices, Risk, and Maximal Gains from Diversification. The Journal of Finance 24: 715–19. [Google Scholar]
- Liu, Qingfu, Pan Jiang, Yunbi An, and Keith Cheung. 2020. The effectiveness of incorporating higher moments in portfolio strategies: Evidence from the Chinese commodity futures markets. Quantitative Finance 20: 653–68. [Google Scholar] [CrossRef]
- McElroy, Tucker, and Agnieszka Jach. 2012. Tail index estimation in the presence of long-memory dynamics. Computational Statistics and Data Analysis 56: 266–82. [Google Scholar] [CrossRef]
- McNeil, Alexander J., and Rüdiger Frey. 2000. Estimation of tail-related risk measures for heteroscedastic financial time series: An extreme value approach. Journal of Empirical Finance 7: 271–300. [Google Scholar] [CrossRef]
- Mitton, Todd, and Keith Vorkink. 2007. Equilibrium under diversification and the preference for skewness. Review of Financial Studies 20: 1255–88. [Google Scholar] [CrossRef]
- Mossin, Jan. 1966. Equilibrium in a capital asset market. Econometrica 1: 768–83. [Google Scholar] [CrossRef]
- Nikoloulopoulos, Aristidis K., Harry Joe, and Haijun Li. 2012. Vine copulas with asymmetric tail dependence and applications to financial return data. Computational Statistics and Data Analysis 56: 3659–73. [Google Scholar] [CrossRef]
- Ranaldo, Angelo, and Laurent Favre. 2005. Hedge Fund Performance & Higher-Moment Market Models. Journal of Alternative Investments 8: 37–51. [Google Scholar]
- Rubinstein, Mark. 1994. Implied binomial trees. Journal of Finance 52: 35–55. [Google Scholar] [CrossRef]
- Sears, R. Stephen, and K. C. John Wei. 1988. The structure of skewness preferences in asset pricing model with higher moments: An empirical test. Financial Review 23: 25–38. [Google Scholar] [CrossRef]
- Sen, Pranab Kumar. 1968. Estimates of the regression coefficient based on Kendall’s tau. Journal of the American Statistical Association 63: 1379–89. [Google Scholar] [CrossRef]
- Sharpe, William F. 1964. Capital Asset Prices: A Theory of Market Equilibrium under Conditions of Risk. Journal of Finance 19: 425–42. [Google Scholar]
- So, Mike K. P., and Raymond K. S. Chan. 2014. Bayesian analysis of tail asymmetry based on threshold extreme value model. Computational Statistics and Data Analysis 71: 568–87. [Google Scholar] [CrossRef]
- So, Mike K. P., and Cherry Y. T. Yeung. 2014. Vine-copula GARCH model with dynamic conditional dependence. Computational Statistics and Data Analysis 76: 655–71. [Google Scholar] [CrossRef]
- Subbotin, M. Th. 1923. On the Law of Frequency of Errors. Matematicheskii Sbornik 31: 296–301. [Google Scholar]
- Theil, Henri. 1950. A rank-invariant method of linear and polynomial regression analysis. I, II, III. Nederlandse Akademie van Wetenschappen Proceedings 53: 386–92, 521–25, 1397–412. [Google Scholar]
- Trivedi, Pravin K., and David M. Zimmer. 2005. Copula modeling: An introduction to practitioners. Foundations and Trends in Econometrics 1: 1–115. [Google Scholar] [CrossRef] [Green Version]
- Zhang, Zhengjun, and James Huang. 2006. Extremal financial risk models and portfolio evaluation. Computational Statistics and Data Analysis 51: 2313–38. [Google Scholar] [CrossRef]
- Zhu, Dongming, and Victoria Zinde-Walsh. 2009. Properties and estimation of asymmetric exponential power distribution. Journal of Econometrics 148: 86–99. [Google Scholar] [CrossRef] [Green Version]
Figure 1.
Various types of co-skewness: (a) positive left-tail co-skewness; (b) positive right-tail co-skewness; (c) negative co-skewness. Scatter diagrams (upper pane); probability density functions (lower panel).
Figure 1.
Various types of co-skewness: (a) positive left-tail co-skewness; (b) positive right-tail co-skewness; (c) negative co-skewness. Scatter diagrams (upper pane); probability density functions (lower panel).
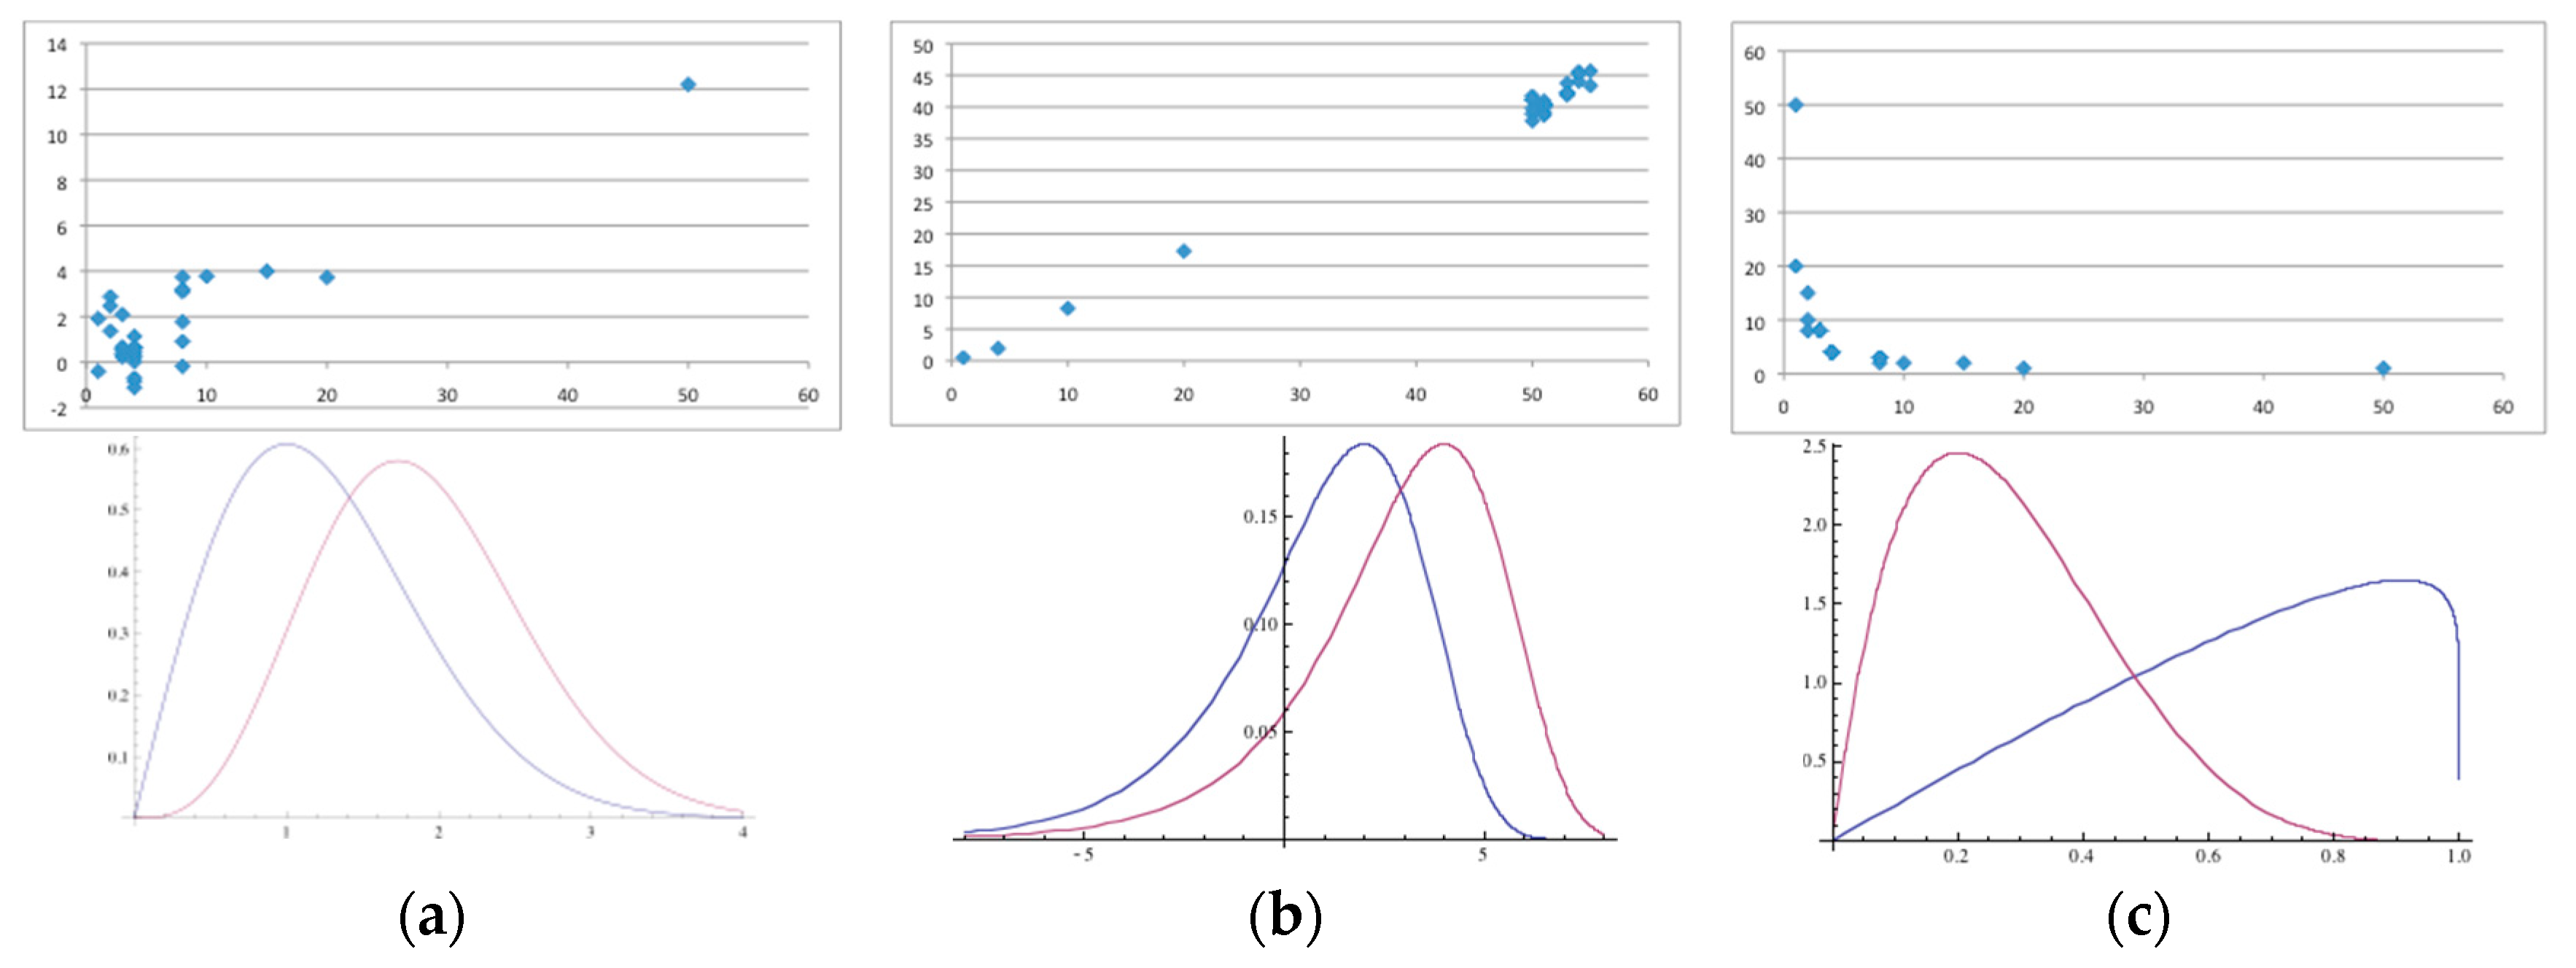
Figure 2.
Various types of co-kurtosis: (a) positive lepto co-kurtosis; (b) positive plati co-kurtosis; (c) negative co-kurtosis. Scatter diagrams (upper panel); probability density functions (lower panel).
Figure 2.
Various types of co-kurtosis: (a) positive lepto co-kurtosis; (b) positive plati co-kurtosis; (c) negative co-kurtosis. Scatter diagrams (upper panel); probability density functions (lower panel).
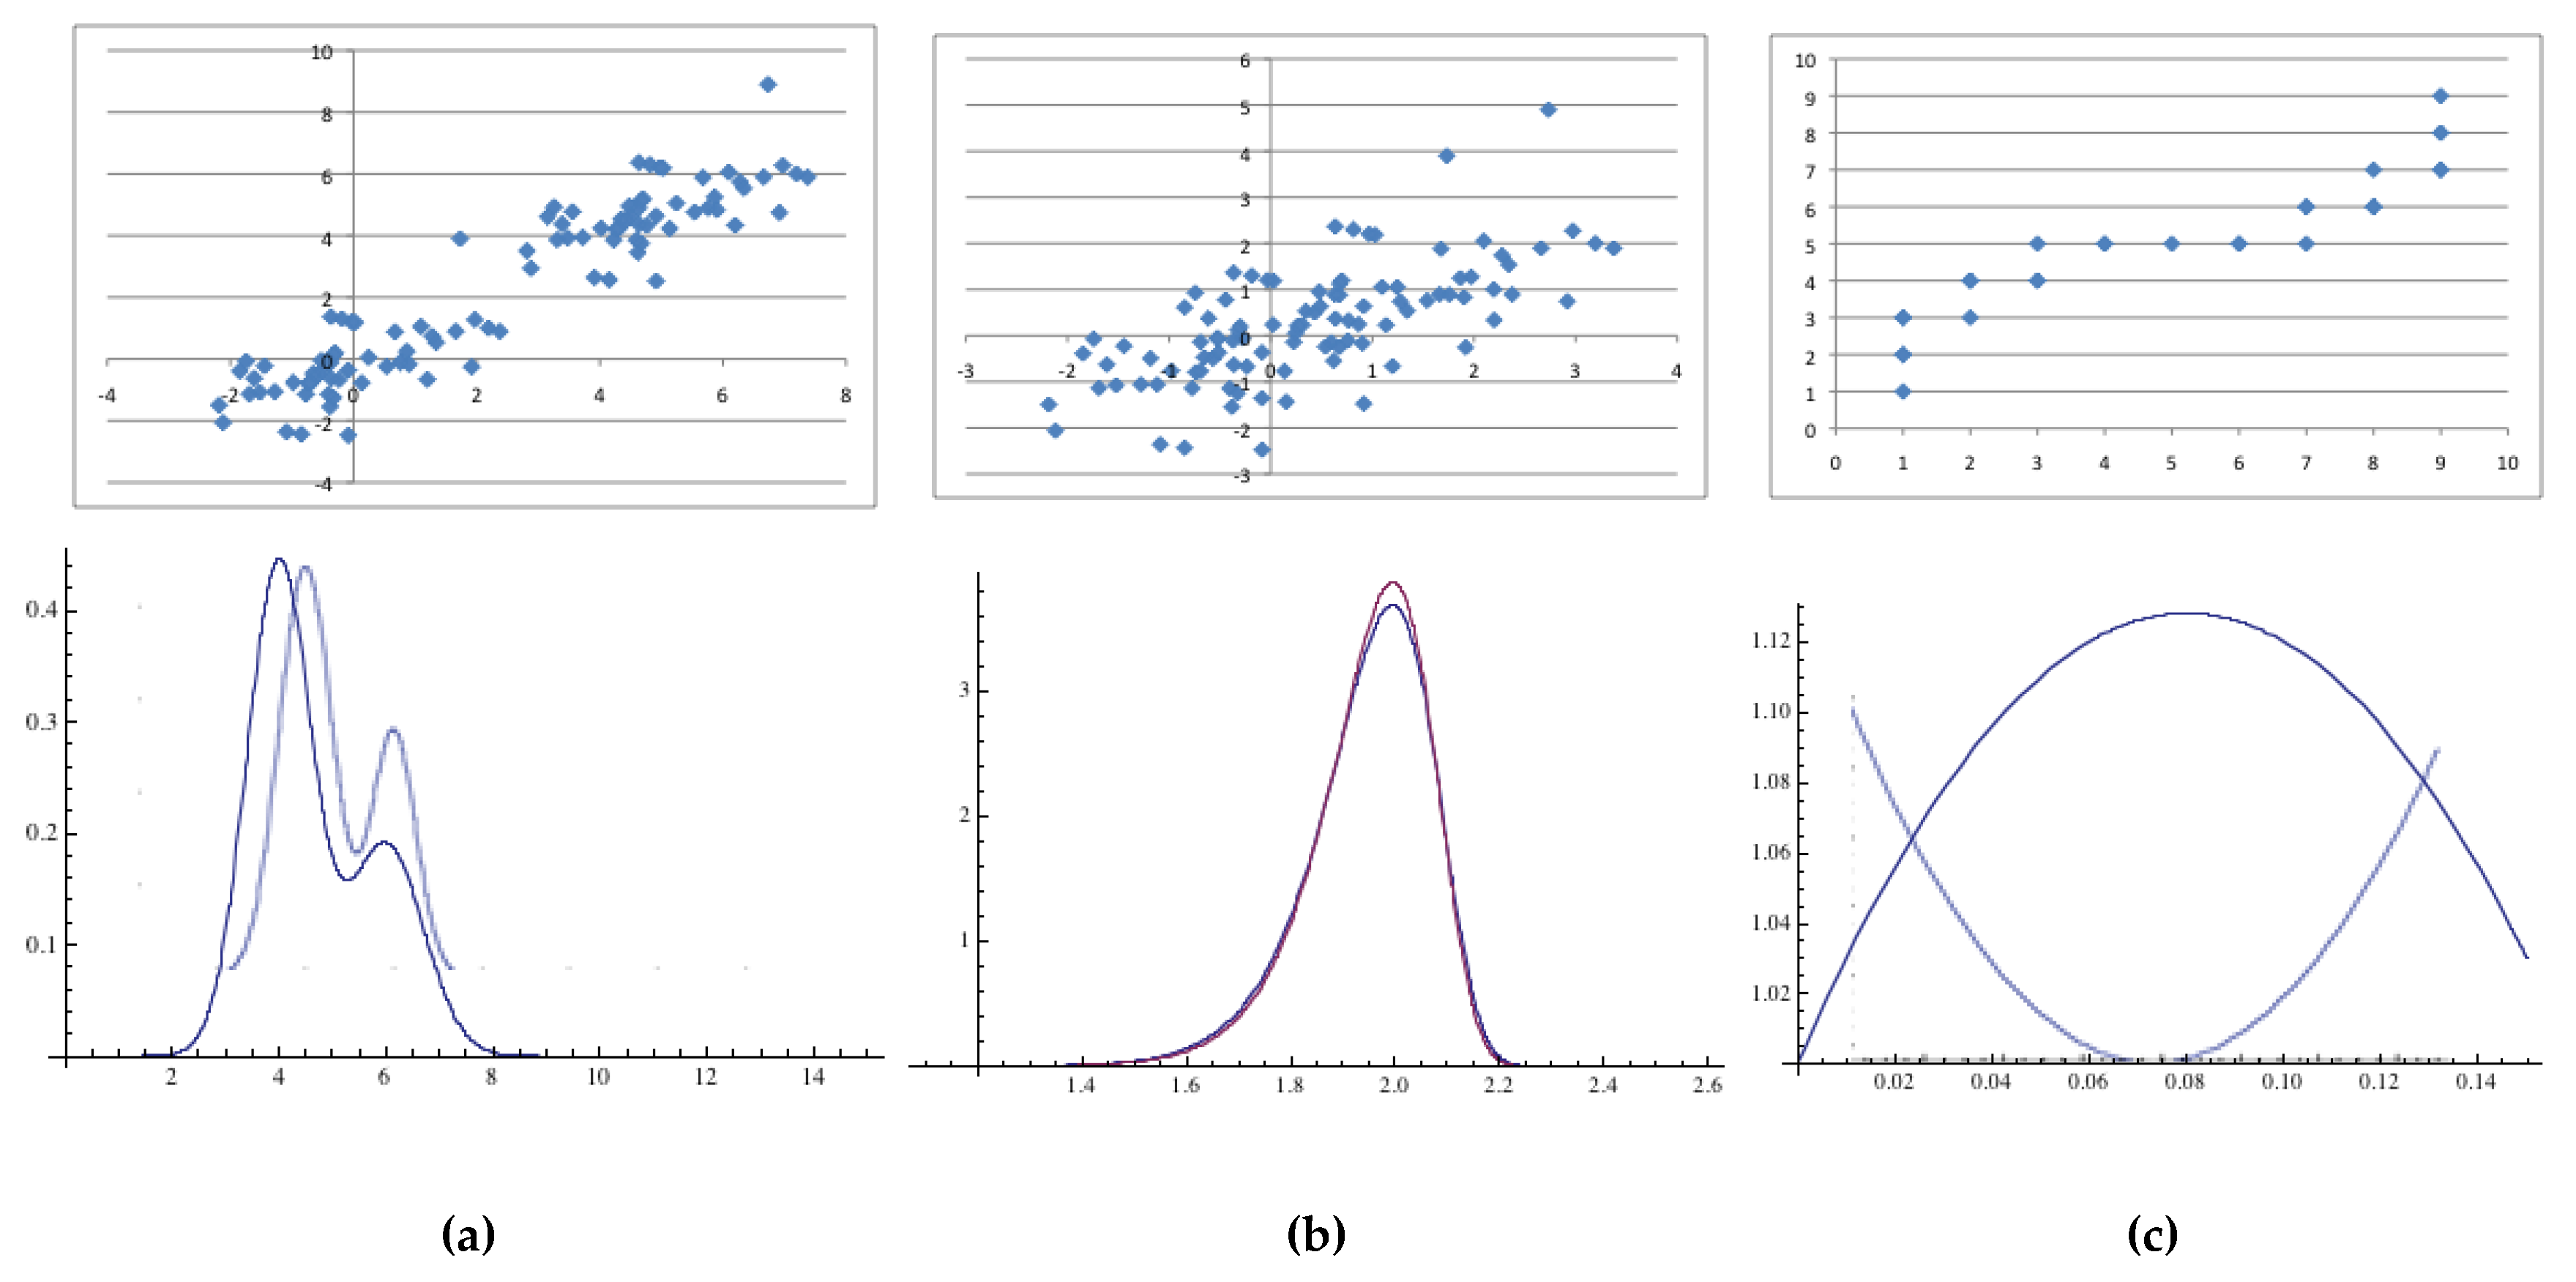
Figure 3.
The plot of a quartic polynomial. For the sake of illustration we set ; ; ; and .
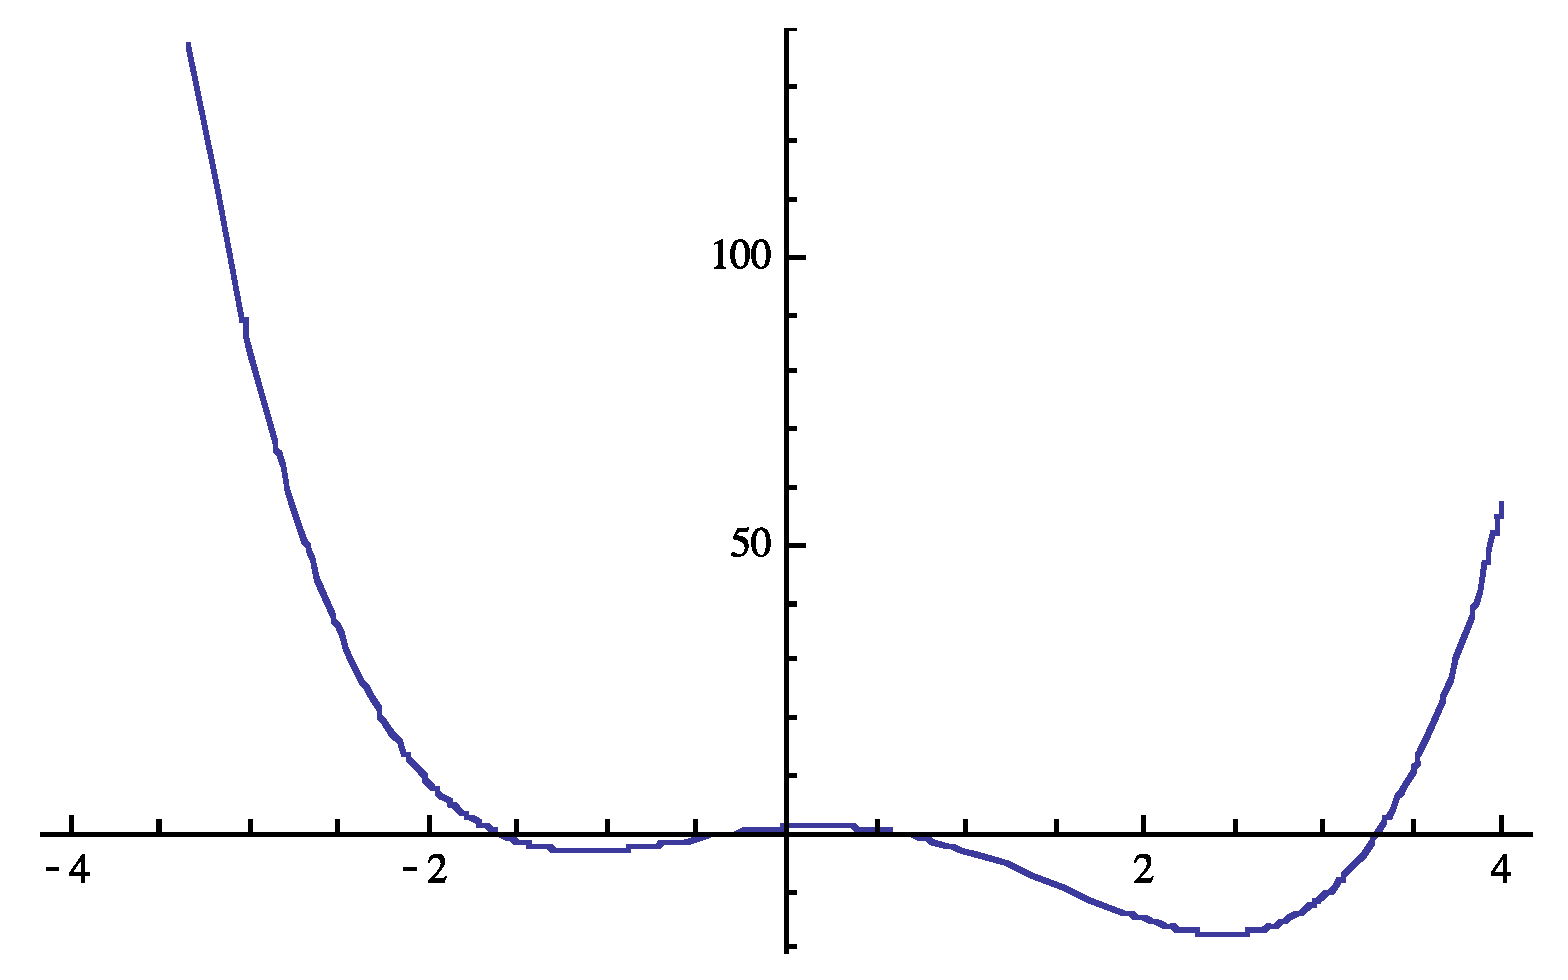
Figure 4.
Co-skewness and co-kurtosis pattern for a sample-asset: (a) ; (b) ; (c) ; (d) ; (e) .

Figure 5.
LS and LQ beta estimates for a sample asset.
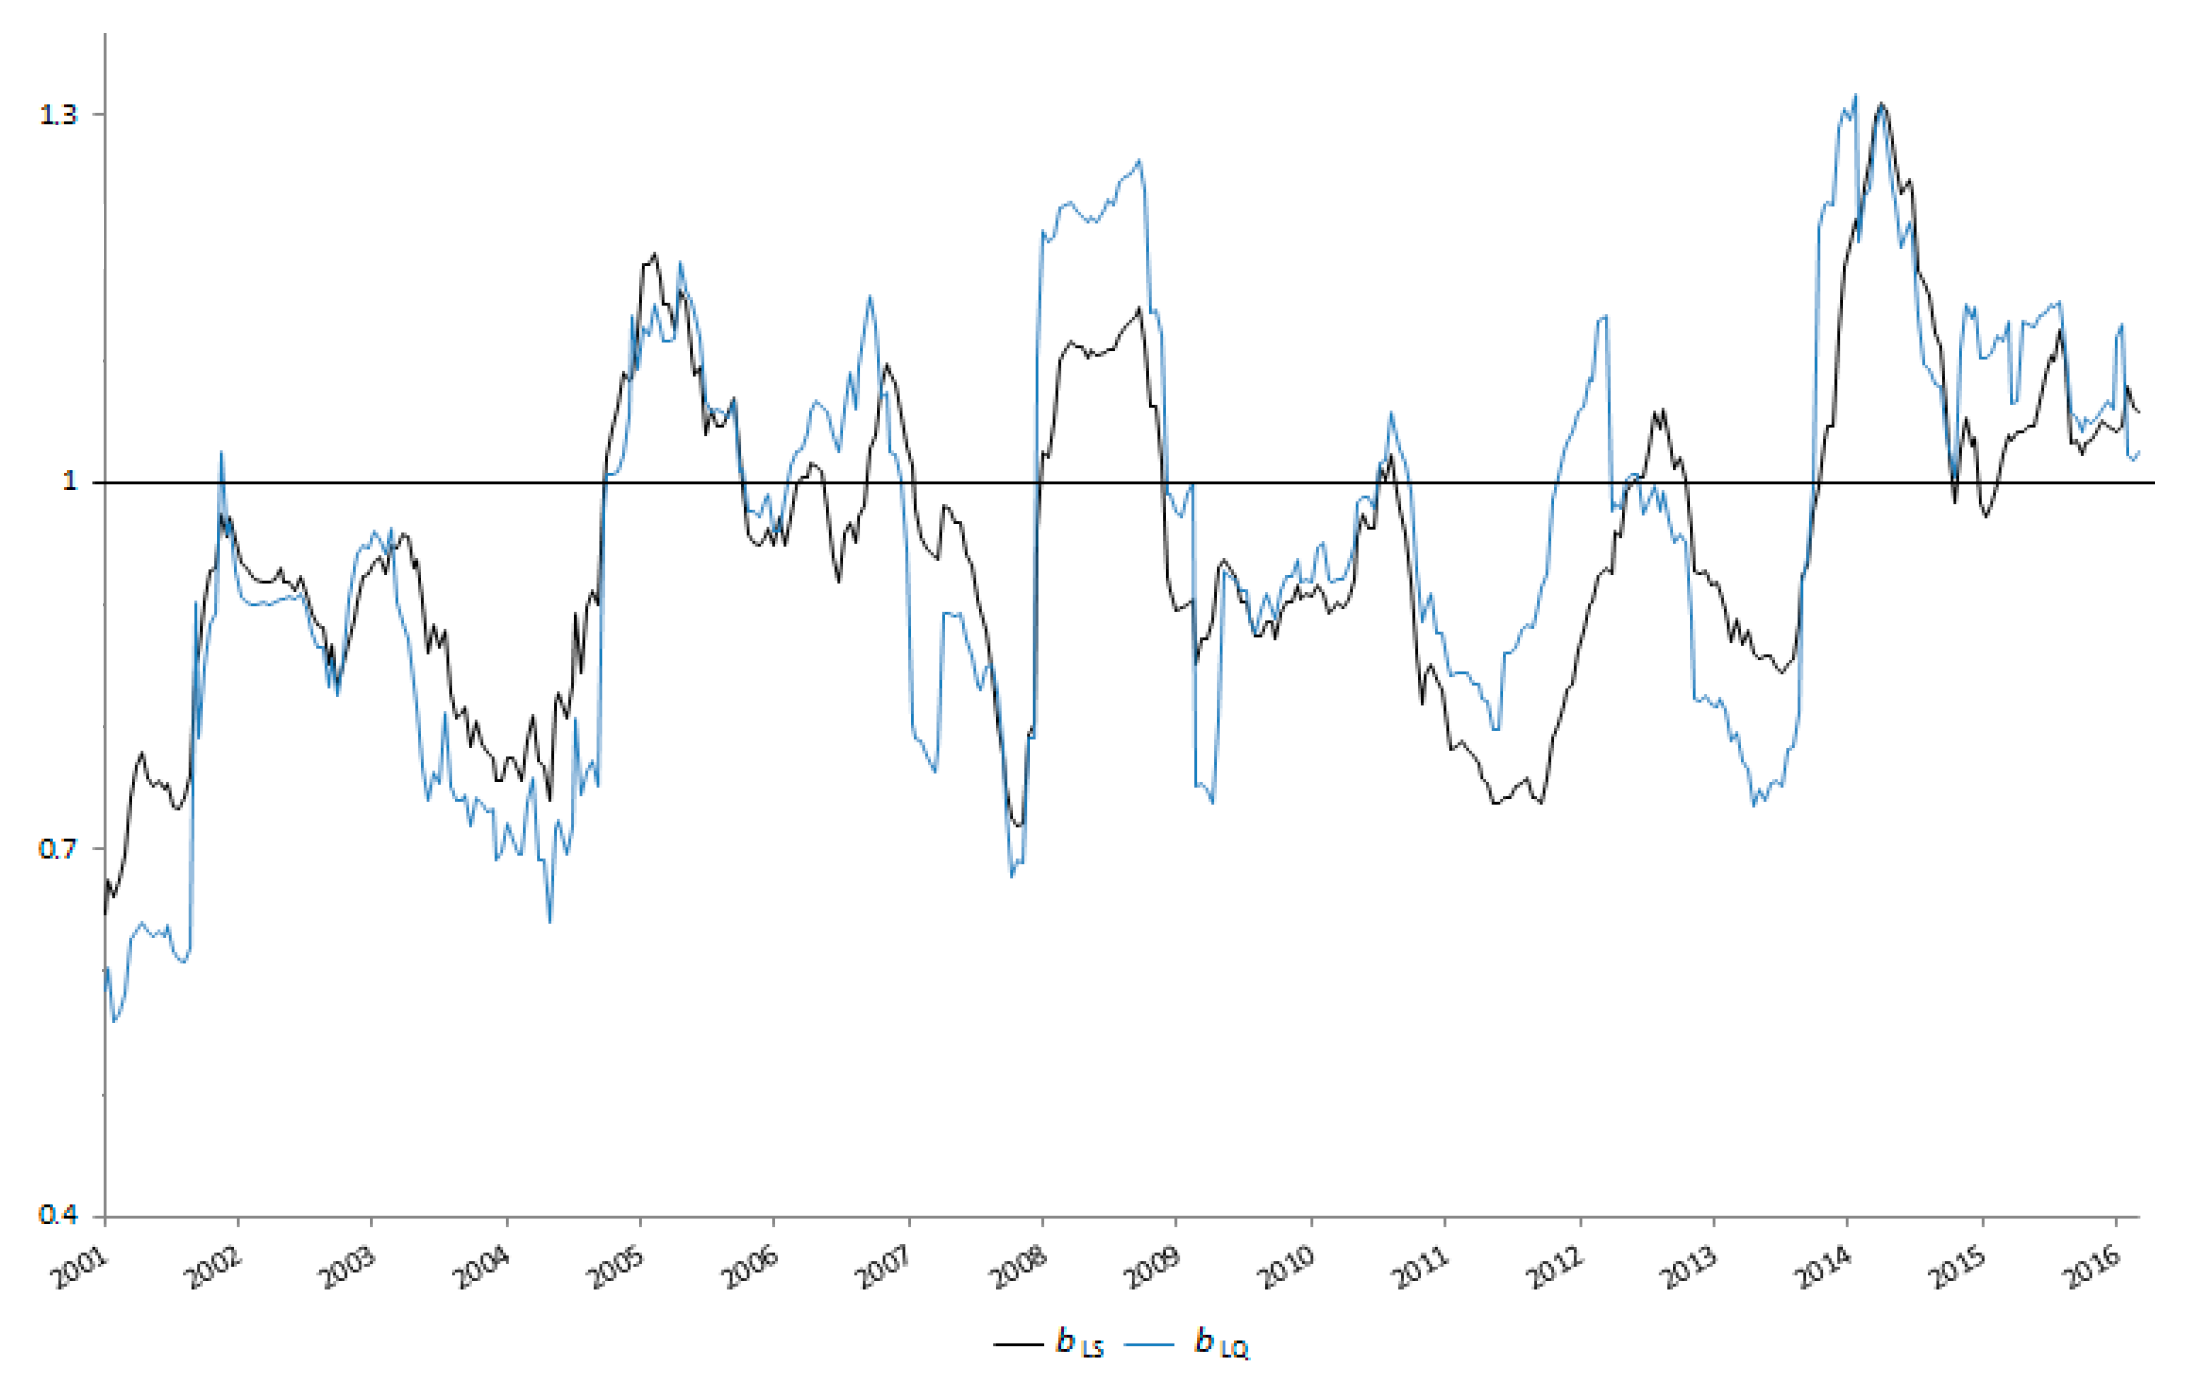
Figure 6.
Kendall’s coefficient of concordance pattern.

Table 1.
Average statistics for the 1000 simulated portfolios.
| Global | Rolling | |||||||
|---|---|---|---|---|---|---|---|---|
| LS | LQ | LS | LQ | LS | LQ | LS | LQ | |
| 4.963 | 5.884 | 1.946 | 1.995 | 2.283 | 2.333 | 6.748 | 7.219 | |
| 23.821 | 22.955 | 29.013 | 28.993 | 27.075 | 26.622 | 24.943 | 24.469 | |
| 0.969 | 0.933 | 1.073 | 1.065 | 1.056 | 1.036 | 0.974 | 0.953 | |
| 0.242 | 0.284 | 0.066 | 0.069 | 0.089 | 0.093 | 0.974 | 0.953 | |
| 0.899 | 0.908 | 0.797 | 0.810 | 0.823 | 0.826 | 0.859 | 0.861 | |
| - | - | 0.144 | 0.143 | 0.115 | 0.115 | 0.058 | 0.058 | |
Table 2.
Percentages of cases where the LQ estimates are better than the corresponding LS alternatives.
Table 2.
Percentages of cases where the LQ estimates are better than the corresponding LS alternatives.
| Global | Rolling | |||
|---|---|---|---|---|
| 58 | 53 | 55 | 52 | |
| 74 | 62 | 61 | 69 | |
| 70 | 60 | 63 | 68 | |
| 57 | 53 | 57 | 61 | |
| 56 | 55 | 57 | 61 | |
© 2020 by the authors. Licensee MDPI, Basel, Switzerland. This article is an open access article distributed under the terms and conditions of the Creative Commons Attribution (CC BY) license (http://creativecommons.org/licenses/by/4.0/).
Share and Cite
MDPI and ACS Style
Arbia, G.; Bramante, R.; Facchinetti, S. Least Quartic Regression Criterion to Evaluate Systematic Risk in the Presence of Co-Skewness and Co-Kurtosis. Risks 2020, 8, 95. https://doi.org/10.3390/risks8030095
AMA Style
Arbia G, Bramante R, Facchinetti S. Least Quartic Regression Criterion to Evaluate Systematic Risk in the Presence of Co-Skewness and Co-Kurtosis. Risks. 2020; 8(3):95. https://doi.org/10.3390/risks8030095
Chicago/Turabian StyleArbia, Giuseppe, Riccardo Bramante, and Silvia Facchinetti. 2020. "Least Quartic Regression Criterion to Evaluate Systematic Risk in the Presence of Co-Skewness and Co-Kurtosis" Risks 8, no. 3: 95. https://doi.org/10.3390/risks8030095
Note that from the first issue of 2016, this journal uses article numbers instead of page numbers. See further details here.