Managing Systematic Mortality Risk in Life Annuities: An Application of Longevity Derivatives


1
The Commonwealth Scientific and Industrial Research Organisation (CSIRO), North Ryde, Sydney, NSW 2113, Australia
2
Business School, Risk and Actuarial Studies, Randwick, Sydney, NSW 2052, Australia
3
Risk and Actuarial Studies and Centre of Excellence in Population Ageing Research (CEPAR), Business School, University of New South Wales, Randwick, Sydney, NSW 2052, Australia
*
Author to whom correspondence should be addressed.
Risks 2019, 7(1), 2; https://doi.org/10.3390/risks7010002
Submission received: 27 November 2018
/
Revised: 20 December 2018
/
Accepted: 22 December 2018
/
Published: 3 January 2019
Abstract
:This paper assesses the hedge effectiveness of an index-based longevity swap and a longevity cap for a life annuity portfolio. Although longevity swaps are a natural instrument for hedging longevity risk, derivatives with non-linear pay-offs, such as longevity caps, provide more effective downside protection. A tractable stochastic mortality model with age dependent drift and volatility is developed and analytical formulae for prices of longevity derivatives are derived. The model is calibrated using Australian mortality data. The hedging of the life annuity portfolio is comprehensively assessed for a range of assumptions for the longevity risk premium, the term to maturity of the hedging instruments, as well as the size of the underlying annuity portfolio. The results compare the risk management benefits and costs of longevity derivatives with linear and nonlinear payoff structures.
1. Introduction
Securing a comfortable living after retirement is fundamental to the majority of the working population around the world. A major risk in retirement, however, is the possibility that retirement savings will be outlived. Products that provide guaranteed lifetime income, such as life annuities, need to be offered in a cost effective way while maintaining the long run solvency of the provider. Annuity providers and pension funds need to manage the systematic mortality risk1, associated with random changes in the underlying mortality intensity, in a life annuity or pension portfolio. Systematic mortality risk cannot be diversified away with increasing portfolio size, while idiosyncratic mortality risk, representing the randomness of deaths in a portfolio with fixed mortality intensity, is diversifiable.
Reinsurance has been important in managing longevity risk for annuity and pension providers. However, there are concerns that reinsurers have a limited risk appetite and are reluctant to take this “toxic” risk (Blake et al. 2006). In fact, even if they were willing to accept the risk, the reinsurance sector is not deep enough to absorb the vast scale of longevity risk currently undertaken by annuity providers and pension funds. It is estimated that pension assets for the 13 largest major pension markets have reached nearly 30 trillions USD in 2012 (Towers Watson 2013). The sheer size of capital markets and an almost zero correlation between financial and demographic risks, suggests that they will increasingly take a role in the risk management of longevity risk.
The importance to investigate the benefits of financial assets designed to hedge the longevity risk has been recognised in Cocco and Gomes (2012). The first generation of capital market solutions for longevity risk, in the form of mortality and longevity bonds (Blake and Burrows (2001), Blake et al. (2006) and Bauer et al. (2010))2, gained limited success.
The second generation involving forwards and swaps have attracted increasing interest (Blake et al. 2013). Index-based instruments aim to mitigate systematic mortality risk, and have the potential to be less costly and are designed to allow trading as standardised contracts (Blake et al. 2013). Unlike the bespoke or customized hedging instruments such as reinsurance, they do not cover idiosyncratic mortality risk and give rise to basis risk (Li and Hardy 2011). Since idiosyncratic mortality risk is reduced for larger portfolios, portfolio size is an important factor that determines the hedge effectiveness of index-based instruments.
Longevity derivatives with a linear payoff, including q-forwards and S-forwards, have as an underlying the mortality and the survival rate, respectively (LLMA 2010a). Their hedge effectiveness has been considered in Ngai and Sherris (2011), who study the effectiveness of static hedging of longevity risk in different annuity portfolios. They consider a range of longevity-linked instruments including q-forwards, longevity bonds, and longevity swaps as hedging instruments to mitigate longevity risk and demonstrate their benefits in reducing longevity risk. Li and Hardy (2011) also consider hedging longevity risk with a portfolio of q-forwards. They highlight basis risk as one of the obstacles in the development of an index-based longevity market.
Longevity derivatives with a nonlinear payoff structure have not received a great deal of attention to date. Boyer and Stentoft (2013) evaluate European and American type survivor options using simulations. Yueh et al. (2016) value mortality-linked structured products, developing valuation models for mortality calls and puts, and exploring the sensitivity to changes in parameter values. Wang and Yang (2013) propose and price survivor floors under an extension of the Lee-Carter model. The authors do not consider the hedge effectiveness of longevity options and longevity swaps as hedging instruments.
Although dynamic hedging has been considered, because of the lack of liquid markets in longevity risk, static hedging remains the only realistic option for annuity providers. Cairns (2011) considers q-forwards and a discrete-time delta hedging strategy, and compares it with static hedging. Cairns et al. (2014) study longevity hedge effectiveness (with correlation between the value of the hedge and the value of the pension liability as a proxy) in pension plans using stochastic simulations. The authors only consider static hedging.3 The lack of analytical formulas for pricing q-forwards and its derivatives, known as “Greeks”, can be a significant problem in assessing hedge effectiveness since simulations within simulations are required for dynamic hedging strategies. The importance of tractable models has also been emphasised in Luciano et al. (2012), who also consider dynamic hedging for longevity and interest rate risk. Hari et al. (2008) apply a generalised two-factor Lee-Carter model to investigate the impact of longevity risk on the solvency of pension annuities.
This paper contributes to the literature by (1) developing pricing analysis of longevity derivatives; (2) developing a tractable continuous time stochastic mortality model with age dependent drift and volatility; (3) deriving analytical formulae for prices of longevity derivatives such as a longevity swap and a cap based on cohort model that captures higher age volatility; (4) analysing hedge effectiveness using static hedge via a longevity swap and a cap that are chosen as linear and nonlinear products to compare and assess index-based capital market product management of longevity risk management. In so doing, the paper extends the existing literature on generalised pricing frameworks for longevity derivatives. The analysis is based on a hypothetical life annuity portfolio subject to longevity risk. The paper considers the hedging of longevity risk using a longevity swap and a longevity cap, a portfolio of S-forwards and longevity caplets respectively, based on a range of different underlying assumptions for the market price of longevity risk, the term to maturity of hedging instruments, as well as the size of the underlying annuity portfolio. Our results indicate that the longevity risk premium is a small contributor to hedge effectiveness of a longevity swap. We also find that longevity caps focusing on the downside are more cost effective.
The paper is organised as follows. Section 2 specifies the two-factor Gaussian mortality model, and its parameters are estimated using Australian males mortality data. Section 3 analyses longevity derivatives, in particular, a longevity swap and a cap, from a pricing perspective. Explicit pricing formulas are derived under the proposed two-factor Gaussian mortality model. Section 4 examines various hedging features and hedge effectiveness of a longevity swap and a cap on a hypothetical life annuity portfolio exposed to longevity risk. Section 5 summarises the results and provides concluding remarks.
2. Mortality Model
Let be a filtered probability space where is the real world probability measure. The subfiltration contains information about the dynamics of the mortality intensity, or force of mortality, while death times of individuals are captured by (Biffis 2005). It is assumed that the interest rate r is constant where denotes the price of a t-year zero coupon bond, and our focus is on the modelling of stochastic mortality.
2.1. Model Specification
Amongst the affine class of stochastic mortality models (see e.g., Luciano and Vigna 2008), we have chosen to model the mortality intensity using a Gaussian process. Our choice is motivated by the fact that various longevity options can be priced analytically if we assume a Gaussian process for the mortality intensity (this will be demonstrated in Section 3). Closed form expressions for longevity option prices allow efficient computation of prices, risk statistics, and Greeks (hedge ratios) which are required to perform the dynamic hedging, that would be computationally demanding to obtain with Monte Carlo simulations.
Financial and actuarial applications require cohort models of stochastic mortality to capture improvement trends and correlations between cohorts with different ages at any given time. As a result, we propose a two-factor Gaussian mortality model which allows non-trivial instantaneous correlation between the intensity processes of different cohorts. Specifically, we model the mortality intensity process of a cohort aged x at time as:4
satisfying the stochastic differential equation (SDE)
where
and . The solutions of Equations (3) and (4) are given by
respectively. In order to have a parsimonious model, the drift and the diffusion terms of the SDE for the first factor are independent of the initial age x. As a result, can be viewed as a base (intensity) process that is common to all ages. The SDE for the second factor depends on the initial age through the drift and the diffusion terms.5 For positive values of and , both and , and hence , will grow exponentially on average. Therefore the model is designed specifically for capturing mortality intensity at older age, e.g., when age , which is consistent with what one would normally be observed in mortality data. Clearly, one needs to follow the “cohort” direction, that is as t increases, see Figure 1. Note that the instantaneous correlation between the intensity processes of different cohorts, that is, for different initial ages x and y, is given by
Hence, the two-factor model allows non-trivial correlation structure unless or . Moreover, the model is tractable as shown in the following proposition:
Proposition 1.
We will use the fact that the integral is Gaussian with known mean and variance to derive analytical pricing formulas for longevity options in Section 3.
Proof.
Solving Equation (3) to obtain an integral form of , we have
The first term in Equation (11) can be simplified to
For the second term, we have
where stochastic integration by parts is applied in the second equality.
To obtain an integral representation for , we follow the same steps as above, replacing by in Equation (11). It is then straightforward to notice that
is a Gaussian random variable with mean (Equation (9)) and variance (Equation (10)). Equation (8) is obtained by applying the moment generating function of a Gaussian random variable. □
2.2. Parameter Estimation
The discretised process, where the intensity is assumed to be constant over each integer age and calendar year, is approximated by the central death rates (Wills and Sherris 2011). Figure 1 displays Australian male6 central death rates for years and ages . Figure 2 shows the difference of the central death rates . The variability of is evidently increasing with increasing age x, which leads to the anticipation that . Furthermore, for a fixed age x, there is a slight improvement in central death rates for more recent years, compared to the past.
The parameters , which determine the volatility of the intensity process, are estimated as described below using the method of least squares, thus, calibrating the model to the mortality surface. However, we take advantage of the fact that a Gaussian model is employed where the variance of the model can be calculated explicitly and thus, we capture the diffusion part of the process by matching the variance of the model to mortality data. Specifically, the implemented procedure is as specified below:
- Using empirical data for ages we evaluate the sample variance of across time, denoted by .
- The model variance for age x is given bySince the difference between the death rates is computed in yearly terms, we set .
- The parameters are then estimated by fitting the model variance to the sample variance for ages using least squares estimation, that is, by minimisingwith respect to the parameters .
The remaining parameters , where the initial values and of the two factors are denoted by and , respectively, are then estimated as described below:7
- From the central death rates, we obtain empirical survival curves for cohorts aged 65 and 75 in 2008. The survival curve is obtained by settingwhere is the central death rate of an x years old at time t. Here, represents the calendar year 2008.
- The parameters are then estimated by fitting the survival curves () of the model to the empirical survival curves using least squares estimation, that is, by minimisingwhere and , with respect to the parameters .
The estimated parameters are reported in Table 1. Since we observe that the volatility of the process is higher for older (initial) age x.
The upper panel of Figure 3 shows the percentiles of the simulated mortality intensity for ages 65 and 75 in the left and the right panel, respectively. One observes that the volatility of the mortality intensity is higher for a 75 year old compared to a 65 year old. Corresponding survival probabilities are displayed in the lower panel of Figure 3, together with the confidence bands computed pointwise. As it is pronounced from the figures, the two-factor Gaussian model specified above, despite its simplicity, produces reasonable mortality dynamics for ages 65 and 75.
Remark 1.
- 1.
- In our model formulation, we specifically address the fact that the mortality intensity processes for different (initial) ages are increasing as time passed. This is important for the hedging applications considered in Section 4 since the extent of systematic mortality risk in an annuity portfolio is determined by the randomness of the mortality intensity process.
- 2.
- The continuous-time mortality model follows a single cohort through time and the mortality rate at future ages for the cohort includes both an age effect and a time effect, since the cohort trend is the sum of an age effect and a time or improvement effect, so that going from age x to there is a mortality improvement implicitly included for the cohort. This model does not aim to fit multiple cohorts since it does not include an explicit improvement for the same age across time. Most practical applications, such as the hedging applications studied in Section 4, require single cohort mortality models.
3. Analytical Pricing of Longevity Derivatives
We consider longevity derivatives with different payoff structures including longevity swaps, longevity caps, and longevity floors. Closed form expressions for prices of these longevity derivatives are derived under the assumption of the two-factor Gaussian mortality model introduced in Section 2. These instruments are written on survival probabilities and their properties are analysed from a pricing perspective.
3.1. Risk-Adjusted Measure
For the purpose of no-arbitrage valuation, we require the dynamics of the factors and to be written under a risk-adjusted measure. Since the longevity market is still in its development stage and hence, incomplete, we assume that a risk-adjusted measure exists but is not unique. To preserve the tractability of the model, we assume that the processes and with dynamics
are standard Brownian motions under a risk-adjusted measure . In Equation (18) the term represents the market price of longevity risk, whereas is referred to as the longevity risk premium. Under we can write the factor dynamics as follows:
As a result, the Gaussian property of the mortality intensity process is preserved under the measure change. Preserving the structure (for example, an affine structure) of the underlying process under a change of measure is of importance in financial risk management, as highlighted in e.g., Luciano et al. (2012), where the dynamic hedging of mortality risk is studied.8 Given Equations (19) and (20), the corresponding risk-adjusted survival probability is given by
where is replaced by in the expressions for and , see Equation (9) and Equation (10), respectively.
Since a liquid longevity market is yet to be developed, we aim to determine a reasonable value for based on the longevity bond announced by BNP Paribas and European Investment Bank (EIB) in 2004 as proposed in Cairns et al. (2006) and applied in Meyricke and Sherris (2014), see also Wills and Sherris (2011). The BNP/EIB longevity bond is a 25-year bond with coupon payments linked to a survivor index based on the realised mortality rates.9 The price of the longevity bond is given by
where is a spread, or an average risk premium per annum10, and the T-year projected survival rate is assumed to be the T-year survival probability for the Australian males cohort aged 65 as modelled in Section 2, see Equation (8). Since the BNP/EIB bond is priced based on a yield of 20 basis points below standard EIB rates (Cairns et al. 2006), we have the spread of .11
Under a risk-adjusted measure , the price of the longevity bond corresponds to
Fixing the interest rate to , we find the longevity risk premium , such that the risk-adjusted bond price matches the market bond price as close as possible. For example, for the model price corresponds to , which matches very closely the market bond price of . For more details on the above procedure refer to Meyricke and Sherris (2014). In the following we assume that the risk-adjusted measure is determined by a unique value of . Moreover, for simplicity of notation we will use to represent .
Figure 4 shows the risk-adjusted survival probabilities for Australian males aged 65 with respect to different values of the longevity risk premium . As one observes from the figure, a larger (positive) value of leads to an improvement in survival probability, while a smaller values of indicate a decline in survival probability under the risk-adjusted measure .
3.2. Longevity Swaps
A longevity swap involves counterparties swapping fixed payments for payments linked to the number of survivors in a reference population in a given time period, and can be thought of as a portfolio of S-forwards, see Dowd (2003). An S-forward, or ‘survivor’ forward, has been developed by LLMA (2010b). Longevity swaps can be regarded as a stream of S-forwards with different maturity dates. One of the advantages of using S-forwards is that there is no initial capital requirement at the inception of the contract and cash flows occur only at maturity.
Consider an annuity provider who has an obligation to pay an amount dependent on the number of survivors, and hence, survival probability of a cohort at time T. If longevity risk is present, the survival probability is stochastic. In order to protect himself from a larger-than-expected survival probability, the provider can enter into an S-forward contract paying a fixed amount and receiving an amount equal to the realised survival probability at time T. In doing so, the survival probability that the provider is exposed to is certain, and corresponds to some fixed value K. If the contract is priced in such a way that there is no upfront cost at the inception, it must hold that
under the risk-adjusted measure . Thus, the fixed amount can be identified to be the risk-adjusted survival probability, that is,
Assuming that there is a positive longevity risk premium, the longevity risk hedger who pays the fixed leg and receives the floating leg bears the cost for entering an S-forward.12 Following terminology in Biffis et al. (2014), the amount can be referred to as the swap rate of an S-forward with maturity T. In general, the mark-to-market price process of an S-forward with fixed leg K (not necessarily as in Equation (25)) is given by
for . The quantity
is the realised survival probability, or the survivor index for the cohort, which is observable given .
The term that appears in Equation (26) has a natural interpretation. Given information at time , this term becomes , which is the risk-adjusted survival probability. As time moves on and more information , with , is revealed, the term is a product of the realised survival probability of the first t years, and the risk-adjusted survival probability in the next years. At maturity T, this product becomes the realised survival probability up to time T. In order words, one can think of as the T-year risk-adjusted survival probability with information known up to time t.
The price process in Equation (26) depends on the swap rate of an S-forward written on the same cohort that is now aged at time t, with time to maturity . If a liquid longevity market was developed, the swap rate could be obtained from market data. As is observable at time t, the mark-to-market price process of an S-forward could be considered model-independent. However, since a longevity market is still in its development stage, market swap rates are not available and a model-based risk-adjusted survival probability has to be used instead. An analytical formula for the mark-to-market price of an S-forward can be obtained if the risk-adjusted survival probability is expressed in a closed-form, which can be performed, for example, under the two-factor Gaussian mortality model.
Since a longevity swap is constructed as a portfolio of S-forwards, the price of a longevity swap is simply the sum of the individual S-forward prices.
3.3. Longevity Caps
A longevity cap, which is a portfolio of longevity caplets, provides a similar hedge to a longevity swap but is an option-type instrument. Consider again a scenario described in Section 3.2 where an annuity provider aims to hedge against larger-than-expected T-year survival probability of a particular cohort. Alternatively to hedging with an S-forward, the provider can enter into a long position of a longevity caplet with payoff at time T corresponding to
where is the strike price.13 If the realised survival probability is larger than K, the hedger receives an amount from the longevity caplet. This payment can be regarded as a compensation for the increased payments that the provider has to make in the annuity portfolio, due to the larger-than-expected survival probability. There is no cash outflow if the realised survival probability is smaller than or equal to K. In other words, the longevity caplet allows the provider to “cap” its longevity exposure at K with no downside risk. Since a longevity caplet has a non-negative payoff, it comes at a cost. The price of a longevity caplet
under the two-factor Gaussian mortality model is obtained in the following Proposition.
Proposition 2.
Under the two-factor Gaussian mortality model (Equations (2)–(4)) the price at time t of a longevity caplet , with maturity T and strike K, is given by
where is the realised survival probability observable at time t, is the risk-adjusted survival probability in the next years, and denotes the cumulative distribution function of a standard Gaussian random variable.
Proof.
Under the risk-adjusted measure , we have, from Proposition (1), that
Using the simplified notation , we can write
Equation (30) follows using properties of and noticing that , that is, . □
Similar to an S-forward, the price of a longevity caplet depends on the product term . In particular, a longevity caplet is said to be out-of-the-money if ; at-the-money if ; and in-the-money if .
Following the result of Proposition 2, the two-factor Gaussian mortality model leads to the price of a longevity caplet that is a function of the following variables:
- realised survival probability of the first t years;
- risk-adjusted survival probability in the next years;
- interest rate r;
- strike price K;
- time to maturity ; and
- standard deviation , which is a function of the time to maturity and the model parameters.
Since the quantity is log-normally distributed under the two-factor Gaussian mortality model, Equation (30) resembles the Black-Scholes formula for option pricing where the underlying stock price follows a geometric Brownian motion. In our setup, the stock price at time t is replaced by the T-year risk-adjusted survival probability with information available up to time t. While the stock is traded and can be modelled directly using market data, the underlying of a longevity caplet is the survival probability which is not tradable but can be determined as an output from the dynamics of mortality intensity. As a result, the role of the stock price volatility in the Black-Scholes formula is played by the standard deviation of the integral of the mortality intensity . Since the integral captures the whole history of the mortality intensity from t to T under , one can interpret the standard deviation as the volatility of the risk-adjusted aggregated longevity risk of a cohort aged at time t, for the period from t to T.
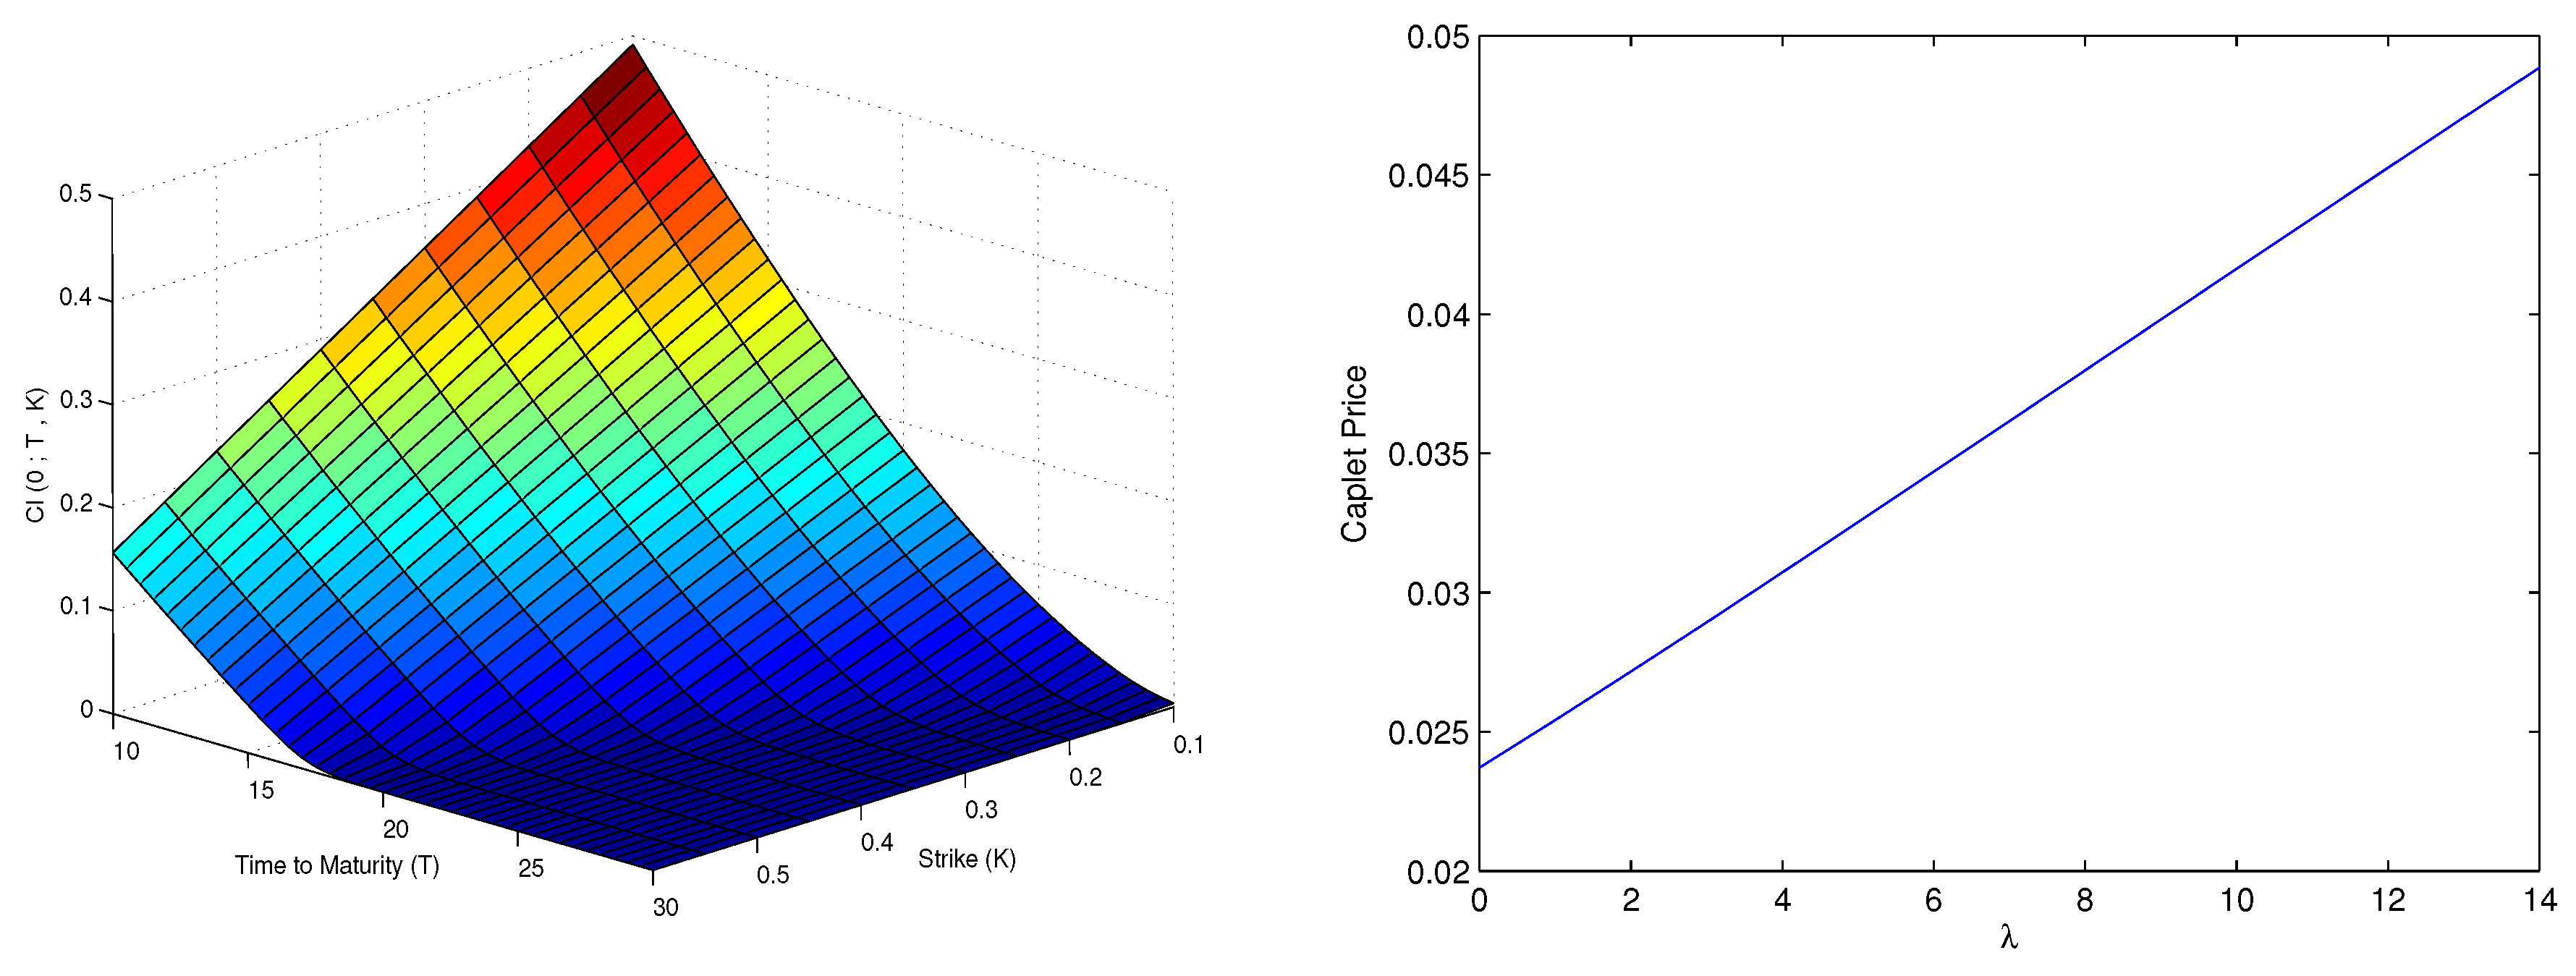
The left panel of Figure 5 shows caplet prices for a cohort aged , using parameters as specified in Table 1, as a function of time to maturity T and strike K. We set , and such that . A lower strike price indicates that the buyer of a caplet is willing to pay more to secure a better protection against a larger-than-expected survival probability. On the other hand, when the time to maturity T is increasing, the underlying survival probability is likely to take smaller values, which leads to a higher probability for the caplet to become out-of-the-money at maturity for a fixed K, see Equation (28). Consequently, for a fixed K the caplet price decreases with increasing T.
The right panel of Figure 5 illustrates the effect of the longevity risk premium on the caplet price. The price of a caplet increases with increasing . As shown in Figure 4, a larger value of will lead to an improvement in survival probability under . Thus, a higher caplet price is observed since the underlying survival probability is larger (on average) under when increases, see Equation (29).
Since longevity cap is constructed as a portfolio of longevity caplets, it can be priced as a sum of individual caplet prices, see also Section 4.1.2.
4. Managing Longevity Risk in a Hypothetical Life Annuity Portfolio
Hedging features of a longevity swap and cap are examined for a hypothetical life annuity portfolio subject to longevity risk. Factors considered include the longevity risk premium, the term to maturity of hedging instruments and the size of the underlying annuity portfolio.
4.1. Setup
We consider a hypothetical life annuity portfolio that consists of a cohort aged . The size of the portfolio that corresponds to the number of policyholders, is denoted by n. The underlying mortality intensity for the cohort follows the two-factor Gaussian mortality model described in Section 2, and the model parameters are specified in Table 1. We assume that there is no loading for the annuity policy and expenses are not included.
Further, we assume a single premium, whole life annuity of per year payable in arrears conditional on the survival of the annuitant to the payment dates. The fair value, or the premium, of the annuity evaluated at is given by
where and is the maximum age allowed in the mortality model. The life annuity provider, thus, receives a total premium, denoted by A, for the whole portfolio corresponding to the sum of individual premiums:
This is the present value of the asset held by the annuity provider at . Since the promised annuity cashflows depend on the death times of annuitants in the portfolio, the present value of the liability is subject to randomness caused by the stochastic dynamics of the mortality intensity. The present value of the liability for each policyholder, denoted by , is determined by the death time of the policyholder, and is given by
for a simulated , with denoting the next smaller integer of a real number q. The present value of the liability L for the whole portfolio is obtained as a sum of individual liabilities:
The algorithm for simulating death times of annuitants, which requires a single simulated path for the mortality intensity of the cohort, is summarised in Appendix A. The discounted surplus distribution () of an unhedged annuity portfolio is obtained by setting
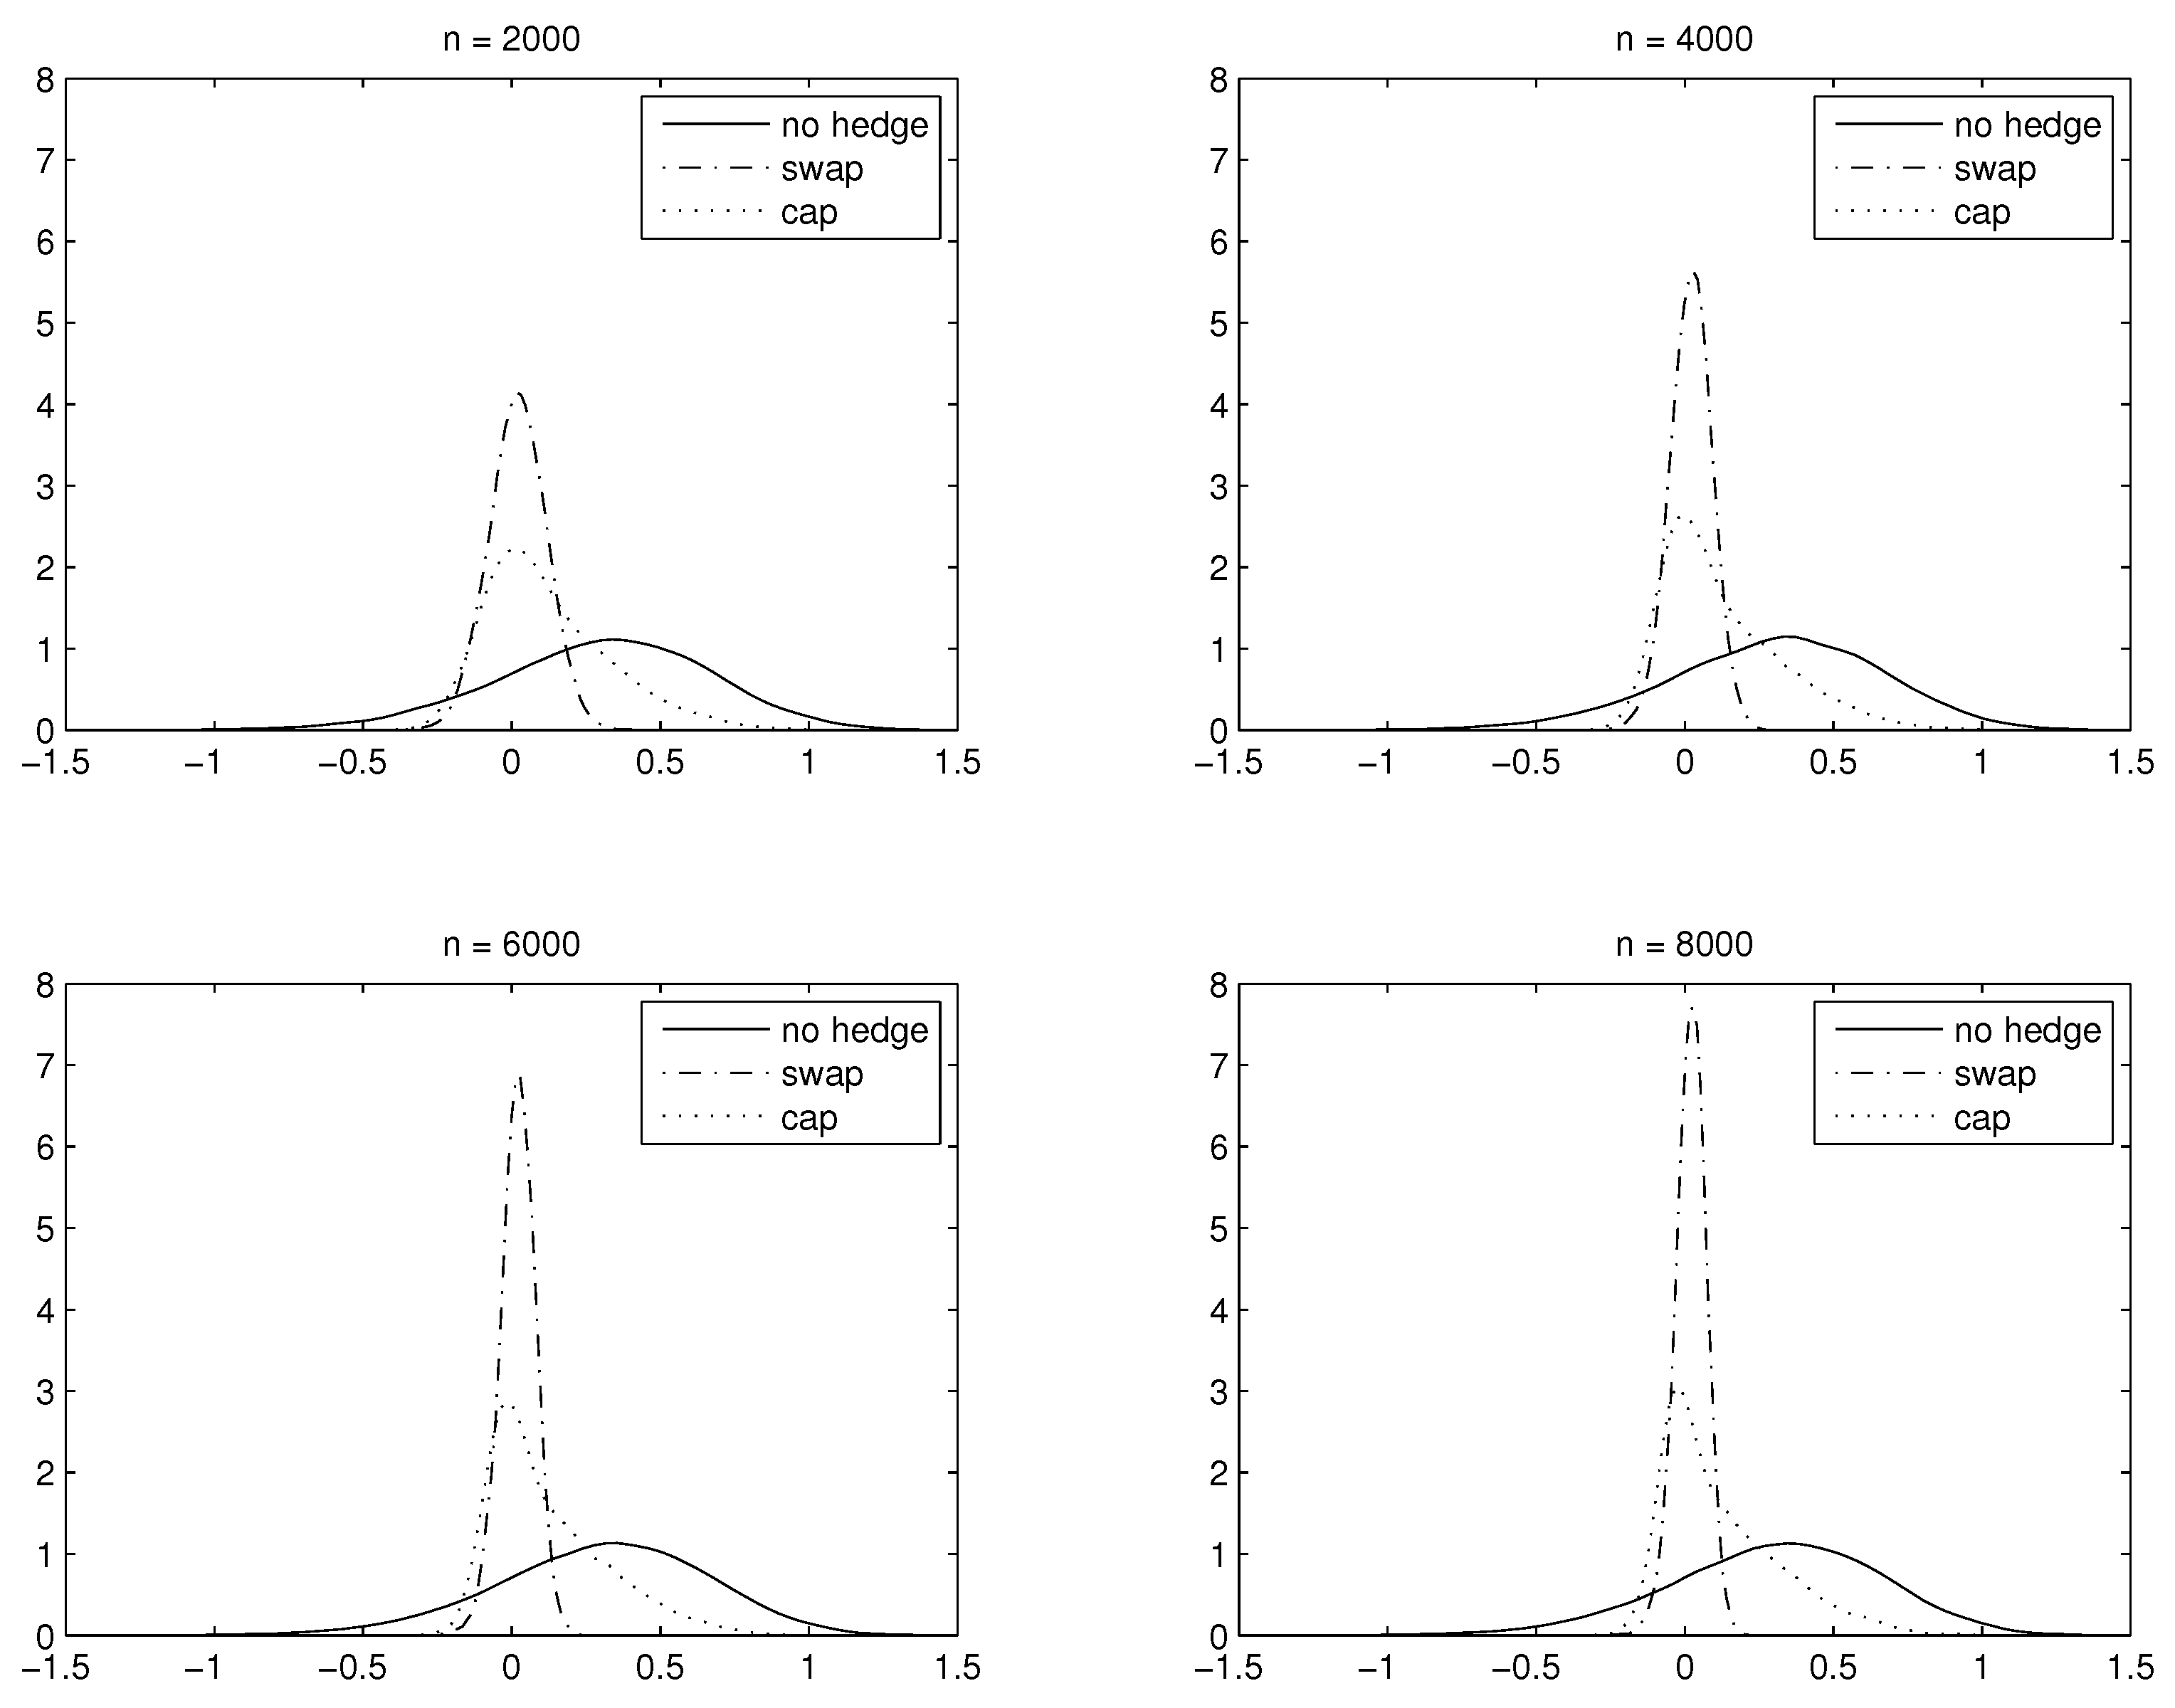
The impact of longevity risk is captured by simulating the discounted surplus distribution where each sample is determined by the realised mortality intensity of a cohort. Since traditional pricing and risk management of life annuity relies on diversification effect, or the law of large numbers, we consider the discounted surplus distribution per policy
Figure 6 shows the discounted surplus distribution per policy without longevity risk (i.e. when setting ) with different portfolio sizes, varying from to 8000. As expected, the distribution is centred around zero as there is no loading assumed in the pricing algorithm, while the standard deviation diminishes as the number of policies increases.
In the following we consider a longevity swap and a cap as hedging instruments. These are index-based instruments where the payoffs depend on the survivor index, or the realised survival probability (Equation (27)), which is in turn determined by the realised mortality intensity. We do not consider basis risk14 but due to a finite portfolio size, the actual proportion of survivors, , where denotes the number of deaths experienced by a cohort during the period , will be in general similar, but not identical, to the survivor index (Appendix A). As a result, the static hedge will be able to reduce systematic mortality risk, whereas the idiosyncratic mortality risk component will be retained by the annuity provider.
4.1.1. A Swap-Hedged Annuity Portfolio
For an annuity portfolio hedged by an index-based longevity swap, payments from the swap
at time depend on the realised mortality intensity, where denotes the term to maturity of the longevity swap. The number of policyholders n acts as the notional amount of the swap contract so that the quantity represents the number of survivors implied by the realised mortality intensity at time T. We fix the strike of a swap to the risk-adjusted survival probability, that is,
such that the price of a swap is zero at , see Section 3.2. The discounted surplus distribution of a swap-hedged annuity portfolio can be expressed as
where
is the (random) discounted cashflow coming from a long position in the longevity swap. The discounted surplus distribution per policy of a swap-hedged annuity portfolio is determined by .
4.1.2. A Cap-Hedged Annuity Portfolio
For an annuity portfolio hedged by an index-based longevity cap, the cashflows
at are payments from a long position in the longevity cap. We set
such that the strike for a longevity caplet is the “best estimated” survival probability given .15 The discounted surplus distribution of a cap-hedged annuity portfolio is given by
where
is the (random) discounted cashflow from holding the longevity cap and
is the price of the longevity cap. The discounted surplus distribution per policy of a cap-hedged annuity portfolio is given by .
4.2. Results
Hedging results are summarised by means of summary statistics that include mean, standard deviation (std. dev.), skewness, as well as Value-at-Risk (VaR) and Expected Shortfall (ES) of the discounted surplus distribution per policy of an unhedged, a swap-hedged, and a cap-hedged annuity portfolio. Skewness is included since the payoff of a longevity cap is nonlinear and the resulting distribution of a cap-hedged annuity portfolio is not symmetric. VaR is defined as the q-quantile of the discounted surplus distribution per policy. ES is defined as the expected loss of the discounted surplus distribution per policy given the loss is at or below the q-quantile. We fix so that the confidence interval for VaR and ES corresponds to . We use 20,000 simulations to obtain the distribution for the discounted surplus.16 Hedge effectiveness is examined with respect to (w.r.t.) different assumptions underlying the longevity risk premium (), the term to maturity of hedging instruments () and the portfolio size (n). Parameters for the base case are as specified in Table 2.
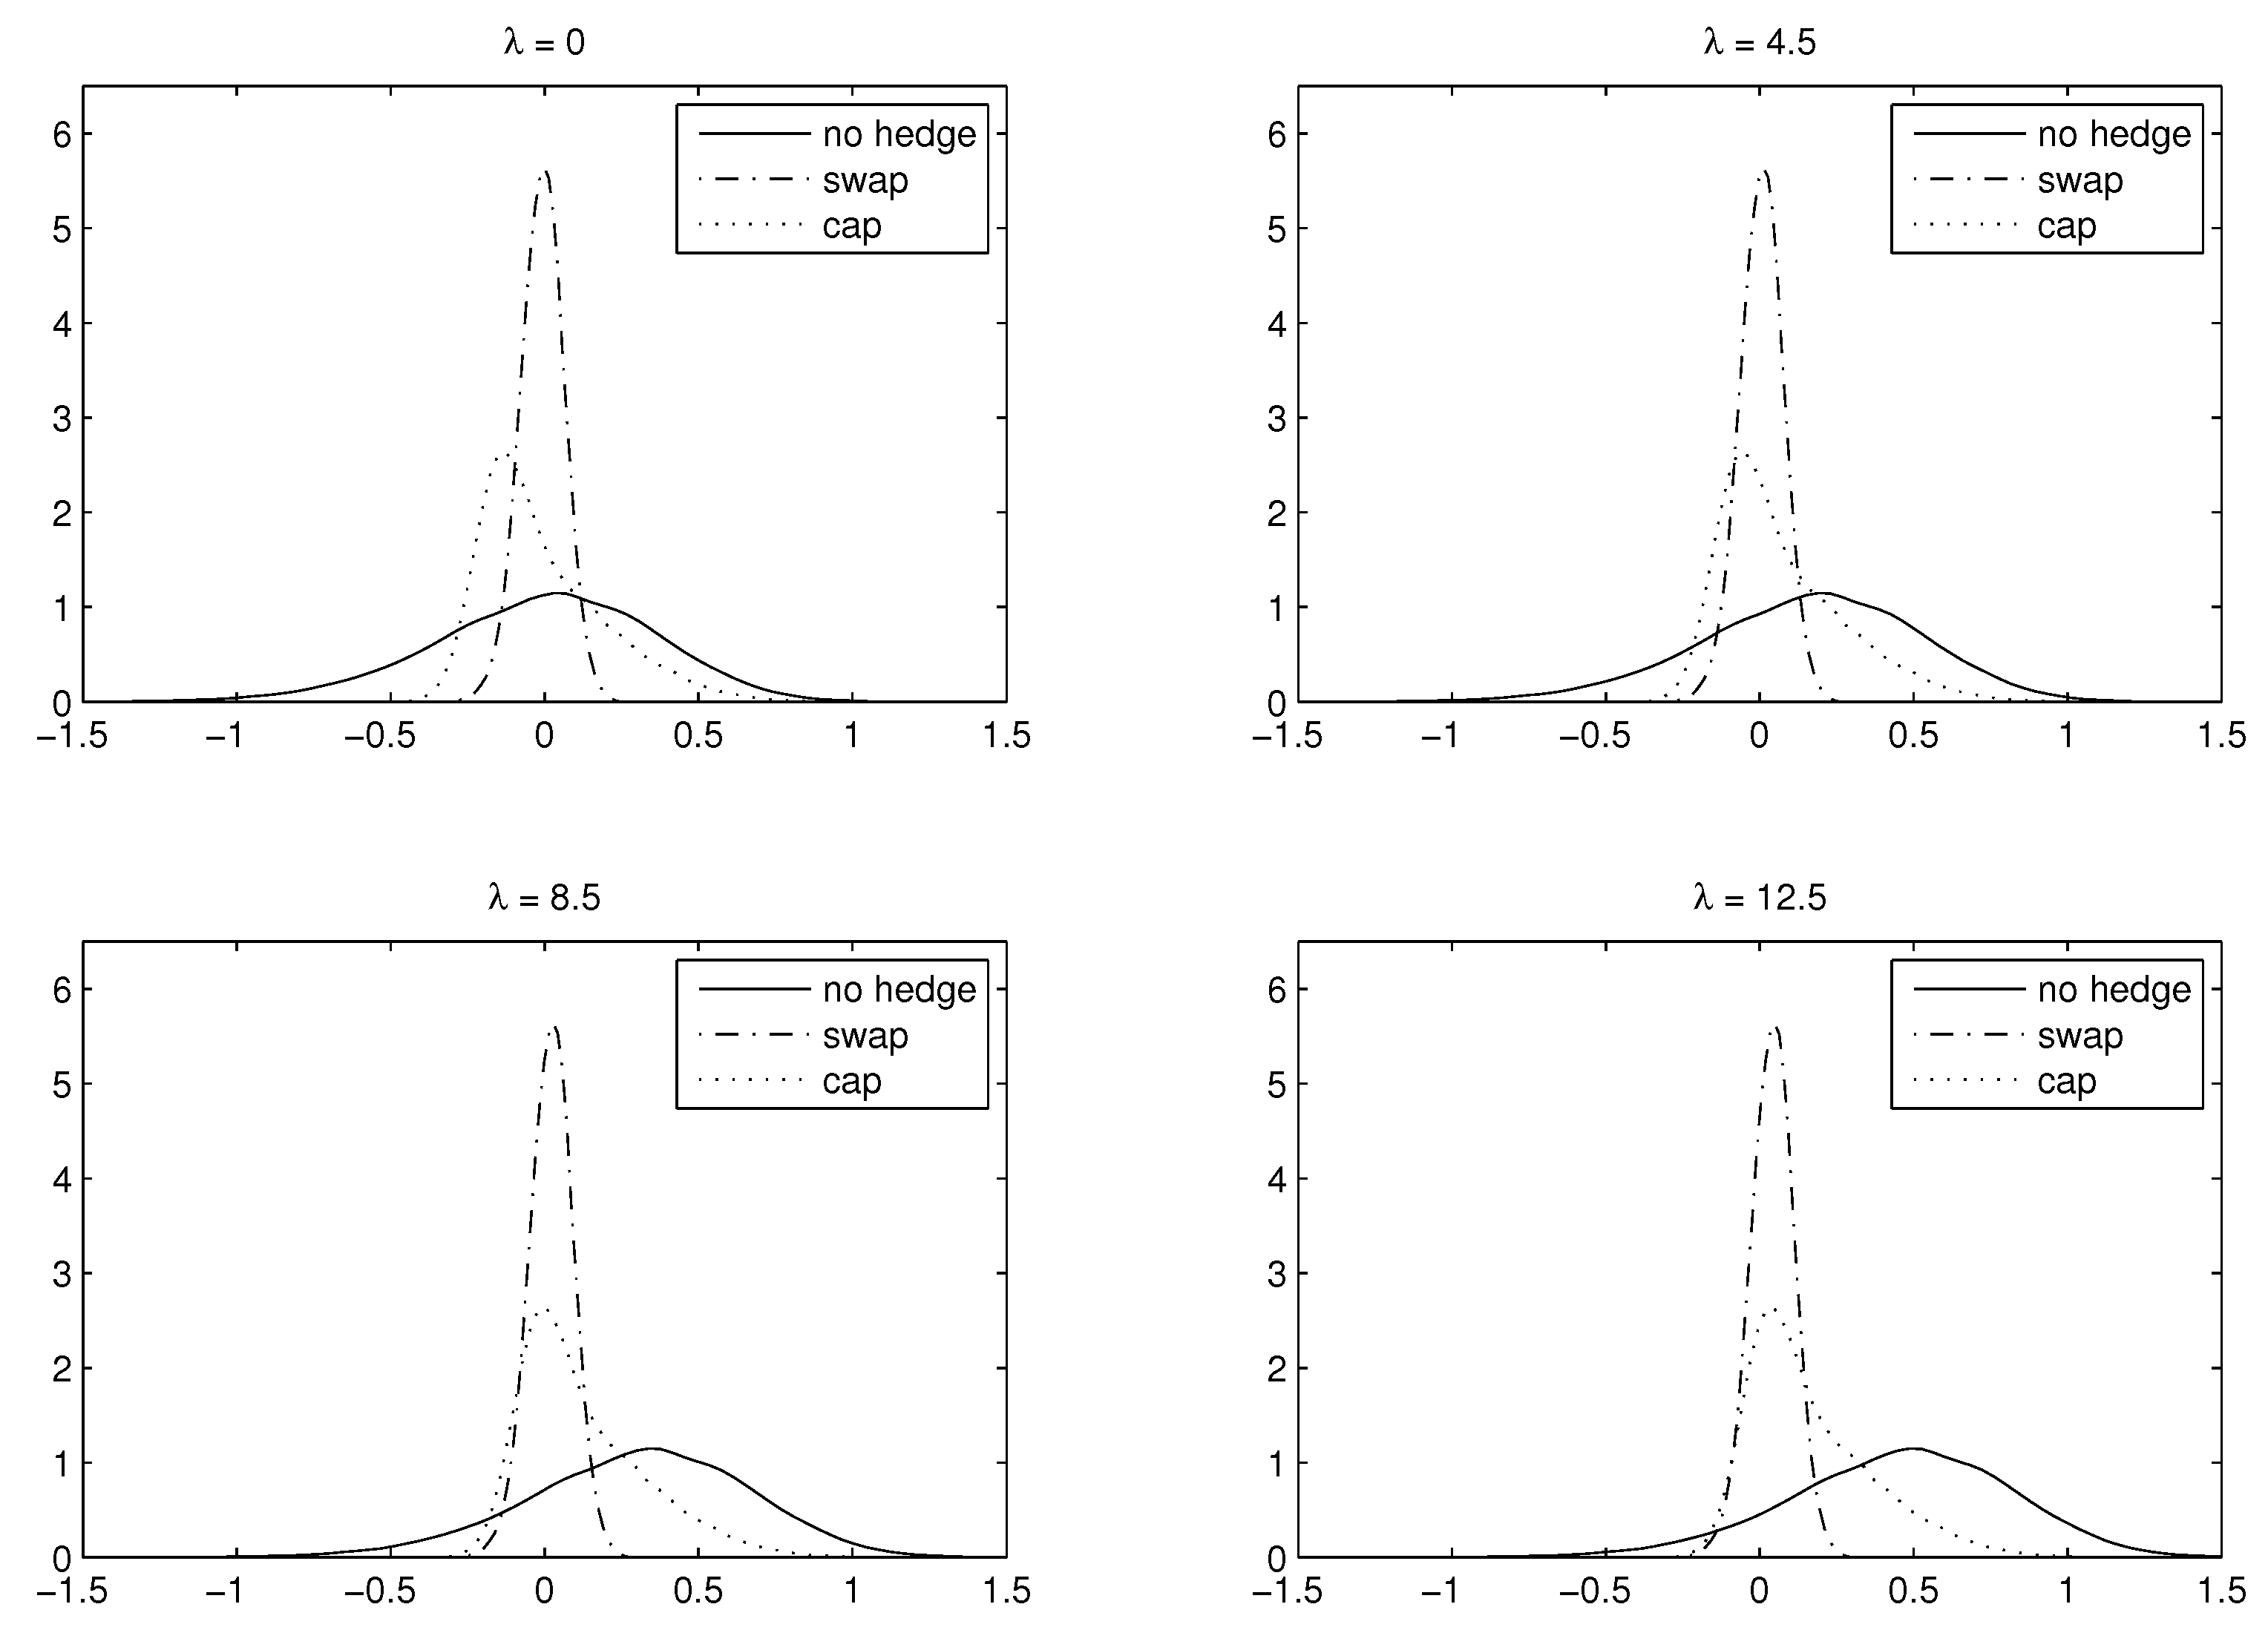
4.2.1. Hedging Features w.r.t. Longevity Risk Premium
The longevity risk premium is one of the factors that determines prices of longevity derivatives and life annuity policies. Since payoffs of a longevity swap, a cap and a life annuity are contingent on the same underlying mortality intensity of a cohort, all these products are priced using the same . Figure 7 and Table 3 illustrate the effect of changing on the distributions of an unhedged, a swap-hedged and a cap-hedged annuity portfolio. The degree of longevity risk can be quantified by the standard deviation, the VaR and the ES of the distributions. We observe that increasing leads to the shift of the distribution to the right, resulting in a higher average surplus. On the other hand, changing has no impact on the standard deviation and the skewness of the distribution.
For an unhedged annuity portfolio, a higher leads to higher premium for the life annuity policy since the annuity price is determined by the risk-adjusted survival probability , see Equation (32). In other words, an increase in the annuity price compensates the provider for the longevity risk undertaken when selling life annuity policies. There is also a trade-off between risk premium and affordability. Setting a higher premium will clearly improve the risk and return of an annuity business. It might, however, reduce the interest of potential policyholders. An empirical relationship between implied longevity and annuity prices is studied in Chigodaev et al. (2014).
When a life annuity portfolio is hedged using a longevity swap, the standard deviation and the absolute values of the VaR and the ES are reduced substantially. The higher return obtained by charging a larger longevity risk premium in life annuity policies is offset by an increased price paid implicitly in the swap contract (since in Equation (41)). It turns out that as increases an extra return earned in the annuity portfolio and the higher implicit cost of the longevity swap nearly offset each other on average. The net effect is that a swap-hedged annuity portfolio remains to a great extent unaffected by the assumption on , leading only to a very minor increase in the mean of the distribution. This minor increase can even be reduced if we assume a longer term to maturity of hedging duration. For instance, if instead of 30, the mean of the distribution for the swap-hedged portfolio becomes , which corresponds to the case of , respectively. The results for are displayed in Table 3.
For a cap-hedged annuity portfolio, the discounted surplus distribution is positively skewed since a longevity cap allows an annuity provider to get exposure to the upside potential when policyholders live shorter than expected. Compared to an unhedged portfolio, the standard deviation and the absolute values of the VaR and the ES are also reduced but the reduction is smaller compared to a swap-hedged portfolio. When increases, we observe that the mean of the distribution for a cap-hedged portfolio increases faster than for a swap-hedged portfolio but slower than for an unhedged portfolio. It can be explained by noticing that when the survival probability of a cohort is overestimated, that is, when annuitants turn out to live shorter than expected, holding a longevity cap has no effect (besides paying the price of a cap for longevity protection at the inception of the contract) while there is a cash outflow when holding a longevity swap, see Equations (41) and (45).
In the longevity risk literature, the VaR and the ES are of a particular importance as they are the main factors determining the capital reserve when dealing with exposure to longevity risk (Meyricke and Sherris (2014)). As shown in Table 3, the difference between a swap-hedged and a cap-hedged portfolio in terms of the VaR and the ES becomes smaller when increases. In fact, for , a longevity cap becomes more effective in reducing the tail risk of an annuity portfolio compared to a longevity swap.17 This result suggests that a longevity cap, besides being able to capture the upside potential, can be a more effective hedging instrument than a longevity swap in terms of reducing the VaR and the ES when the demanded longevity risk premium is large, assuming the annuity and the longevity hedging instruments are priced using the same .
4.2.2. Hedging Features w.r.t. Term to Maturity
Table 4 and Figure 8 summarize hedging results with respect to the term to maturity of hedging instruments. Due to the long-term nature of the contracts, the hedges are ineffective for years and the standard deviations are reduced only by around for both instruments. The lower left panel of Figure 3 shows that there is little randomness around the realised survival probability for the first few years for a cohort aged 65, and consequently the hedges are insignificant when is short.
The difference in hedge effectiveness between and for both instruments is also insignificant. In fact, the longevity risk underlying the annuity portfolio becomes small after 30 years since the majority of annuitants are already deceased before reaching the age of 95. In our model setup the chance, on average, for a 65 year old to live up to 95 is around (Figure 4 with ) and, hence, only around policies will still be in-force after 30 years. Much of the risk left is attributed to idiosyncratic mortality risk, and hedging longevity risk for a small portfolio using index-based instruments is of limited use.
For a swap-hedged portfolio, the standard deviation is reduced significantly when years. The mean surplus, on the other hand, drops to nearly zero since there is a higher cost implied for the hedge with increasing number of S-forwards involved to form the swap as increases.
Similar hedging features with respect to are observed for a longevity cap. However, the skewness of the distribution of a cap-hedged portfolio increases with increasing . It can be explained by noticing that while a longevity cap is able to capture the upside potential (when policyholders live shorter than expected) regardless of , it provides a better longevity risk protection (when policyholders live longer than expected) in case is larger. As a result, the distribution of a cap-hedged portfolio becomes more asymmetric when increases.
4.2.3. Hedging Features w.r.t. Portfolio Size
Table 5 and Figure 9 demonstrate hedging features of a longevity swap and a cap with changing portfolio size n. We observe a decrease in standard deviation, as well as the VaR and the ES (in absolute terms) when portfolio size increases. Compared to an unhedged portfolio, the reduction in the standard deviation and the risk measures is larger for a swap-hedged portfolio, compared to a cap-hedged portfolio. Recall that idiosyncratic mortality risk becomes significant when n is small. We quantify the effect of the portfolio size on hedge effectiveness by introducing the measure of longevity risk reduction R, defined in terms of the variance of the discounted surplus per policy, that is,
where and represent the variances of the discounted surplus distribution per policy for a hedged and an unhedged annuity portfolio, respectively. The results are reported in Table 6.
Li and Hardy (2011) consider hedging longevity risk using a portfolio of q-forwards and find the longevity risk reduction of and for portfolio size of 10,000 and 3000, respectively. In contrast to Li and Hardy (2011), we do not consider basis risk and the result of using longevity swap as a hedging instrument leads to a greater risk reduction. Overall, our results indicate that hedge effectiveness for an index-based longevity swap and a cap diminishes with decreasing n since idiosyncratic mortality risk cannot be effectively diversified away for a small portfolio size. Even though a longevity cap is less effective in reducing the variance, part of the dispersion is attributed to its ability of capturing the upside of the distribution when survival probability of a cohort is overestimated. From Table 5 we also observe that the distribution becomes more positively skewed for a cap-hedged portfolio when n increases, which is a consequence of having a larger exposure to longevity risk with increasing number of policyholders in the portfolio.
5. Conclusions
Life and pension annuities are the most important types of post-retirement products offered by annuity providers to help secure lifelong incomes for the rising number of retirees. While interest rate risk can be managed effectively in the financial markets, longevity risk is a major concern for annuity providers as there are only limited choices available to mitigate the long-term risk. Development of effective financial instruments for longevity risk in capital markets is arguably the best solution available.
Two types of longevity derivatives, a longevity swap and a cap, are analysed in this paper from a pricing and hedging perspective. We apply a tractable Gaussian mortality model to capture the longevity risk, and derive explicit formulas for important quantities such as survival probabilities and prices of longevity derivatives. Hedge effectiveness and features of an index-based longevity swap and a cap used as hedging instruments are examined using a hypothetical life annuity portfolio exposed to longevity risk.
Our results suggest that the longevity risk premium is a small contributor to hedge effectiveness of a longevity swap since a higher annuity price is partially offset by an increased cost of hedging when is taken into account. It is shown that a longevity cap, while being able to capture the upside potential when survival probabilities are overestimated, can be more effective in reducing longevity tail risk compared to a longevity swap, provided that is large enough. The term to maturity is an important factor in determining hedge effectiveness. However, the difference in hedge effectiveness is only marginal when increases from 30 to 40 years for an annuity portfolio consisting of a single cohort aged 65 initially. This is due to the fact that only a small number of policies will still be in-force after a long period of time (30 to 40 years), and index-based instruments turn out to be ineffective when idiosyncratic mortality risk becomes a larger contributor to the overall risk, compared to systematic mortality risk. The effect of the portfolio size n on hedge effectiveness is quantified and compared with the result obtained in Li and Hardy (2011), where population basis risk is taken into account. In addition, we find that the skewness of the surplus distribution of a cap-hedged portfolio is sensitive to the term to maturity and the portfolio size, and, as a result, the difference between a longevity swap and a cap when used as hedging instruments becomes more pronounced for larger and n.
As discussed in Biffis and Blake (2014), developing a liquid longevity market requires reliable and well-designed financial instruments that can attract sufficient amount of interests from both buyers and sellers. Besides a longevity swap, which is so far a common longevity hedging choice for annuity providers, option-type instruments such as longevity caps can provide hedging features that linear products cannot offer. A longevity cap is shown to have alternative hedging properties compared to a swap, and this option-type instrument would also appeal to certain classes of investors interested in receiving premiums by selling a longevity insurance. Further research on the design of longevity-linked instruments from the perspectives of buyers and sellers would provide a further step towards the development of an active longevity market.
Author Contributions
Conceptualization, M.C.F.; Formal analysis, M.C.F.; Methodology, K.I. and M.S.; Software, M.C.F.; Supervision, K.I. and M.S.; Validation, M.C.F., K.I. and M.S.; Writing-review & editing, K.I. and M.S.
Funding
This research received no external funding.
Conflicts of Interest
The authors declare no conflict of interest.
Appendix A
To simulate death times of annuitants, we notice that once a sample of the mortality intensity is obtained, the Cox process becomes an inhomogeneous Poisson process and the first jump times, which are interpreted as death times, can be simulated as follows (see e.g., Brigo and Mercurio (2007)):
- Simulate the mortality intensity from to .
- Generate a standard exponential random variable . For example, using an inverse transform method, we have where .
- Set the death time to be the smallest T such that . If then set .
- Repeat step (2) and (3) to obtain another death time.
The payoff of an index-based hedging instrument depends on the realised survival probability, the quantity . The payoff of a customised instrument, on the other hand, depends on the proportion of survivors, , underlying an annuity portfolio where the number of deaths, , is obtained by counting the number of simulated death times that are smaller than t. Note that
and the accuracy of the approximation improves when n increases.
References
- Bauer, Daniel, Matthias Borger, and Jochen Russ. 2010. On the pricing of longevity-linked securities. Insurance: Mathematics and Economics 46: 139–49. [Google Scholar] [CrossRef]
- Biffis, Enrico. 2005. Affine processes for dynamics mortality and actuarial valuations. Insurance: Mathematics and Economics 37: 443–68. [Google Scholar] [CrossRef]
- Biffis, Enrico, and David Blake. 2014. Keeping some skin in the game: How to start a capital market in longevity risk transfers. North American Actuarial Journal 18: 14–21. [Google Scholar] [CrossRef]
- Biffis, Enrico, David Blake, Lorenzo Pitotti, and Ariel Sun. 2014. The cost of counterparty risk and collateralization in longevity swaps. Journal of Risk and Insurance 83: 387–419. [Google Scholar] [CrossRef]
- Blake, David, and William Burrows. 2001. Survivor bonds: Helping to hedge mortality risk. Journal of Risk and Insurance 68: 339–48. [Google Scholar] [CrossRef]
- Blake, David, Andrew Cairns, Guy Coughlan, Kevin Dowd, and Richard MacMinn. 2013. The new life market. Journal of Risk and Insurance 80: 501–57. [Google Scholar] [CrossRef]
- Blake, David, Andrew J. G. Cairns, and Kevin Dowd. 2006. Living with mortality: Longevity bonds and other mortality-linked securities. British Actuarial Journal 12: 153–228. [Google Scholar] [CrossRef]
- Blake, David, Andrew Cairns, Kevin Dowd, and Richard MacMinn. 2006. Longevity bonds: Financial engineering, valuation and hedging. Journal of Risk and Insurance 73: 647–72. [Google Scholar] [CrossRef]
- Boyer, Martin, and Lars Stentoft. 2013. If we can simulate it, we can insure it: An application to longevity risk management. Insurance: Mathematics and Economics 52: 35–45. [Google Scholar] [CrossRef]
- Brigo, Damiano, and Fabio Mercurio. 2007. Interest Rate Models, 2nd ed.Berlin: Springer. [Google Scholar]
- Cairns, Andrew. 2011. Modelling and mangement of longevity risk: Approximations to survivor functions and dynamic hedging. Insurance: Mathematics and Economics 49: 438–53. [Google Scholar]
- Cairns, Andrew, David Blake, and Kevin Dowd. 2006. A two-factor model for stochastic mortality with parameter uncertainty: Theory and calibration. Journal of Risk and Insurance 73: 687–718. [Google Scholar] [CrossRef]
- Cairns, Andrew, Kevin Dowd, David Blake, and Guy Coughlan. 2014. Longevity hedge effectiveness: A decomposition. Quantitative Finance 14, 217–35. [Google Scholar] [CrossRef]
- Chigodaev, Alexander, Moshe A. Milevsky, and Tom S. Salisbury. 2014. How Long Does the Market Think You Will Live? Implying Longevity From Annuity Prices. Technical Report. Toronto: IFID Center. [Google Scholar]
- Cocco, João F., and Francisco J. Gomes. 2012. Longevity risk, retirement savings, and financial innovation. Journal of Financial Economics 103: 507–29. [Google Scholar] [CrossRef]
- Donnelly, Ryan, Sebastian Jaimungal, and Dmitri H. Rubisov. 2014. Valuing guaranteed withdrawal benefits with stochastic interest rates and volatility. Quantitative Finance 14: 369–82. [Google Scholar] [CrossRef]
- Dowd, Kevin. 2003. Survivor bonds: A comment on Blake and Burrows. Journal of Risk and Insurance 70: 339–48. [Google Scholar] [CrossRef]
- Fung, Man Chung, Katja Ignatieva, and Michael Sherris. 2014. Systematic mortality risk: An analysis of guarantee lifetime withdrawal benefits in variable annuities. Insurance: Mathematics and Economics 58: 103–15. [Google Scholar] [CrossRef]
- Towers Watson. 2013. Global Pension Assets Study. Technical Report. Available online: http://www.towerswatson.com (accessed on 27 November 2018).
- Hari, Norbert, Anja De Waegenaere, Bertrand Melenberg, and Theo E. Nijman. 2008. Longevity risk in portfolios of pension annuities. Insurance: Mathematics and Economics 42: 505–19. [Google Scholar] [CrossRef]
- Huang, Yao Tung, and Yue Kuen Kwok. 2016. Regression-based monte carlo methods for stochastic control models: Variable annuities with lifelong guarantees. Quantitative Finance 16: 905–28. [Google Scholar] [CrossRef]
- Ignatieva, Katja, Andrew Song, and Jonathan Ziveyi. 2016. Pricing and hedging of guaranteed minimum benefits under regime-switching and stochastic mortality. Insurance: Mathematics and Economics 70: 286–300. [Google Scholar]
- Li, Johnny, and Mary R. Hardy. 2011. Measuring basis risk in longevity hedges. North American Actuarial Journal 15: 177–200. [Google Scholar] [CrossRef]
- LLMA. 2010a. Longevity pricing framework. Available online: http://docplayer.net/51341950-Longevity-pricing-framework.html (accessed on 27 November 2018).
- LLMA. 2010b. Technical Note: The S-Forward. London: Life and Longevity Markets Association (LLMA). [Google Scholar]
- Luciano, Elisa, Luca Regis, and Elena Vigna. 2012. Delta-Gamma hedging of mortality and interest rate risk. Insurance: Mathematics and Economics 50: 402–12. [Google Scholar] [CrossRef]
- Luciano, Elisa, and Elena Vigna. 2008. Mortality risk via affine stochastic intensities: Calibration and empirical relevance. Belgian Actuarial Bulletin 8: 5–16. [Google Scholar]
- Meyricke, Ramona, and Michael Sherris. 2014. Longevity risk, cost of capital and hedging for life insurers under solvency II. Insurance: Mathematics and Economics 55: 147–55. [Google Scholar] [CrossRef]
- Ngai, Andrew, and Michael Sherris. 2011. Longevity risk management for life and variable annuities: The effectiveness of static hedging using longevity bonds and derivatives. Insurance: Mathematics and Economics 49: 100–14. [Google Scholar] [CrossRef]
- Peng, Jingjiang, Kwai Sun Leung, and Yue Kuen Kwok. 2012. Pricing guaranteed minimum withdrawal benefits under stochastic interest rates. Quantitative Finance 12, 993–41. [Google Scholar] [CrossRef]
- Wang, Chou-Wen, and Sharon S. Yang. 2013. Pricing survivor derivatives with cohort mortality dependence under the Lee-Carter framework. Journal of Risk and Insurance 80: 1027–56. [Google Scholar] [CrossRef]
- Wills, Samuel, and Michael Sherris. 2011. Integrating Financial and Demographic Longevity Risk Models: An Australian Model for Financial Applications. UNSW Australian School of Business Research Paper No. 2008ACTL05. Sydney: UNSW. [Google Scholar]
- Yueh, Meng-Lan, Hsin-Yu Chiu, and Shou-Hsun Tsai. 2016. Valuations of mortality-linked structured products. The Journal of Derivatives 24: 66–87. [Google Scholar] [CrossRef]
| 1 | From an annuity provider’s perspective, longevity risk modelling can lead to a (stochastically) over- or underestimation of survival probabilities for all annuitants. For this reason longevity risk is also referred to as the systematic mortality risk. |
| 2 | Of particular interest is an attempt to issue the EIB longevity bond by the European Investment Bank (EIB) in 2004, which was underwritten by BNP Paribas. This bond was not well received by investors and could not generate enough demand to be launched due to its deficiencies, as outlined in Blake et al. (2006). |
| 3 | There is a separate strand in the literature that analyses variable annuities with embedded guarantees where the authors either do not investigate hedge effectiveness (as e.g., in Peng et al. 2012), or perform static hedge. Huang and Kwok (2016) price and hedge the guaranteed lifelong withdrawal benefit by means of the regression-based Monte Carlo simulations for stochastic control models; Fung et al. (2014) consider the capital reserve required due to the lack of hedging instruments to hedge the longevity risk in the guaranteed lifetime withdrawal benefits in variable annuities; Donnelly et al. (2014) value guaranteed withdrawal benefits with stochastic interest rates and volatility and compute associated hedge ratios; and Ignatieva et al. (2016) price and hedge guaranteed minimum benefits under regime-switching and stochastic mortality. |
| 4 | For simplicity of notation we replace by . |
| 5 | We can in fact replace x by in Equation (4). Using will take into account the empirical observation that the volatility of mortality tends to increase with age (Figure 1 and Figure 2). However, for a Gaussian process the intensity will have a non-negligible probability of reaching negative values when the volatility of the second factor () becomes very high, which occurs for example when (given ). Using x instead of will also make the results of Section 3 easy to interpret. For these reasons we assume that the second factor depends on the initial age x only. |
| 6 | We use Australian males mortality data for illustrative purposes. The model can well be applied to any other mortality data. |
| 7 | We calibrate the model for ages 65 and 75 simultaneously to obtain reasonable values for and since the drift of the second factor is age-dependent. |
| 8 | For simplicity, we assume that there is no risk adjustment for the first factor and is age-independent. However, if the market demands a risk premium for the first factor then one could, similar to the case of , assume that and, hence, obtain under the measure. In the following we assume for simplicity and conciseness of discussion that . |
| 9 | The issue price was determined by BNP Paribas using anticipated cash flows based on the 2002-based mortality projections provided by the UK Government Actuary’s Department. |
| 10 | The spread depends on the term of the bond and the initial age of the cohort being tracked (Cairns et al. 2006), and is related to but distinct from , the longevity risk premium. |
| 11 | The reference cohort for the BNP/EIB longevity bond is the England and Wales males aged 65 in 2003. Since the longevity derivatives market is under-developed in Australia, we assume that the same spread of (as in the UK) is applicable to the Australian males cohort aged 65 in 2008. Note however that sensitivity analyses will be performed in Section 4. |
| 12 | The risk-adjusted survival probability will be larger than the “best estimate” -survival probability if a positive market price of longevity risk is demanded, see Figure 4. |
| 13 | The payoff of a longevity caplet is similar to the payoff of the option embedded in the principal-at-risk bond described in Biffis and Blake (2014). |
| 14 | If basis risk is present, we need to distinguish between the mortality intensity for the population () and mortality intensity for the cohort () underlying the annuity portfolio, see Biffis et al. (2014). |
| 15 | For a longevity swap, the risk-adjusted survival probability is used as a strike price so that the price of a longevity swap is zero at inception. In contrast, a longevity cap has non-zero price and is the most natural choice for a strike. |
| 16 | |
| 17 | Given , the VaR and the ES for a swap-hedged portfolio are and , respectively. For a cap-hedged portfolio they become and , respectively. |
Figure 1.
Australian male central death rates where and .
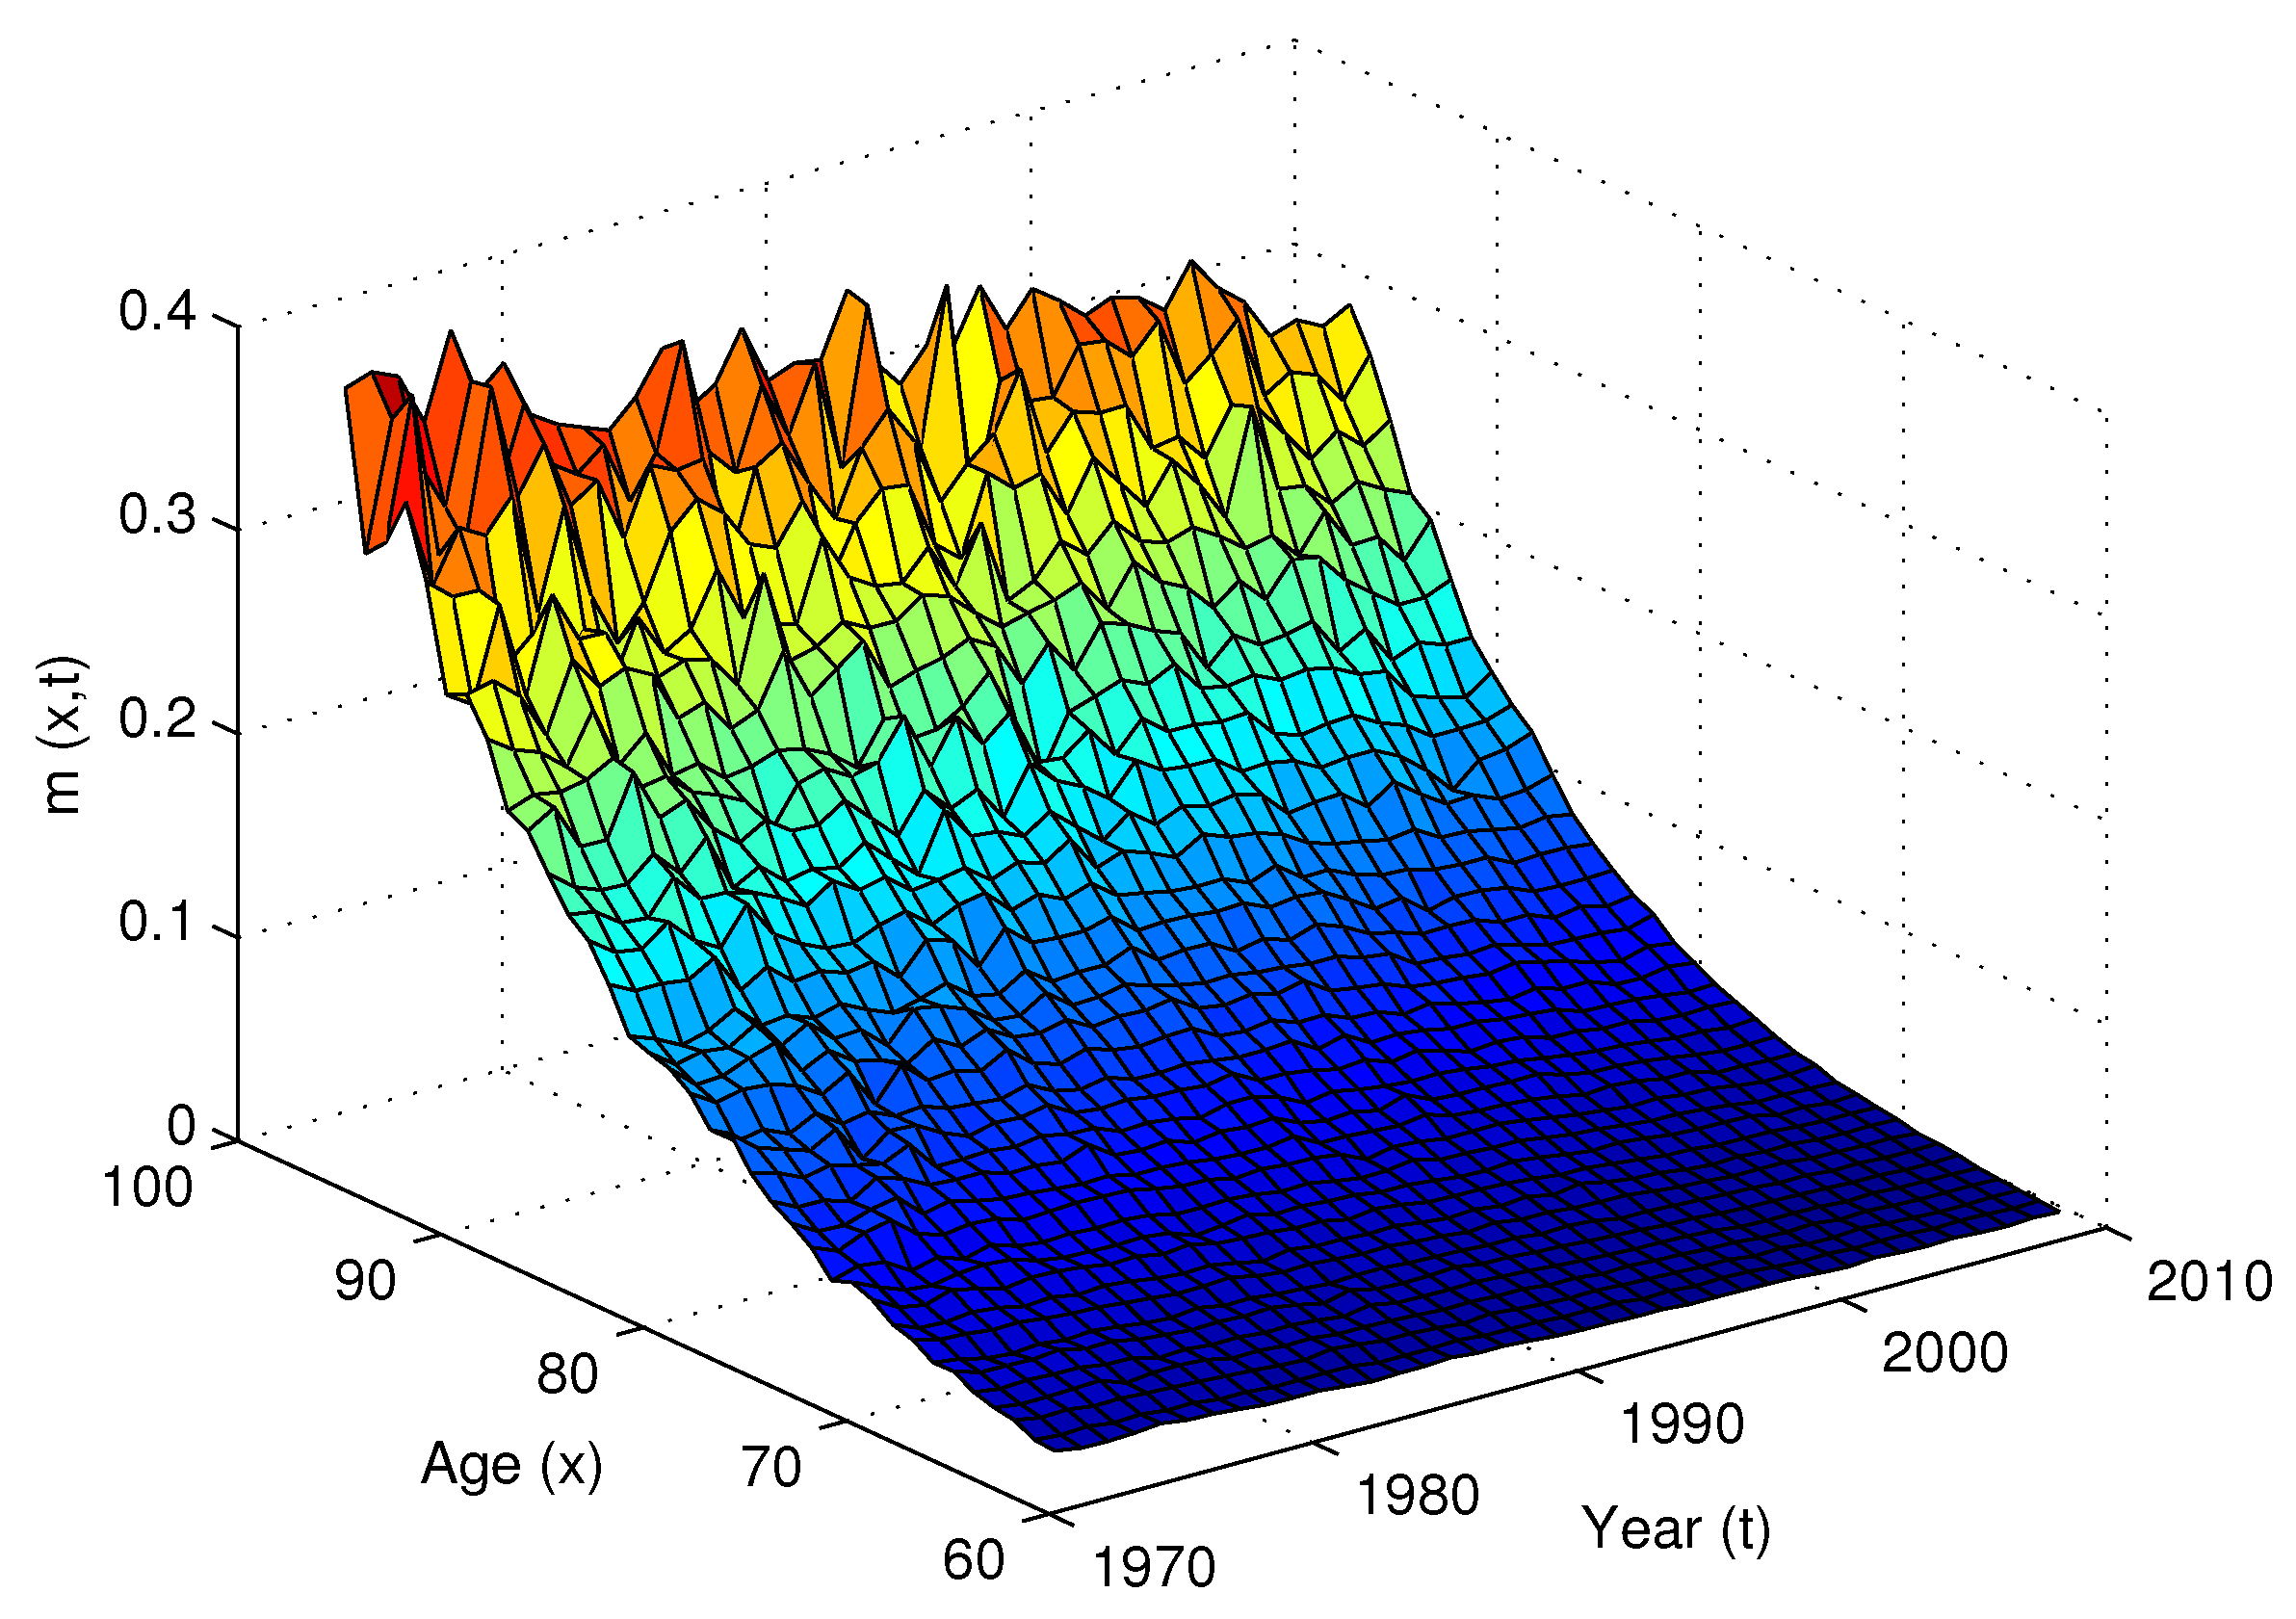
Figure 2.
Difference of the central death rates where and .
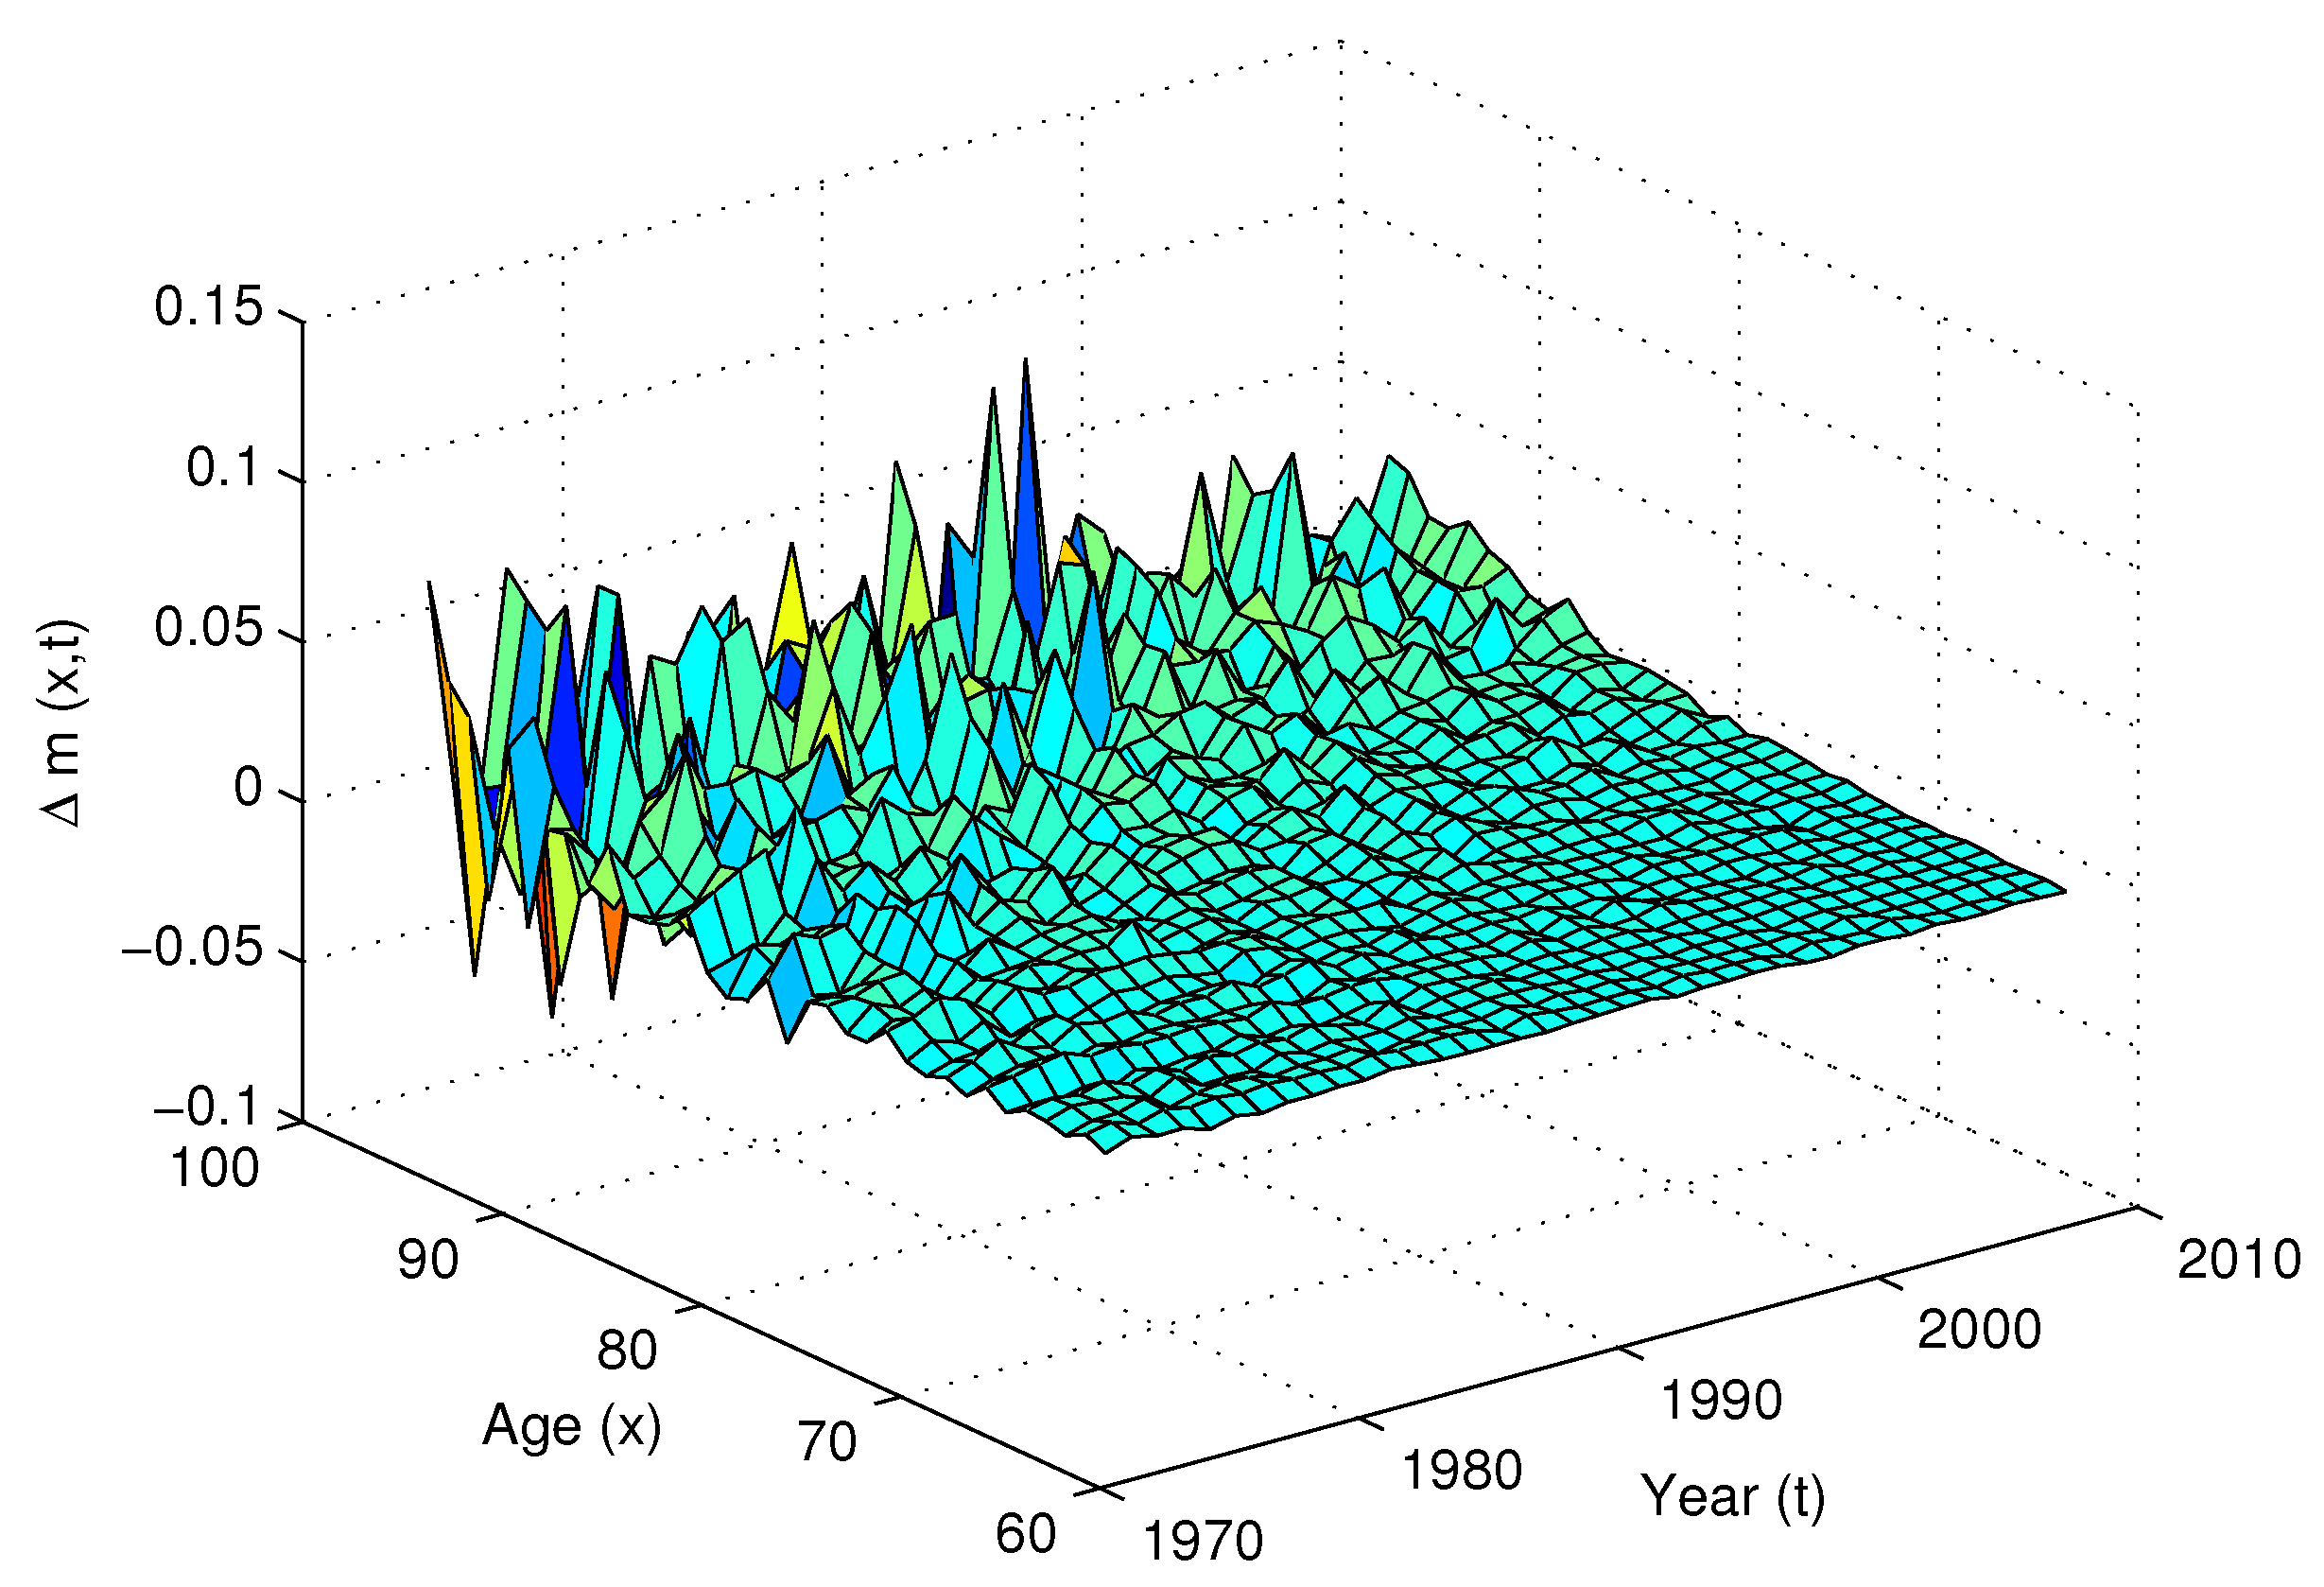
Figure 3.
Percentiles of the simulated intensity processes and for Australian males aged 65 (upper left panel) and 75 (upper right panel) in 2008, with their corresponding survival probabilities (the mean and the confidence bands) for a 65 years old (lower left panel) and 75 years old (lower right panel).
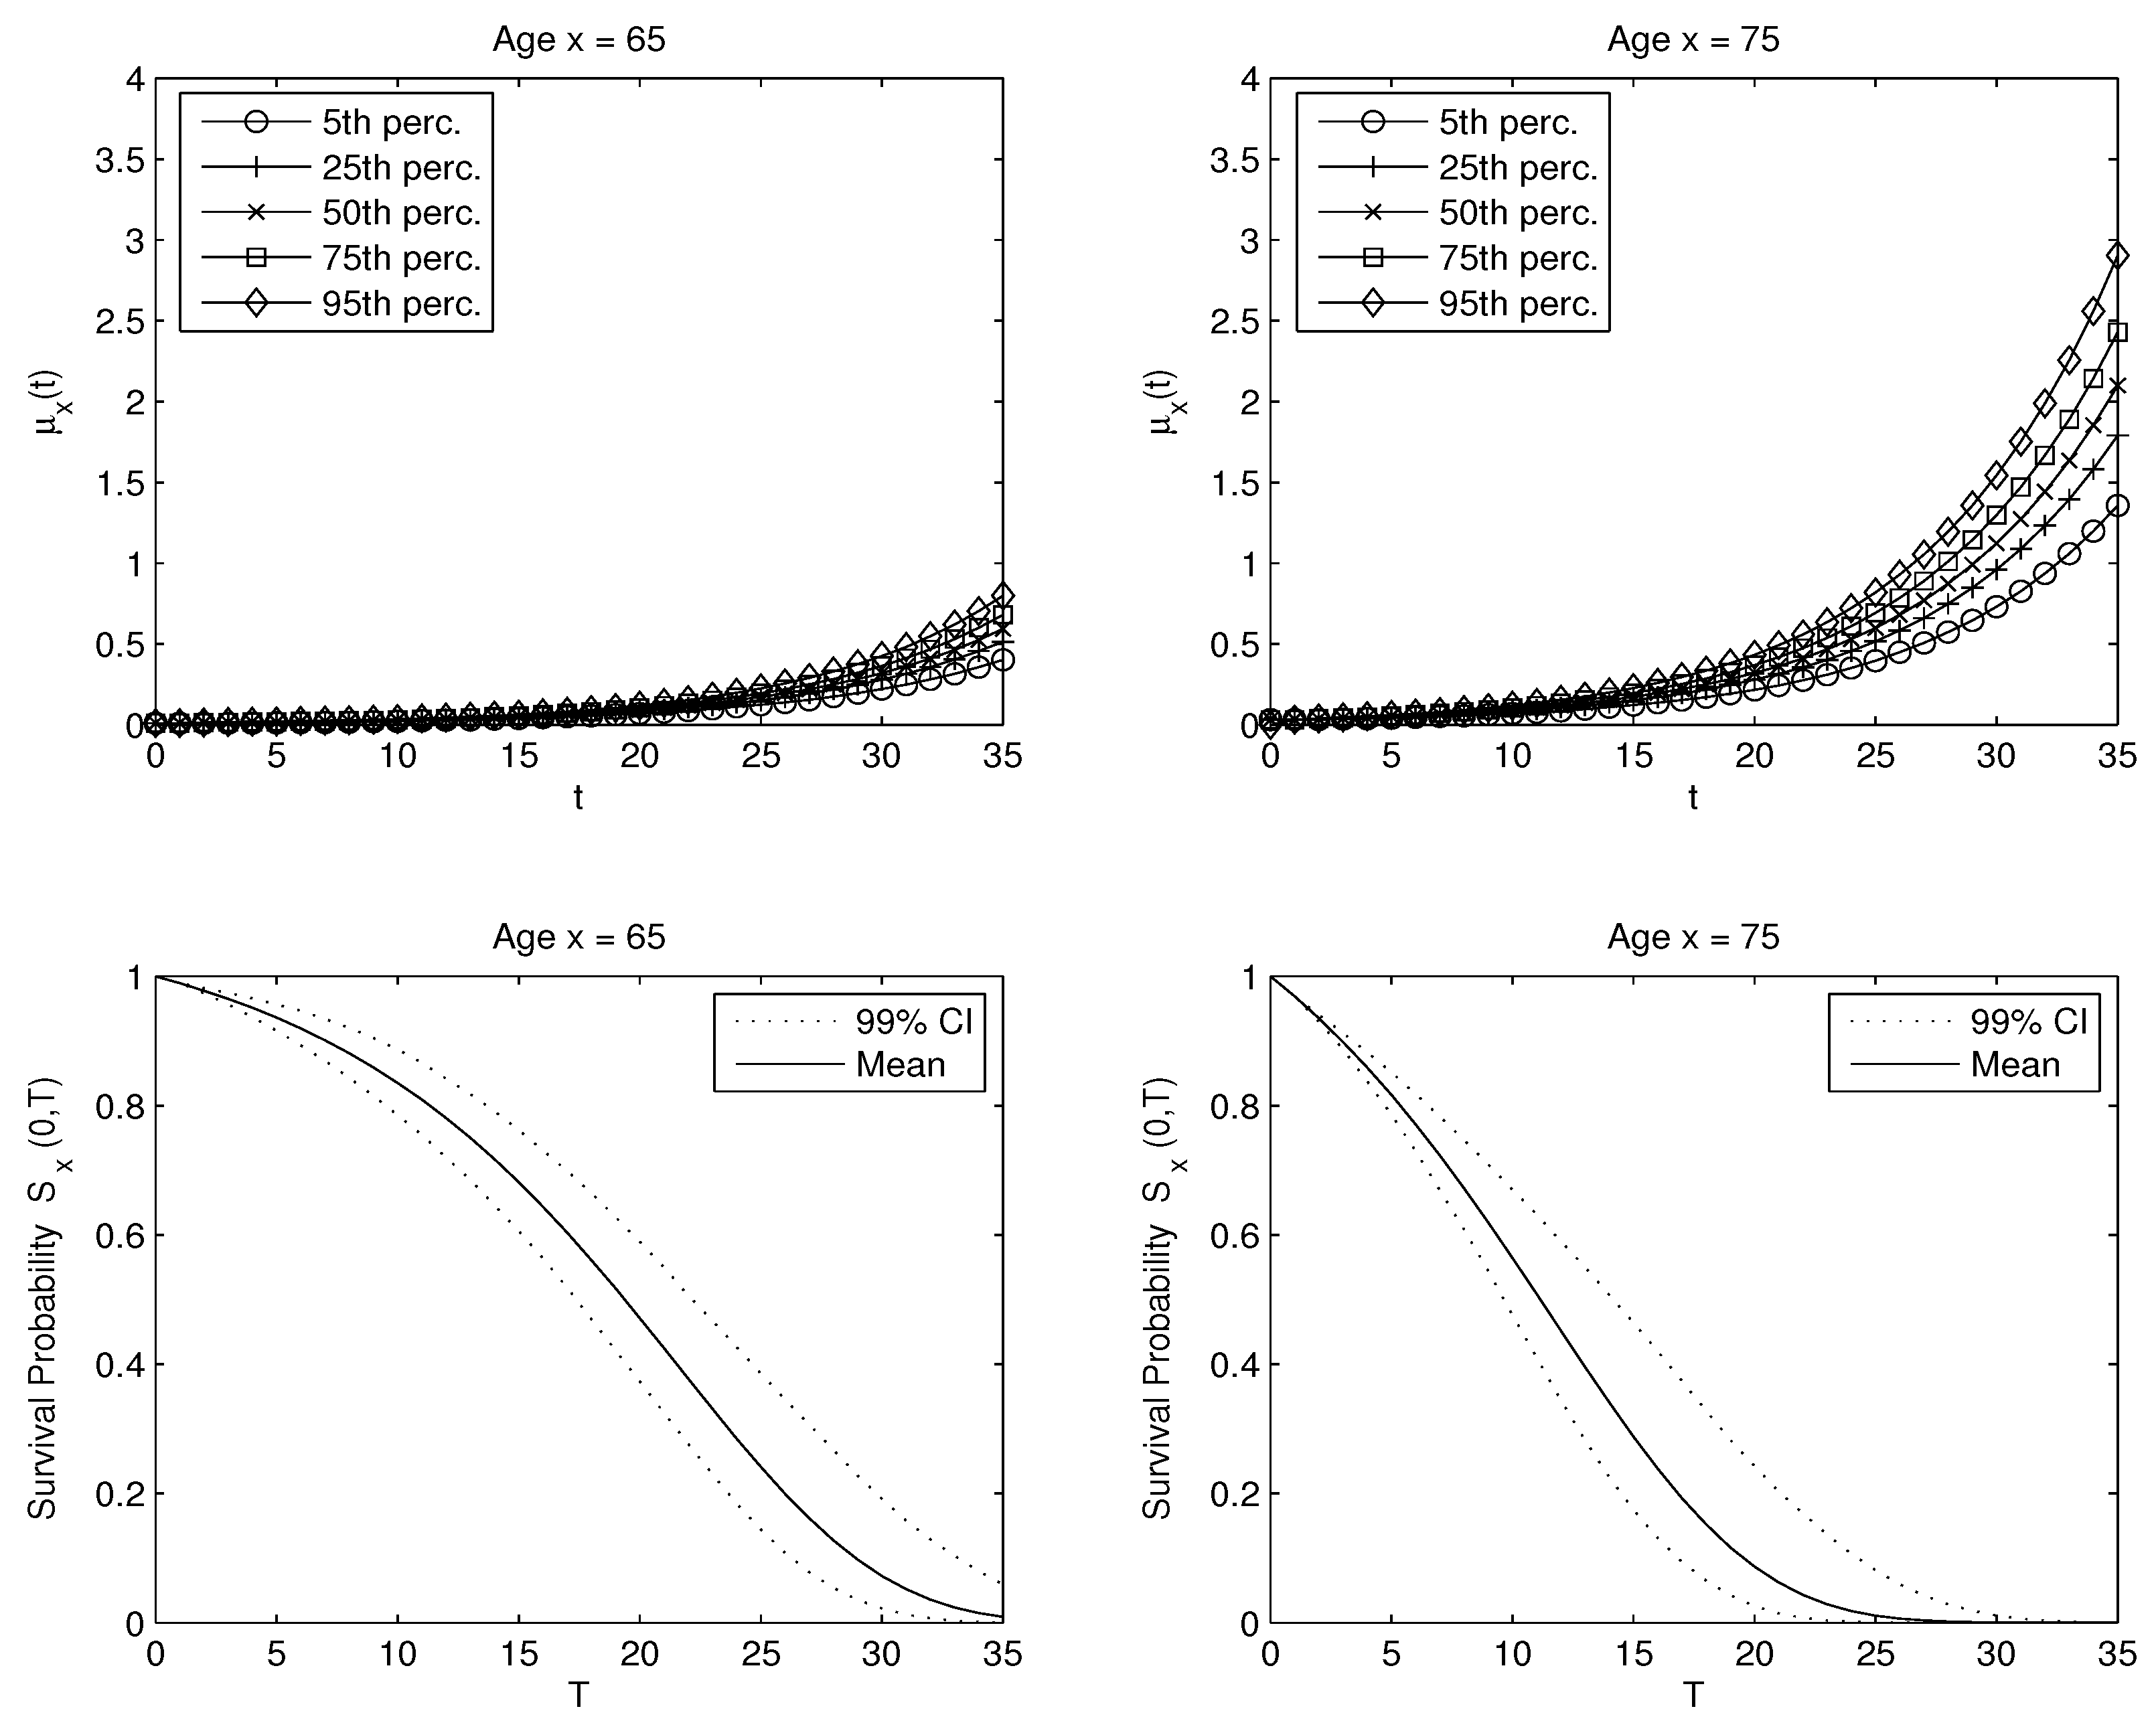
Figure 4.
Risk-adjusted survival probability with respect to different longevity risk premiums .
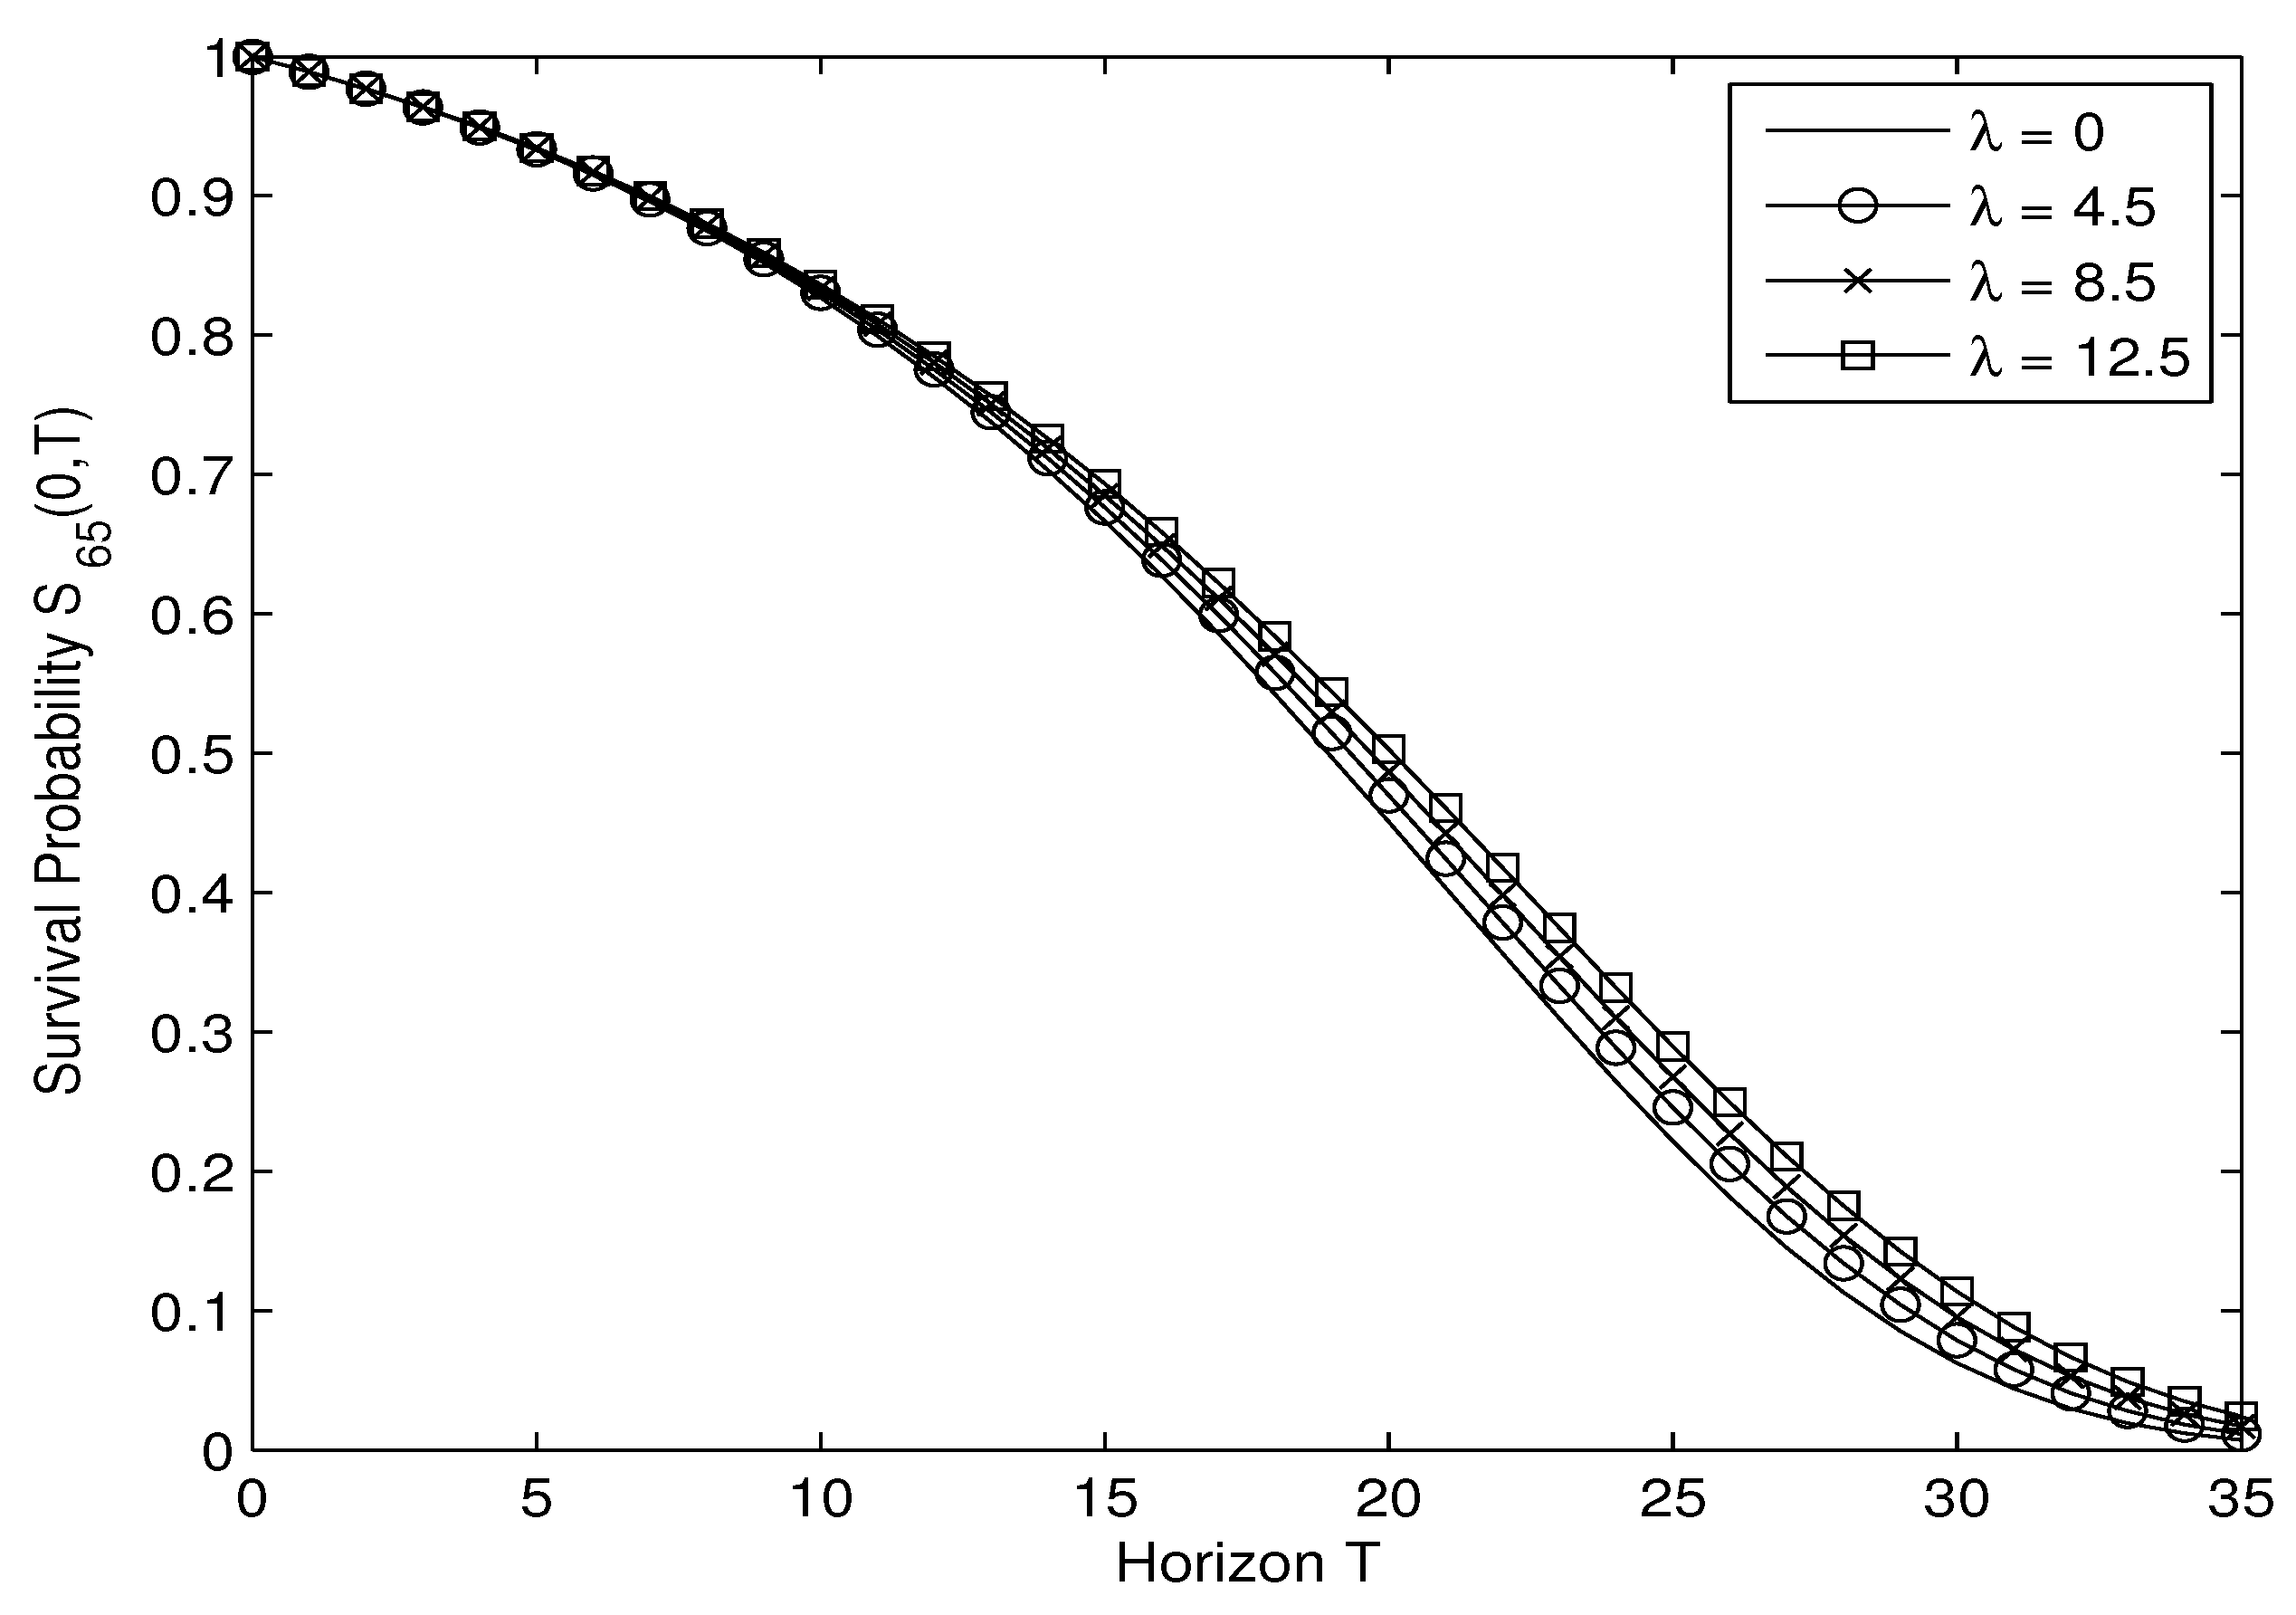
Figure 5.
Caplet price as a function of (left panel) T and K and (right panel) where and .
Figure 6.
Discounted surplus distribution per policy without longevity risk with different portfolio size (n).
Figure 6.
Discounted surplus distribution per policy without longevity risk with different portfolio size (n).
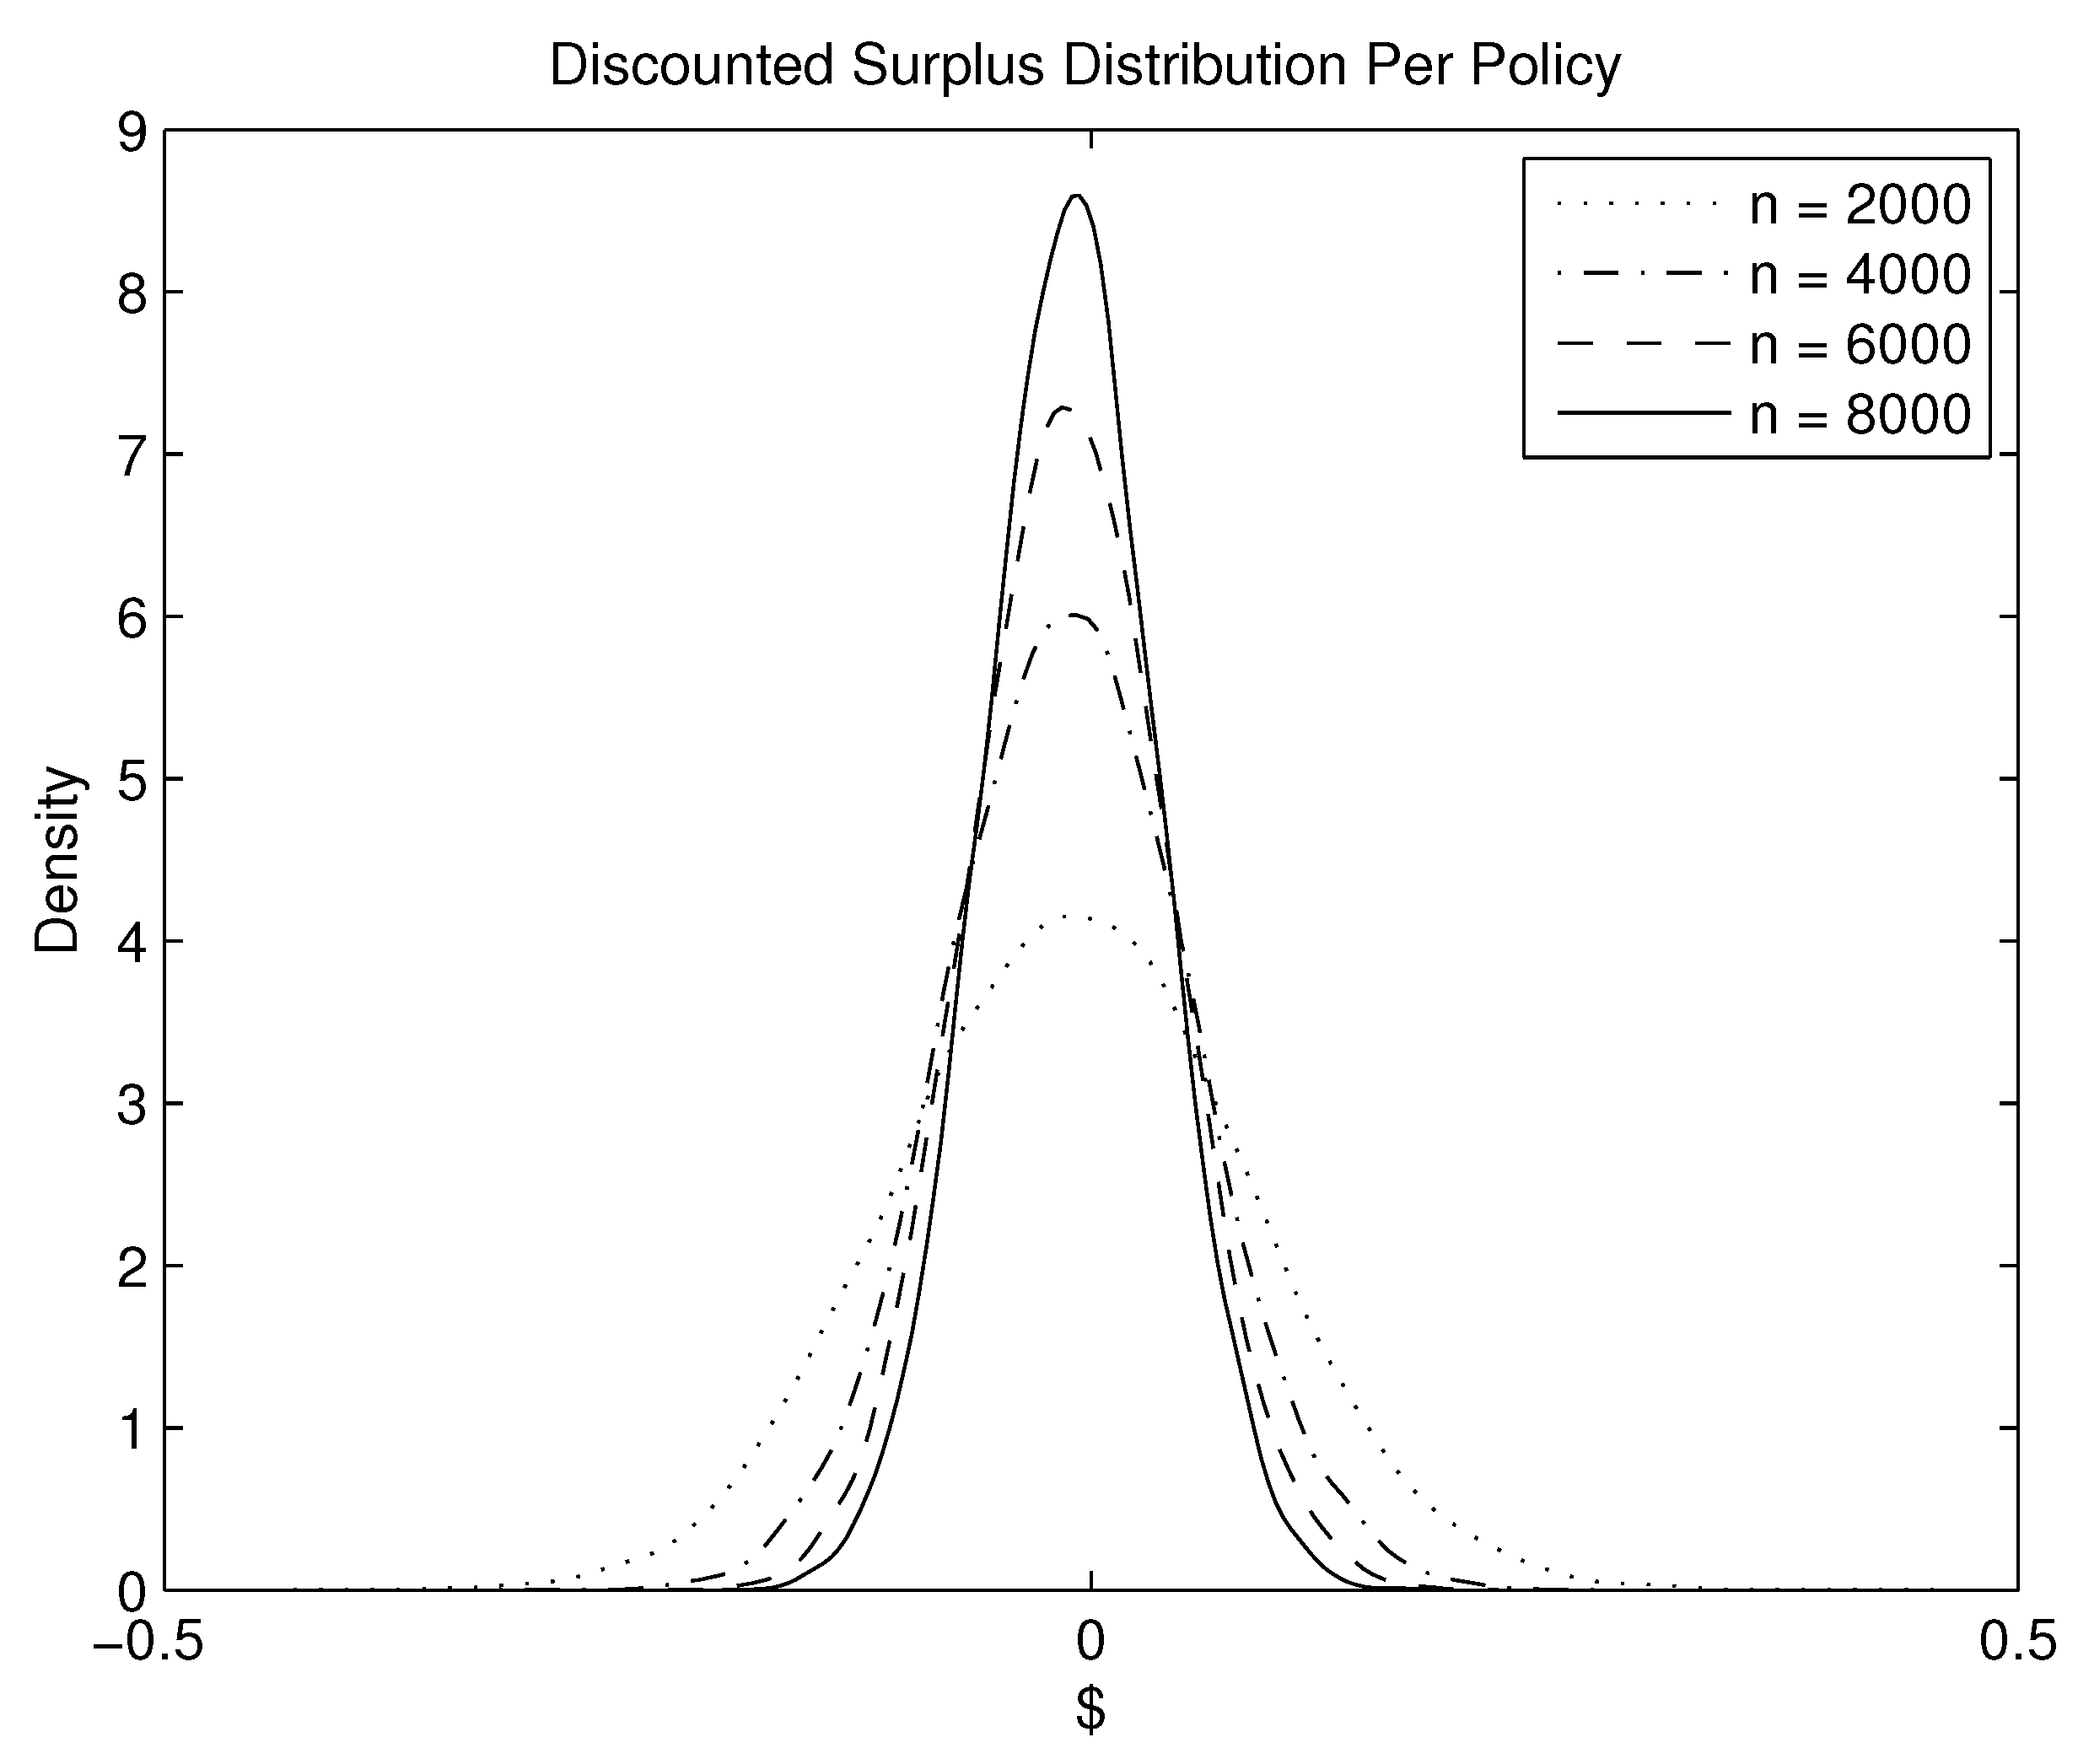
Figure 7.
Effect of the longevity risk premium on the discounted surplus distribution per policy.
Figure 8.
Effect of the term to maturity of the hedging instruments on the discounted surplus distribution per policy.
Figure 8.
Effect of the term to maturity of the hedging instruments on the discounted surplus distribution per policy.
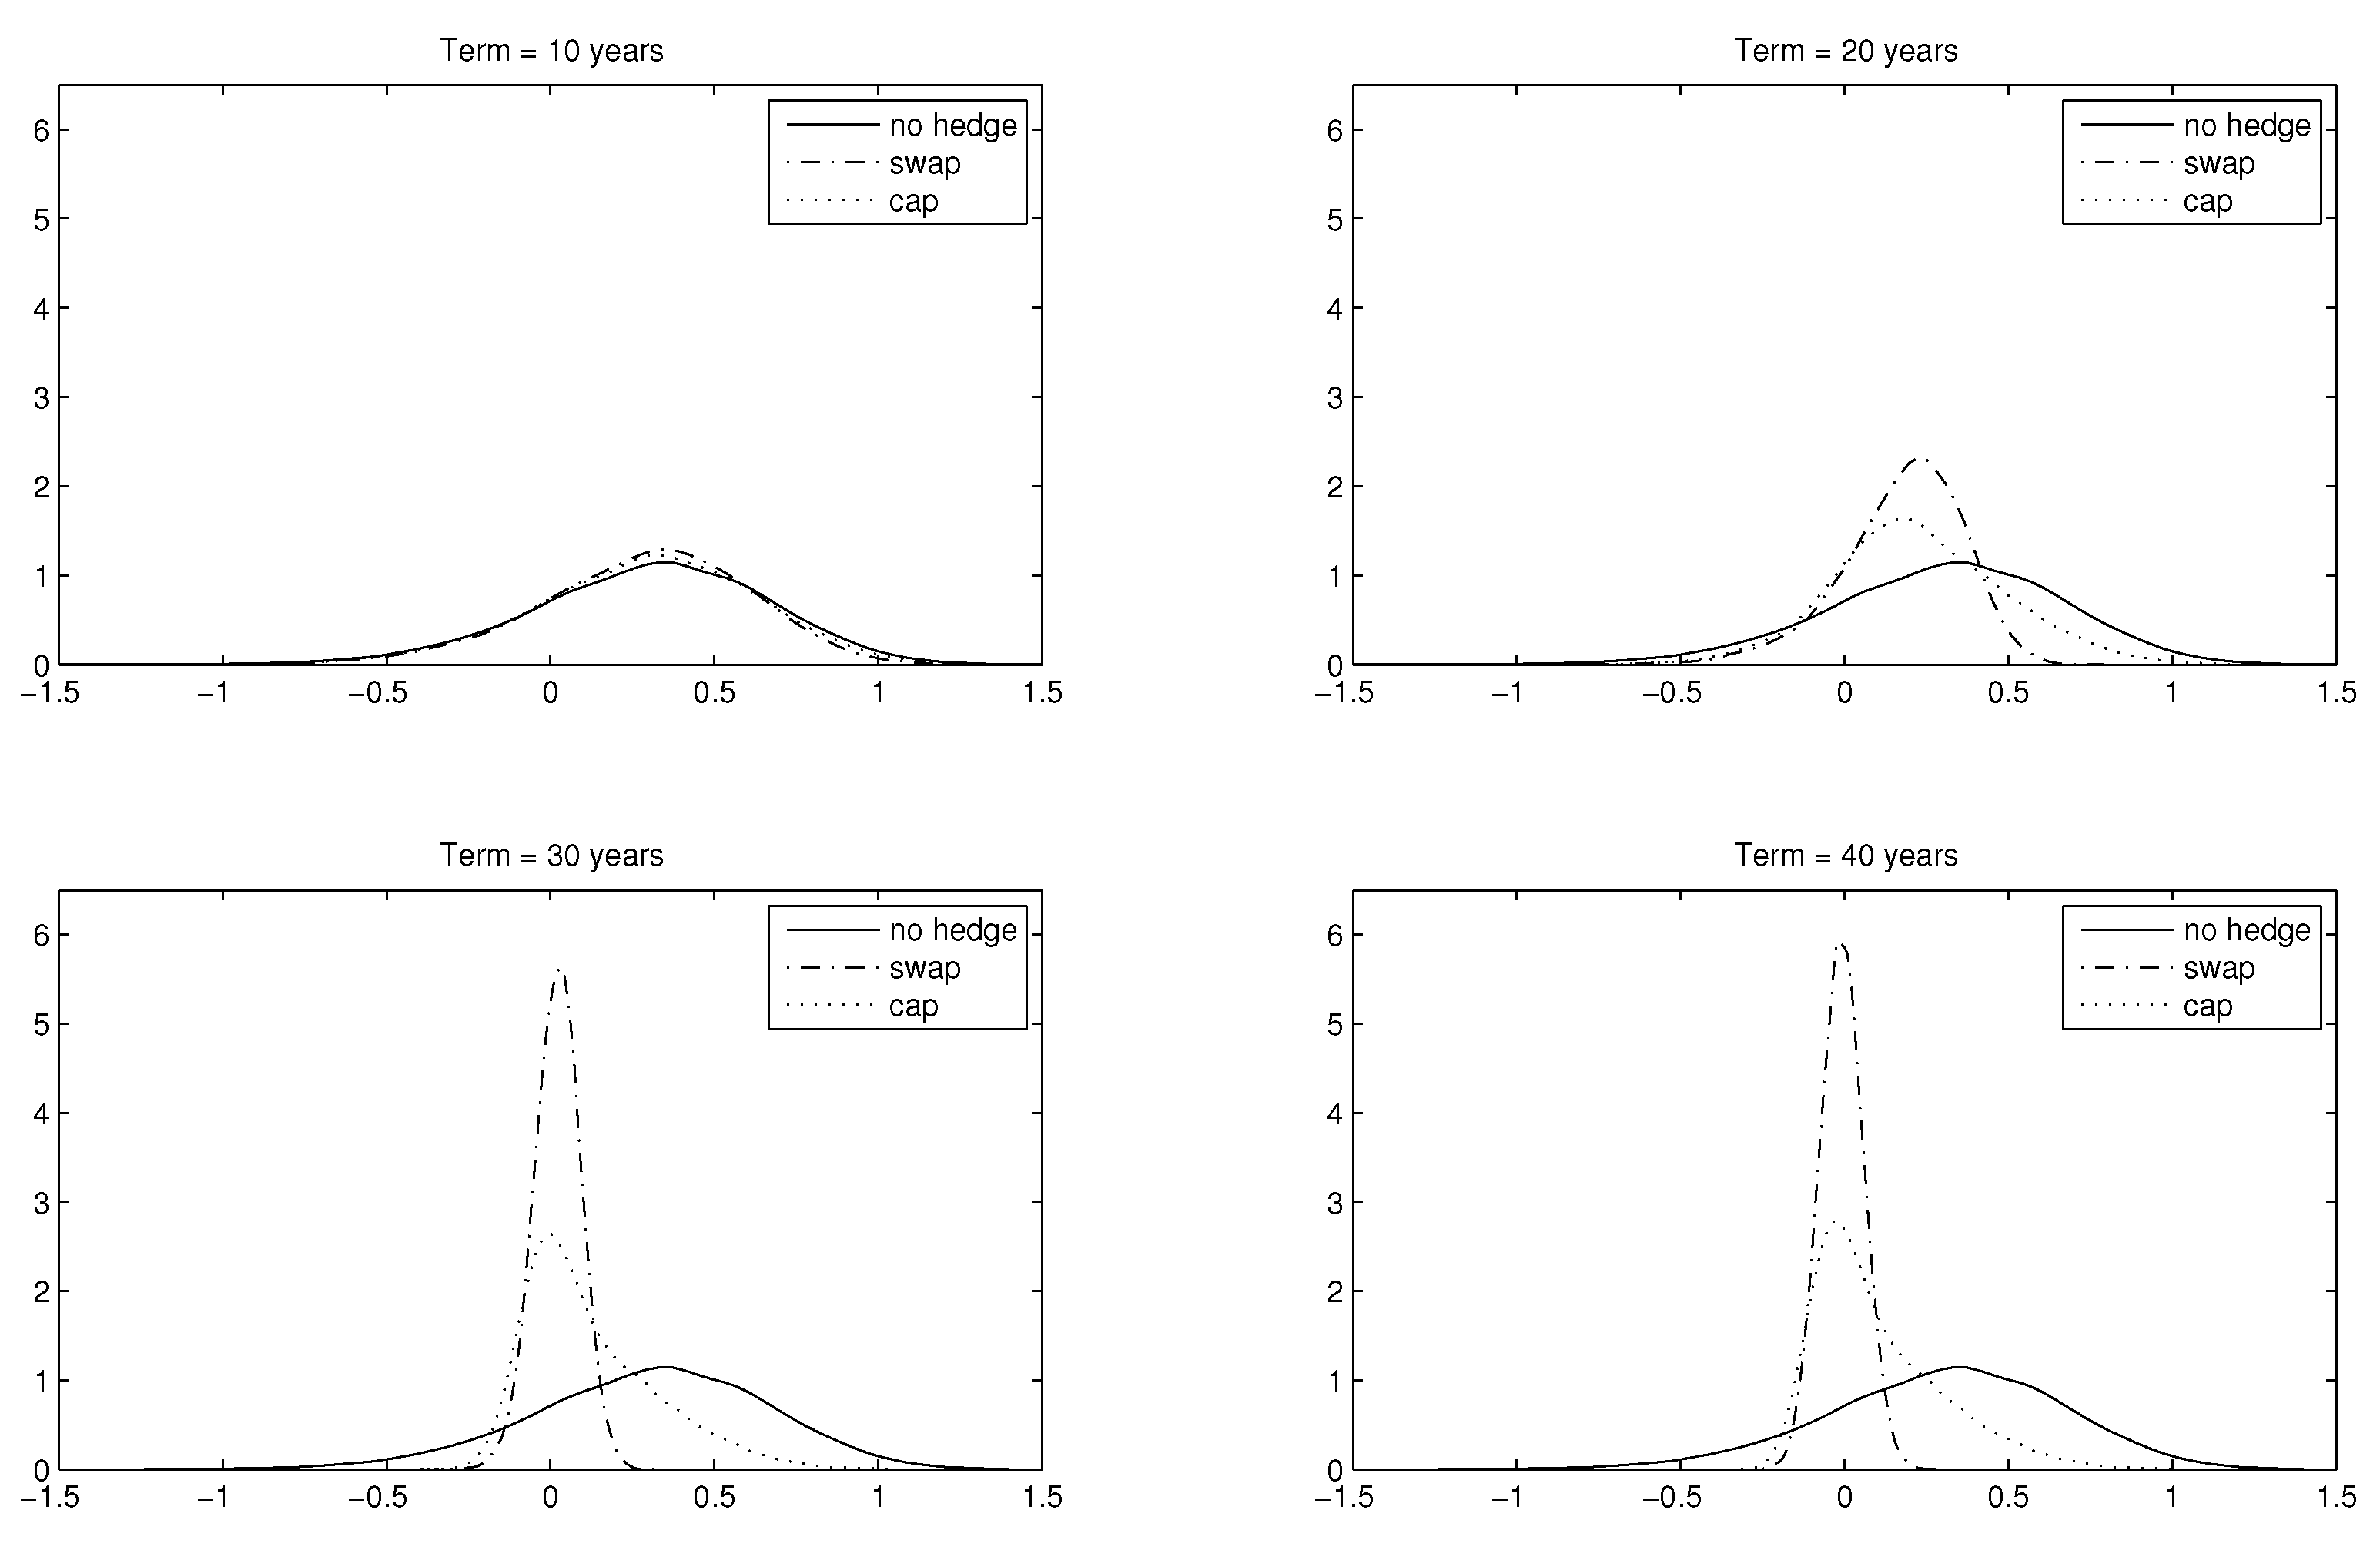
Figure 9.
Effect of the portfolio size n on the discounted surplus distribution per policy.

Table 1.
Estimated model parameters.
| Parameters | |||||
| Values | 0.0022465 | 0.0000002 | 0.129832 | −0.795875 | 0.0017508 |
| Parameters | |||||
| Values | 0.0000615 | 0.120931 | 0.0021277 | 0.0084923 | 0.0294695 |
Table 2.
Parameters for the base case.
| Parameters | (Years) | n | |
| Values | 8.5 | 30 | 4000 |
Table 3.
Hedging features of a longevity swap and cap w.r.t. longevity risk premium .
| Mean | Std. dev. | Skewness | VaR | ES | |
|---|---|---|---|---|---|
| No hedge | −0.0059 | 0.3614 | −0.3553 | −0.9385 | −1.1185 |
| Swap-hedged | −0.0086 | 0.0718 | −0.3704 | −0.1870 | −0.2277 |
| Cap-hedged | −0.0067 | 0.2031 | 0.9864 | −0.3200 | −0.3584 |
| No hedge | 0.1536 | 0.3614 | −0.3552 | −0.7795 | −0.9588 |
| Swap-hedged | 0.0051 | 0.0718 | −0.3721 | −0.1730 | −0.2140 |
| Cap-hedged | 0.0701 | 0.2031 | 0.9867 | −0.2435 | −0.2815 |
| No hedge | 0.2995 | 0.3614 | −0.3553 | −0.6335 | −0.8131 |
| Swap-hedged | 0.0207 | 0.0718 | −0.3699 | −0.1575 | −0.1984 |
| Cap-hedged | 0.1224 | 0.2031 | 0.9864 | −0.1910 | −0.2293 |
| No hedge | 0.4492 | 0.3614 | −0.3553 | −0.4835 | −0.6633 |
| Swap-hedged | 0.0401 | 0.0718 | −0.3697 | −0.1380 | −0.1790 |
| Cap-hedged | 0.1637 | 0.2031 | 0.9863 | −0.1500 | −0.1879 |
Table 4.
Hedging features of a longevity swap and cap w.r.t. term to maturity .
| Mean | Std. Dev. | Skewness | VaR | ES | |
|---|---|---|---|---|---|
| Years | |||||
| No hedge | 0.2995 | 0.3614 | −0.3553 | −0.6335 | −0.8131 |
| Swap-hedged | 0.2835 | 0.3262 | −0.4693 | −0.5840 | −0.7608 |
| Cap-hedged | 0.2907 | 0.3427 | −0.3517 | −0.5960 | −0.7717 |
| Years | |||||
| No hedge | 0.2995 | 0.3614 | −0.3553 | −0.6335 | −0.8131 |
| Swap-hedged | 0.1745 | 0.1908 | −0.8593 | −0.3755 | −0.5159 |
| Cap-hedged | 0.2247 | 0.2679 | 0.0864 | −0.4050 | −0.5399 |
| Years | |||||
| No hedge | 0.2995 | 0.3614 | −0.3553 | −0.6335 | −0.8131 |
| Swap-hedged | 0.0207 | 0.0718 | −0.3699 | −0.1575 | −0.1984 |
| Cap-hedged | 0.1224 | 0.2031 | 0.9864 | −0.1910 | −0.2293 |
| Years | |||||
| No hedge | 0.2995 | 0.3614 | −0.3553 | −0.6335 | −0.8131 |
| Swap-hedged | −0.0086 | 0.0667 | 0.0384 | −0.1605 | −0.1850 |
| Cap-hedged | 0.1005 | 0.1972 | 1.0637 | −0.1890 | −0.2151 |
Table 5.
Hedging features of a longevity swap and cap w.r.t. different portfolio size (n).
| Mean | Std.dev. | Skewness | VaR | ES | |
|---|---|---|---|---|---|
| No hedge | 0.2993 | 0.3679 | −0.3357 | −0.6530 | −0.8277 |
| Swap-hedged | 0.0206 | 0.0980 | −0.1243 | −0.2100 | −0.2596 |
| Cap-hedged | 0.1222 | 0.2141 | 0.8556 | −0.2395 | −0.2870 |
| No hedge | 0.2995 | 0.3614 | −0.3553 | −0.6335 | −0.8131 |
| Swap-hedged | 0.0207 | 0.0718 | −0.3699 | −0.1575 | −0.1984 |
| Cap-hedged | 0.1224 | 0.2031 | 0.9864 | −0.1910 | −0.2293 |
| No hedge | 0.2991 | 0.3598 | −0.3615 | −0.6435 | −0.8147 |
| Swap-hedged | 0.0204 | 0.0604 | −0.6155 | −0.1340 | −0.1762 |
| Cap-hedged | 0.1220 | 0.1999 | 1.0432 | −0.1690 | −0.2116 |
| No hedge | 0.2987 | 0.3592 | −0.3627 | −0.6395 | −0.8180 |
| Swap-hedged | 0.0200 | 0.0542 | −0.7624 | −0.1210 | −0.1644 |
| Cap-hedged | 0.1216 | 0.1984 | 1.0702 | −0.1630 | −0.2016 |
Table 6.
Longevity risk reduction R of a longevity swap and cap w.r.t. different portfolio size (n).
Table 6.
Longevity risk reduction R of a longevity swap and cap w.r.t. different portfolio size (n).
| n | 2000 | 4000 | 6000 | 8000 |
© 2019 by the authors. Licensee MDPI, Basel, Switzerland. This article is an open access article distributed under the terms and conditions of the Creative Commons Attribution (CC BY) license (http://creativecommons.org/licenses/by/4.0/).
Share and Cite
MDPI and ACS Style
Fung, M.C.; Ignatieva, K.; Sherris, M. Managing Systematic Mortality Risk in Life Annuities: An Application of Longevity Derivatives. Risks 2019, 7, 2. https://doi.org/10.3390/risks7010002
AMA Style
Fung MC, Ignatieva K, Sherris M. Managing Systematic Mortality Risk in Life Annuities: An Application of Longevity Derivatives. Risks. 2019; 7(1):2. https://doi.org/10.3390/risks7010002
Chicago/Turabian StyleFung, Man Chung, Katja Ignatieva, and Michael Sherris. 2019. "Managing Systematic Mortality Risk in Life Annuities: An Application of Longevity Derivatives" Risks 7, no. 1: 2. https://doi.org/10.3390/risks7010002
Note that from the first issue of 2016, this journal uses article numbers instead of page numbers. See further details here.