
Supervising System Stress in Multiple Markets

Abstract
:
1. Introduction
2. Financial Stress Measure for System Supervision
2.1. Index Concept and Measurement Criteria
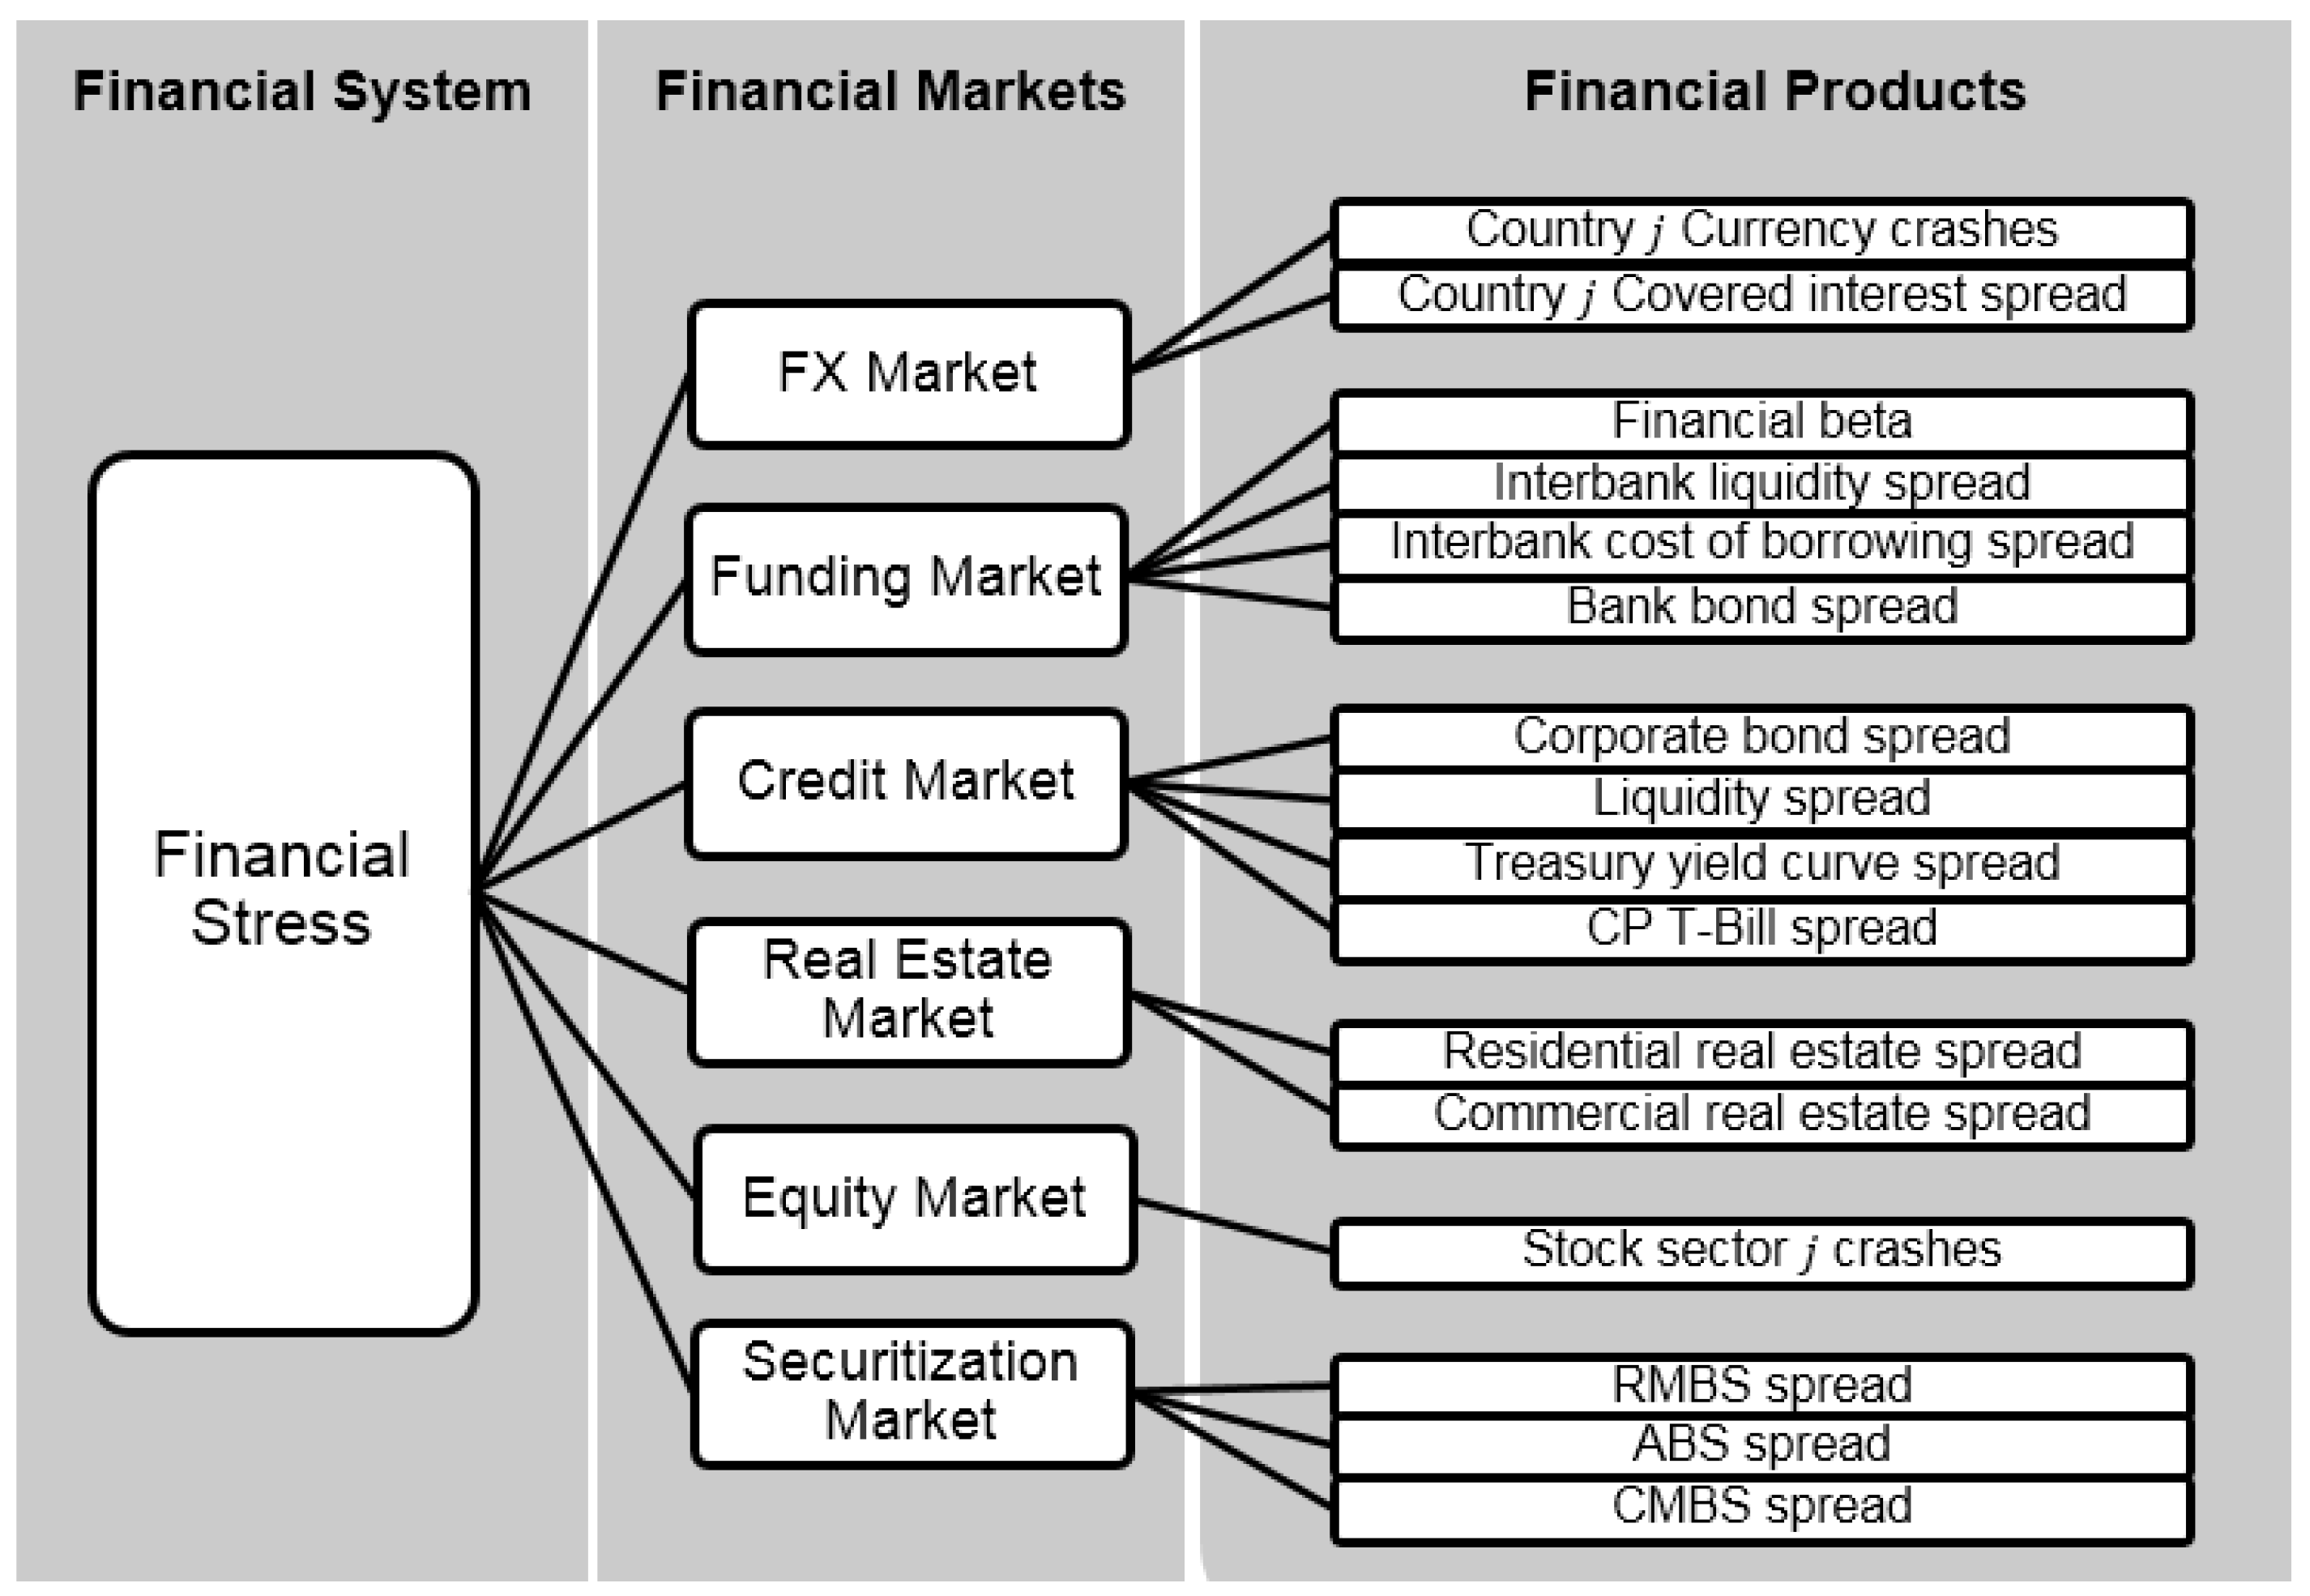
2.2. Variable Selection and Data

| Financial Market | Financial Product | Calculation | Indicator Notes | Weight Notes |
|---|---|---|---|---|
| Funding Market | Financial Beta (FB) | Rolling one year covariance between banking sector share prices (SPTRFINLB) and the S&P 500 (SPXT B) | ||
| Bank Bond Spread (BBS) | Spread between the 10 year A rated bank bond yields (C07010Y B) and the 10 year treasury constant maturity yields (H15T10Y B) | |||
| Interbank Liquidity Spread (ILS) | Spread between 3 month LIBOR (US0003M B) and 3 month treasury bill secondary market rate (TBSM3M B) | |||
| Interbank Cost of Borrowing Spread (ICOB) | Spread between the 3 month LIBOR (US0003M B) and the federal funds target rate (FDTR B) | |||
| Credit Market | Corporate Bond Spread (CBS) | Spread between the 10 year Moody’s Aaa rated corporate bond yield (MOODCAAAB) and the 10 year treasury yield (H15T10Y B) | ||
| Commercial Paper T-Bill Spread (CPTBS) | Spread between 90 day financial commercial paper rate (H15F090D B) and 3 month treasury bill secondary market rate (TBSM3M B) | |||
| Liquidity Spread (LS) | Thirty trading day moving average of the relative bid-ask price spread on 3 month Eurodollar deposits (ECUSD3MD) | |||
| Treasury Yield Curve Spread (TYCS) | Thirty trading day moving average of the difference between 3 month treasury bill secondary market rate (TBSM3M B) on a bond equivalent basis with 10 year treasury constant maturity yields (H15T10Y B) | |||
| Equity Market | Stock Market Crashes (SMC) | This is calculated for each of the ten subsectors of the S&P500 including consumer staples (S5CONSB), consumer durables (S5COND B), energy (S5ENRSB), financials (S5FINL B), health care (S5HLTHB), industrials (S5INDUB), information technology (S5INFTB), materials (S5MATRB), utilities (S5UTILB), and telecommunications (S5TELSB). | are set as the market capitalizations for consumer staples (S5CONSB), consumer durables (S5CONDB), energy (S5ENRSB), financials (S5FINLB), health care (S5HLTHB), industrials (S5INDUB), information technology (S5INFTB), materials (S5MATRB), utilities (S5UTILB), and telecommunications (S5TELSB). . | |
| Real Estate Market | Commercial Real Estate Spread (CRE) | Spread between realized annual return over the past 3 years based on a commercial property index (USNPIRN_RD) and the 3 year treasury note yield (FRTCM3YD) covering that period. | . where . | |
| Residential Real Estate Spread (RRE) | Spread between realized annual return over the past 3 years based on a residential property index (WIREI G) and the 3 year treasury note yield (FRTCM3YD) covering that period. | |||
| Securitization Market | ABS Spread (ABS) | Spread between the asset backed bond yield (SYCAABH) and the yield on a 5 year treasury note (H15T5Y B) | The volumes within securitization are taken from SIFMA5. is the value of all U.S. asset backed securities outstanding from the “US ABS Issuance and Outstanding” file. | |
| Commercial MBS Spread (CMBS) | Spread between the commercial mortgage backed securities yield (LHCRINGD, and LHIGCMBD) and a 10 year treasury (FRTCM10D). | |||
| Residential MBS Spread (RMBS) | Spread between the yield on agency residential mortgage backed securities (LHGNM30 B) and the yield of a 7 year treasury note (FRTCM7YD) | and are the values of all U.S. mortgage-related securities outstanding from the “US Mortgage-Related Issuance and Outstanding” file (“US Agency MBS Outstanding” and “NonAgency Outstanding” worksheets). . | ||
| Foreign Exchange Market | Currency Crashes (CC) | We let S be the exchange rate between the U.S. dollar and a foreign currency. The exchange rate is quoted such that it measures the price of one foreign currency in USD. This calculation is performed for: Australia (AUDUSD B), Canada (CADUSD B), the European Union (EURUSD B), Great Britain (GBPUSD B), Japan (JPYUSD B), Mexico (MXNUSD B) & South Africa (ZARUSD B). | where . | |
| Covered Interest Spreads (CIS) | F is the 90 day forward USD-foreign currency exchange rate (AUD3M B, CAD3M B, EUR3M B, GBP3M B, JPY3M B, MXN3M B, ZAR3M B), S is the spot USD-foreign currency exchange rate (same data as used above), r is the 90 day U.S. treasury bill rate (ITUSA3D G), r* is the 90 day foreign treasury rate (ITAUD3D G, ITCAD3D G, ITEUR3D G, ITGBR3D G, ITJPN3D G, ITMXN3D G, ITZAF3D G). |
2.3. Variable Transformation and Aggregation


2.4. Evaluation
| Name | TP | FP | TN | FN | T1 | T2 | IV | NTSR | μ | |||
|---|---|---|---|---|---|---|---|---|---|---|---|---|
| Panel 1: Comparison of value when maximizing | ||||||||||||
| 1 | Base four-market FSI and real estate market | 1.13 | 651 | 92 | 4057 | 1034 | 0.61 | 0.02 | 0.5 | 0.06 | 0.7 | 0.36 |
| 2 | Base four-market FSI | 1.46 | 439 | 82 | 4067 | 1246 | 0.74 | 0.02 | 0.5 | 0.08 | 0.7 | 0.24 |
| 3 | Base four-market FSI and securitization market | 1.43 | 432 | 77 | 4072 | 1253 | 0.74 | 0.02 | 0.51 | 0.07 | 0.7 | 0.24 |
| 4 | Full six-market FSI (CFSI) | 1.15 | 610 | 91 | 4058 | 1075 | 0.64 | 0.02 | 0.5 | 0.06 | 0.7 | 0.34 |
| Panel 2: Comparison of value when maximizing | ||||||||||||
| 1 | Base four-market FSI and real estate market | 0.68 | 992 | 346 | 3803 | 693 | 0.41 | 0.08 | 0.4 | 0.14 | 0.7 | 0.5 |
| 2 | Full six-market FSI (CFSI) | 0.52 | 1083 | 696 | 3453 | 602 | 0.36 | 0.17 | 0.58 | 0.26 | 0.7 | 0.47 |
| 3 | Base four-market FSI | 0.58 | 976 | 501 | 3648 | 709 | 0.42 | 0.12 | 0.33 | 0.21 | 0.7 | 0.45 |
| 4 | Base four-market FSI and securitization market | 0.64 | 917 | 467 | 3682 | 768 | 0.46 | 0.11 | 0.39 | 0.21 | 0.7 | 0.43 |
| Name | TP | FP | TN | FN | T1 | T2 | IV | NTSR | μ | |||
|---|---|---|---|---|---|---|---|---|---|---|---|---|
| 1 | Full six-market FSI (CFSI) | 0.61 | 12 | 4 | 34 | 4 | 0.25 | 0.11 | 0.34 | 0.14 | 0.7 | 0.64 |
| 2 | CFSI Securitization Market | 0.73 | 12 | 4 | 34 | 4 | 0.25 | 0.11 | 0.54 | 0.14 | 0.7 | 0.64 |
| 3 | CFSI Real Estate Market | 0.94 | 9 | 2 | 36 | 7 | 0.44 | 0.05 | NA | 0.09 | 0.7 | 0.51 |
| 4 | CFSI Equity Market | 0.65 | 11 | 7 | 31 | 5 | 0.31 | 0.18 | 0.46 | 0.27 | 0.7 | 0.50 |
| 5 | CFNAI: Personal Consumption and Housing | 1.06 | 9 | 4 | 34 | 7 | 0.44 | 0.11 | 0.04 | 0.19 | 0.7 | 0.46 |
| 6 | CFSI Credit Market | 1.05 | 7 | 3 | 35 | 9 | 0.56 | 0.08 | 0.18 | 0.18 | 0.7 | 0.36 |
| 7 | CFNAI: Diffusion Index | 0.67 | 8 | 6 | 32 | 8 | 0.5 | 0.16 | 0.23 | 0.32 | 0.7 | 0.34 |
| 8 | CFNAI: Three Month Moving Average | 0.85 | 6 | 3 | 35 | 10 | 0.63 | 0.08 | 0.38 | 0.21 | 0.7 | 0.29 |
| 9 | CFNAI: Employment, Unemployment, and Hours | 0.89 | 6 | 3 | 35 | 10 | 0.63 | 0.08 | 0.38 | 0.21 | 0.7 | 0.29 |
| 10 | Goldman Sachs Financial Conditions Index | 1.21 | 5 | 1 | 37 | 11 | 0.69 | 0.03 | 0.74 | 0.08 | 0.7 | 0.29 |
| 11 | CFSI Funding Market | 1.23 | 5 | 1 | 37 | 11 | 0.69 | 0.03 | 0.13 | 0.08 | 0.7 | 0.29 |
| 12 | St Louis Financial Stress Index | 0.64 | 6 | 3 | 35 | 10 | 0.63 | 0.08 | NA | 0.21 | 0.7 | 0.29 |
| 13 | Bloomberg’s Financial Conditions Index | 0.5 | 6 | 4 | 34 | 10 | 0.63 | 0.11 | NA | 0.28 | 0.7 | 0.27 |
| 14 | National Financial Conditions Index (NFCI) | 0.86 | 5 | 2 | 36 | 11 | 0.69 | 0.05 | 0.77 | 0.17 | 0.7 | 0.26 |
| 15 | CFNAI: Production and Income | 1.14 | 5 | 2 | 36 | 11 | 0.69 | 0.05 | 0.17 | 0.17 | 0.7 | 0.26 |
| 16 | Kansas City Financial Stress Index | 0.61 | 5 | 3 | 35 | 11 | 0.69 | 0.08 | NA | 0.25 | 0.7 | 0.23 |
| 17 | CFNAI: Sales, Orders, And Inventories | 1.48 | 4 | 1 | 37 | 12 | 0.75 | 0.03 | 0.03 | 0.11 | 0.7 | 0.22 |
| 18 | NFCI: Nonfinancial Leverage Subindex | 0.8 | 5 | 4 | 34 | 11 | 0.69 | 0.11 | 0.04 | 0.34 | 0.7 | 0.21 |
| 19 | CFSI Foreign Exchange Market | 0.55 | 6 | 10 | 28 | 10 | 0.63 | 0.26 | 0.32 | 0.7 | 0.7 | 0.11 |
| 20 | NFCI: Leverage Subindex | 2 | 0 | 0 | 38 | 16 | 1 | 0 | 0.31 | NA | 0.1 | 0 |
| Name | Maximum | Minimum | Mean | Std. Dev. | Skewness | Kurtosis | |
|---|---|---|---|---|---|---|---|
| 1 | Full six−market FSI (CFSI) | 81.70 | 31.39 | 50.28 | 13.39 | 0.69 | -0.40 |
| 2 | CFSI Securitization Market | 10.25 | 1.68 | 4.76 | 2.29 | 1.00 | 0.20 |
| 3 | CFSI Real Estate Market | 10.65 | 0.76 | 5.09 | 3.29 | 0.31 | -1.32 |
| 4 | CFSI Equity Market | 27.88 | 6.92 | 15.57 | 6.11 | 0.44 | -0.97 |
| 5 | CFNAI: Personal Consumption and Housing | −0.37 | 0.13 | −0.09 | 0.17 | −0.13 | −1.58 |
| 6 | CFSI Credit Market | 18.09 | 5.38 | 10.29 | 2.97 | 0.49 | -0.03 |
| 7 | CFNAI: Diffusion Index | −0.84 | 0.43 | −0.08 | 0.33 | −1.07 | 0.54 |
| 8 | CFNAI: Three Month Moving Average | −3.73 | 0.55 | −0.31 | 0.85 | −2.61 | 7.23 |
| 9 | CFNAI: Employment, Unemployment, and Hours | −1.55 | 0.27 | −0.14 | 0.36 | −2.14 | 5.24 |
| 10 | Goldman Sachs Financial Conditions Index | 98.88 | 102.36 | 99.89 | 0.82 | 1.36 | 1.71 |
| 11 | CFSI Funding Market | 14.49 | 3.68 | 6.71 | 2.59 | 1.62 | 2.38 |
| 12 | St Louis Financial Stress Index | −1.26 | 5.24 | −0.06 | 1.23 | 2.45 | 7.64 |
| 13 | Bloomberg’s Financial Conditions Index | −8.63 | 1.09 | −0.62 | 1.72 | −2.65 | 9.61 |
| 14 | National Financial Conditions Index (NFCI) | −0.90 | 2.70 | −0.31 | 0.70 | 2.58 | 7.75 |
| 15 | CFNAI: Production and Income | −1.17 | 0.45 | −0.03 | 0.31 | −2.12 | 4.92 |
| 16 | Kansas City Financial Stress Index | −0.91 | 5.33 | 0.18 | 1.24 | 2.62 | 7.82 |
| 17 | CFNAI: Sales, Orders, And Inventories | −0.57 | 0.15 | −0.02 | 0.14 | −2.26 | 5.61 |
| 18 | NFCI: Nonfinancial Leverage Subindex | −1.05 | 3.49 | 0.04 | 0.86 | 2.08 | 5.11 |
| 19 | CFSI Foreign Exchange Market | 11.95 | 2.82 | 7.86 | 2.11 | -0.27 | -0.17 |
| 20 | NFCI: Leverage Subindex | −1.36 | 2.70 | 0.27 | 1.37 | 0.54 | −1.09 |
3. Applications for Supervision
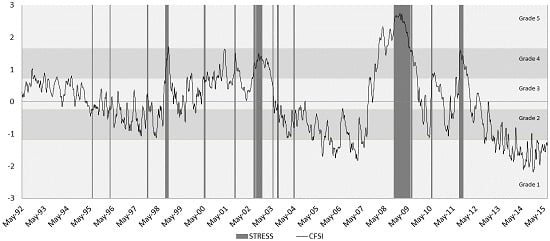
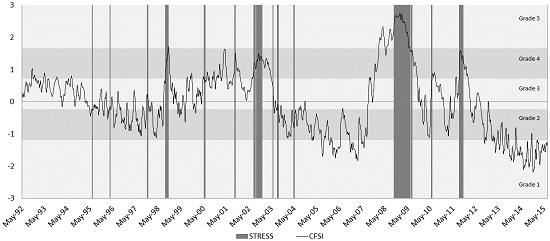
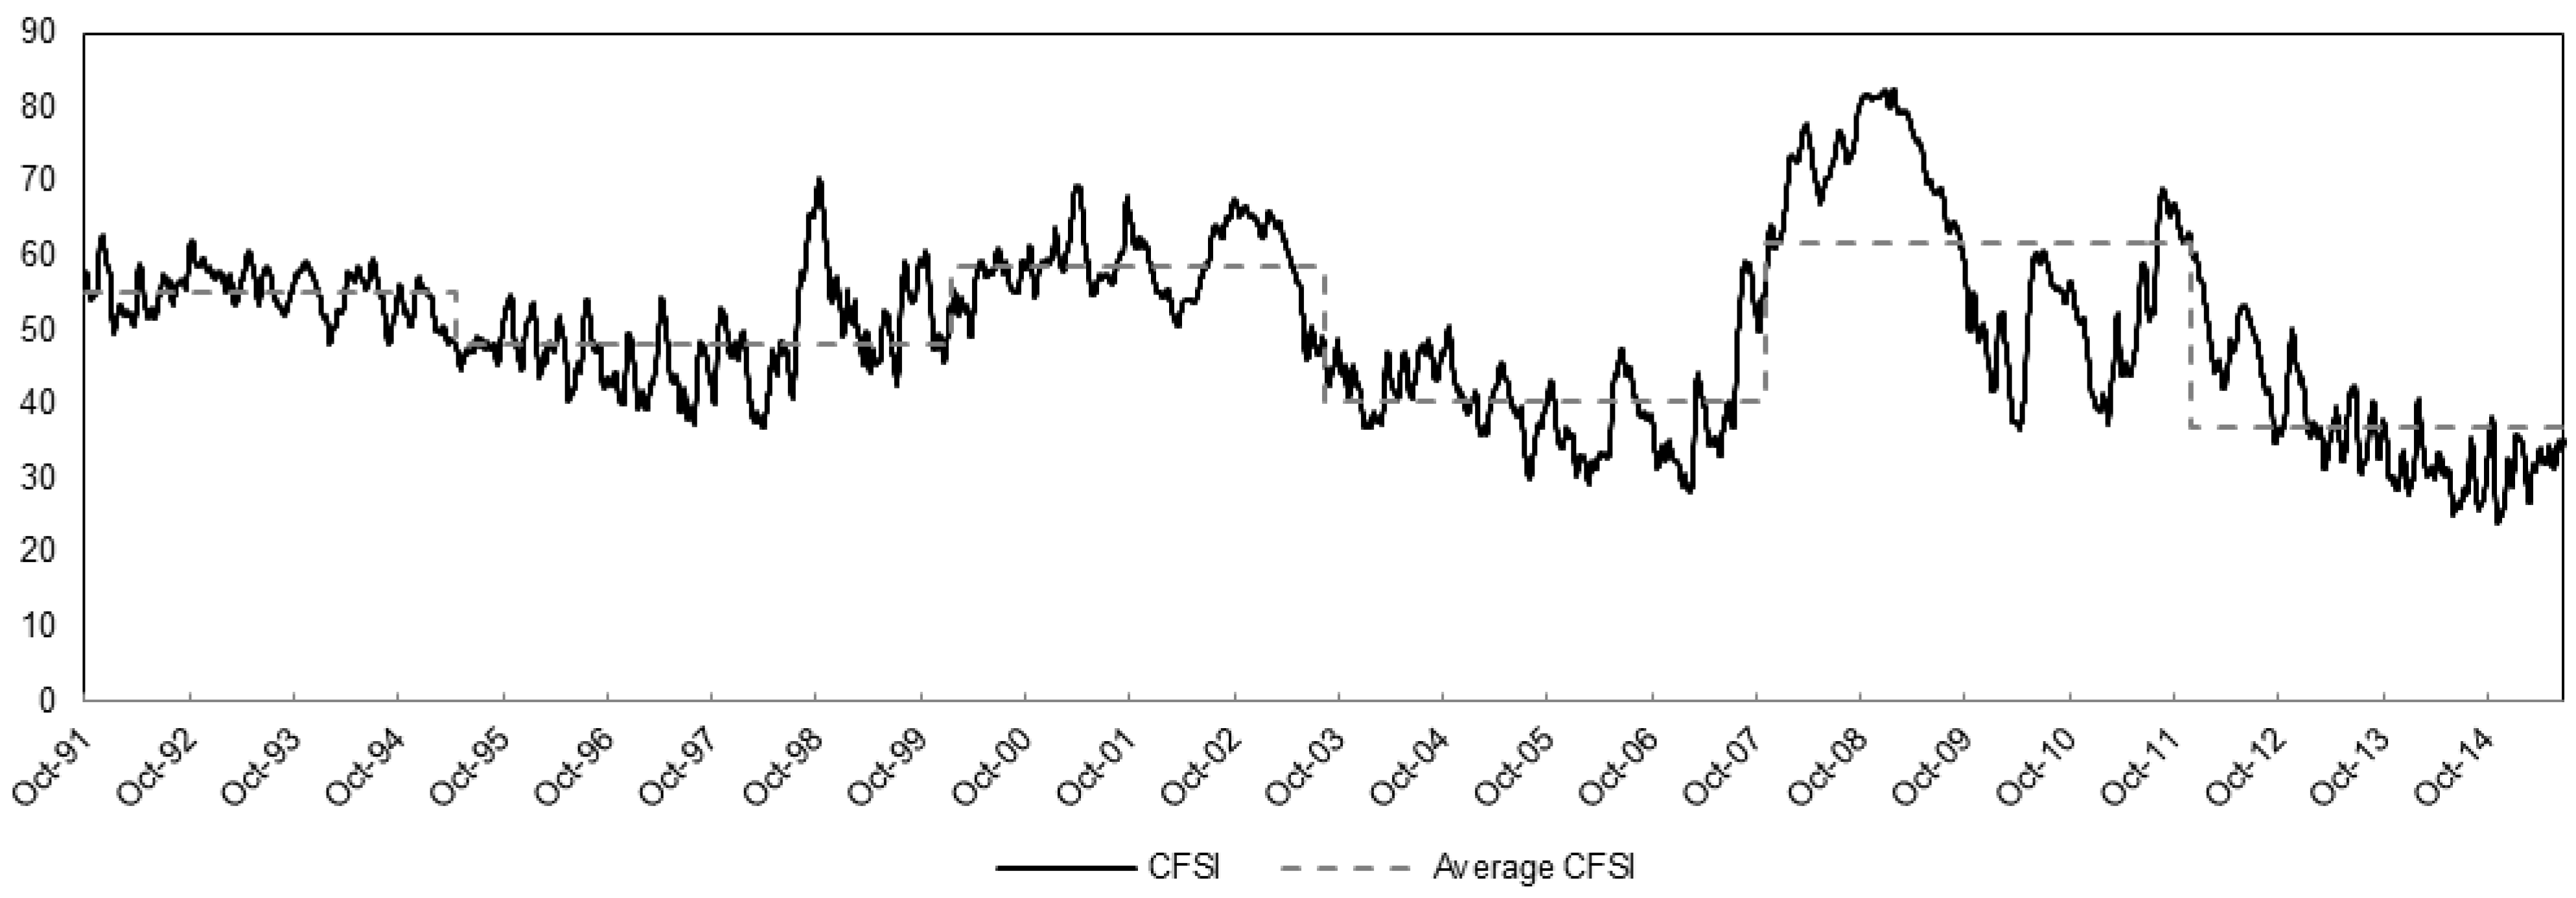
3.1. Monitoring Financial Stress
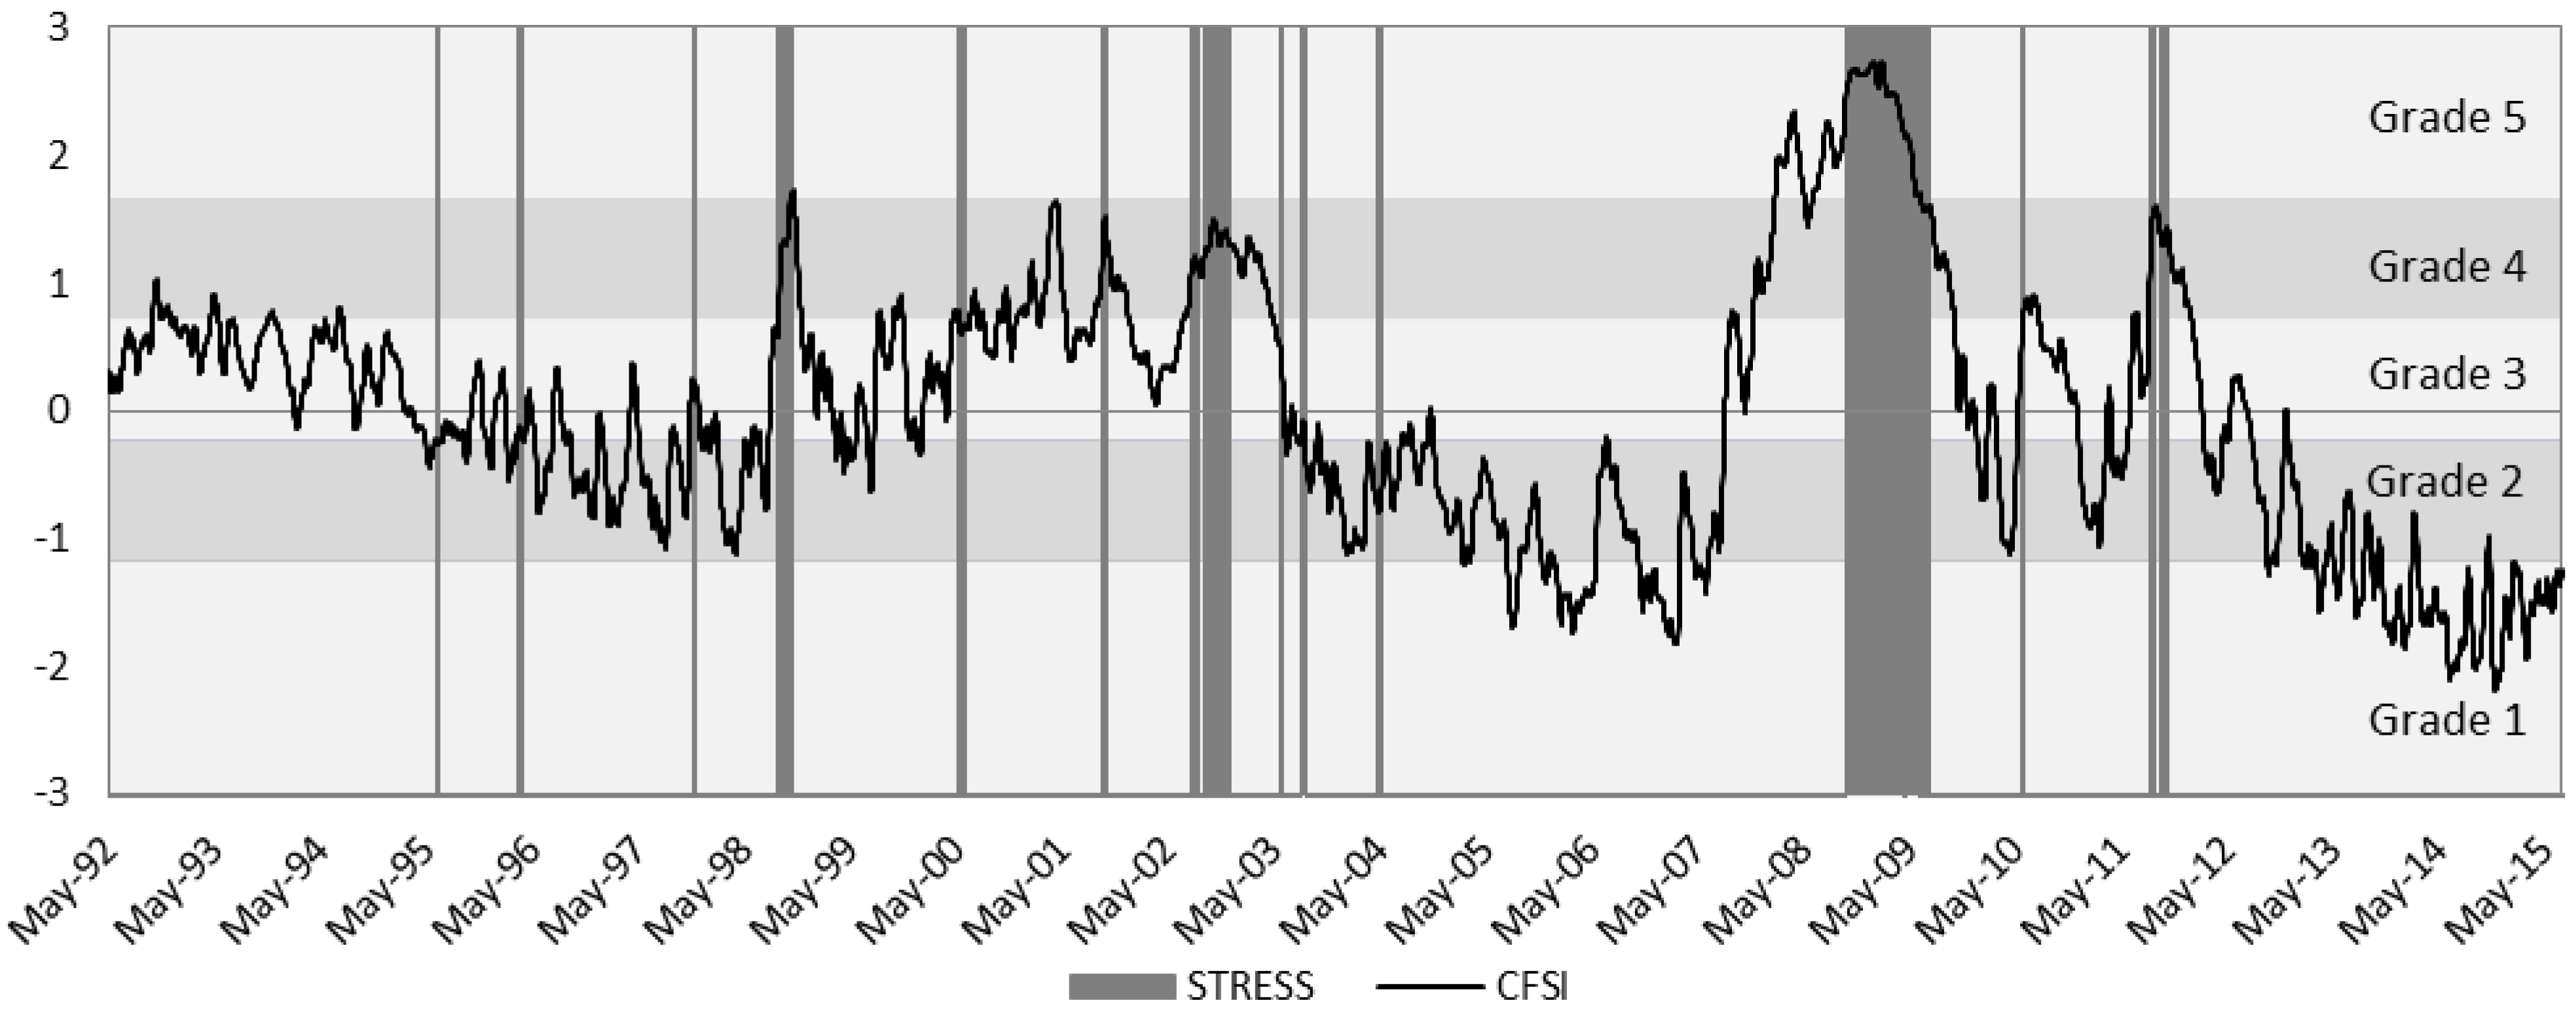
| Frequency | Threshold | Stress Observations | Non-Stress Observations | Percent Stress Observations | Periods of Stress | ROC 3 Grades | ROC 4 Grades | ROC 5 Grades | Somers’ D 3 Grades | Somers’ D 4 Grades | Somers’ D 5 Grades |
|---|---|---|---|---|---|---|---|---|---|---|---|
| Weekly | 0.5 | 2757 | 5728 | 0.325 | 102 | 0.771 | 0.767 | 0.808 | 0.542 | 0.533 | 0.617 |
| Biweekly | 0.5 | 2757 | 5728 | 0.325 | 102 | 0.771 | 0.758 | 0.807 | 0.542 | 0.516 | 0.615 |
| Monthly | 0.5 | 2757 | 5728 | 0.325 | 102 | 0.770 | 0.748 | 0.801 | 0.539 | 0.497 | 0.601 |
| Quarterly | 0.5 | 2757 | 5728 | 0.325 | 102 | 0.734 | 0.730 | 0.793 | 0.468 | 0.460 | 0.586 |
| Weekly | 0.8 | 1915 | 6570 | 0.226 | 88 | 0.787 | 0.774 | 0.816 | 0.574 | 0.548 | 0.632 |
| Biweekly | 0.8 | 1915 | 6570 | 0.226 | 88 | 0.784 | 0.767 | 0.816 | 0.567 | 0.534 | 0.631 |
| Monthly | 0.8 | 1915 | 6570 | 0.226 | 88 | 0.782 | 0.757 | 0.809 | 0.564 | 0.514 | 0.618 |
| Quarterly | 0.8 | 1915 | 6570 | 0.226 | 88 | 0.741 | 0.736 | 0.796 | 0.482 | 0.472 | 0.592 |
| Weekly | 1.1 | 1272 | 7213 | 0.150 | 61 | 0.818 | 0.790 | 0.828 | 0.636 | 0.579 | 0.655 |
| Biweekly | 1.1 | 1272 | 7213 | 0.150 | 61 | 0.811 | 0.786 | 0.830 | 0.623 | 0.572 | 0.659 |
| Monthly | 1.1 | 1272 | 7213 | 0.150 | 61 | 0.805 | 0.779 | 0.820 | 0.609 | 0.557 | 0.640 |
| Quarterly | 1.1 | 1272 | 7213 | 0.150 | 61 | 0.752 | 0.750 | 0.803 | 0.503 | 0.500 | 0.607 |
| Weekly | 1.4 | 948 | 7537 | 0.112 | 44 | 0.843 | 0.806 | 0.839 | 0.686 | 0.612 | 0.679 |
| Biweekly | 1.4 | 948 | 7537 | 0.112 | 44 | 0.832 | 0.805 | 0.841 | 0.664 | 0.609 | 0.682 |
| Monthly | 1.4 | 948 | 7537 | 0.112 | 44 | 0.816 | 0.798 | 0.834 | 0.632 | 0.597 | 0.669 |
| Quarterly | 1.4 | 948 | 7537 | 0.112 | 44 | 0.757 | 0.768 | 0.814 | 0.514 | 0.537 | 0.628 |
| Weekly | 1.7 | 680 | 7805 | 0.080 | 39 | 0.859 | 0.823 | 0.850 | 0.719 | 0.647 | 0.701 |
| Biweekly | 1.7 | 680 | 7805 | 0.080 | 39 | 0.846 | 0.819 | 0.852 | 0.691 | 0.638 | 0.705 |
| Monthly | 1.7 | 680 | 7805 | 0.080 | 39 | 0.829 | 0.812 | 0.846 | 0.658 | 0.624 | 0.693 |
| Quarterly | 1.7 | 680 | 7805 | 0.080 | 39 | 0.769 | 0.796 | 0.826 | 0.537 | 0.592 | 0.651 |
| Weekly | 2 | 482 | 8003 | 0.057 | 30 | 0.898 | 0.867 | 0.897 | 0.796 | 0.733 | 0.793 |
| Biweekly | 2 | 482 | 8003 | 0.057 | 30 | 0.888 | 0.861 | 0.900 | 0.775 | 0.722 | 0.800 |
| Monthly | 2 | 482 | 8003 | 0.057 | 30 | 0.870 | 0.856 | 0.897 | 0.741 | 0.712 | 0.795 |
| Quarterly | 2 | 482 | 8003 | 0.057 | 30 | 0.824 | 0.841 | 0.875 | 0.648 | 0.682 | 0.750 |
3.2. Analyzing Financial Stress
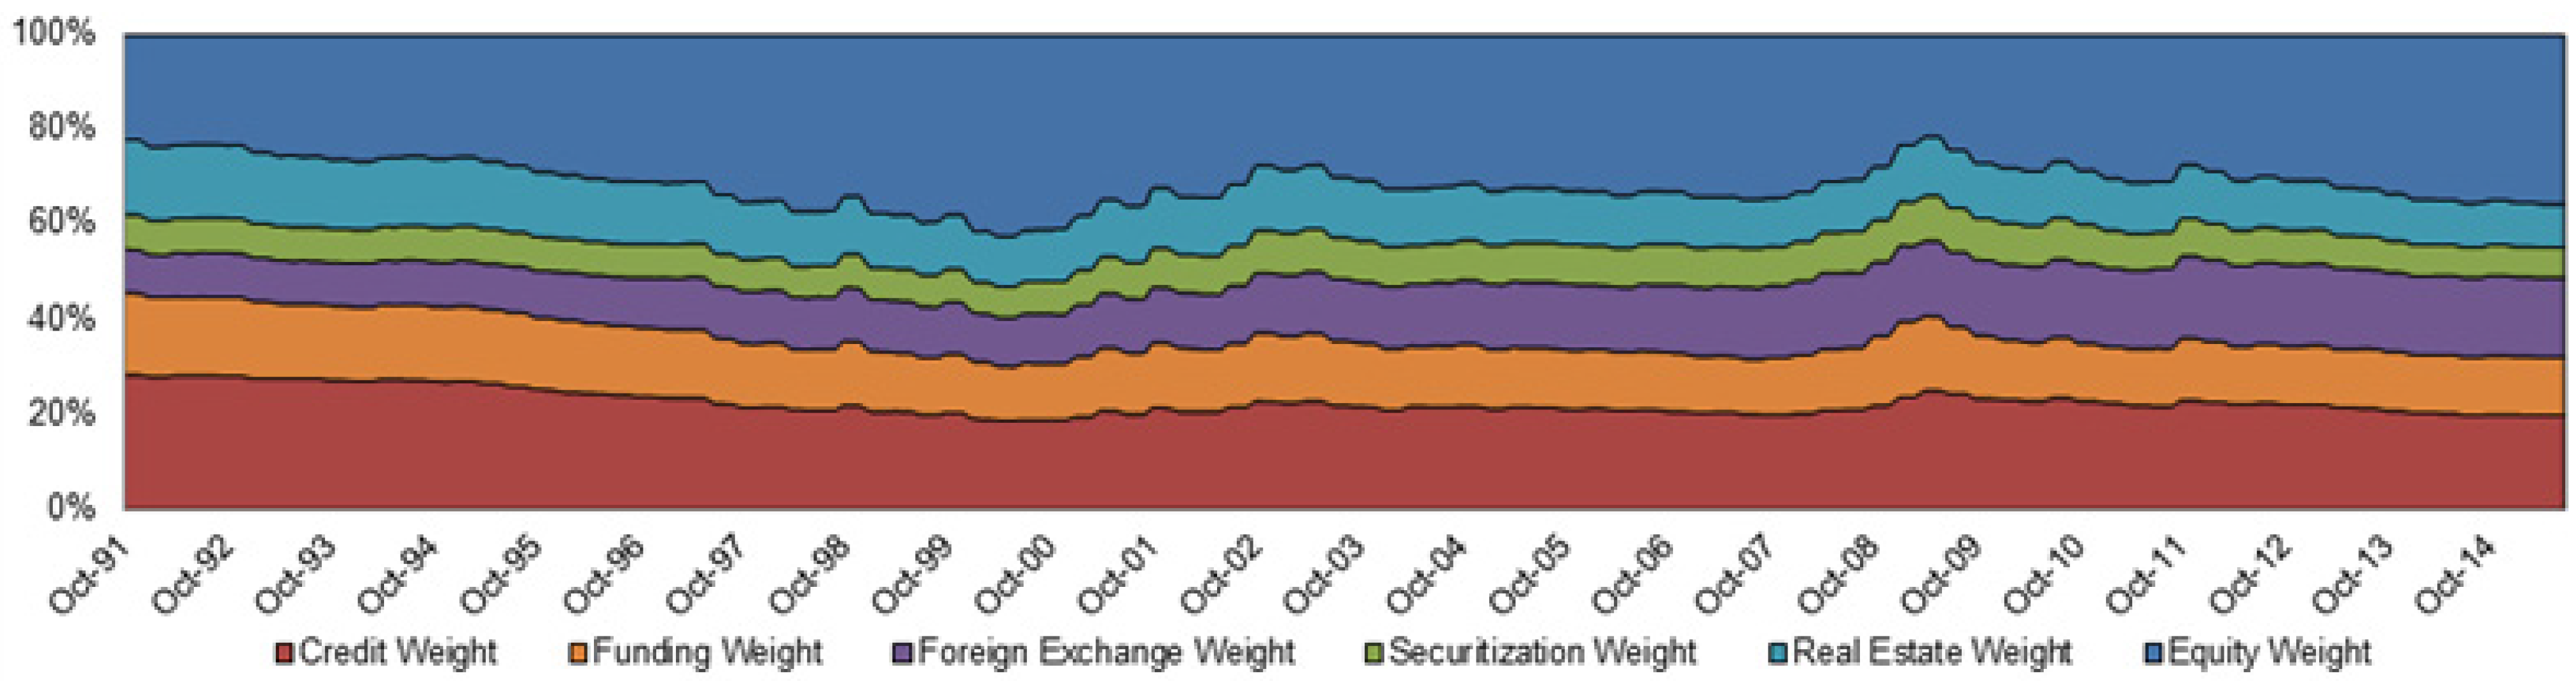
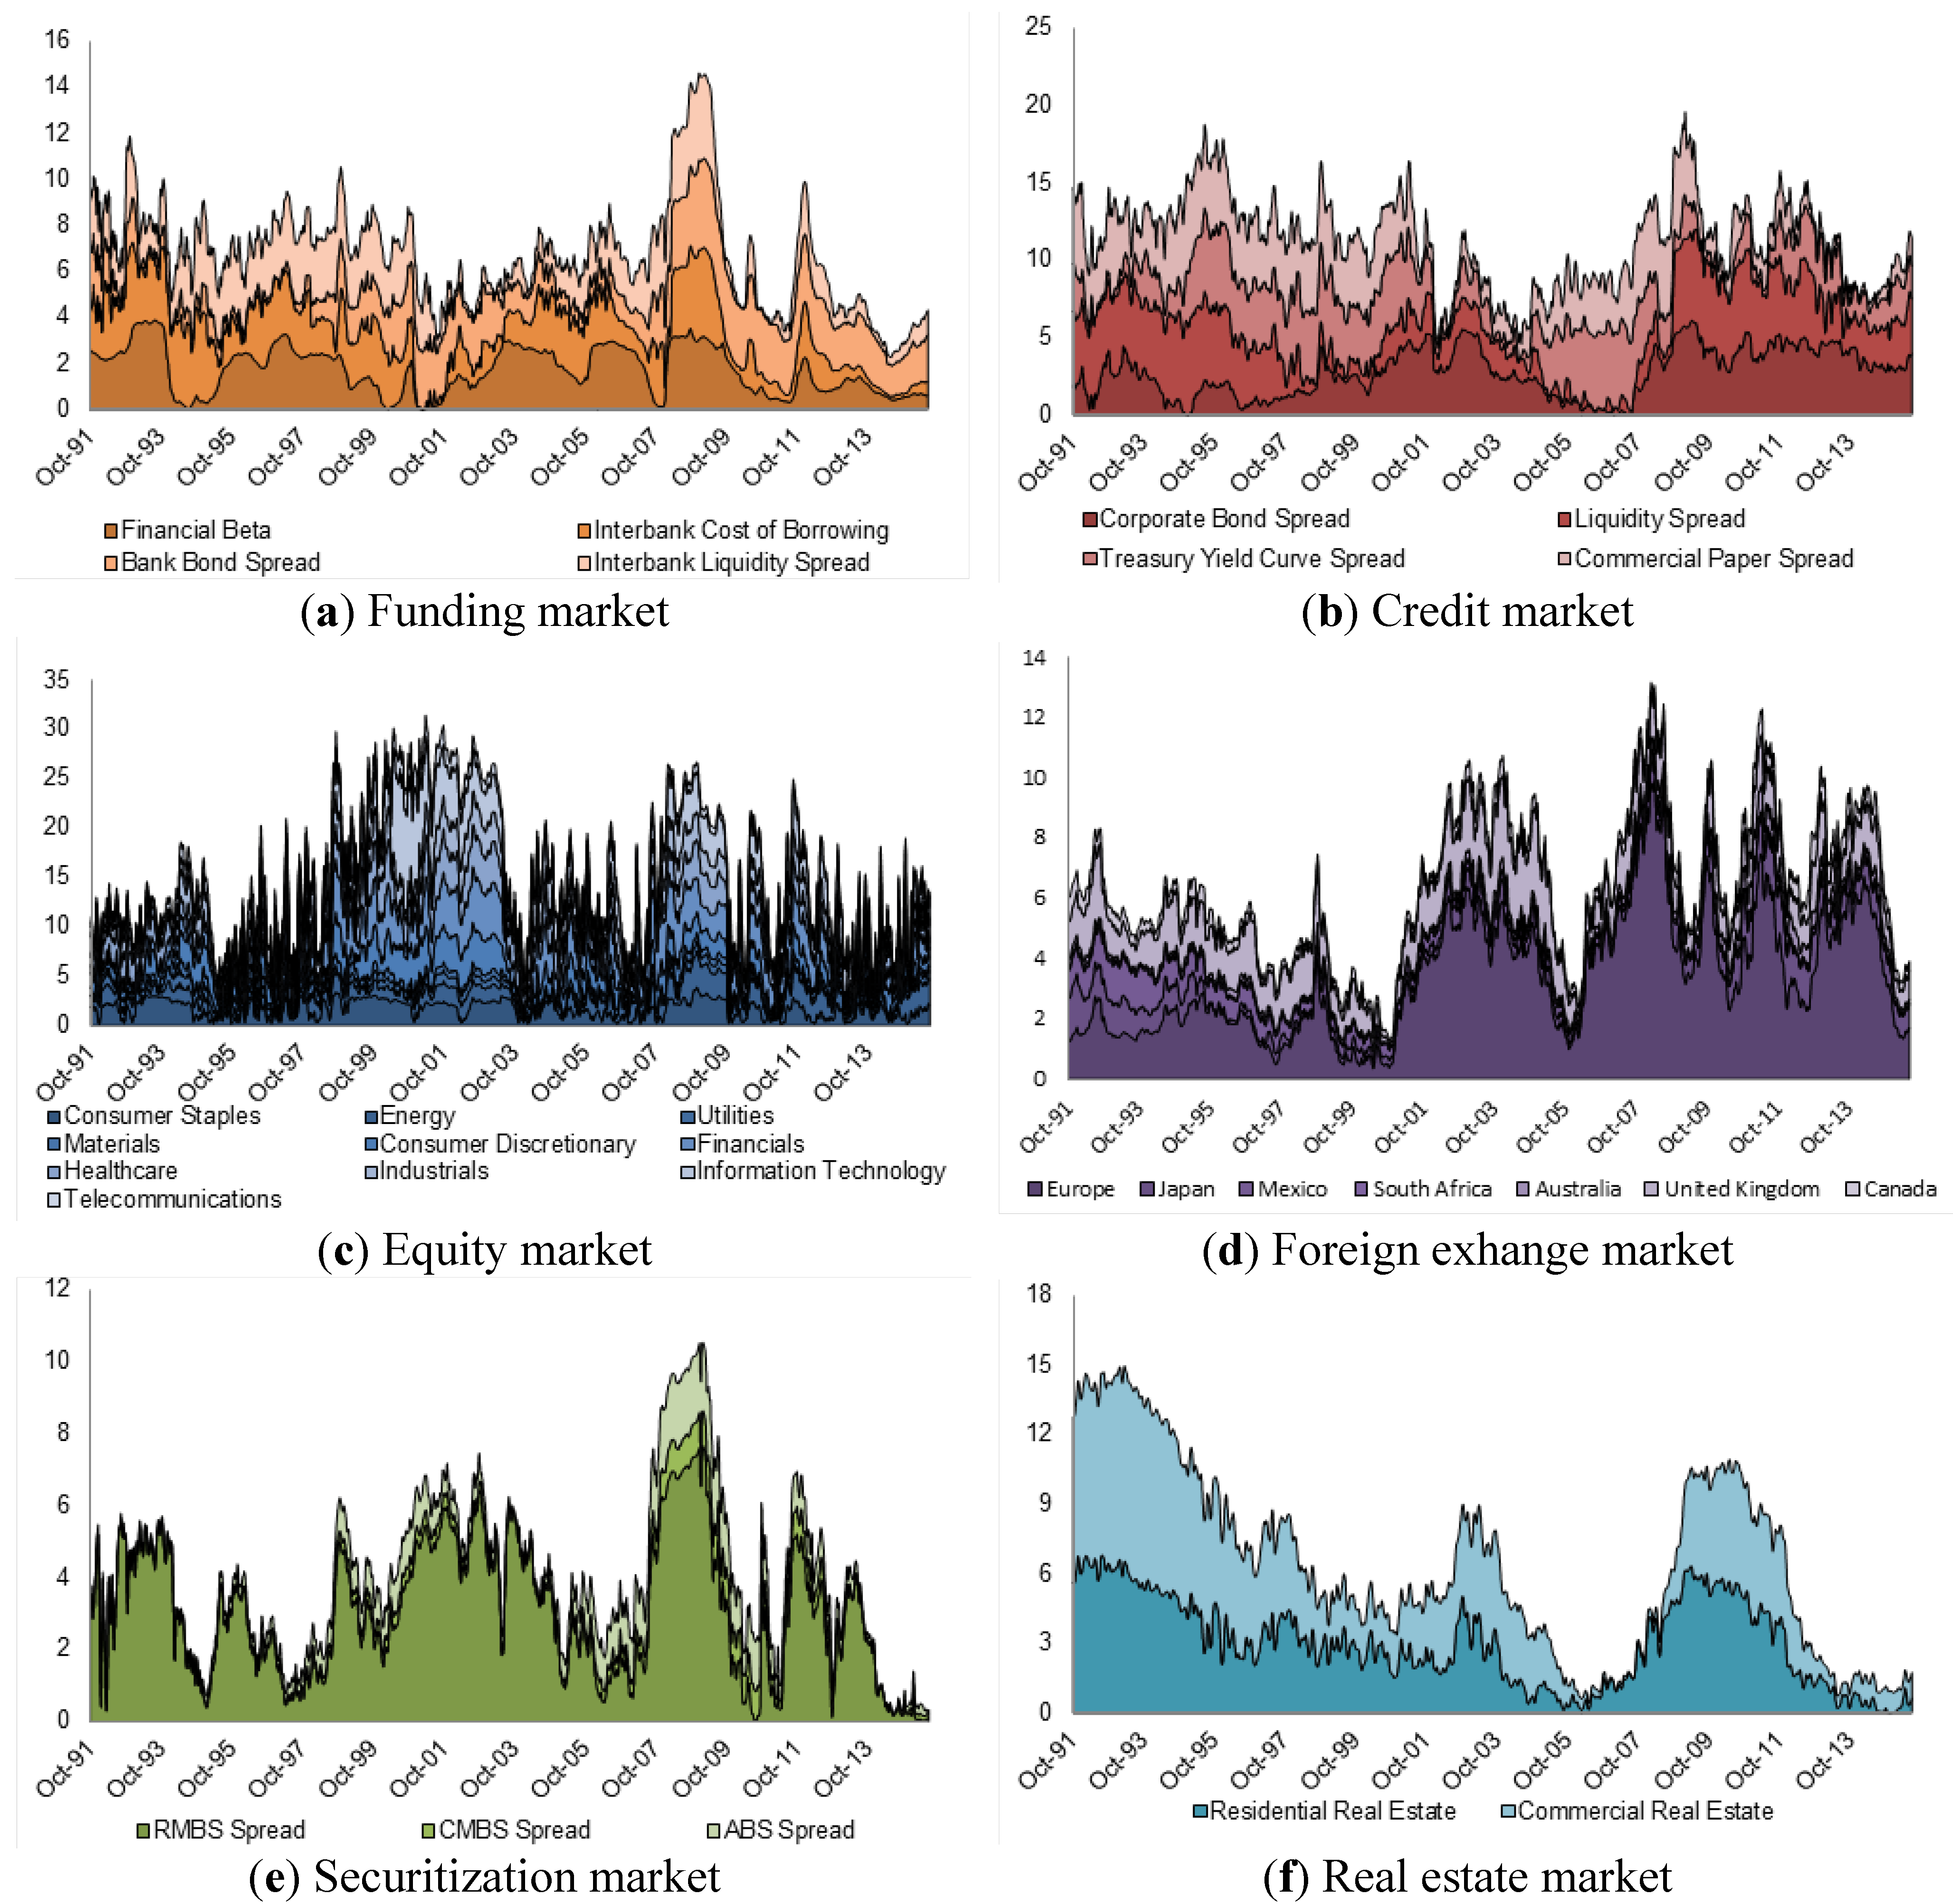
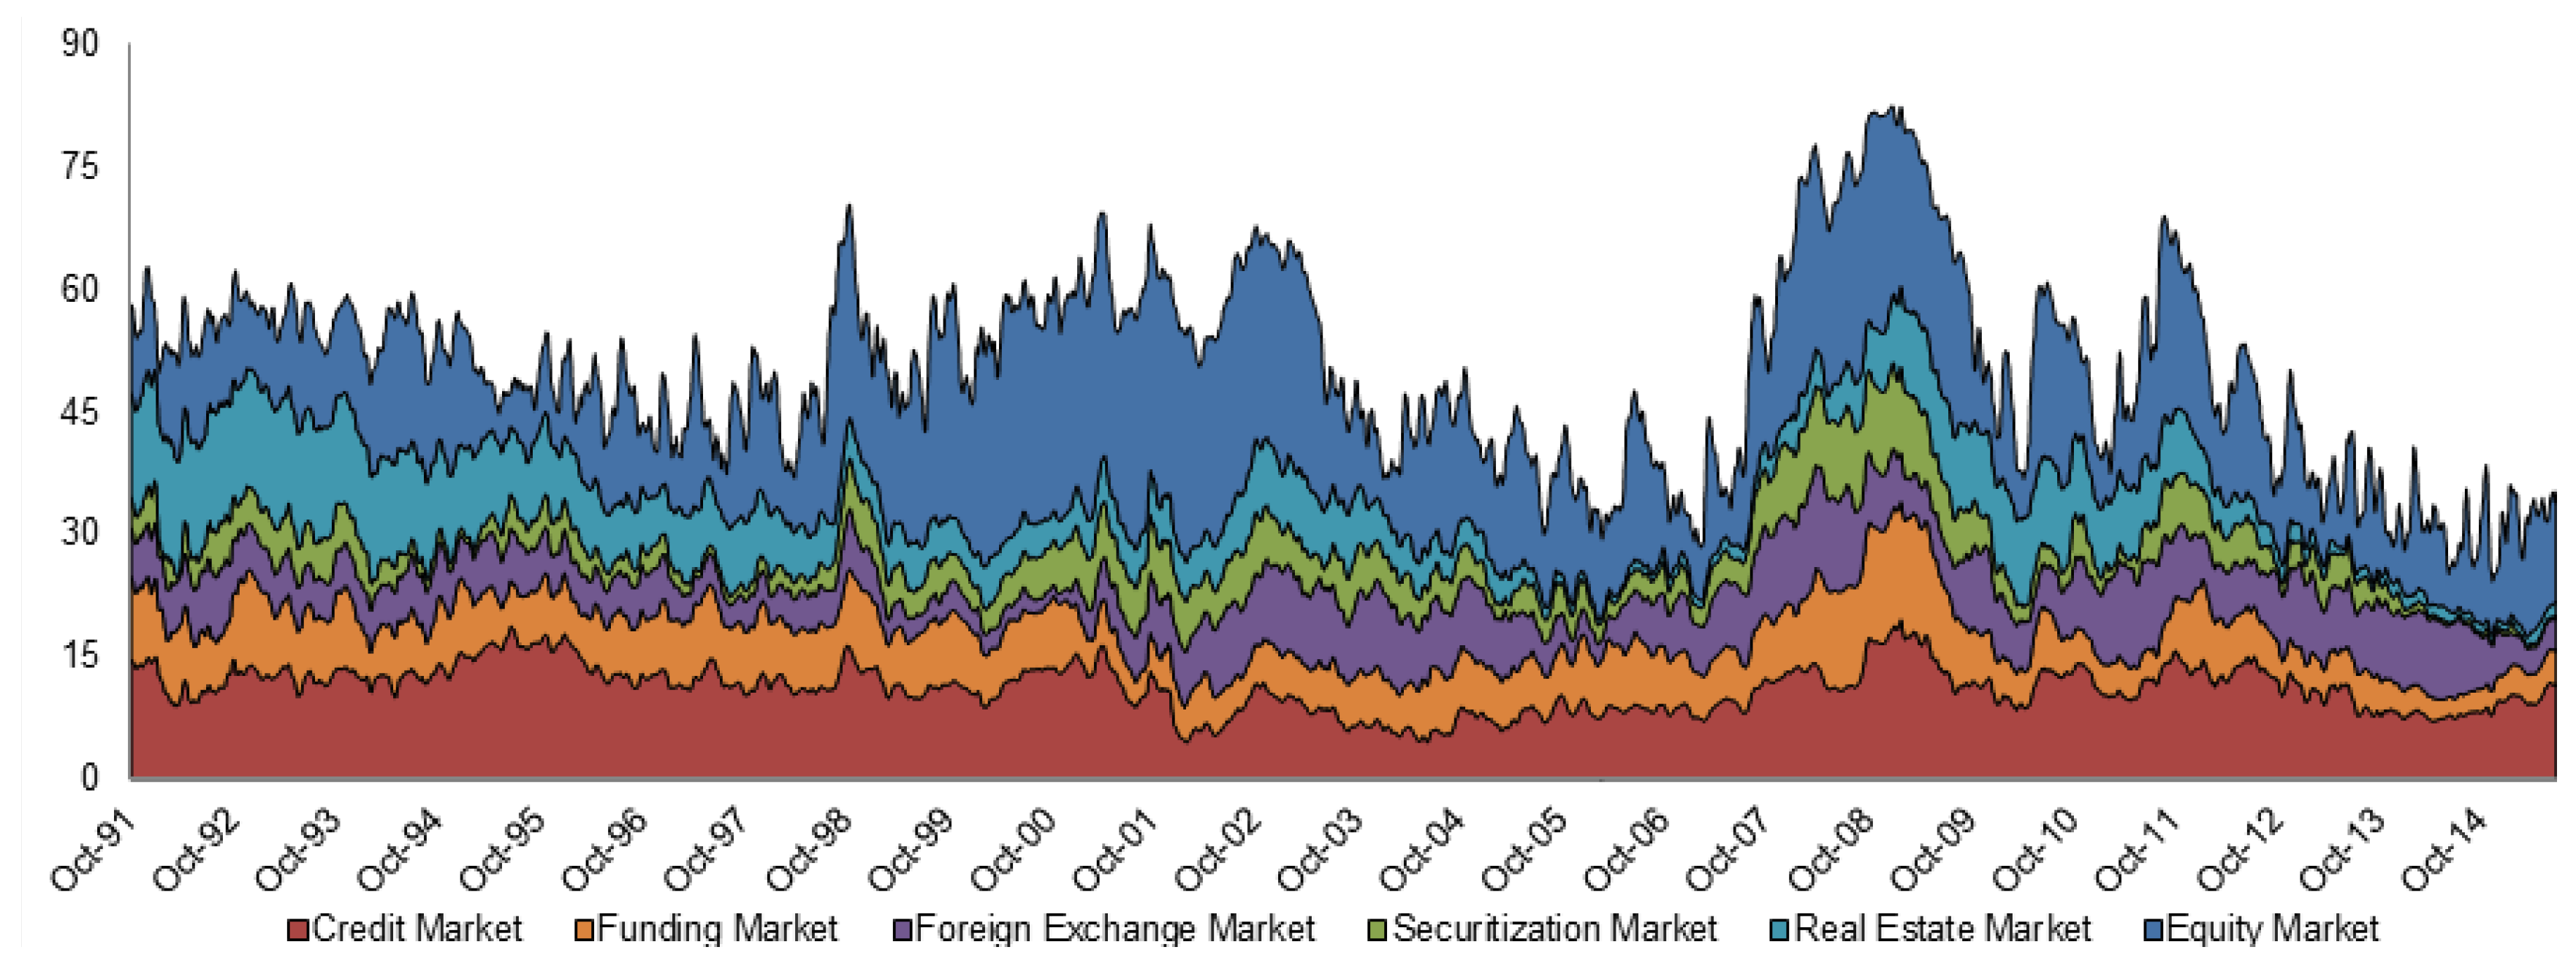
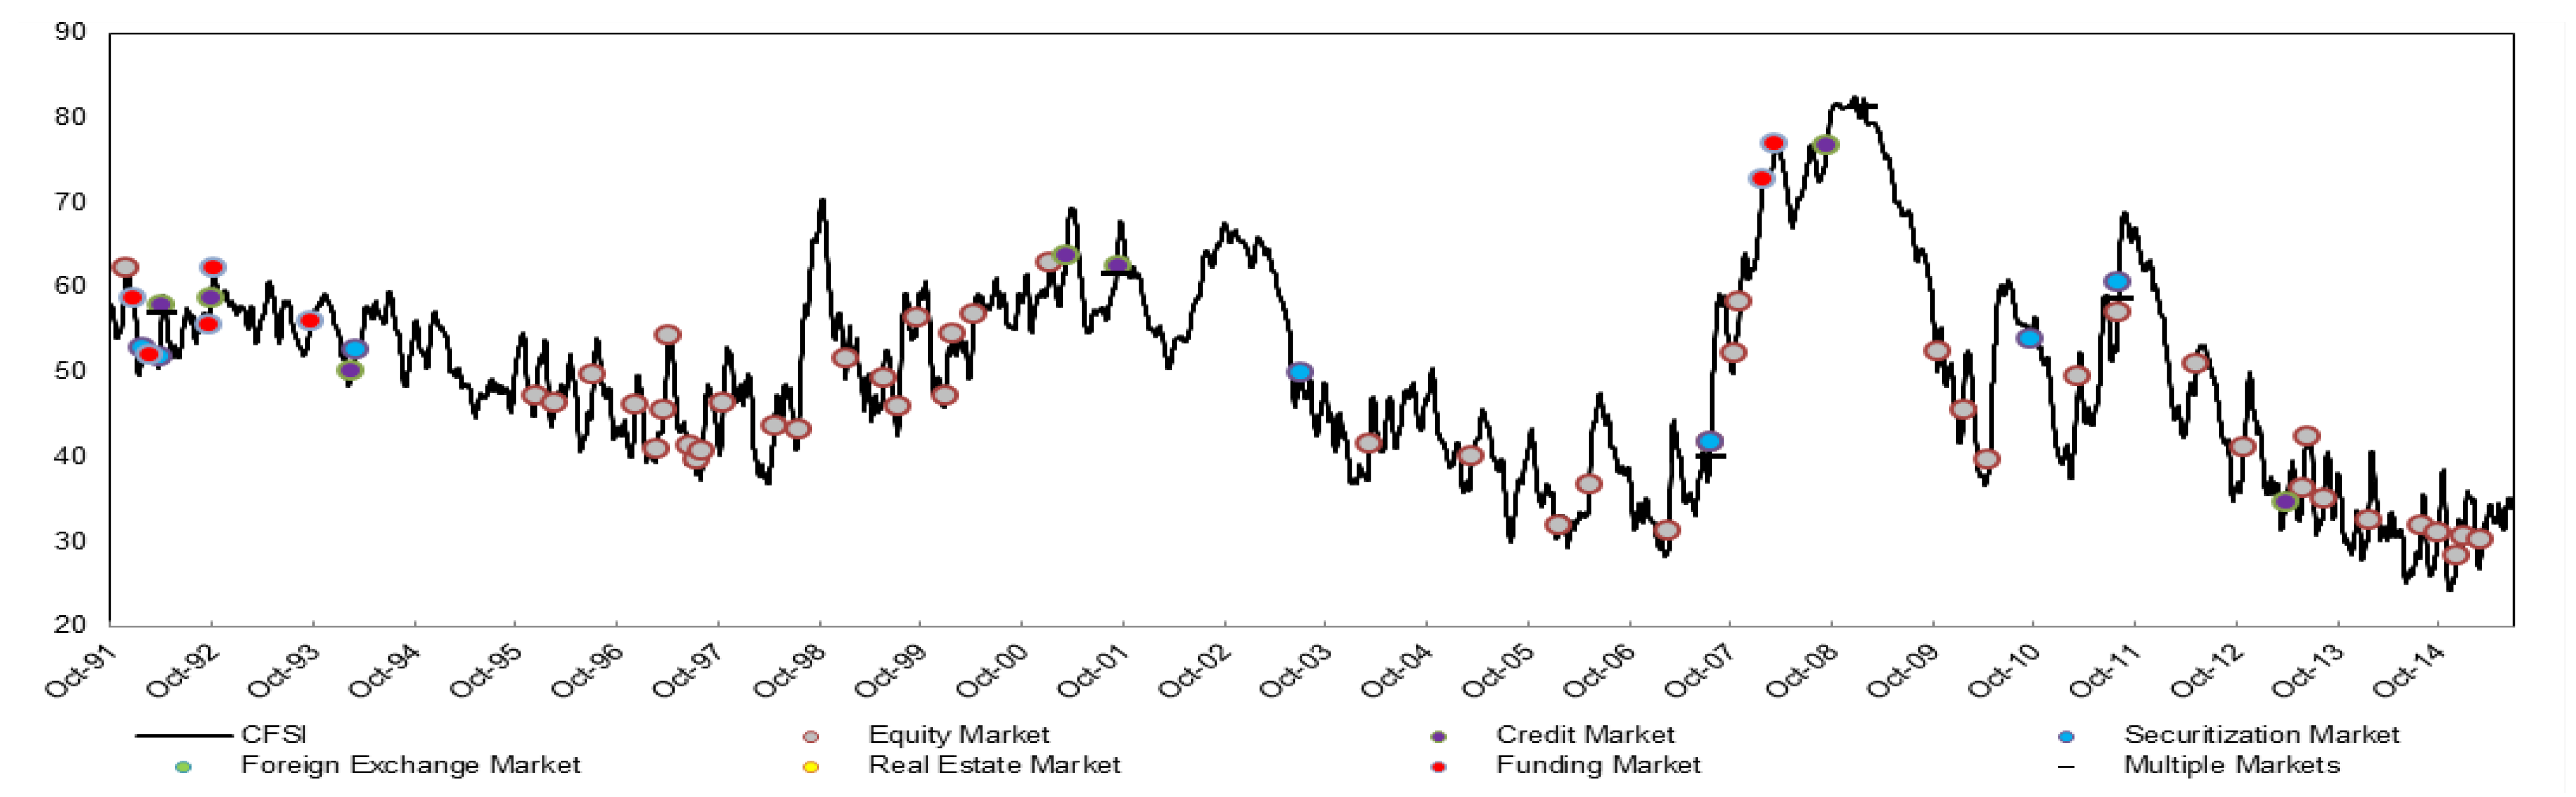
3.2.1. Decomposition of Financial Stress

3.2.2. Retrospective and Prospective Analysis

| Break Test | F-statistic | Number of Breaks | Break Dates |
|---|---|---|---|
| Panel A: Breaks in CFSI | |||
| 0 vs. 1 *** | 2367.45 | 1 | 12/07/2011 |
| 1 vs. 2 *** | 733.63 | 2 | 11/08/2007 |
| 2 vs. 3 *** | 3189.95 | 3 | 08/20/2003 |
| 3 vs. 4 *** | 1127.83 | 4 | 01/20/2000 |
| 4 vs. 5 *** | 1001.81 | 5 | 4/27/1995 |
| Panel B: Breaks in funding CFSI subcomponent | |||
| 0 vs. 1 *** | 2575.82 | 1 | 12/04/2009 |
| 1 vs. 2 *** | 473.59 | 2 | 05/24/2006 |
| 2 vs. 3 *** | 2212.52 | 3 | 12/20/2000 |
| 3 vs. 4 *** | 65.02 | 4 | 04/27/1995 |
| 4 vs. 5 | 0.00 | - | - |
| Panel C: Breaks in credit CFSI subcomponent | |||
| 0 vs. 1 *** | 1835.38 | 1 | 06/20/2001 |
| 1 vs. 2 *** | 2288.24 | 2 | 08/14/2007 |
| 2 vs. 3 *** | 608.36 | 3 | 12/07/2011 |
| 3 vs. 4 *** | 282.20 | 4 | 05/20/1996 |
| 4 vs. 5 * | 0.00 | - | - |
| Panel D: Breaks in equity CFSI subcomponent | |||
| 0 vs. 1 *** | 1664.50 | 1 | 05/05/1998 |
| 1 vs. 2 *** | 3961.59 | 2 | 06/05/2003 |
| 2 vs. 3 *** | 537.28 | 3 | 12/07/2011 |
| 3 vs. 4 *** | 557.72 | 4 | 07/31/2007 |
| 4 vs. 5 | 0.00 | - | - |
| Panel E: Breaks in foreign exchange CFSI subcomponent | |||
| 0 vs. 1 *** | 3563.92 | 1 | 08/23/2001 |
| 1 vs. 2 *** | 2335.17 | 2 | 01/27/1997 |
| 2 vs. 3 *** | 280.28 | 3 | 03/23/2005 |
| 3 vs. 4 *** | 77.66 | 4 | 10/04/2010 |
| 4 vs. 5 | 0.00 | - | - |
| Panel F: Breaks in real estate CFSI subcomponent | |||
| 0 vs. 1 *** | 11335.27 | 1 | 12/04/1995 |
| 1 vs. 2 *** | 4001.06 | 2 | 12/07/2011 |
| 2 vs. 3 *** | 3241.51 | 3 | 05/20/2008 |
| 3 vs. 4 *** | 5885.21 | 4 | 07/13/2004 |
| 4 vs. 5 *** | 389.05 | 5 | 06/30/1999 |
| Panel G: Breaks in securitization CFSI subcomponent | |||
| 0 vs. 1 *** | 822.20 | 1 | 12/07/2011 |
| 1 vs. 2 *** | 646.98 | 2 | 07/30/2007 |
| 2 vs. 3 *** | 968.38 | 3 | 08/27/1998 |
| 3 vs. 4 *** | 2043.40 | 4 | 01/26/2004 |
| 4 vs. 5 | 0.00 | - | - |
| Hypothesis | F-Statistic | Probability |
|---|---|---|
| Panel A: CFSI, bank failures, and economic growth | ||
| does not Granger cause number of defaults | 2.781 ††† | 0.032 |
| Number of defaults does not Granger cause | 0.758 (ns) | 0.555 |
| does not Granger cause estimated loss | 3.490 ††† | 0.011 |
| Estimated loss does not Granger cause | 0.343 (ns) | 0.849 |
| does not Granger cause GNP growth | 1.801 † | 0.137 |
| GNP growth does not Granger cause | 0.740 (ns) | 0.567 |
| Estimated loss does not Granger cause the number of defaults | 14.604 ††† | 0.000 |
| Number of defaults does not Granger cause the estimated loss | 2.927 ††† | 0.026 |
| Estimated loss does not Granger cause the GNP growth | 4.986 ††† | 0.001 |
| GNP growth does not Granger cause the estimated loss | 6.004 ††† | 0.000 |
| Number of defaults does not Granger cause the GNP growth | 0.033 (ns) | 0.998 |
| GNP growth does not Granger cause the number of defaults | 6.000 ††† | 0.000 |
| Panel B: CFSI and effective federal funds rate | ||
| does not Granger cause the effective federal funds rate | 1.937 ††† | 0.031 |
| The effective federal funds rate does not Granger cause | 2.200 ††† | 0.012 |
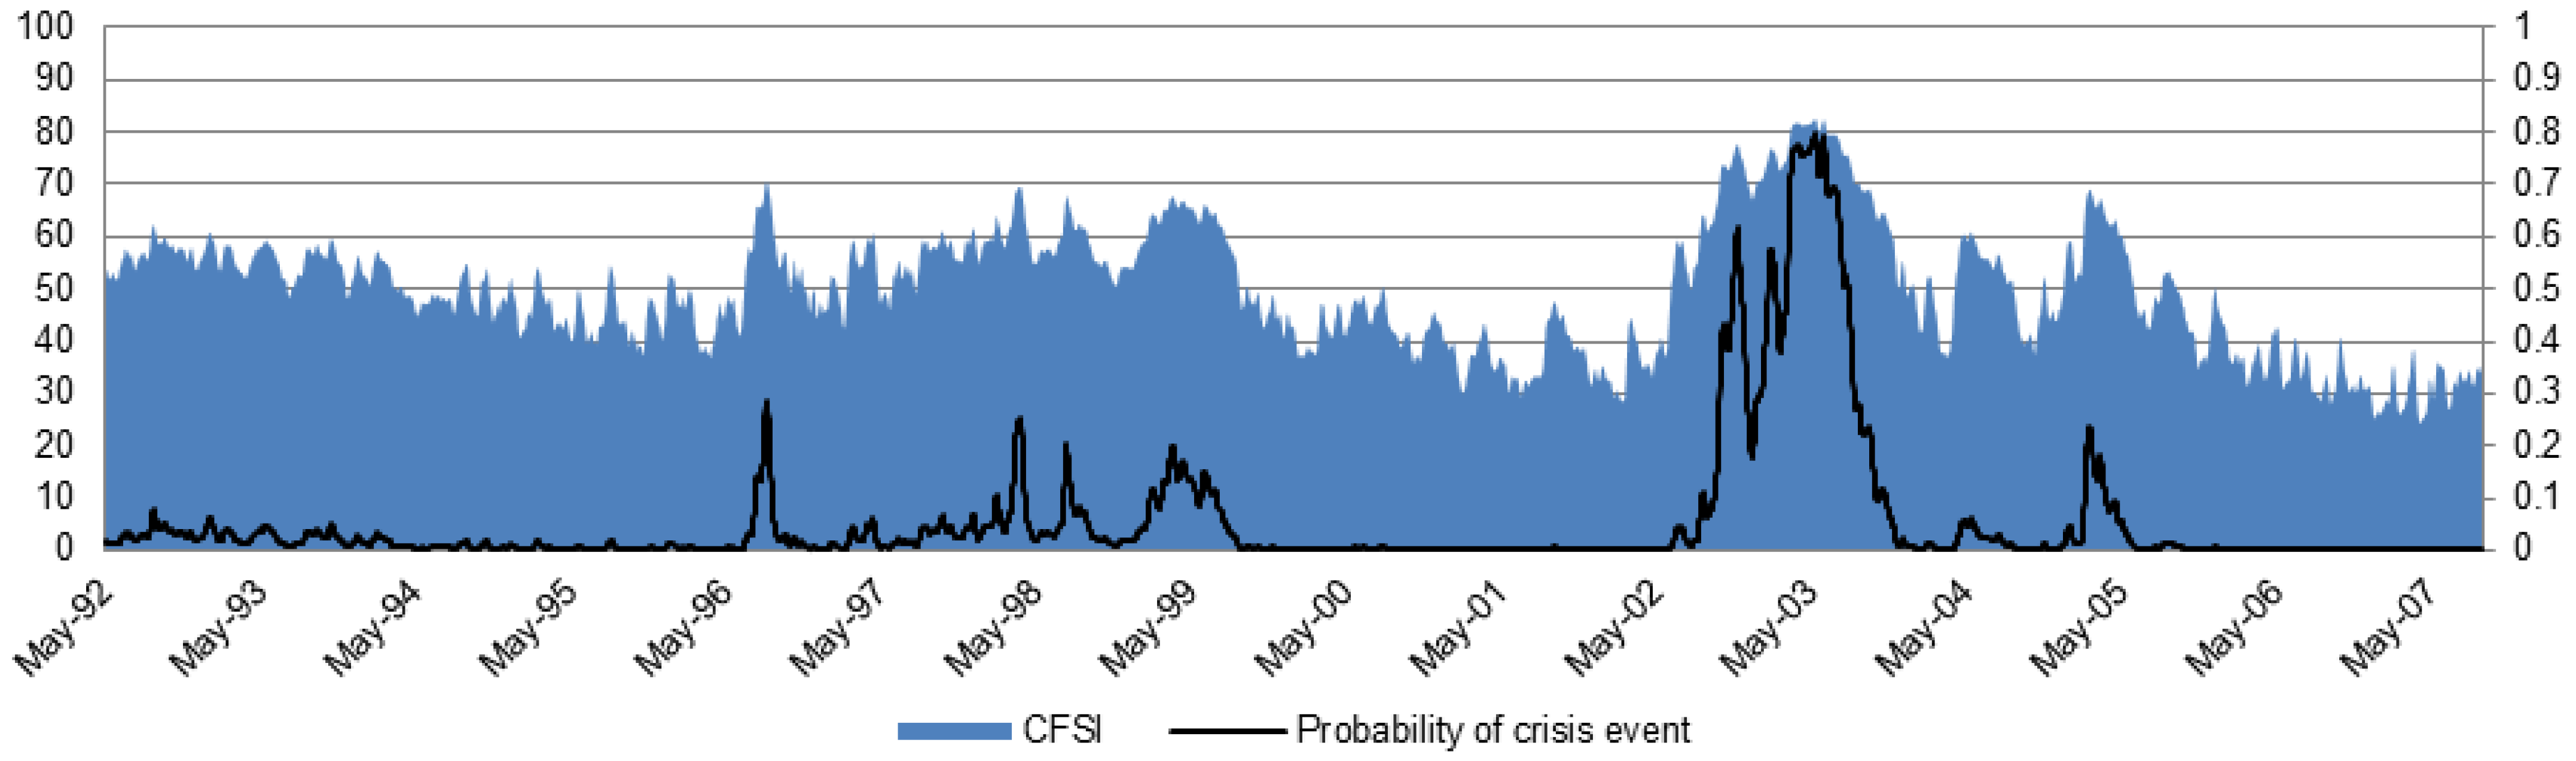
3.3. Alerting Financial Stress

4. Conclusions
Acknowledgments
Author Contributions
Conflicts of Interest
References
- F. Allen, and E. Carletti. “An overview of the crisis: Causes, consequences, and solutions.” Int. Rev. Financ. 10 (2010): 1–26. [Google Scholar] [CrossRef]
- G. Kenny, and J. Morgan. Some Lessons from the Financial Crisis for the Economic Analysis. ECB Occasional Paper No. 130; Frankfurt, Germany: European Central Bank (ECB), 2011. [Google Scholar]
- International Monetary Fund (IMF). “Global Financial Stability Report—Responding to the Financial Crisis and Measuring Systemic Risks.” Washington, DC, USA: International Monetary Fund, 2009. [Google Scholar]
- J. Hatzius, P. Hooper, F.S. Mishkin, K.L. Schoenholtz, and M.W. Watson. Financial Conditions Indexes: A Fresh Look after the Financial Crisis. NBER Working Paper No. 16150; Cambridge, MA, USA: National Bureau of Economic Research (NBER), 2010. [Google Scholar]
- S. Brave, and R.A. Butters. “Monitoring financial stability: A financial conditions index approach.” Econ. Perspect. 35 (2011): 22–43. [Google Scholar]
- C.S. Hakkio, and W.R. Keeton. “Financial stress: What is it, how can it be measured, and why does it matter? ” Econ. Rev. 94 (2009): 5–50. [Google Scholar]
- M. Carlson, K. Lewis, and W. Nelson. Using Policy Intervention to Identify Financial Stress. Federal Reserve Board Working Paper No. 2012-02; Washington, DC, USA: Federal Reserve, 2012. [Google Scholar]
- D. Holló, M. Kremer, and M. Lo Duca. CISS—A Composite Indicator of Systemic Stress in the Financial System. European Central Bank Working Paper No. 1426; Frankfurt, Germany: European Central Bank (ECB), 2012. [Google Scholar]
- K.L. Kliesen, and D.C. Smith. Measuring Financial Market Stress. Federal Reserve Bank of St. Louis Economic Synopses No. 2; St. Louis, MO, USA: Federal Reserve Bank of St. Louis, 2010. [Google Scholar]
- M.V. Oet, R. Eiben, T. Bianco, D. Gramlich, and S.J. Ong. The Financial Stress Index: Identification of Systemic Risk Conditions. Federal Reserve Bank of Cleveland Working Paper No. 11/30; Cleveland, OH, USA: Federal Reserve Bank of Cleveland, 2011. [Google Scholar]
- M. Lo Duca, and T.A. Peltonen. “Assessing systemic risks and predicting systemic events.” J. Bank. Financ. 37 (2013): 2183–2195. [Google Scholar] [CrossRef]
- A. Korinek. Systemic Risk-Taking: Amplification Effects, Externalities, and Regulatory Responses. Networks Financial Institute Working Paper No. 2011-WP-13; Terre Haute, IN, USA: Networks Financial Institute, 2011. [Google Scholar]
- C. Borio, and P. Lowe. “Assessing the risk of banking crises.” BIS Q. Rev. December (2002): 43–54. [Google Scholar]
- M. Rosenberg. “Financial Conditions Watch, Global Financial Market Trends and Policy. Bloomberg LLP.” Available online: http://www.ssc.wisc.edu/~mchinn/fcw_sep112009.pdf (accessed on 1 July 2015).
- A.V. Thakor. “Book review “Comparing Financial Systems”.” Rev. Financ. Stud. 14 (2001): 577–581. [Google Scholar]
- R.C. Merton, and Z. Bodie. “A conceptual framework for analyzing the financial environment.” In The Global Financial System: A Functional Perspective. Edited by D.B. Crane. Boston, MA, USA: Harvard Business School Press, 1995, pp. 3–31. [Google Scholar]
- H. Simon. “Architecture of complexity.” Proc. Am. Philos. Soc. 106 (1962): 467–482. [Google Scholar]
- F. Allen, and D. Gale. Comparing Financial Systems. Cambridge, MA, USA: MIT Press, 2000. [Google Scholar]
- F. Song, and A.V. Thakor. “Financial system architecture and the co-evolution of banks and capital markets.” Econ. J. 120 (2010): 1021–1055. [Google Scholar] [CrossRef]
- A.V. Thakor. “The design of financial systems: An overview.” J. Bank. Financ. 20 (1996): 917–948. [Google Scholar] [CrossRef]
- M.V. Oet, J. Dooley, D. Gramlich, P. Sarlin, and S. Ong. Evaluating the Information Value for Measures of Systemic Conditions. Cleveland, OH, USA: Federal Reserve Bank of Cleveland Working Paper, 2015. [Google Scholar]
- N. Siddiqi. Credit Risk Scorecards: Developing and Implementing Intelligent Credit Scoring. Cary, NC, USA: SAS Institute, 2005, pp. 79–83. [Google Scholar]
- S. Patel, and A. Sarkar. “Crises in developed and emerging stock markets.” Financ. Anal. J. 54 (1998): 50–61. [Google Scholar] [CrossRef]
- “SIFMA Statistics Website.” Available online: http://www.sifma.org/research/statistics.aspx (accessed on 7 July 2015).
- A. Estrella, and M. Trubin. The Yield Curve as a Leading Indicator: Some Practical Issues. New York, NY, USA: Current Issues in Economics and Finance, 2006, Volume 12. [Google Scholar]
- J. Haubrich. Does the Yield Curve Signal Recession? Cleveland, OH, USA: Federal Reserve Bank of Cleveland, 2006. [Google Scholar]
- M.D. Bordo, M. Dueker, and D. Wheelock. Aggregate Price Shocks and Financial Instability: An Historical Analysis. Federal Reserve Bank of St. Louis Working Paper 2000-005B; St. Louis, MO, USA: Federal Reserve Bank of St. Louis, 2000. [Google Scholar]
- M. Illing, and Y. Liu. An Index of Financial Stress for Canada. Working Paper 2003-14; Ottawa, ON, Canada: Bank of Canada, 2003. [Google Scholar]
- M. Illing, and Y. Liu. “Measuring financial stress in a developed country: An application to Canada.” J. Financ. Stab. 2 (2006): 243–265. [Google Scholar] [CrossRef]
- D. Gramlich, T. Bianco, and M.V. Qet. “Weighting Methods for Financial Stress Indices-Comparison and Implications for Risk Management.” J. Financ. Manag. Anal. 25 (2012): 1–13. [Google Scholar]
- “FFIEC Website.” Available online: http://www.ffiec.gov/E16.htm (accessed on 5 July 2015).
- D. Gramlich, G. Miller, M. Oet, and S. Ong. “Early Warning Systems for Systemic Banking Risk: Critical Review and Modeling Implications.” Bank. Bank Syst. 5 (2010): 199–211. [Google Scholar]
- A. Demirgüç-Kunt, and E. Detragiache. Cross-Country Empirical Studies of Systemic Bank Distress: A Survey. IMF Working Paper No. 96/05; Washington, DC, USA: International Monetary Fund (IMF), 2005. [Google Scholar]
- C. Reinhart, and K. Rogoff. This Time is Different: A Panoramic View of Eight Centuries of Financial Crises. NBER Working Paper, No. 13882; Cambridge, MA, USA: National Bureau of Economic Research (NBER), 2008. [Google Scholar]
- R.H. Somers. “A new asymmetric measure of association for ordinal variables.” Am. Sociol. Rev. 27 (1962): 799–811. [Google Scholar] [CrossRef]
- J.A. Miron. “Financial panics, the seasonality of the nominal interest rate, and the founding of the Fed.” Am. Econ. Rev. 76 (1986): 125–140. [Google Scholar]
- X. Freixas, and J.-C. Rochet. Microeconomics of Banking, 2nd ed. Cambridge, MA, USA: MIT Press, 2008. [Google Scholar]
- G.L. Kaminsky, and C.M. Reinhart. “The twin crises: The causes of banking and balance-of-payments problems.” Am. Econ. Rev. 89 (1999): 473–500. [Google Scholar] [CrossRef] [Green Version]
- G. Caprio, and D. Klingebiel. Bank Insolvencies: Cross Country Experiences. World Bank Policy Research Working Paper No. 1620; DC, USA: World Bank, 1996. [Google Scholar]
- J. Bai, and P. Perron. “Estimating and testing linear models with multiple structural changes.” Econometrica 66 (1998): 47–78. [Google Scholar] [CrossRef]
- F.S. Mishkin. Understanding Financial Crises: A Developing Country Perspective. NBER Working Paper Series, No. w5600; Cambridge, MA, USA: National Bureau of Economic Research (NBER), 1997. [Google Scholar]
- R.I. McKinnon, and H. Pill. “Credible liberalizations and international capital flows: The “overborrowing syndrome”.” Financ. Deregul. Integr. East Asia NBER-EASE 5 (1996): 7–50. [Google Scholar]
- J. Sachs, A. Tornell, and A. Velasco. “Financial crises in emerging markets: The lessons from 1995.” Brook. Pap. Econ. Act., 1996, 147–215. [Google Scholar] [CrossRef]
- C. Weller. “Financial crises after financial liberalization: Exceptional circumstances or structural weakness? ” J. Dev. Stud. 38 (2001): 98–127. [Google Scholar] [CrossRef]
- E.F. Fama, and K.R. French. “Business conditions and expected returns on stocks and bonds.” J. Financ. Econ. 25 (1989): 23–49. [Google Scholar]
- W. Schwert. “Why does stock volatility change over time? ” J. Financ. 44 (1989): 1115–1153. [Google Scholar] [CrossRef]
- R.J. Shiller. Stock Market Volatility. Cambridge, MA, USA: MIT Press, 1989. [Google Scholar]
- “FDIC Website. ” Available online: https://www2.fdic.gov/hsob/SelectRpt.asp?EntryTyp=30 (accessed on 5 July 2015).
- 1In the context of this paper, we find it useful to discuss financial supervision as a common function of diverse participants who engage in critical observation of financial markets.
- 3This generalizes the ad hoc alternatives of crisis lists and expert surveys.
- 4Section 2.4 summarizes the benchmark construction (for full details see [21]).
- 5We use the “US ABS Issuance and Outstanding” and “US Mortgage-Related Issuance and Outstanding” worksheets provided by SIFMA [24].
- 6The most severe constraint is Bloomberg’s 10 year A Bank Bond Index (C07010YB) that is not available prior to 25 September 1991.
- 7When applying the CDF transformation under cumulative approach we avoid heightened volatility for early observations by applying the full-information approach on the first 30% of our dataset as a training period.
- 9Illing and Liu [29] (p. 255) state that credit weights correspond to “the relative size of each market…as a share of total credit in the economy.”
- 10The FFIEC 009 Country Exposure Report aggregate data is available at [31].
- 11Technically, it is a measure of association describing the difference of the conditional probabilities (see [35]). We find that in all cases the ROC and Somers D agree on which settings produce the optimal measure.
- 13FDIC data on bank failures can be found at [48]. We omit all defaults supervised by the Resolution Trust Corporation (RTC) due to suspected discrepancies in the reporting methodology of estimated loss. We use the Datastream series USGNP…DD and FRFEDFDD for GNP and effective federal funds rate respectively. We use the difference in the logarithm of reported GNP as GNP growth.
© 2015 by the authors; licensee MDPI, Basel, Switzerland. This article is an open access article distributed under the terms and conditions of the Creative Commons Attribution license (http://creativecommons.org/licenses/by/4.0/).
Share and Cite
Oet, M.V.; Dooley, J.M.; Janosko, A.C.; Gramlich, D.; Ong, S.J. Supervising System Stress in Multiple Markets. Risks 2015, 3, 365-389. https://doi.org/10.3390/risks3030365
Oet MV, Dooley JM, Janosko AC, Gramlich D, Ong SJ. Supervising System Stress in Multiple Markets. Risks. 2015; 3(3):365-389. https://doi.org/10.3390/risks3030365
Chicago/Turabian StyleOet, Mikhail V., John M. Dooley, Amanda C. Janosko, Dieter Gramlich, and Stephen J. Ong. 2015. "Supervising System Stress in Multiple Markets" Risks 3, no. 3: 365-389. https://doi.org/10.3390/risks3030365