In-Parallel Polar Monitoring of Chemiluminescence Emission Anisotropy at the Solid–Liquid Interface by an Optical Fiber Radial Array

 , ,
, ,  ,
,  and
and 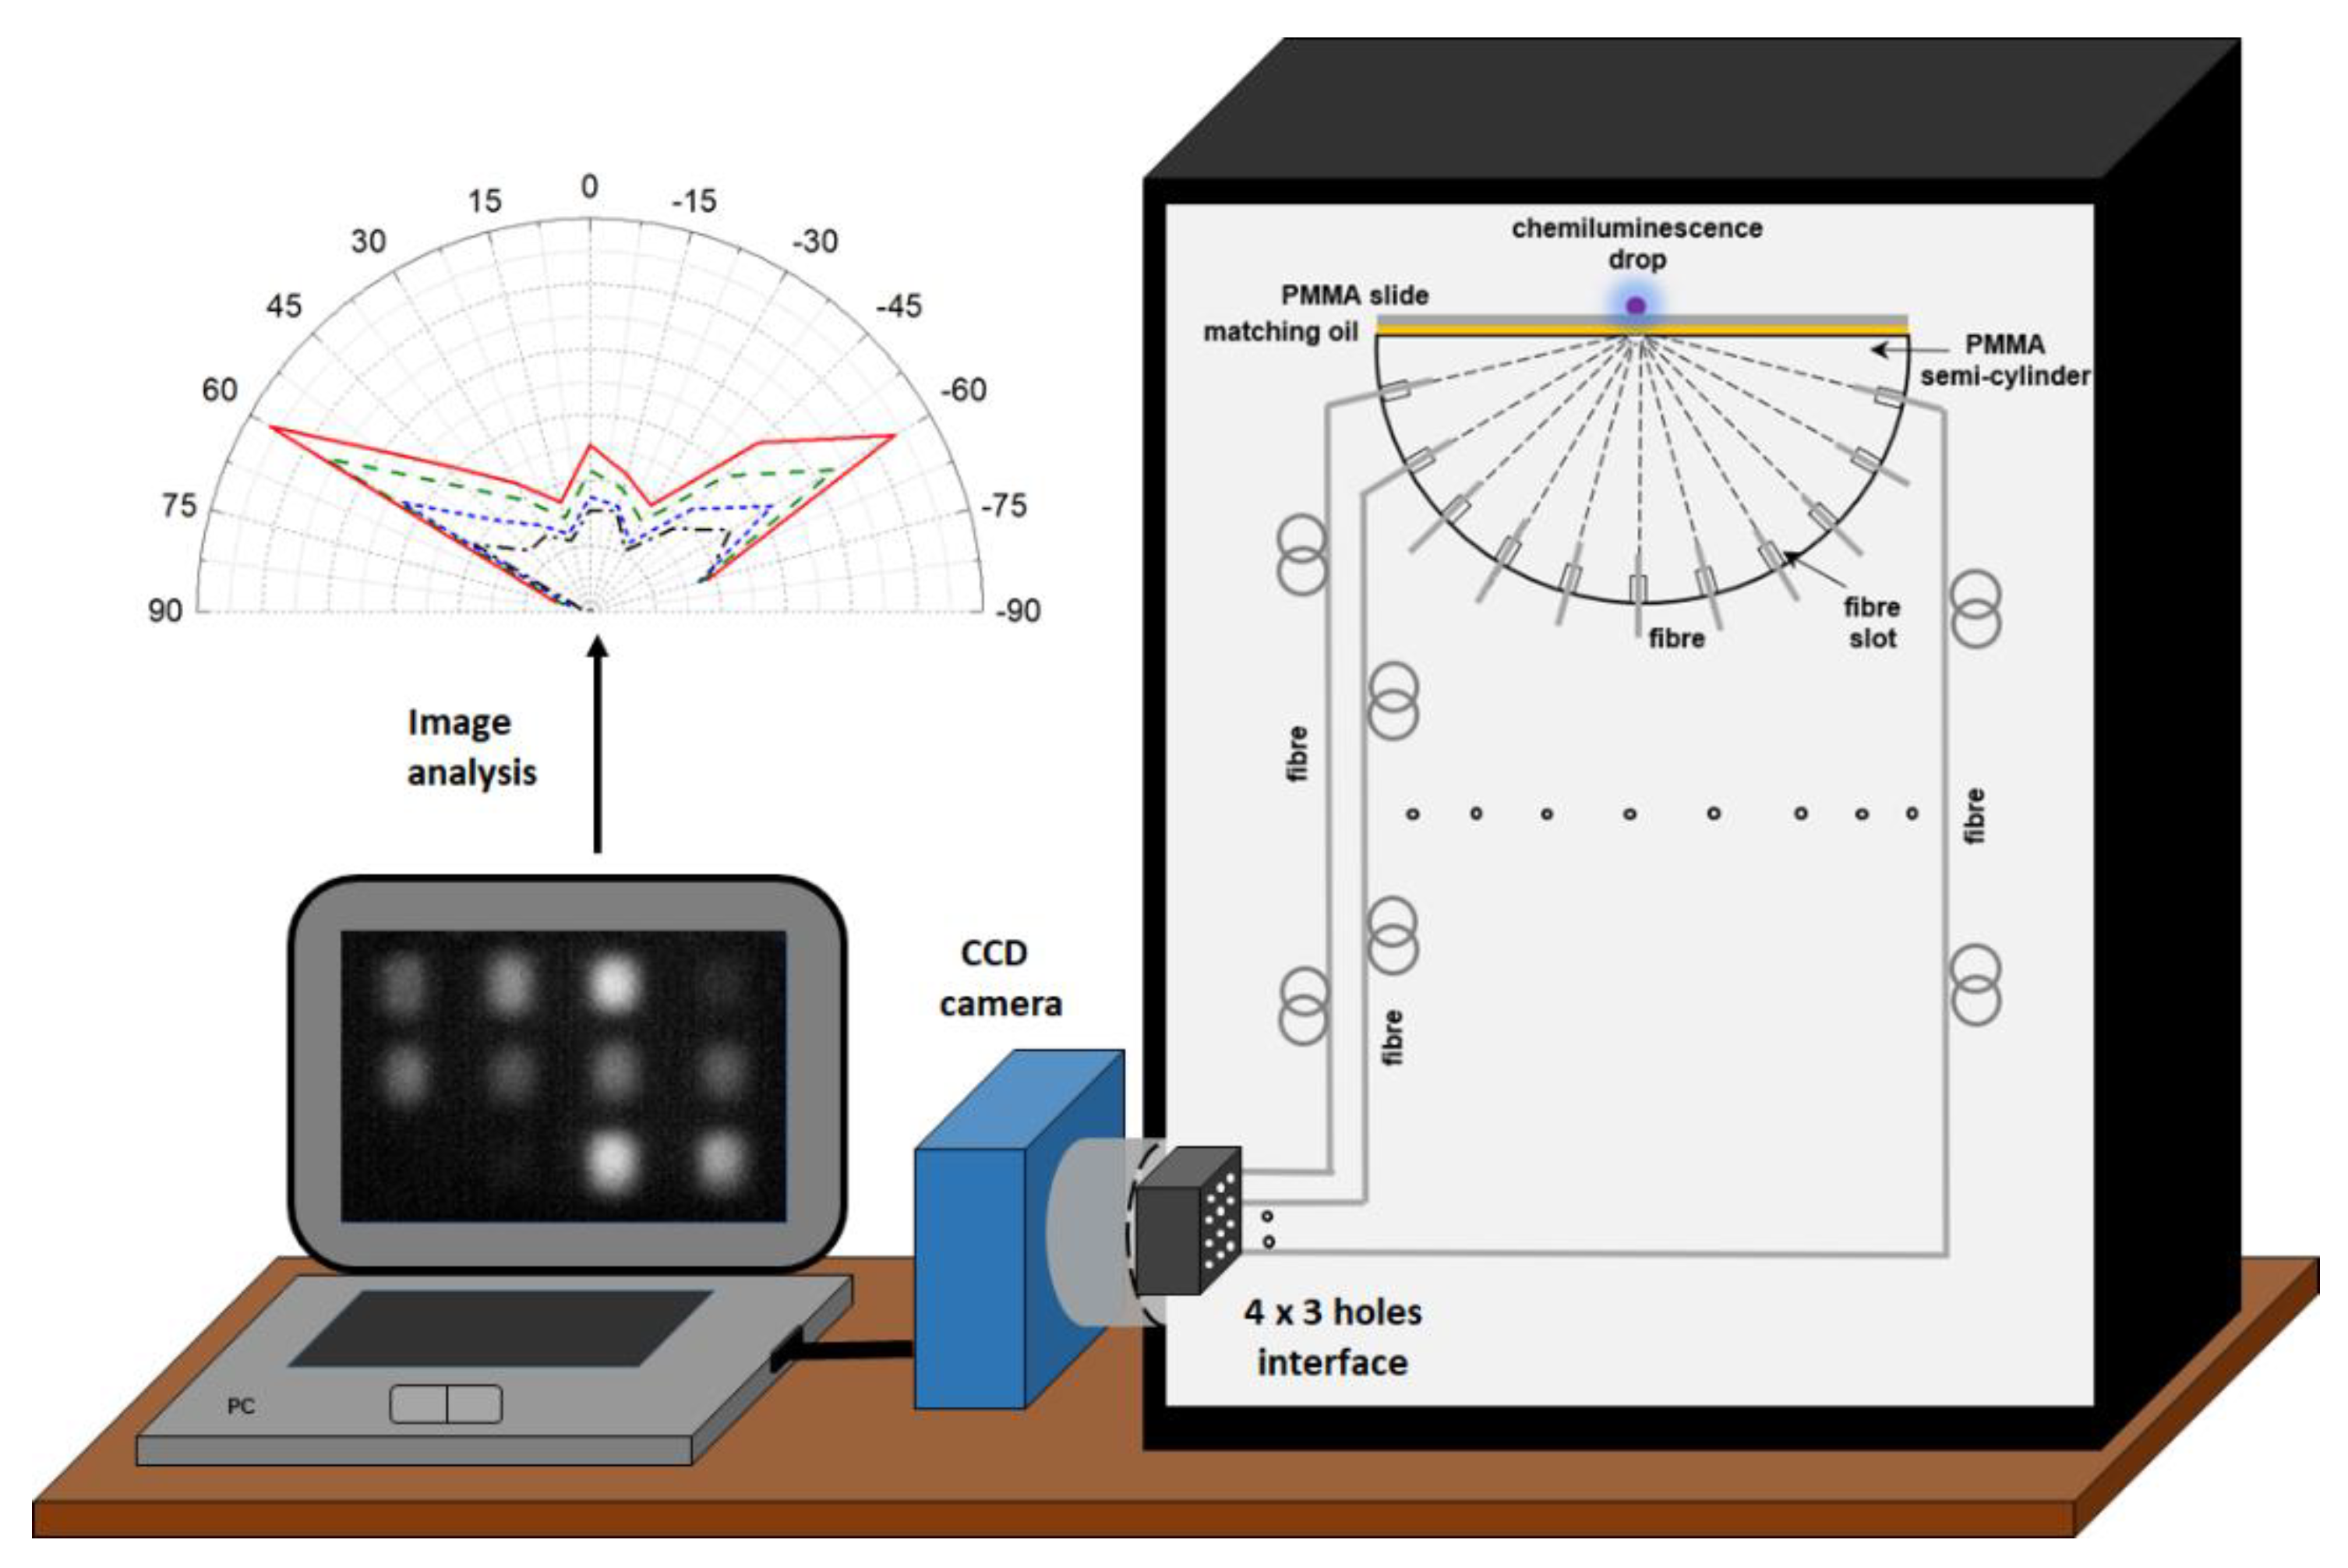
Abstract
:1. Introduction
2. Materials and Methods
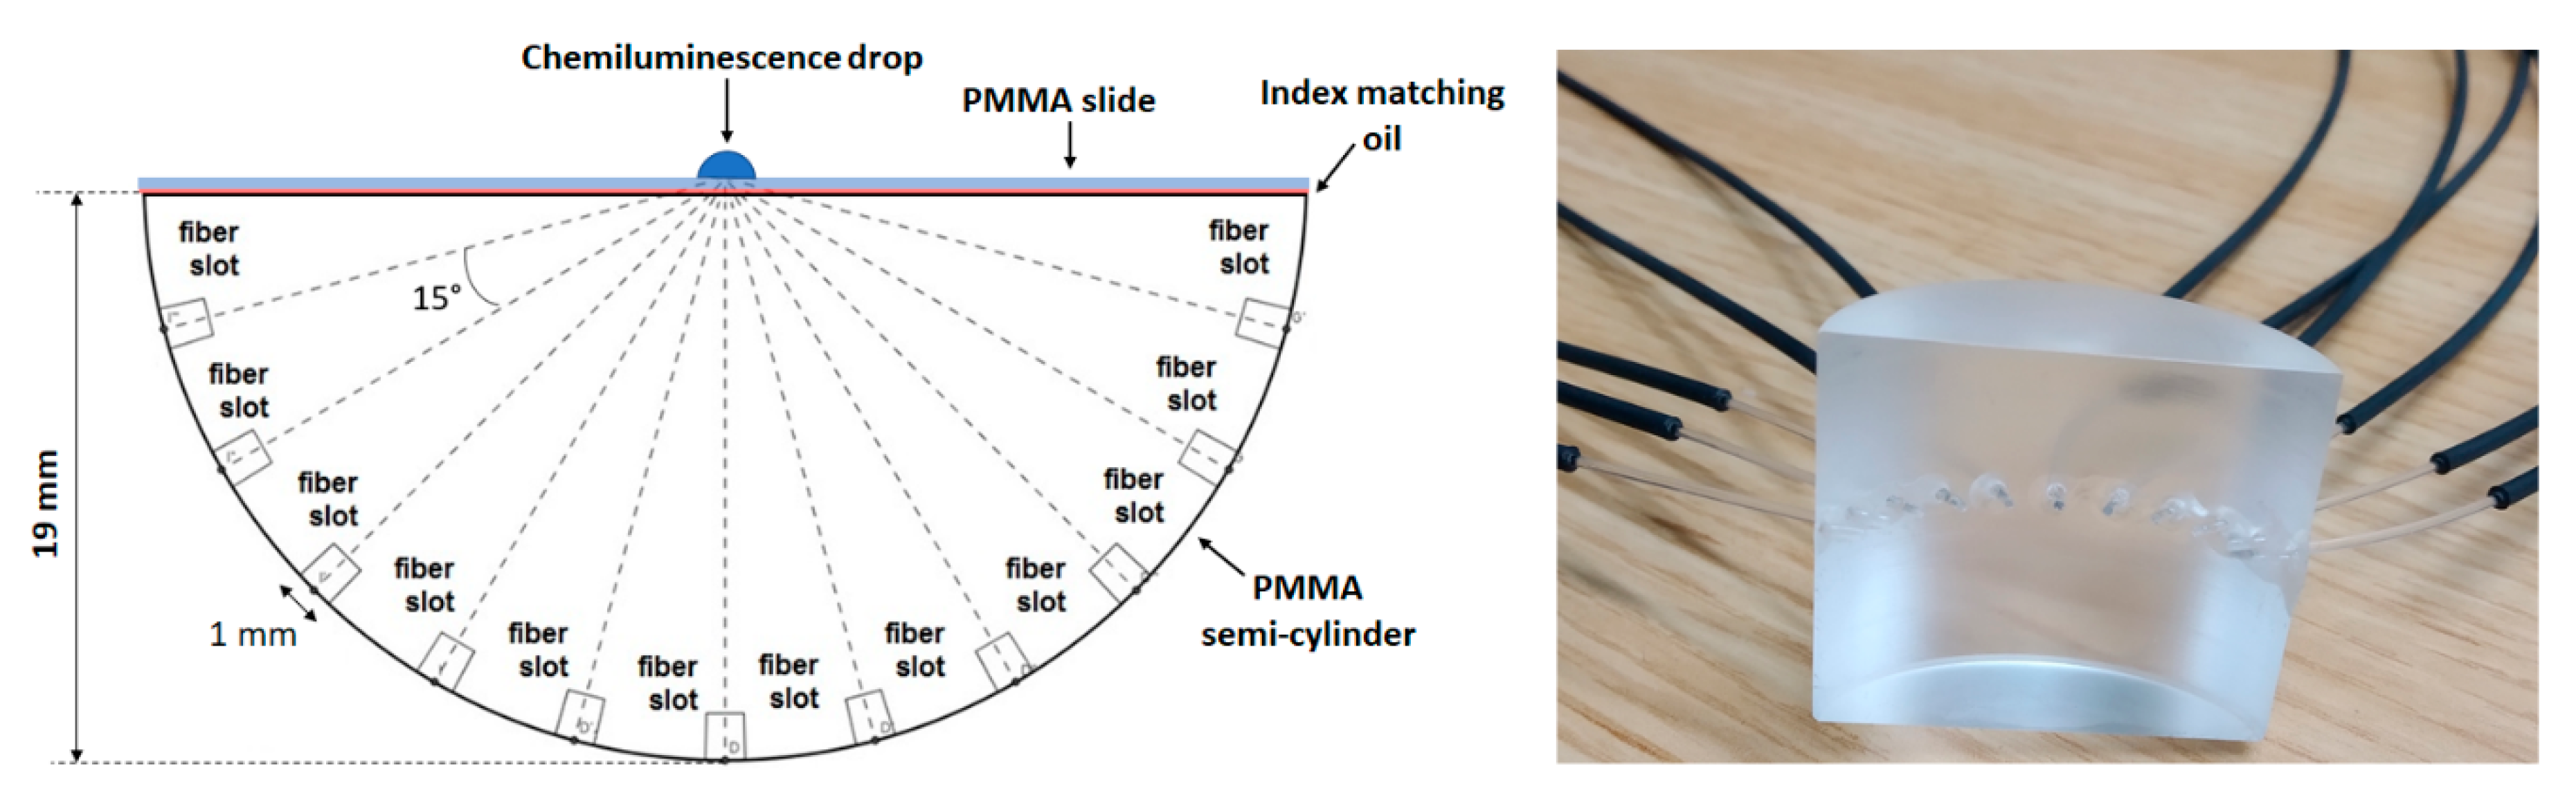
2.1. Optical Setup and Methods
2.2. Reagents and Reaction Protocols
2.3. Signal Acquisition and Processing
3. Results and Discussion
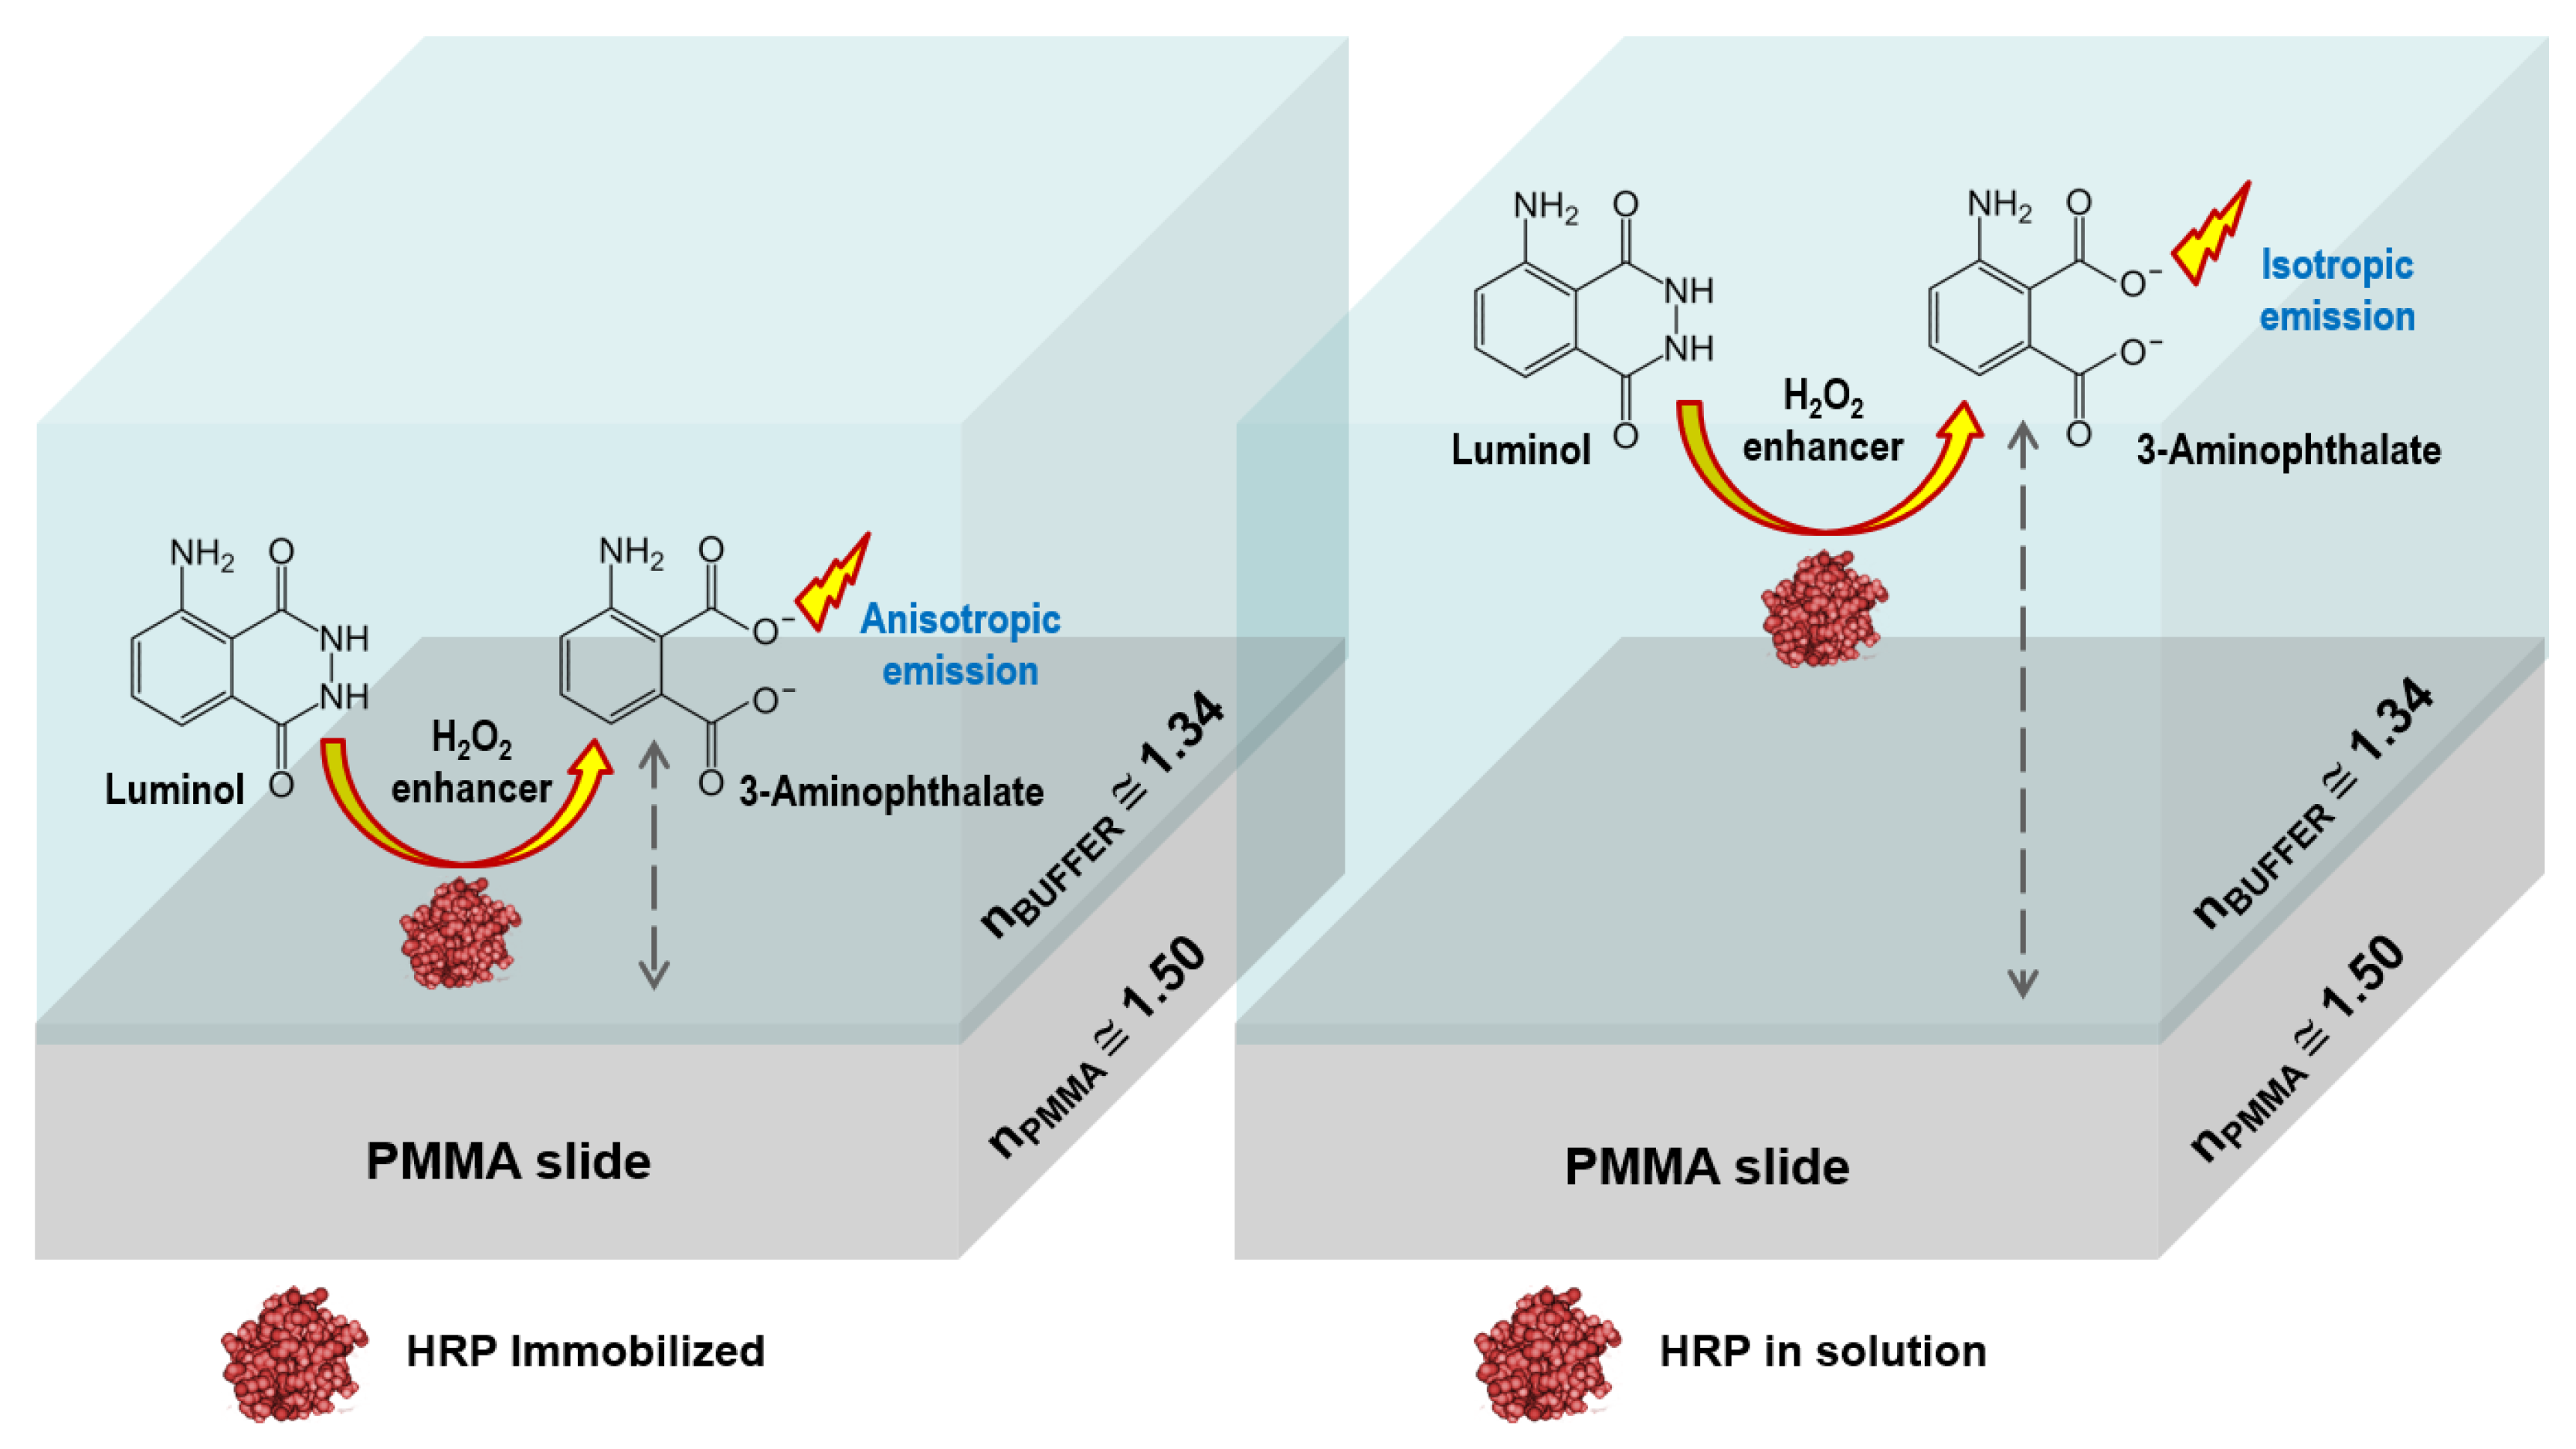
3.1. Chemiluminescence Systems
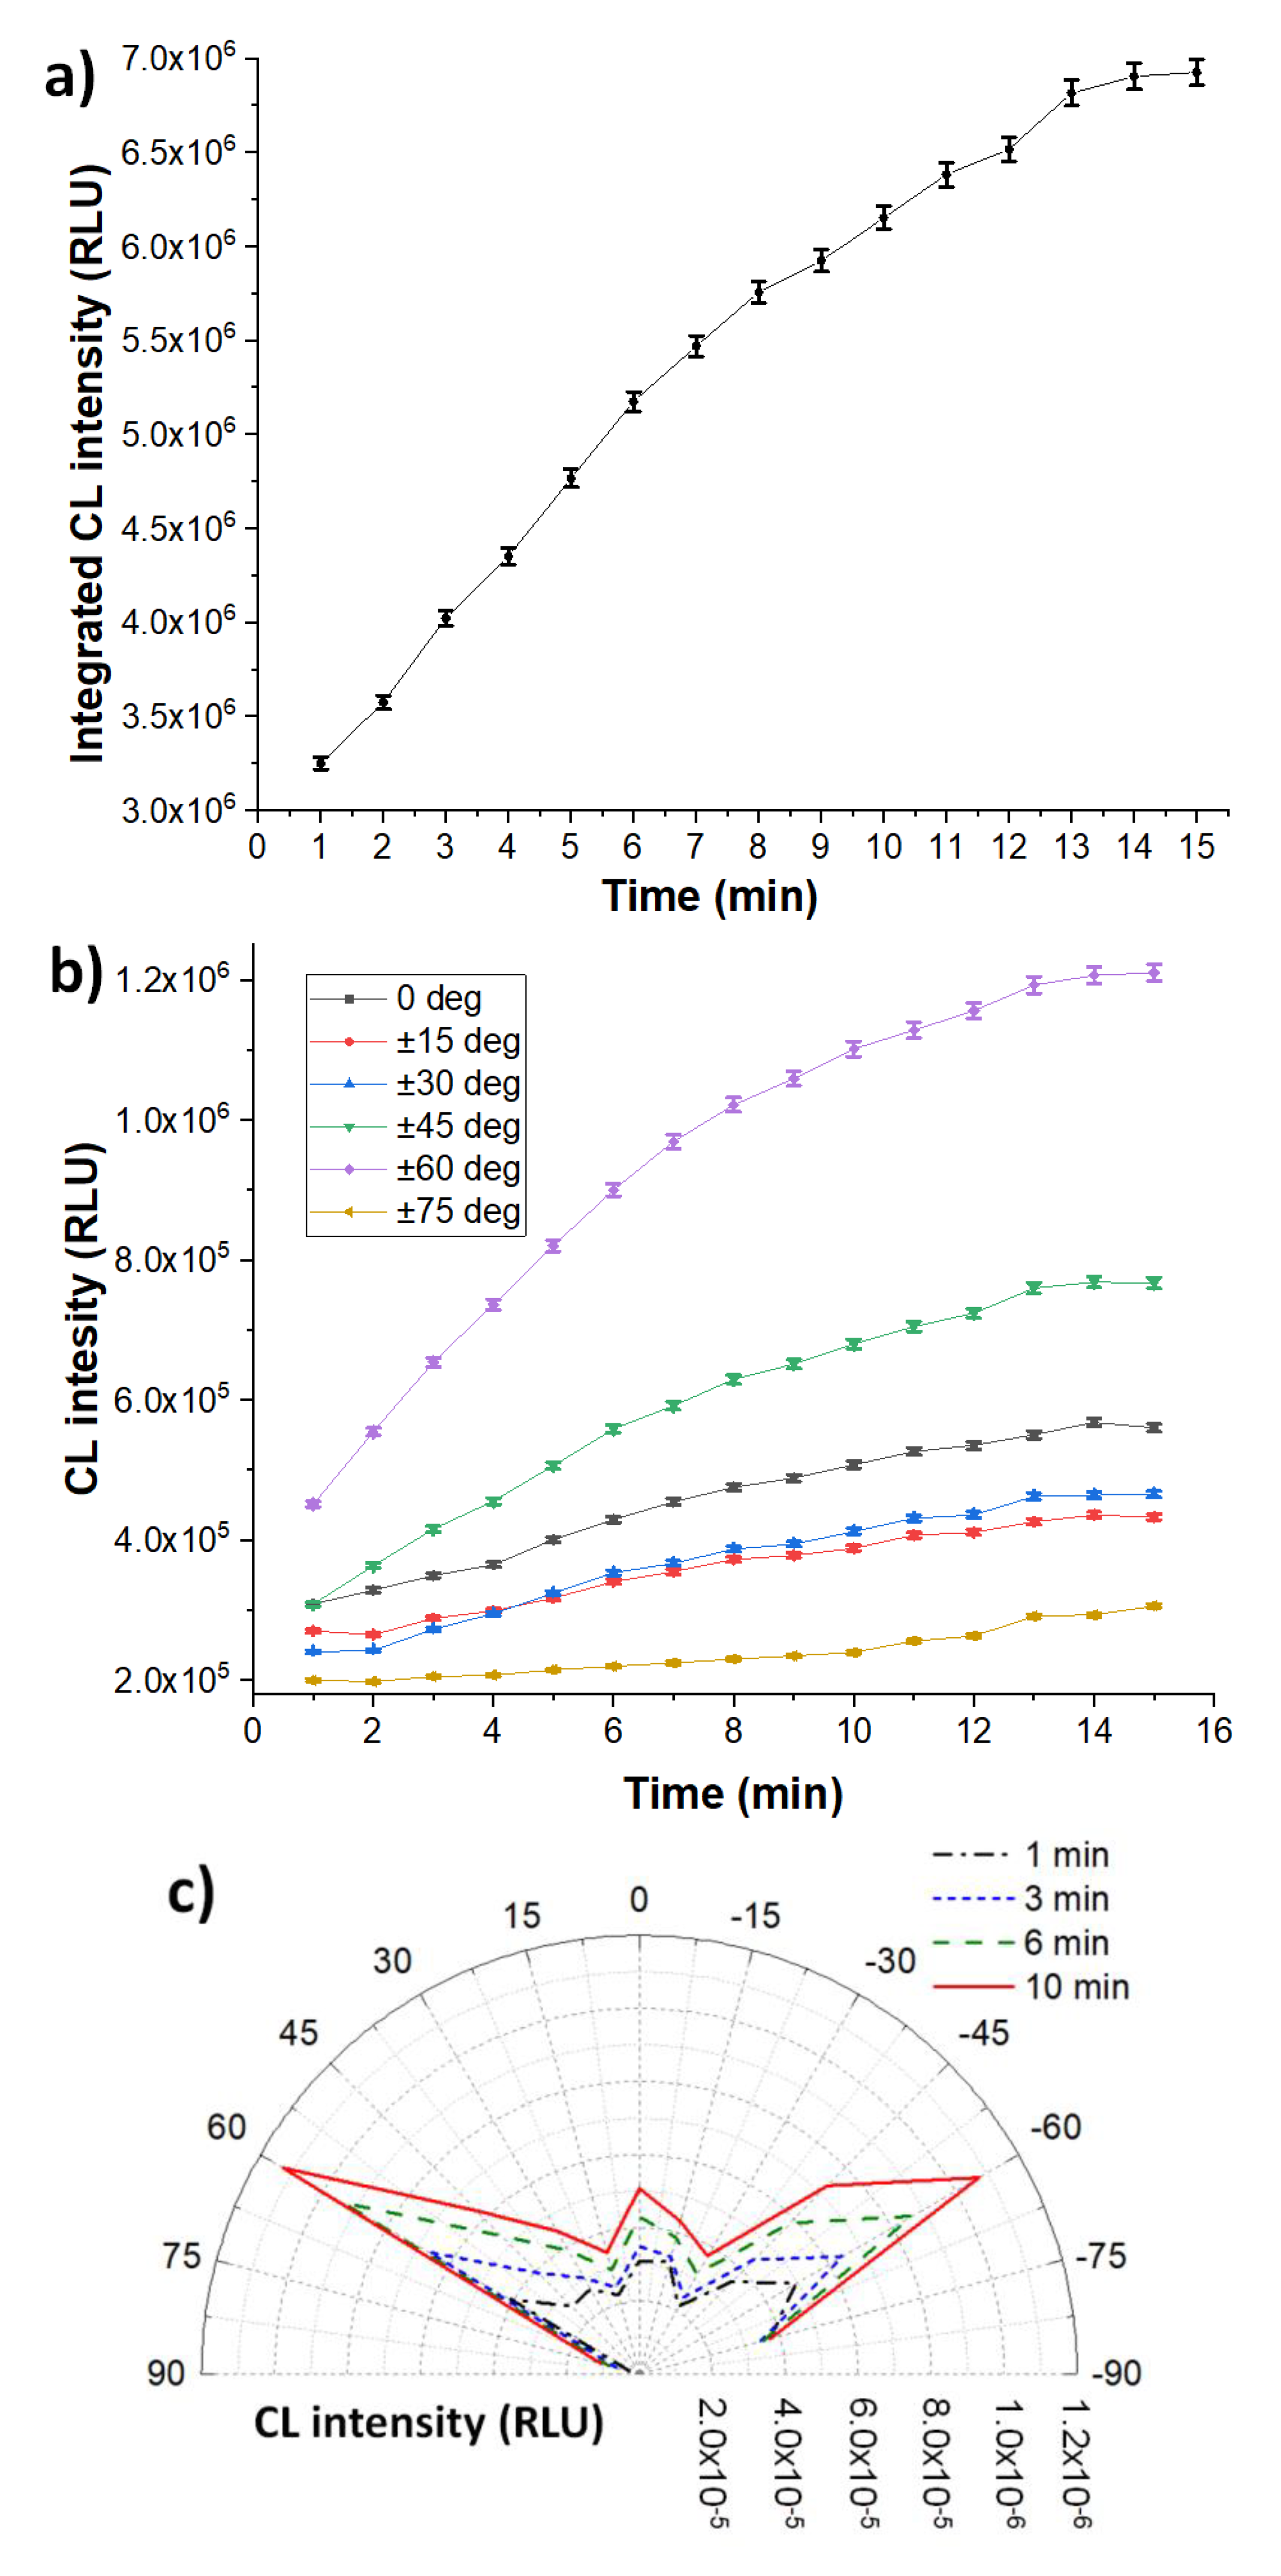
3.2. Heterogeneous Configuration
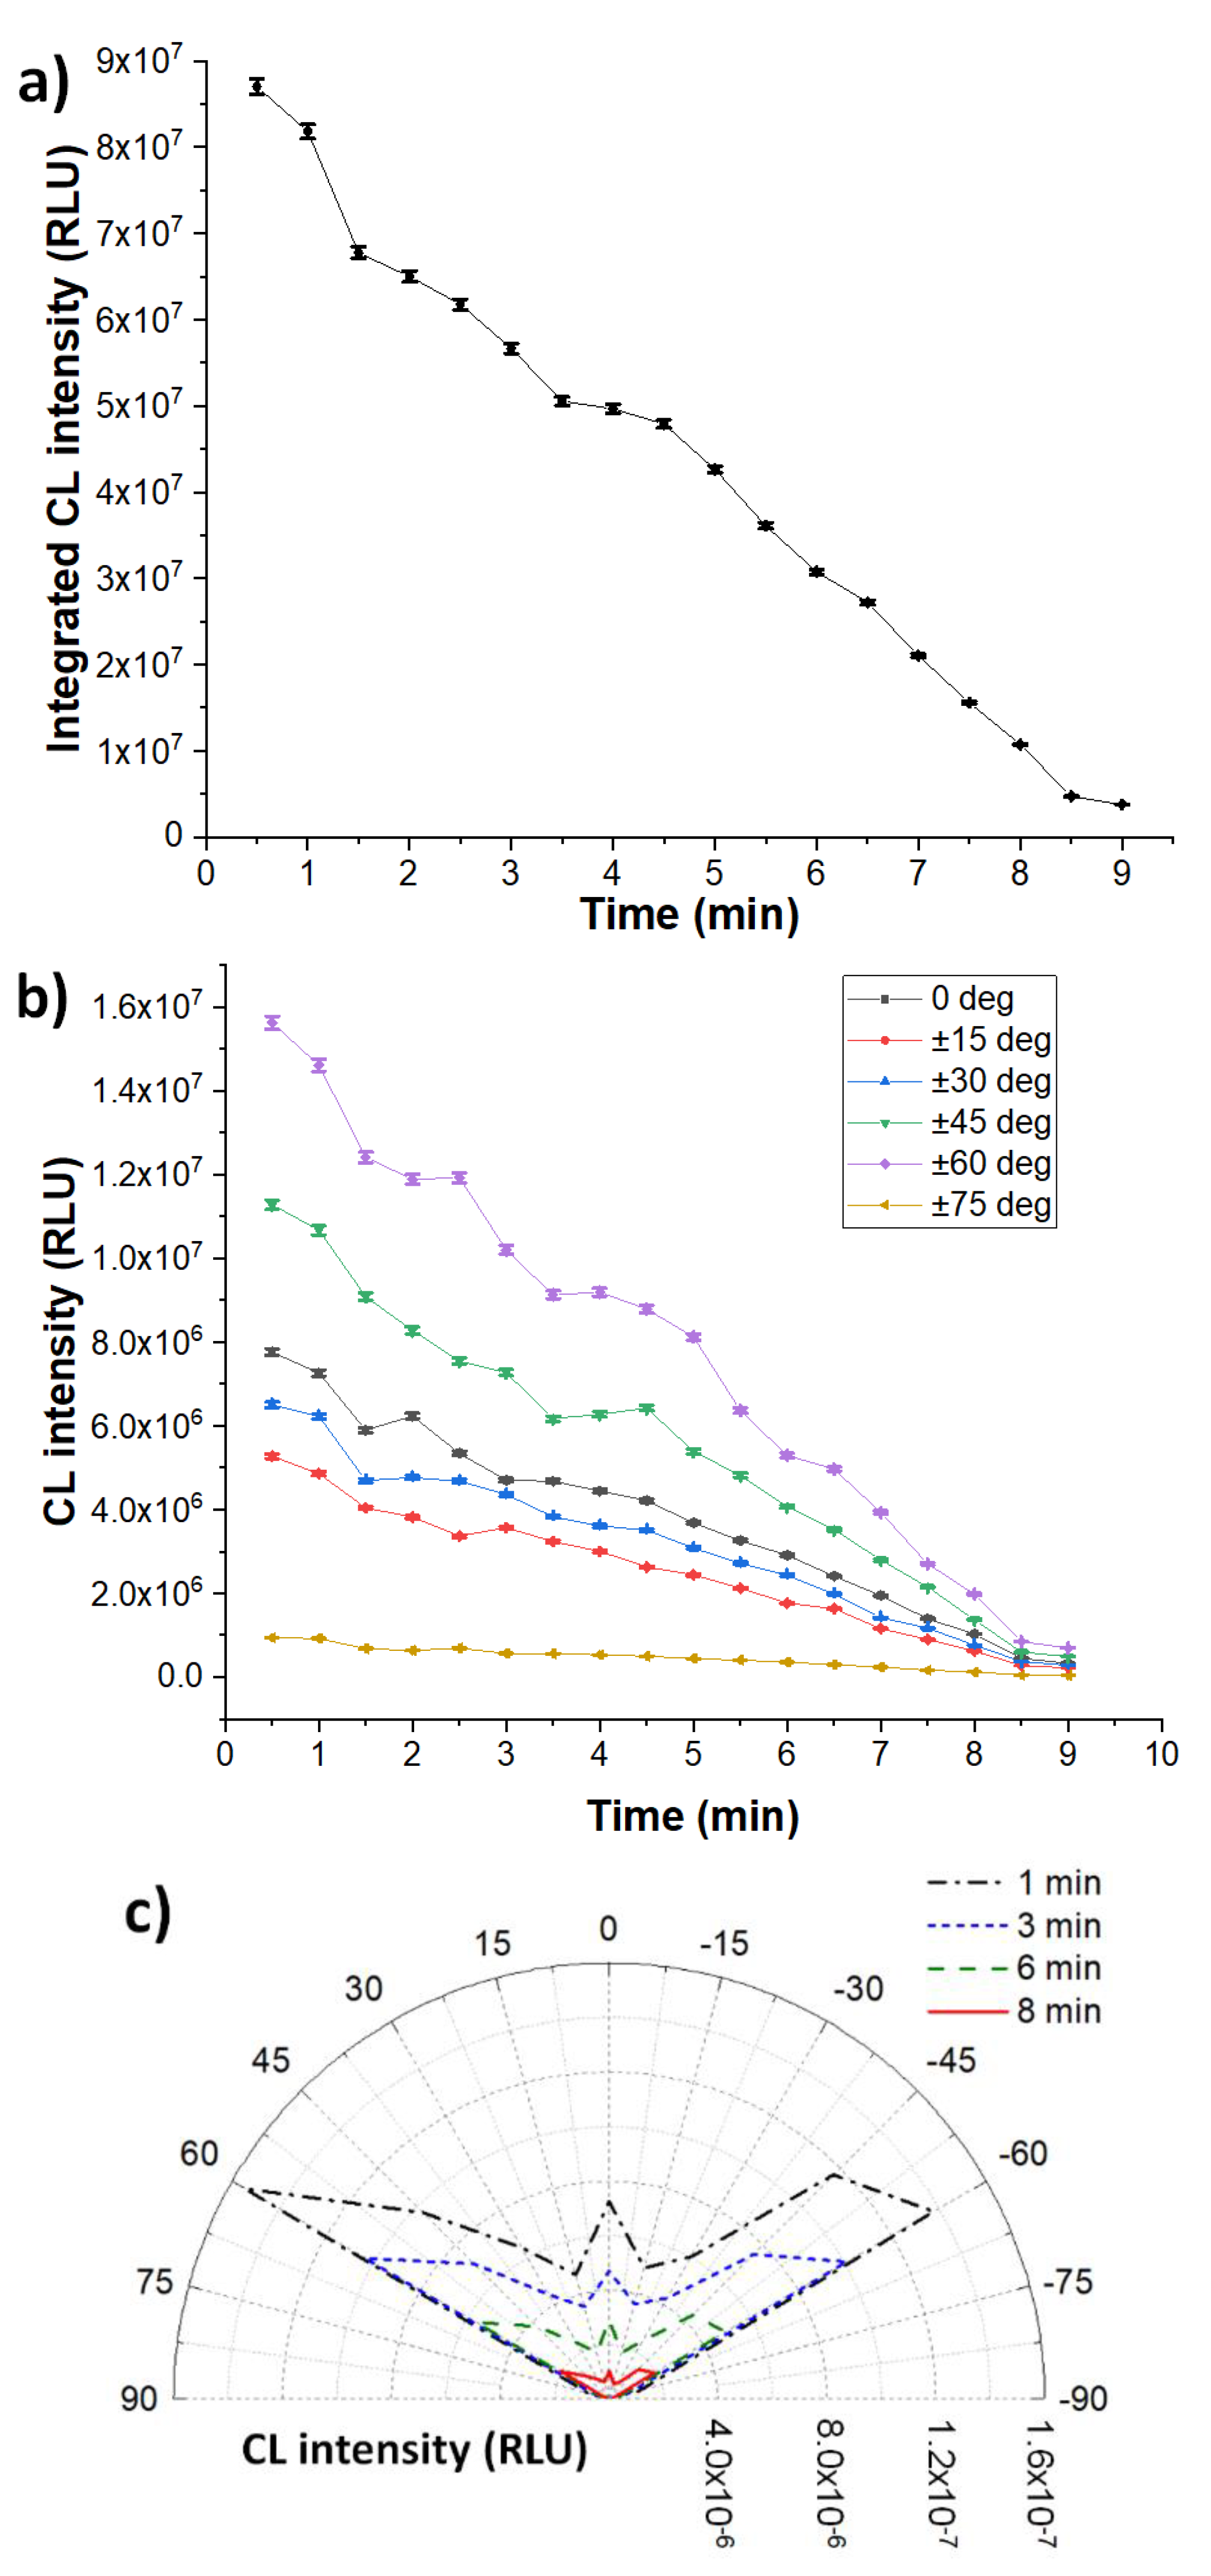
3.3. Homogeneous Configuration
4. Conclusions
Author Contributions
Funding
Conflicts of Interest
References
- Pinto Da Silva, L.; Esteves Da Silva, J.C.G. Firefly chemiluminescence and bioluminescence: Efficient generation of excited states. ChemPhysChem 2012, 13, 2257–2262. [Google Scholar] [CrossRef]
- Vacher, M.; Fdez Galván, I.; Ding, B.W.; Schramm, S.; Berraud-Pache, R.; Naumov, P.; Ferré, N.; Liu, Y.J.; Navizet, I.; Roca-Sanjuán, D.; et al. Chemi- and Bioluminescence of Cyclic Peroxides. Chem. Rev. 2018, 118, 6927–6974. [Google Scholar] [CrossRef]
- Magalhães, C.M.; Esteves da Silva, J.C.G.; Pinto da Silva, L. Chemiluminescence and Bioluminescence as an Excitation Source in the Photodynamic Therapy of Cancer: A Critical Review. ChemPhysChem 2016, 2286–2294. [Google Scholar] [CrossRef]
- Pires, N.; Dong, T.; Hanke, U.; Hoivik, N. Recent Developments in Optical Detection Technologies in Lab-on-a-Chip Devices for Biosensing Applications. Sensors 2014, 14, 15458–15479. [Google Scholar] [CrossRef] [Green Version]
- Mirasoli, M.; Guardigli, M.; Michelini, E.; Roda, A. Recent advancements in chemical luminescence-based lab-on-chip and microfluidic platforms for bioanalysis. J. Pharm. Biomed. Anal. 2014, 87, 36–52. [Google Scholar] [CrossRef]
- Roda, A.; Mirasoli, M.; Michelini, E.; Di Fusco, M.; Zangheri, M.; Cevenini, L.; Roda, B.; Simoni, P. Progress in chemical luminescence-based biosensors: A critical review. Biosens. Bioelectron. 2016, 76, 164–179. [Google Scholar] [CrossRef]
- Alahmad, W.; Uraisin, K.; Nacapricha, D.; Kaneta, T. A miniaturized chemiluminescence detection system for a microfluidic paper-based analytical device and its application to the determination of chromium(III). Anal. Methods 2016, 8, 5414–5420. [Google Scholar] [CrossRef]
- Marquette, C.A.; Blum, L.J. Chemiluminescent enzyme immunoassays: a review of bioanalytical applications. Bioanalysis 2009, 1, 1259–1269. [Google Scholar] [CrossRef]
- Chong, R.; Rho, J.E.R.; Yoon, H.J.; Rho, T.H.D.; Park, P.S.; Kim, Y.H.; Lee, J.H. 1,1’-Oxalyldiimidazole chemiluminescent enzyme immunoassay capable of simultaneously sensing multiple markers. Biosens. Bioelectron. 2012, 32, 19–23. [Google Scholar] [CrossRef]
- Fereja, T.H.; Hymete, A.; Gunasekaran, T. A Recent Review on Chemiluminescence Reaction, Principle and Application on Pharmaceutical Analysis. ISRN Spectrosc. 2013, 2013, 1–12. [Google Scholar] [CrossRef] [Green Version]
- Xie, H.; Wang, Z.; Kong, W.; Wang, L.; Fu, Z. A novel enzyme-immobilized flow cell used as end-column chemiluminescent detection interface in open-tubular capillary electrochromatography. Analyst 2013, 138, 1107–1113. [Google Scholar] [CrossRef] [PubMed]
- Zangheri, M.; Di Nardo, F.; Mirasoli, M.; Anfossi, L.; Nascetti, A.; Caputo, D.; De Cesare, G.; Guardigli, M.; Baggiani, C.; Roda, A. Chemiluminescence lateral flow immunoassay cartridge with integrated amorphous silicon photosensors array for human serum albumin detection in urine samples. Anal. Bioanal. Chem. 2016, 408, 8869–8879. [Google Scholar] [CrossRef] [PubMed] [Green Version]
- Lukosz, W.; Kunz, R.E. Light emission by magnetic and electric dipoles close to a plane dielectric interface II Radiation patterns of perpendicuar oriented dipoles. J. Opt. Soc. Am. 1977, 67, 1615–1619. [Google Scholar] [CrossRef]
- Lukosz, W. Light emission by magnetic and electric dipoles close to a plane dielectric interface III Radiation patterns of dipoles with arbitrary orientation. J. Opt. Soc. Am. 1979, 69, 1495. [Google Scholar] [CrossRef]
- Thompson, N.L.; Burghardt, T.P. Measurement of spatial and orientational distribution of fluorophores near planar dielectric interfaces. Biophys. Chem. 1986, 25, 91–97. [Google Scholar] [CrossRef]
- Enderlein, J.; Ruckstuhl, T.; Seeger, S. Highly efficient optical detection of surface-generated fluorescence. Appl. Opt. 1999, 38, 724. [Google Scholar] [CrossRef]
- Polerecký, L.; Hamrle, J.; MacCraith, B.D. Theory of the radiation of dipoles placed within a multilayer system. Appl. Opt. 2000, 39, 3968. [Google Scholar] [CrossRef]
- Blue, R.; Kent, N.; Polerecky, L.; McEvoy, H.; Gray, D.; MacCraith, B.D. Platform for enhanced detection efficiency in luminescence-based sensors. Electr. Lett. 2005, 41, 682–684. [Google Scholar] [CrossRef]
- Dasallas, L.L.; Jaculbia, R.B.; Balois, M.V.; Garcia, W.O.; Hayazawa, N. Position, orientation, and relative quantum yield ratio determination of fluorescent nanoemitters via combined laser scanning microscopy and polarization measurements. Opt. Mater. Express 2018, 8, 1290. [Google Scholar] [CrossRef]
- Ruckstuhl, T.; Verdes, D. Supercritical angle fluorescence (SAF) microscopy. Opt. Express 2004, 12, 4246. [Google Scholar] [CrossRef]
- Winterflood, C.M.; Ruckstuhl, T.; Verdes, D.; Seeger, S. Nanometer axial resolution by three-dimensional supercritical angle fluorescence microscopy. Phys. Rev. Lett. 2010, 105, 1–4. [Google Scholar] [CrossRef] [PubMed] [Green Version]
- Bourg, N.; Mayet, C.; Dupuis, G.; Barroca, T.; Bon, P.; Lécart, S.; Fort, E.; Lévêque-Fort, S. Direct optical nanoscopy with axially localized detection. Nat. Photonics 2015, 9, 587–593. [Google Scholar] [CrossRef] [Green Version]
- James Shirley, F.; Neutens, P.; Vos, R.; Mahmud-Ul-Hasan, M.; Lagae, L.; Verellen, N.; Van Dorpe, P. Supercritical Angle Fluorescence Characterization Using Spatially Resolved Fourier Plane Spectroscopy. Anal. Chem. 2018, 90, 4263–4267. [Google Scholar] [CrossRef] [PubMed] [Green Version]
- Bernini, R.; Cennamo, N.; Minardo, A.; Zeni, L. Planar waveguides for fluorescence-based biosensing: Optimization and analysis. IEEE Sens. J. 2006, 6, 1218–1225. [Google Scholar] [CrossRef]
- Kurzbuch, D.; Bakker, J.; Melin, J.; Jönsson, C.; Ruckstuhl, T.; MacCraith, B.D. A biochip reader using super critical angle fluorescence. Sens. Actuators B Chem. 2009, 137, 1–6. [Google Scholar] [CrossRef]
- Baldini, F.; Carloni, A.; Giannetti, A.; Porro, G.; Trono, C. An optical PMMA biochip based on fluorescence anisotropy: Application to C-reactive protein assay. Sens. Actuators B Chem. 2009, 139, 64–68. [Google Scholar] [CrossRef]
- Zhou, X.-H.; Liu, L.-H.; Xu, W.-Q.; Song, B.-D.; Sheng, J.-W.; He, M.; Shi, H.-C. A reusable evanescent wave immunosensor for highly sensitive detection of bisphenol A in water samples. Sci. Rep. 2014, 4, 17–20. [Google Scholar] [CrossRef]
- Hung, T.Q.; Sun, Y.; Poulsen, C.E.; Linh-Quyen, T.; Chin, W.H.; Bang, D.D.; Wolff, A. Miniaturization of a micro-optics array for highly sensitive and parallel detection on an injection moulded lab-on-a-chip. Lab Chip 2015, 15, 2445–2451. [Google Scholar] [CrossRef] [Green Version]
- Nguyen, T.; Anh Ngo, T.; Duong Bang, D.; Wolff, A. Optimising the supercritical angle fluorescence structures in polymer microfluidic biochips for highly sensitive pathogen detection: A case study on: Escherichia coli. Lab Chip 2019, 19, 3825–3833. [Google Scholar] [CrossRef] [Green Version]
- Roda, A.; Pasini, P.; Baraldini, M.; Musiani, M.; Gentilomi, G.; Robert, C. Chemiluminescent imaging of enzyme-labeled probes using an optical microscope-videocamera luminograph. Anal. Biochem. 1998, 257, 53–62. [Google Scholar] [CrossRef]
- Chowdhury, M.H.; Malyn, S.N.; Aslan, K.; Lakowicz, J.R.; Geddes, C.D. Multicolor directional surface plasmon-coupled chemiluminescence. J. Phys. Chem. B 2006, 110, 22644–22651. [Google Scholar] [CrossRef] [PubMed] [Green Version]
- Chowdhury, M.H.; Malyn, S.N.; Aslan, K.; Lakowicz, J.R.; Geddes, C.D. First observation of surface plasmon-coupled chemiluminescence (SPCC). Chem. Phys. Lett. 2007, 435, 114–118. [Google Scholar] [CrossRef] [PubMed] [Green Version]
- Roda, A.; Mirasoli, M.; Dolci, L.S.; Buragina, A.; Bonvicini, F.; Simoni, P.; Guardigli, M. Portable device based on chemiluminescence lensless imaging for personalized diagnostics through multiplex bioanalysis. Anal. Chem. 2011, 83, 3178–3185. [Google Scholar] [CrossRef] [PubMed]
- Schneider, C.A.; Rasband, W.S.; Eliceiri, K.W. NIH Image to ImageJ: 25 years of image analysis. Nat. Methods 2012, 9, 671–675. [Google Scholar] [CrossRef]
- Adam, W.; Bronstein, I.; Edwards, B.; Engel, T.; Reinhardt, D.; Schneider, F.W.; Trofimov, A.V.; Vasil’ev, R.F. Electron exchange luminescence of spiroadamantane-substituted dioxetanes triggered by alkaline phosphatases. Kinetics and elucidation of pH effects. J. Am. Chem. Soc. 1996, 118, 10400–10407. [Google Scholar] [CrossRef]
- Marzocchi, E.; Grilli, S.; Della Ciana, L.; Prodi, L.; Mirasoli, M.; Roda, A. Chemiluminescent detection systems of horseradish peroxidase employing nucleophilic acylation catalysts. Anal. Biochem. 2008, 377, 189–194. [Google Scholar] [CrossRef]
- Roda, A.; Pasini, P.; Musiani, M.; Girotti, S.; Baraldini, M.; Carrea, G.; Suozzi, A. Chemiluminescent low-light imaging of biospecific reactions on macro- and microsamples using a videocamera-based luminograph. Anal. Chem. 1996, 68, 1073–1080. [Google Scholar] [CrossRef]
- Liu, C.; Meenan, B.J. Effect of Air Plasma Processing on the Adsorption Behaviour of Bovine Serum Albumin on Spin-Coated PMMA Surfaces. J. Bionic Eng. 2008, 5, 204–214. [Google Scholar] [CrossRef]
- Palacio, M.; Schricker, S.; Bhushan, B. Morphology and protein adsorption characteristics of block copolymer surfaces. J. Microsc. 2010, 240, 239–248. [Google Scholar] [CrossRef]

© 2020 by the authors. Licensee MDPI, Basel, Switzerland. This article is an open access article distributed under the terms and conditions of the Creative Commons Attribution (CC BY) license (http://creativecommons.org/licenses/by/4.0/).
Share and Cite
Berneschi, S.; Trono, C.; Mirasoli, M.; Giannetti, A.; Zangheri, M.; Guardigli, M.; Tombelli, S.; Marchegiani, E.; Baldini, F.; Roda, A. In-Parallel Polar Monitoring of Chemiluminescence Emission Anisotropy at the Solid–Liquid Interface by an Optical Fiber Radial Array. Chemosensors 2020, 8, 18. https://doi.org/10.3390/chemosensors8010018
Berneschi S, Trono C, Mirasoli M, Giannetti A, Zangheri M, Guardigli M, Tombelli S, Marchegiani E, Baldini F, Roda A. In-Parallel Polar Monitoring of Chemiluminescence Emission Anisotropy at the Solid–Liquid Interface by an Optical Fiber Radial Array. Chemosensors. 2020; 8(1):18. https://doi.org/10.3390/chemosensors8010018
Chicago/Turabian StyleBerneschi, Simone, Cosimo Trono, Mara Mirasoli, Ambra Giannetti, Martina Zangheri, Massimo Guardigli, Sara Tombelli, Elisa Marchegiani, Francesco Baldini, and Aldo Roda. 2020. "In-Parallel Polar Monitoring of Chemiluminescence Emission Anisotropy at the Solid–Liquid Interface by an Optical Fiber Radial Array" Chemosensors 8, no. 1: 18. https://doi.org/10.3390/chemosensors8010018