Article

High Sensitivity Detection of Copper Ions in Oysters Based on the Fluorescence Property of Cadmium Selenide Quantum Dots

1
School of Chemistry and Environment, Guangdong Ocean University, Zhanjiang 524088, China
2
Shenzhen Institute of Guangdong Ocean University, Shenzhen 518108, China
3
College of Food Science and Technology, Guangdong Ocean University, Zhanjiang 524088, China
*
Author to whom correspondence should be addressed.
Chemosensors 2019, 7(4), 47; https://doi.org/10.3390/chemosensors7040047
Submission received: 27 July 2019 / Revised: 17 September 2019 / Accepted: 19 September 2019 / Published: 25 September 2019

Abstract

:
Cadmium selenide (CdSe) quantum dots (QDs) were synthesized by water phase synthesis method using 3-mercaptopropionic acid (3-MPA) as a stabilizer, and they were applied to the detection of copper ions (Cu2+). The results showed that CdSe QDs have excellent selectivity and sensitivity toward Cu2+. The fluorescence intensity of CdSe QDs decreased with the increase of Cu2+ concentration. The linear range was from 30 nM to 3 μM, and the detection limit was 30 nM. Furthermore, CdSe QDs were used for detecting the concentration of Cu2+ in oysters. The content of Cu2+ was 40.91 mg/kg, which was close to the one measured via flame atomic absorption spectrometry (FAAS), and the relative error was 1.81%. Therefore, CdSe QDs have a wide application prospect in the rapid detection of copper ions in food.

1. Introduction

During the last few decades, industrial and urban activities have caused the increase of metal contamination on the marine environment and have had negative ecological effects on coastal ecosystems. Various studies have demonstrated that the heavy metal copper ion content in marine products from industrialized coastal areas exceeds the standard [1,2].
The accumulation of copper ions in the human body is enriched by the food chain, and it then poses a threat to human health [3]. Numerous studies have shown that excessive copper ions can cause oxidative stress in the liver and irreversible hepatotoxicity [4,5], and it can also increase the risk of neurodegenerative diseases such as Alzheimer’s disease, Parkinson’s disease, and prion diseases [6,7]. Therefore, it is necessary to develop a rapid and accurate technique for the detection of copper ions in aquatic products [8,9].
Traditional methods of copper ion (Cu2+) detections mainly include atomic absorption spectrometry (AAS), inductively coupled mass spectroscopy (ICP-MS), and inductively coupled atomic emission spectroscopy (ICP-AES) [10,11]. These methods are not suitable for popularization and utilization due to the expensive instruments, tedious operation process, high technical requirements for operators, and the fact that their use is time-consuming.
Fluorescence spectroscopy has developed quickly during the past decade. Compared to other spectroscopic techniques, fluorescence spectroscopy is more popular due to the availability and simplicity of data acquisition and analysis [12,13]. Quantum dots (QDs), tiny light-emitting particles on the nanometer scale, are also a new class of fluorescent probes [14,15,16]. Compared with fluorescent proteins and other fluorescent probes, there are several unique optical and electronic properties for QDs, including size-tunable light emission, improved signal brightness, resistance against photo bleaching, and simultaneous excitation of multiple fluorescence colors. Recent advances in nanotechnology have led to the development of multifunctional nanoparticle probes that are very bright and stable under complex in vivo conditions [17].
In recent years, QDs have attracted much attention as fluorescent probes in the detection of heavy metal ions [17,18,19]. However, the practical application of QDs to detect Cu2+ in aquatic products has not been further investigated. In this study, cadmium selenide (CdSe) QDs were synthesized by aqueous inorganic method using 3-mercaptopropionic acid (3-MPA) as a stabilizer, and measured their selectivity and sensitivity toward Cu2+. In addition, they were applied to detect the content of Cu2+ in oysters.

2. Materials and Methods

2.1. Materials and Reagents

Sodium borohydride (NaBH4) was purchased from Adamas reagent Co. Ltd (Shanghai, China). Cadmium chloride (99%) was supplied by Tianjin Fuchen Chemical Reagent Factory (Tianjin, China). Perchloric acid, nitric acid, and anhydrous ethanol were all purchased from Guangdong Guanghua technology Co., Ltd (Shenzhen, China). 3-mercaptopropionic acid (3-MPA) was obtained from Shanghai Aladdin Biochemical Technology Co. Ltd (Shanghai China). Selenium powder was purchased from Chengdu Huaxia Chemical Reagent Co. Ltd (Chengdu, China). All chemical reagents were analytical grade and used as received without further purification. The raw oysters were purchased from Huguang market in Zhanjiang, China.

2.2. Synthesis of CdSe QDs

Selenium powder (0.078 g), 0.140 g of NaBH4, and 3 mL of ultrapure water were sequentially added to a 50 mL glass vial. Then, the glass vial was quickly stoppered with a perforated stopper and placed in an ice water bath for 30 min. NaHSe solution was obtained when the solution became clear and transparent.
Thirty-five μL of 3-MPA was added to 100 mL of 4 mM CdCl2 aqueous solution, and the pH was adjusted to 11 with 1 M NaOH. Then, the solution was poured into a three-necked flask and adjusted with pure nitrogen gas for 20 min under magnetic stirring. Freshly prepared NaHSe was added to the stirred solution and reacted at 95 °C for 8 h under the nitrogen.
After the reaction, the CdSe QD solution was mixed with absolute ethanol in a volume ratio of 1:2 and centrifuged at 9000 rpm for 25 min. The yellow-brown precipitate was dissolved in ultrapure water to obtain purified 3-MPA-modified water-soluble CdSe QDs. The prepared CdSe QDs were stored at 4 °C in the dark.

2.3. Instrumentation

The microscopic characteristics of CdSe QDs were determined via high-resolution transmission electron microscope (HRTEM, JEOL JEM-2200FS, Tokyo, Japan) under 200 kV. The yield and lifetime of CdSe QDs were measured by a transient fluorescence spectrometer (FL-TCSPC, HORIBA Jobin Yvon, France). The fluorescence intensity of the solution was measured by a fluorescence spectrophotometer (FL, HITACHI, F-7000, Tokyo, Japan).

2.4. Characterization of QDs

A correlation method was used to determine the fluorescence quantum yield (QY) of nitrogen-doped graphene quantum dots (N-CQDs). The QY of barium sulfate was regarded as a reference. The QY of the sample was calculated by Equation (1):
φ = φ × A I × I A × n 2 n 2
where ϕ represents the QY of the sample, ϕ’ is the QY of barium sulfate, I is the comprehensive emissions intensity of the tested sample, I’ is the comprehensive emission intensity of barium sulfate, n represents the refractive index of the tested sample, n’ is the refraction index of barium sulfate, A is the optical density of the tested sample, and A’ is the optical density of barium sulfate. Absorption at excitation wavelength was always maintained below 0.05 to minimize the resorption effect [19].
QY refers to the ratio of the number of photons emitting fluorescence to the number of photons absorbed, and it is an important parameter for evaluating the optical properties of luminescent nanocrystal [20]. QY is generally measured by reference method [21].
The fluorescence lifetime of a QD is fitted using R(t) = B 1 e ( t τ 1 ) + B 2 e ( t τ 2 ) . Mean fluorescence lifetime τ a v is calculated using Equation (2).
τ a v = B i τ i 2 B i τ i
where τ1 and τ2 represent time constants, respectively, and B1 and B2 represent weights.

2.5. Detection of Different Concentrations of Copper Ion Standard Solution

The fluorescence quenching mechanism of copper ions on QDs is shown in Scheme 1. The structure of 3-MPA contains a mercapto group (-SH) and a carboxyl group (-COOH). The sulfur atom and the oxygen atom are easily coordinated with copper ion in the solution, resulting the change of surface structure or charge of the QDs, thereby affecting the recombination efficiency of electrons and holes. As a result, the fluorescence intensity of QDs will be quenched [22].
Different concentrations of copper ion solution were prepared using ultrapure water. Equal amounts of copper ion solution and quantum dot solution were added to the 10 mL colorimetric tube successively and placed at room temperature for 30 min. The fluorescence intensity of the solution was measured by the fluorescence spectrophotometer (Hitachi, F-7000). A standard curve of copper ion was drawn according to fluorescence intensity. The excitation wavelength of the fluorescence spectrophotometer was 450 nm, the scanning range was 480–650 nm, and the scanning speed was 240 nm/min.
Fluorescence quenching efficiency can be described using Equation (3).
E = F 0 F F 0
where F0 represents the fluorescence intensity of CdSe QDs, F represents the fluorescence intensity of CdSe QDs when different concentrations of Cu2+ were added, E represents the fluorescence quenching efficiency of CdSe QDs.

2.6. Effects of Different Metal Ions on the Fluorescence Intensity of QDs

In order to explore the selectivity of the prepared QDs solution to Cu2+, 5 μM and 10 μM ionic solutions of Ag+, Pb2+, Zn2+, Hg2+, Fe3+, Mn2+, and Co2+ were measured, respectively. The fluorescence intensity was measured under the same conditions and compared with copper ion solution [23].

2.7. Determination of Cu2+ in Oysters

The national standard method (GB 5009.13-2017) was used to verify the reliability of our experimental method (CdSe QDs).
Sample pre-treatment included the following steps: The sample was weighed at 3 g in a conical flask, and 10 mL of nitric acid was added the sample was left overnight. Perchloric acid (0.5 mL) was added and disintegrated on a hot plate. A small amount of nitric acid was added to the digestive juice when it turned brown. Adjusting the temperature of the hot plate appropriately, the white smoke completely disappeared. When the digestive juice turned transparent, the digestion was complete. The same method was used in the control group. After cooling, digestive juice was diluted with ultrapure water to 10 mL [24].
Different concentrations of copper ion standard solutions (0.0, 0.1, 0.2, 0.4, 0.8,and 1.0 μg/mL) were prepared. The copper standard solution was introduced into the flame atomic absorption spectrometry (FAAS) instrument, and the concentration was from low to high. The control group and sample solution were introduced into the atomizer under the same experimental conditions as the standard series. The absorbance values were recorded separately and compared with the standard curve.
The digested samples were measured in parallel three times with CdSe QDs under the same experimental conditions as the standard series of copper ions. The calculated sample concentration was compared with the results measured by FAAS.

3. Results and Discussion

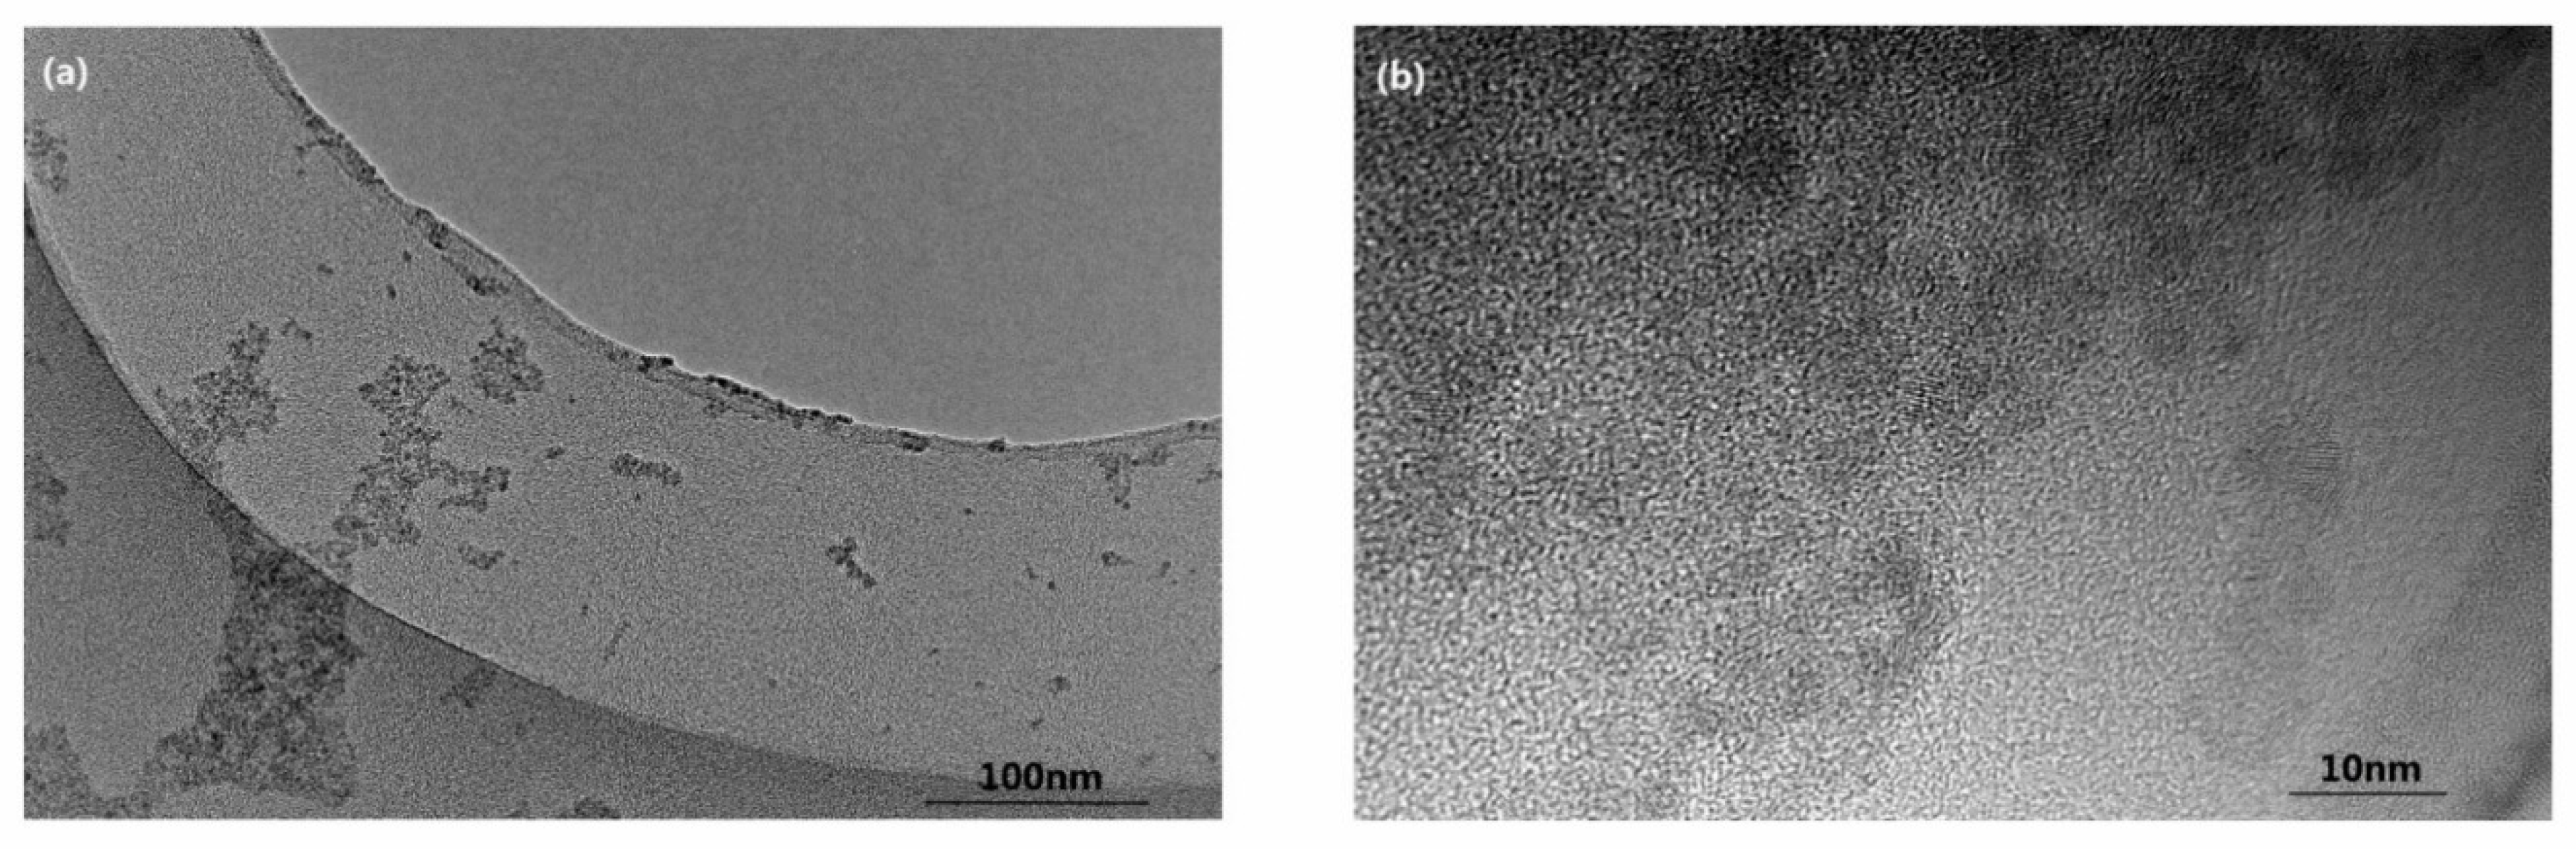
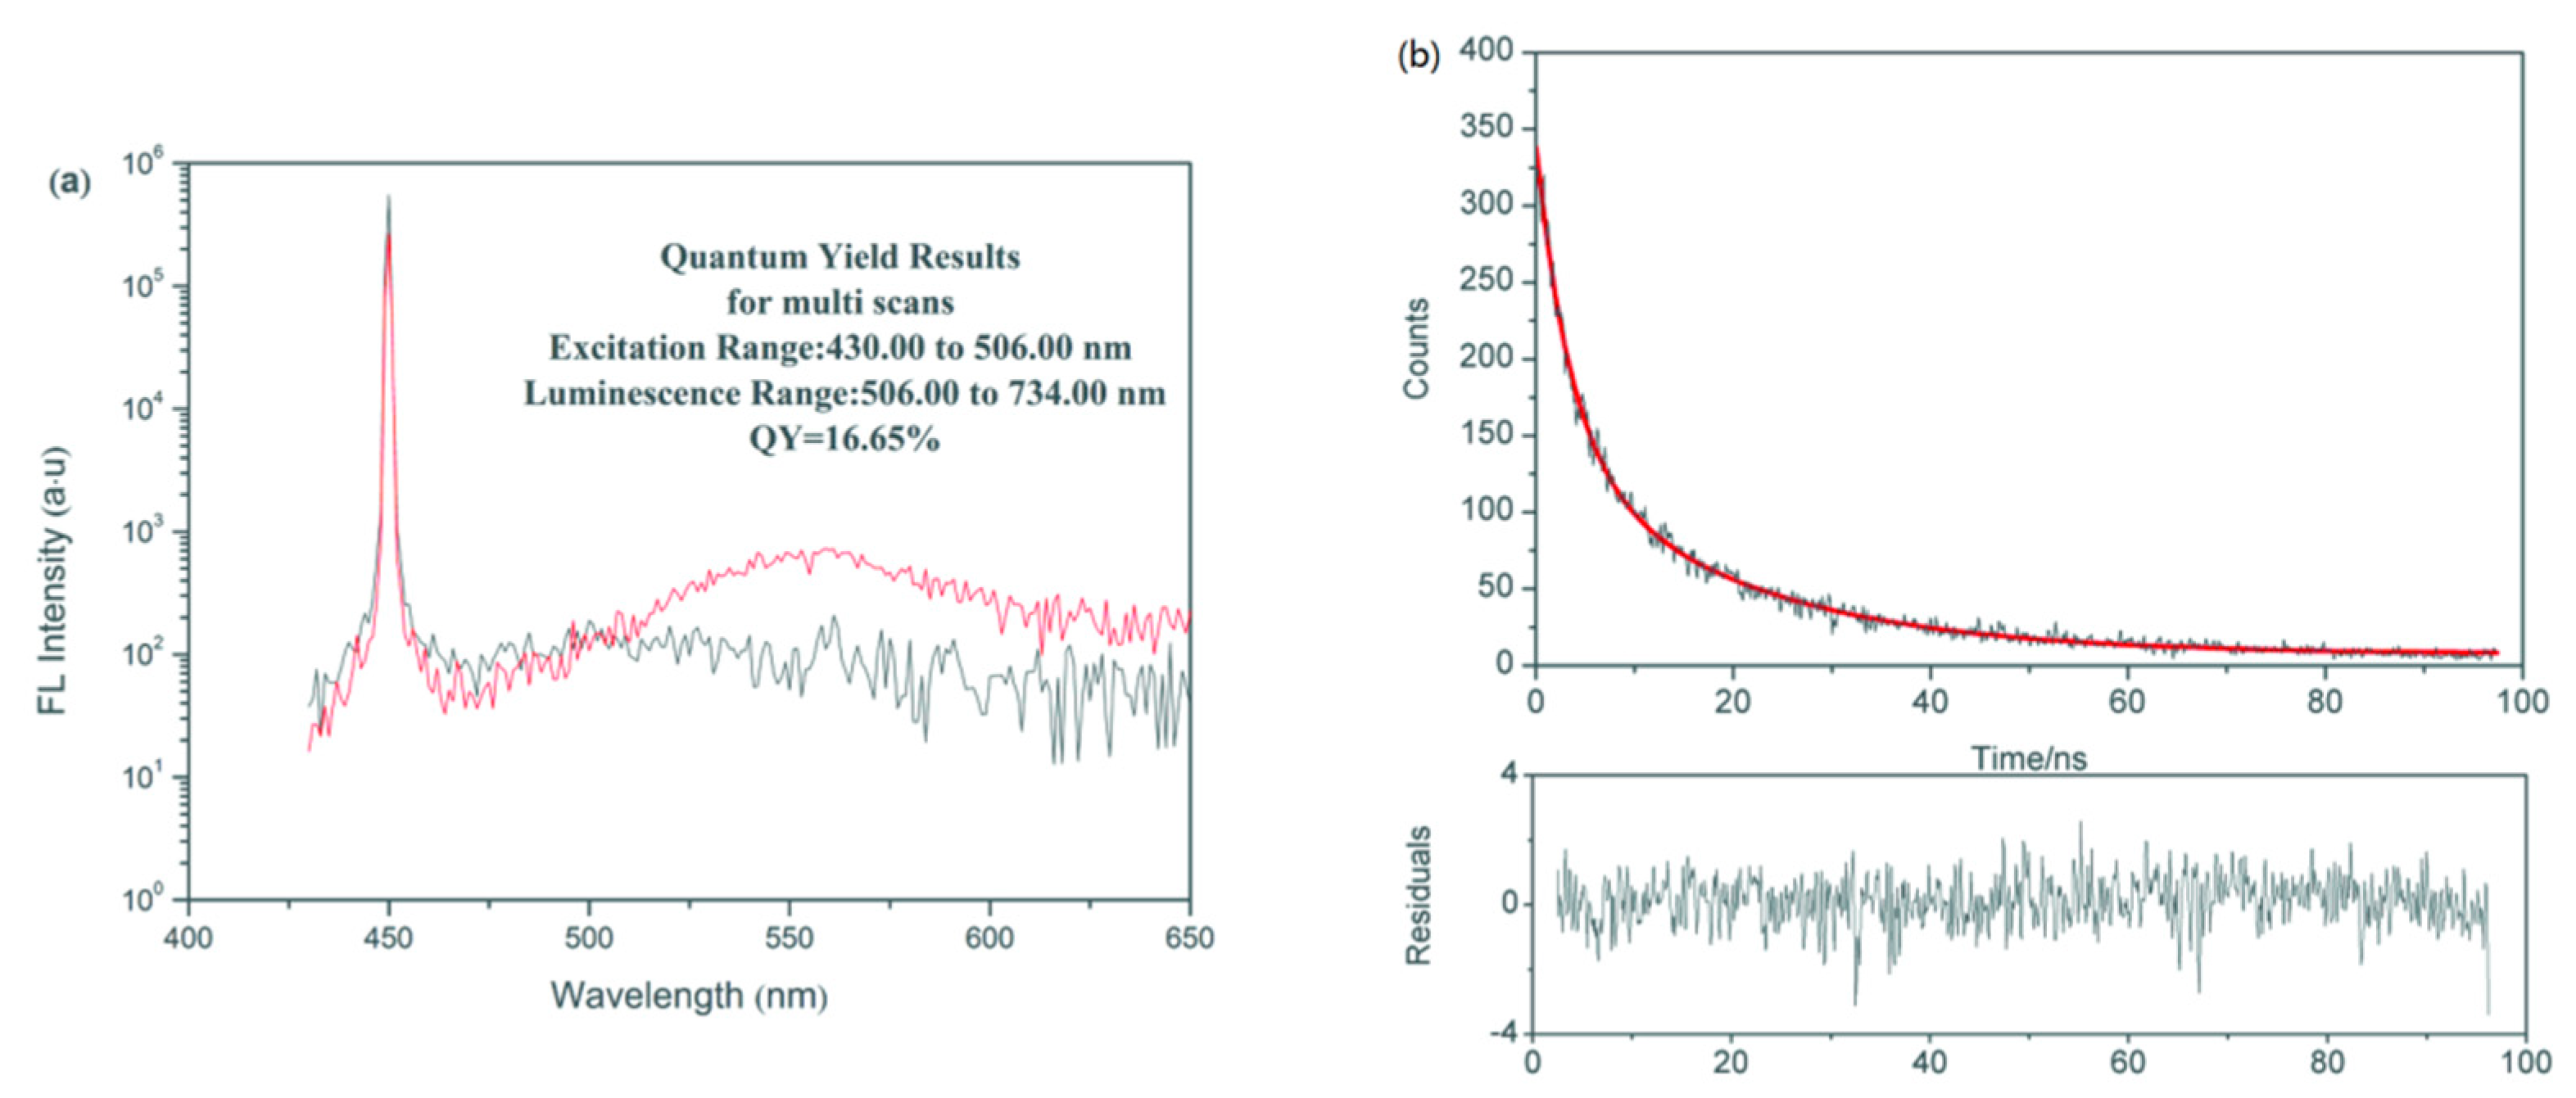
3.1. Characterization of CdSe QDs

The morphology and size of the purified 3-MPA-modified CdSe QDs were characterized by HRTEM. Figure 1a shows that the shape of the CdSe QDs is approximately spherical, with no agglomeration. CdSe QDs have good dispersion, and the size is about 4 nm [25,26]. HRTEM images show ultra-small fringes, which implies that the structure of CdSe QDs is purely crystalline (Figure 1b).
The purified 3-MPA-modified CdSe QDs were detected by transient fluorescence spectrometer (TFS). As shown in Figure 2a, the QY of the QDs is 16.65%. Figure 2b shows the result of the fitting. Fitting parameters of the fluorescence decay curve are shown in Table 1. R2 = 0.99, indicating that the fitting condition is excellent. Mean fluorescence lifetime, τav, of the QDs calculated by formula is 20.59 ns.

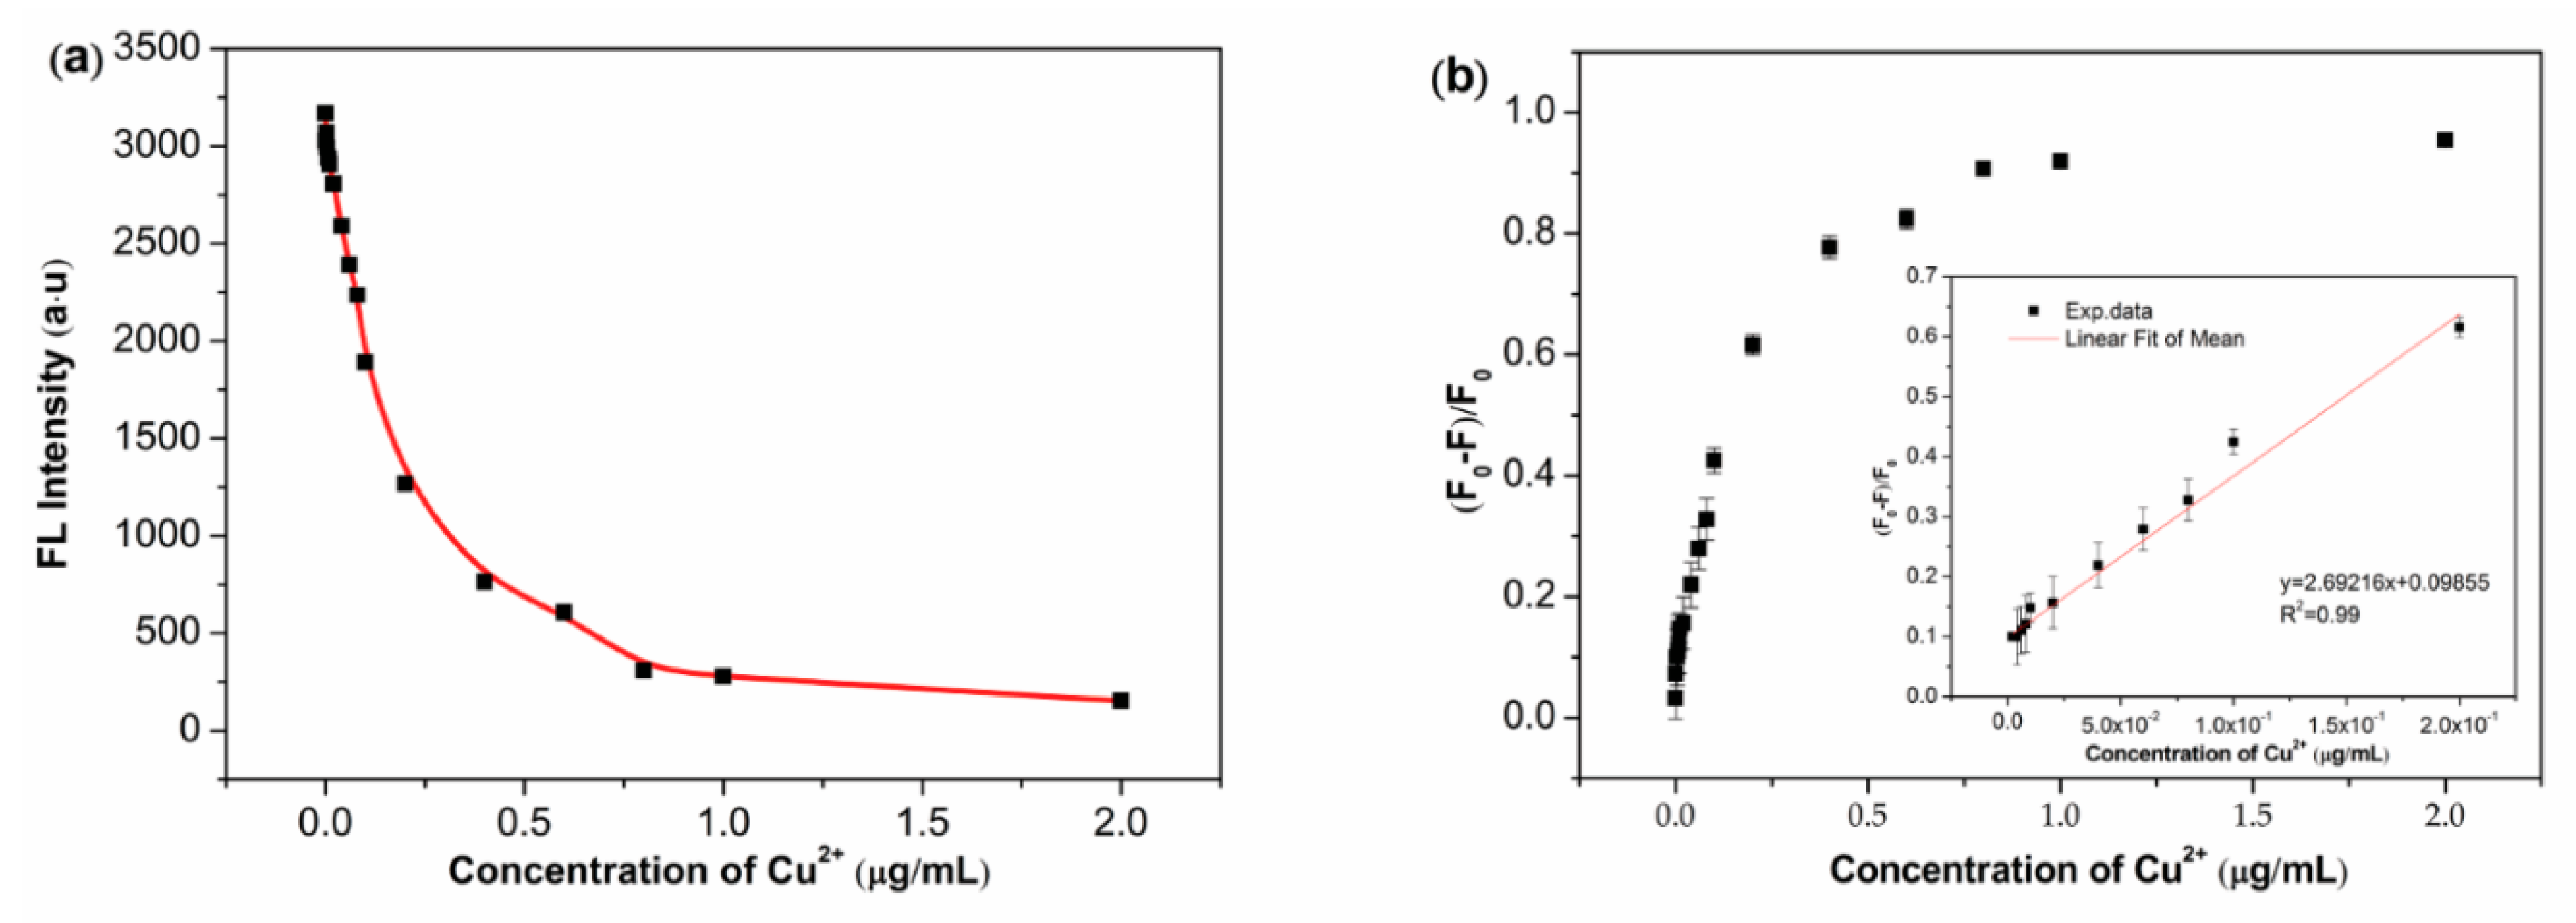
3.2. Detection Performance of CdSe QDs for Cu2+

Copper ion was added to the CdSe QDs solution, and the final concentration of Cu2+ ranged from 0.0 to 2.0 μg/mL.
As depicted in Figure 3a, the fluorescence quenching of CdSe QDs increases with the increasing of copper ion concentration. The experimental data shown in Figure 3b indicates that the fluorescence quenching efficiency of CdSe QDs has a favorable linear relationship with copper ion concentration between 30 nM–3 μM. The fitted curve can be expressed as y = 2.69216x + 0.09855, and the correlation coefficient (R2) is 0.99. The limit of detection (LOD) is defined as LOD = 3SD/K, where LOD, SD, and K are limit of detection, standard deviation of the black, and the slope of the calibration graph, respectively. The detection limit of CdSe QDs is found at about 30 nM.
As presented in Table 2, the detection range and limit of this study are compared with other QDs. The linear range of 3-MPA CdSe QDs is 30 nM–3 μM, which is a little broader than the reported QDs [27,28]. Moreover, the detection limit is 30 nM, which is lower than the majority of reported QDs [28,29,30,31,32]. The new quantum dots can be synthesized in one step. Compared with other core-shell QDs or organic phase synthesized quantum dots, the preparation process of the new QDs are simpler and more economical [31,33,34]. In addition, QDs fabricated in this study have been well verified in practical applications.

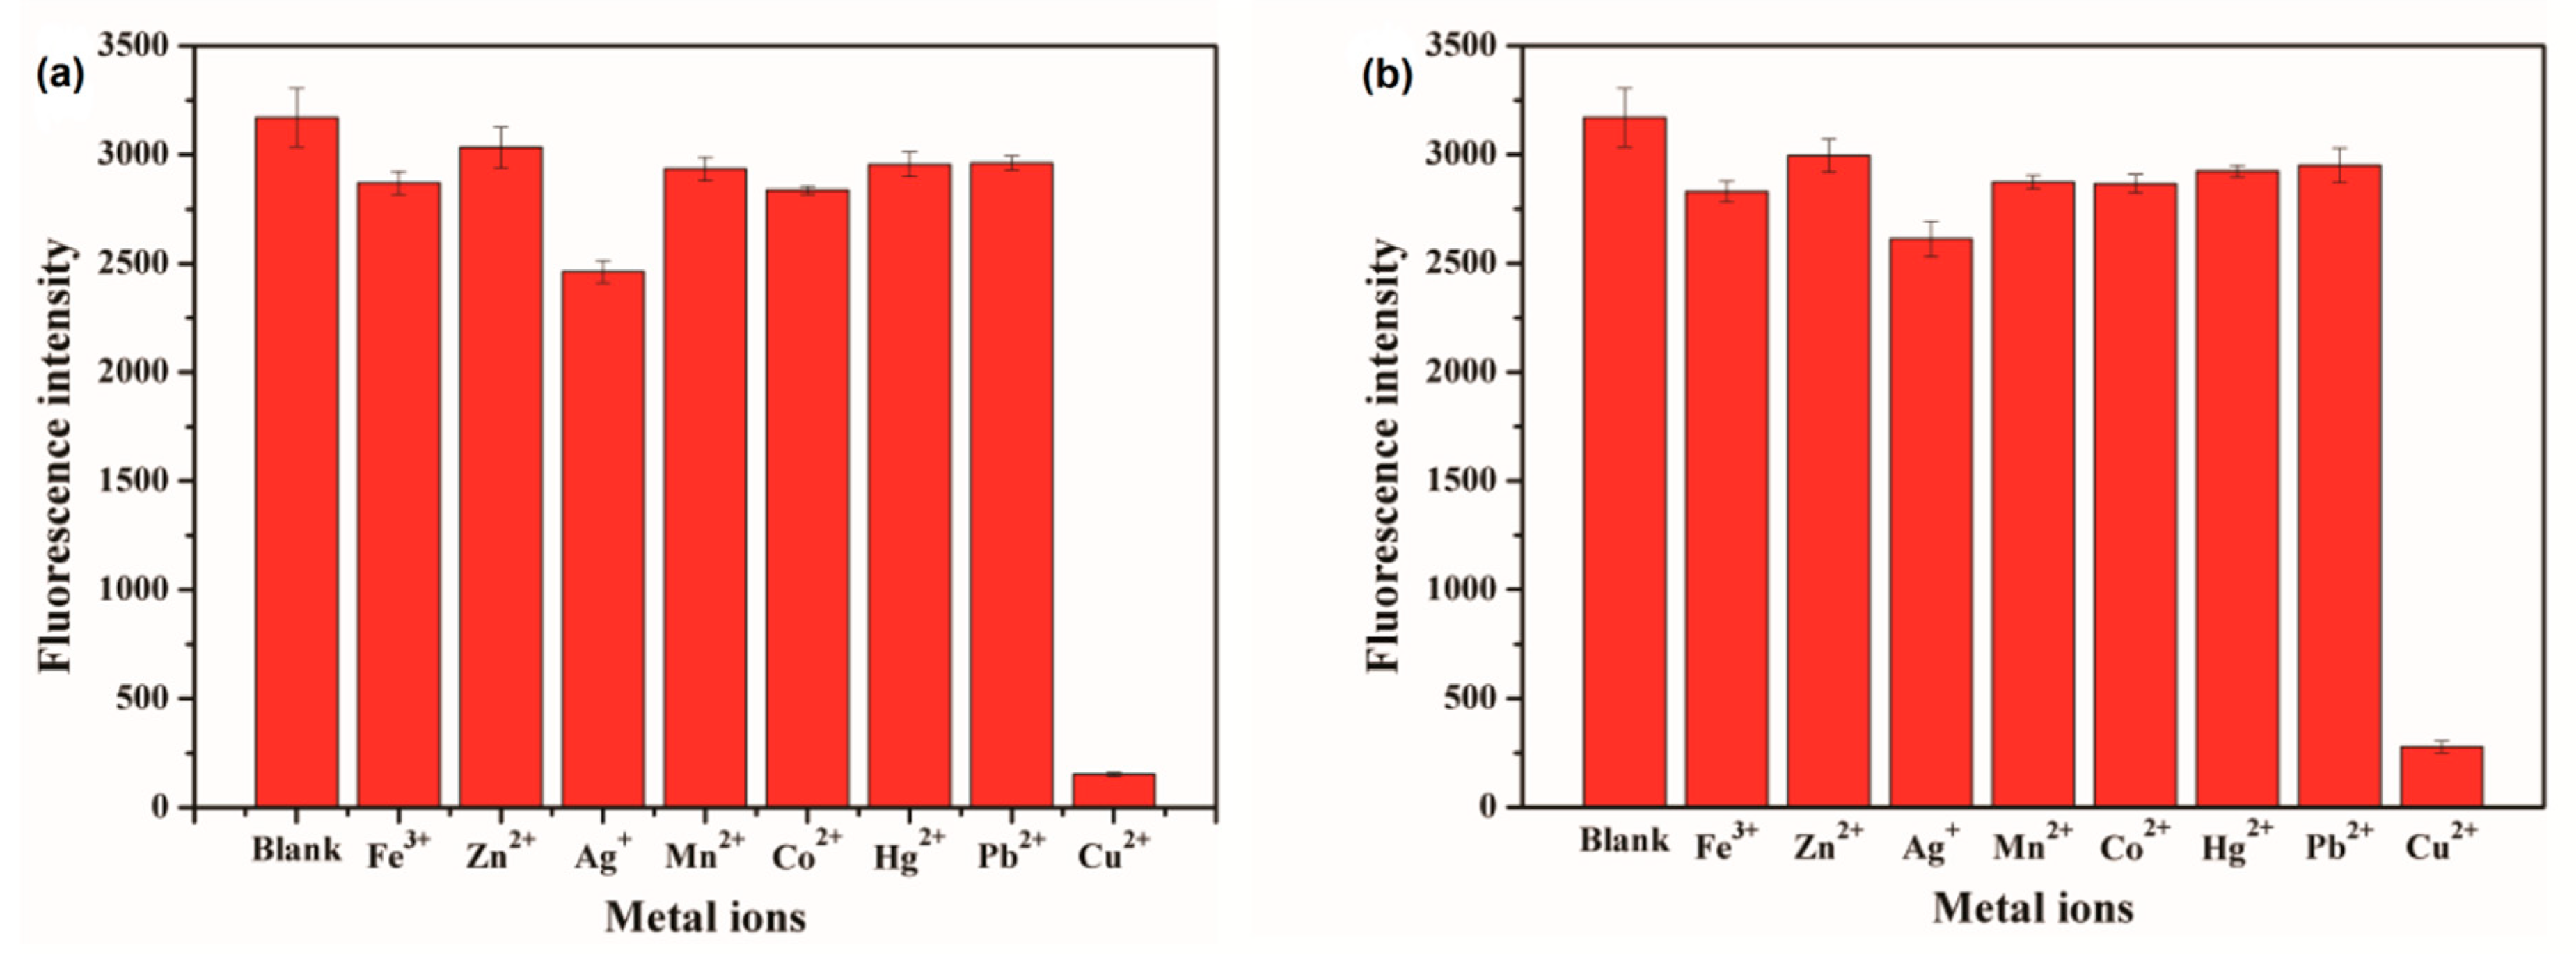
3.3. Selective Detection of CdSe QDs

The inherent attraction between metal ions and 3-MPA CdSe quantum dot surface ligands is a key factor in ion selectivity. Figure 4 shows the fluorescence intensity of CdSe QDs solution after 5 or 10 μM of various metal ions were added, respectively. The fluorescence quenching efficiency of 3-MPA-modified CdSe QDs is 91.24% in the presence of Cu2+ but not more than 22.30% in the presence of other ions, which indicates that the selectivity of CdSe QDs to Cu2+ is higher than that of other tested ions.

3.4. Detection of Cu2+ in Oysters

Six oyster samples were simultaneously processed by wet digestion. After cooling, the digestive juice was fixed to 100 mL with ultrapure water. The absorbance values of solutions were sequentially measured by FAAS under the same conditions as the standard curve.
The fluorescence intensity of the above six oyster sample solutions was measured after the reaction with the QDs. The corresponding concentration was calculated according to the Cu2+ fluorescence intensity standard curve equation. The results are shown in Table 3, and there is low relative error between the concentration of the six samples measured by the fluorescence spectrophotometer and the FAAS. The average relative error is 1.81%, and the test results are reliable.
In the study, the mass of the samples was 3.00 g. According to the calculation method of flame atomic absorption in GB 5009.13-2017, “Determination of Copper in Food”, the copper ion concentrations of the six samples were calculated as: 36.67, 42.77, 54.96, 39.21, 41.75, and 30.07 mg/kg, respectively. The average concentration was 40.91 mg/kg. According to GB 15199-94, “Liquid Limitation Standard for Foods”, the residual limit value of copper ions in aquatic products is ≤50 mg/kg, so the Cu2+ content of the sample does not exceed the limit standard.

4. Conclusions

In the present study, CdSe QDs were prepared by aqueous phase synthesis, and the surface was modified with 3-MPA as a stabilizer. The particle size of newly generated QDs is approximately 4 nm. The QY is 16.65%, and a quantum dot lifetime is 20.5896 ns. The fluorescence quenching efficiency of CdSe QDs has a favorable linear relationship with copper ion concentration between 30 nM–3 μM. The fitted curve can be expressed as y = 2.69216x + 0.09855, and the correlation coefficient (R2) is 0.99. The detection limit of CdSe QDs is 30 nM. CdSe QDs show excellent selectivity to Cu2+. In addition, they were used to detect Cu2+ in oyster, and the concentration was 40.91 mg/kg. Meanwhile, it was compared with traditional FAAS. The relative error of the detection results of the two methods is 1.81%. Therefore, this method is reliable and practical.

Author Contributions

C.L. and S.J. conceived and designed the experiments; S.J. performed the experiments and wrote the paper; P.H. and C.Z. revised the paper; S.S. and Y.F. analyzed the data; T.S. and Z.L. contributed the analysis methods.

Funding

This research was funded by the National Natural Science Foundation of China (21874029), the Guangdong Yangfan Program (201635018), the Guangdong Special Support Program (2017TQ04N706), the Science and Technology Planning Project of Guangdong Province (2016A020210114), the Science and Technology Planning Project of Shenzhen City (JCYJ20170818111719650), the Industrial Development Special Funds of Dapeng New Area (KY20170209, KY20180202), and the Innovation and Development Project about Marine Economy Demonstration of Zhanjiang City (2017C8B1).

Conflicts of Interest

The authors declare no conflict of interest.

References

  1. Buccolieri, A.; Buccolieri, G.; Cardellicchio, N.; Dell’Atti, A.; Di Leo, A.; Maci, A. Heavy metals in marine sediments of taranto gulf (Ionian Sea, Southern Italy). Mar. Chem. 2006, 99, 227–235. [Google Scholar] [CrossRef]
  2. Bosch, A.C.; O’Neill, B.; Sigge, G.O.; Kerwath, S.E.; Hoffman, L.C. Heavy metals in marine fish meat and consumer health: A review: Heavy metals in marine fish meat. J. Sci. Food Agric. 2016, 96, 32–48. [Google Scholar] [CrossRef] [PubMed]
  3. Mahurpawar, M. Effects of heavy metals on human health. Int. J. Res. Granthaalayah 2015, 530, 1–7. [Google Scholar]
  4. Muller, P.; van Bakel, H.; van de Sluis, B.; Holstege, F.; Wijmenga, C.; Klomp, L.W.J. Gene expression profiling of liver cells after copper overload in vivo and in vitro reveals new copper-regulated genes. JBIC 2007, 12, 495–507. [Google Scholar] [CrossRef] [PubMed]
  5. Sadhra, S.S.; Wheatley, A.D.; Cross, H.J. Dietary exposure to copper in the European union and its assessment for EU regulatory risk assessment. Sci. Total Environ. 2007, 374, 223–234. [Google Scholar] [CrossRef] [PubMed]
  6. Scheiber, I.F.; Schmidt, M.M.; Dringen, R. Zinc prevents the copper-induced damage of cultured astrocytes. Neurochem. Int. 2010, 57, 314–322. [Google Scholar] [CrossRef] [PubMed]
  7. Merker, K.; Hapke, D.; Reckzeh, K.; Schmidt, H.; Lochs, H.; Grune, T. Copper related toxic effects on cellular protein metabolism in human astrocytes. BioFactors 2005, 24, 255–261. [Google Scholar] [CrossRef] [PubMed]
  8. Li, X.; Qian, J.; Jiang, L.; He, S. Fluorescence quenching of quantum dots by gold nanorods and its application to DNA detection. Appl. Phys. Lett. 2009, 94, 063111. [Google Scholar] [CrossRef]
  9. Chen, Z.M.; Shen, G.Z.; Li, Y.P.; Zhang, P.; Ji, H.W.; Liu, S.C.; Li, C.Y.; Qian, Z.J. A novel biomimetic logic gate for sensitive and selective detection of Pb(II) base on porous alumina nanochannels. Electrochem. Commun. 2015, 60, 83–87. [Google Scholar] [CrossRef]
  10. Reddi, G.S.; Rao, C.R.M. Analytical techniques for the determination of precious metals in geological and related materials. Analyst 1999, 124, 1531–1540. [Google Scholar] [CrossRef]
  11. Soodan, R.K.; Pakade, Y.B.; Nagpal, A.; Katnoria, J.K. Analytical techniques for estimation of heavy metals in soil ecosystem: A tabulated review. Talanta 2014, 125, 405–410. [Google Scholar] [CrossRef] [PubMed]
  12. Ladokhin, A.S. Fluorescence spectroscopy in peptide and protein analysis. In Encyclopedia of Analytical Chemistry; Meyers, R.A., Ed.; John Wiley & Sons, Ltd.: Chichester, UK, 2000. [Google Scholar]
  13. Sádecká, J.; Tóthová, J. Fluorescence spectroscopy and chemometrics in the food classification &minus: A review. Czech J. Food Sci. 2008, 25, 159–174. [Google Scholar]
  14. Pinaud, F.; Michalet, X.; Bentolila, L.A.; Tsay, J.M.; Doose, S.; Li, J.J.; Iyer, G.; Weiss, S. Advances in fluorescence imaging with quantum dot bio-probes. Biomaterials 2006, 27, 1679–1687. [Google Scholar] [CrossRef] [PubMed] [Green Version]
  15. Alivisatos, A.P.; Gu, W.; Larabell, C. Quantum dots as cellular probes. Annu. Rev. Biomed. Eng. 2005, 7, 55–76. [Google Scholar] [CrossRef] [PubMed]
  16. Larson, D.R. Water-Soluble quantum dots for multiphoton fluorescence imaging in vivo. Science 2003, 300, 1434–1436. [Google Scholar] [CrossRef] [PubMed]
  17. Gao, X.; Yang, L.; Petros, J.A.; Marshall, F.F.; Simons, J.W.; Nie, S. In vivo molecular and cellular imaging with quantum dots. Curr. Opin. Biotechnol. 2005, 16, 63–72. [Google Scholar] [CrossRef] [PubMed]
  18. Frasco, M.F.; Chaniotakis, N. Bioconjugated quantum dots as fluorescent probes for bioanalytical applications. Anal Bioanal Chem. 2010, 396, 223–240. [Google Scholar] [CrossRef] [PubMed]
  19. Williams, A.T.R.; Winfield, S.A.; Miller, J.N. Relative fluorescence quantum yields using a computer-controlled luminescence spectrometer. Analyst 1983, 108, 1067. [Google Scholar] [CrossRef]
  20. Grabolle, M.; Spieles, M. Determination of the fluorescence quantum yield of quantum dots: Suitable procedures and achievable uncertainties. Anal. Chem. 2009, 81, 6285–6294. [Google Scholar] [CrossRef]
  21. Van Dam, B.; Bruhn, B.; Kondapaneni, I.; Dohnal, G.; Wilkie, A.; Křivánek, J.; Valenta, J.; Mudde, Y.; Schall, P.; Dohnalová, K. On a critical artifact in the quantum yield methodology. arXiv 2018, arXiv:1808.00779. [Google Scholar]
  22. Lei, J.; Ju, J. Fundamentals and bioanalytical applications of functional quantum dots as electrogenerated emitters of chemiluminescence. Trac-Trend Anal Chem. 2011, 30, 1351–1359. [Google Scholar] [CrossRef]
  23. Huang, S.; Xiao, Q.; Li, R.; Guan, H.L.; Liu, J.; Liu, X.R.; He, Z.K.; Liu, Y. A simple and sensitive method for l-cysteine detection based on the fluorescence intensity increment of quantum dots. Anal. Chim. Acta 2009, 645, 73–78. [Google Scholar] [CrossRef]
  24. Xu, X.; Liu, X.; Oh, M.; Park, J. Oyster shell as a low-cost adsorbent for removing heavy metal ions from Wastewater. Pol. J. Environ. Stud. 2019, 28, 2949–2959. [Google Scholar] [CrossRef]
  25. Alqahtani, S.F.; Farooq, W.A.; Ali, S.M.; Tawfik, W. Fabrication and study of structural and optical properties of cadmium telluride quantum dots. J. Optoelectron. Adv. Mater. 2019, 21, 385–394. [Google Scholar]
  26. Liu, Q.; Zheng, C.; Zhao, H.; Wang, K.; Tao, W. Tumor cell pH detection based on CdSe quantum dots’ fluorescence charateristics. Technol. Health Care 2019, 27, 239–247. [Google Scholar] [CrossRef] [PubMed]
  27. Liang, G.X.; Liu, H.Y.; Zhang, J.R.; Zhu, J.J. Ultrasensitive Cu2+ sensing by near-infrared-emitting CdSeTe alloyed quantum dots. Talanta 2010, 80, 2172–2176. [Google Scholar] [CrossRef] [PubMed]
  28. Sung, T.W.; Lo, Y.L. Highly sensitive and selective sensor based on silica-coated CdSe/ZnS nanoparticles for Cu2+ ion detection. Sens. Actuators B Chem. 2012, 165, 119–125. [Google Scholar] [CrossRef]
  29. Koneswaran, M.; Narayanaswamy, R. L-Cysteine-capped ZnS quantum dots based fluorescence sensor for Cu2+ ion. Sens. Actuators B Chem. 2009, 139, 104–109. [Google Scholar] [CrossRef]
  30. Liu, F.C.; Chen, Y.M.; Lin, J.H.; Tseng, W.L. Synthesis of highly fluorescent glutathione-capped ZnxHg1−xSe quantum dot and its application for sensing copper ion. J. Colloid Interface Sci. 2009, 337, 414–419. [Google Scholar] [CrossRef] [PubMed]
  31. Jin, L.H.; Han, C.S. Ultrasensitive and selective fluorimetric detection of copper ions using thiosulfate-involved quantum dots. Anal. Chem. 2014, 86, 7209–7213. [Google Scholar] [CrossRef] [PubMed]
  32. Chen, Y.; Rosenzweig, Z. Luminescent CdS quantum dots as selective ion probes. Anal. Chem. 2002, 74, 5132–5138. [Google Scholar] [CrossRef] [PubMed]
  33. Sajwan, R.K.; Bagbi, Y.; Sharma, P.; Solanki, P.R. L-cysteine and 3-mercaptopropionic acid capped cadmium selenide quantum dots based metal ion probes. J. Lumin. 2017, 187, 126–132. [Google Scholar] [CrossRef]
  34. Shang, L.; Dong, S. Silver nanocluster-based fluorescent sensors for sensitive detection of Cu(II). J. Mater. Chem. 2008, 18, 4636. [Google Scholar] [CrossRef]
  35. Li, H.; Wang, X. Single quantum dot-micelles coated with gemini surfactant for selective recognition of a cation and an anion in aqueous solutions. Sens. Actuators B Chem. 2008, 134, 238–244. [Google Scholar] [CrossRef]
Scheme 1. Schematic diagram of copper ions (Cu2+) detection by cadmium selenide (CdSe) quantum dots (QDs).
Chemosensors 07 00047 sch001
Figure 1. High-resolution transmission electron microscope (HRTEM) image of CdSe QDs: (a) 97,000×, 200 kV. (b) 690,000×, 200 kV.
Chemosensors 07 00047 g001
Figure 2. Fluorescence characteristics of CdSe QDs: (a) Fluorescence quantum yield of CdSe QDs. In the figure, the black spectrum represent the quantum yield (QY) results for barium sulfate solution, the red spectrum represent the QY results of CdSe QDs (in ethanol). (b) Fluorescence lifetime of CdSe QDs. Where the red line represent the fluorescence lifetime fitting curve of CdSe QDs, R2 = 0.99.
Chemosensors 07 00047 g002
Figure 3. CdSe QDs were used for the detection of Cu2+ in aqueous solution. (a) Fluorescence intensity of CdSe QDs was measured after adding different concentrations of Cu2+. (b) Fluorescence quenching efficiency of CdSe QDs was detected with different concentrations of Cu2+. F0 is the fluorescence intensity of pure CdSe QDs. F is the fluorescence intensity of CdSe QDs as Cu2+ was added with different concentrations. (F0F)/F0 is the fluorescence quenching efficiency of CdSe QDs.
Chemosensors 07 00047 g003
Figure 4. Fluorescence quenching efficiency of QDs in a solution with various metal ions. (a) The concentration of metal ions is 5 μM. (b) The concentration of metal ions is 10 μM.
Chemosensors 07 00047 g004
Table 1. Fitting parameters of the fluorescence decay curve.
τ 1 ( ns ) τ 2   ( ns ) B 1   ( % ) B 2   ( % ) R 2  
4.03021.6024.6475.360.99
Table 2. Comparison of Cu2+ sensors reported by references.
ProbesLimit of DetectionLinear RangeApplicationRef
l-Cysteine-capped CdSeTe QDs0.007 μM0.02–2.0 μMNot mentioned[27]
Silica-coated CdSe/ZnS QDs0.9 μM0–10 μMNot mentioned[28]
l-Cysteine-capped ZnS QDs7.1 μM0–260 μMNot mentioned[29]
Glutathione-capped ZnxHg1−xSe QDs20 μM0.03–5.0 μMNot mentioned[30]
Hexadecyl trimethylammonium bromide modified CdSe/ZnS QDs0.15 nM0–600 nMDeionization water[31]
CdS QDs0.1 μMNot mentionedNot mentioned[32]
MPA-CdSe QDsNot mentioned4–160 μMNot mentioned[33]
PMAA (methacrylic acid)-Ag nanocluster0.008 μM0.01–6.0 μMNot mentioned[34]
Gemini-coated CdSe/ZnS QDs1.1 μM0–500 μMNot mentioned[35]
3-MPA CdSe QDs0.03 μM0.03–3 μMoystersThis work
Table 3. The concentrations of copper ion in the oysters.
Fluorescence IntensityCorresponding Concentration (μg/mL)Mean Concentration (μg/mL)Concentration Measured by Flame Atomic Absorption Spectrometry (FAAS) (μg/mL)Relative Error (%)
Sample 1855.50.35120.3592
(±6.841 × 10⁻³)
0.36672.04
840.10.3586
821.10.3679
Sample 2732.40.41740.4224
(±5.276 × 10⁻³)
0.42771.24
713.00.4297
728.30.4200
Sample 3595.70.51830.5581
(±2.868 × 10⁻²)
0.54961.55
541.20.5708
527.90.5850
Sample 4762.00.39980.4035
(±7.455 × 10⁻³)
0.39212.91
767.20.3968
738.20.4139
Sample 5709.80.43180.4111
(±1.989 × 10⁻²)
0.41751.53
732.60.4173
790.20.3841
Sample 6971.60.30230.2959
(±4.808 × 10⁻³)
0.30071.60
975.00.3011
10220.2842

