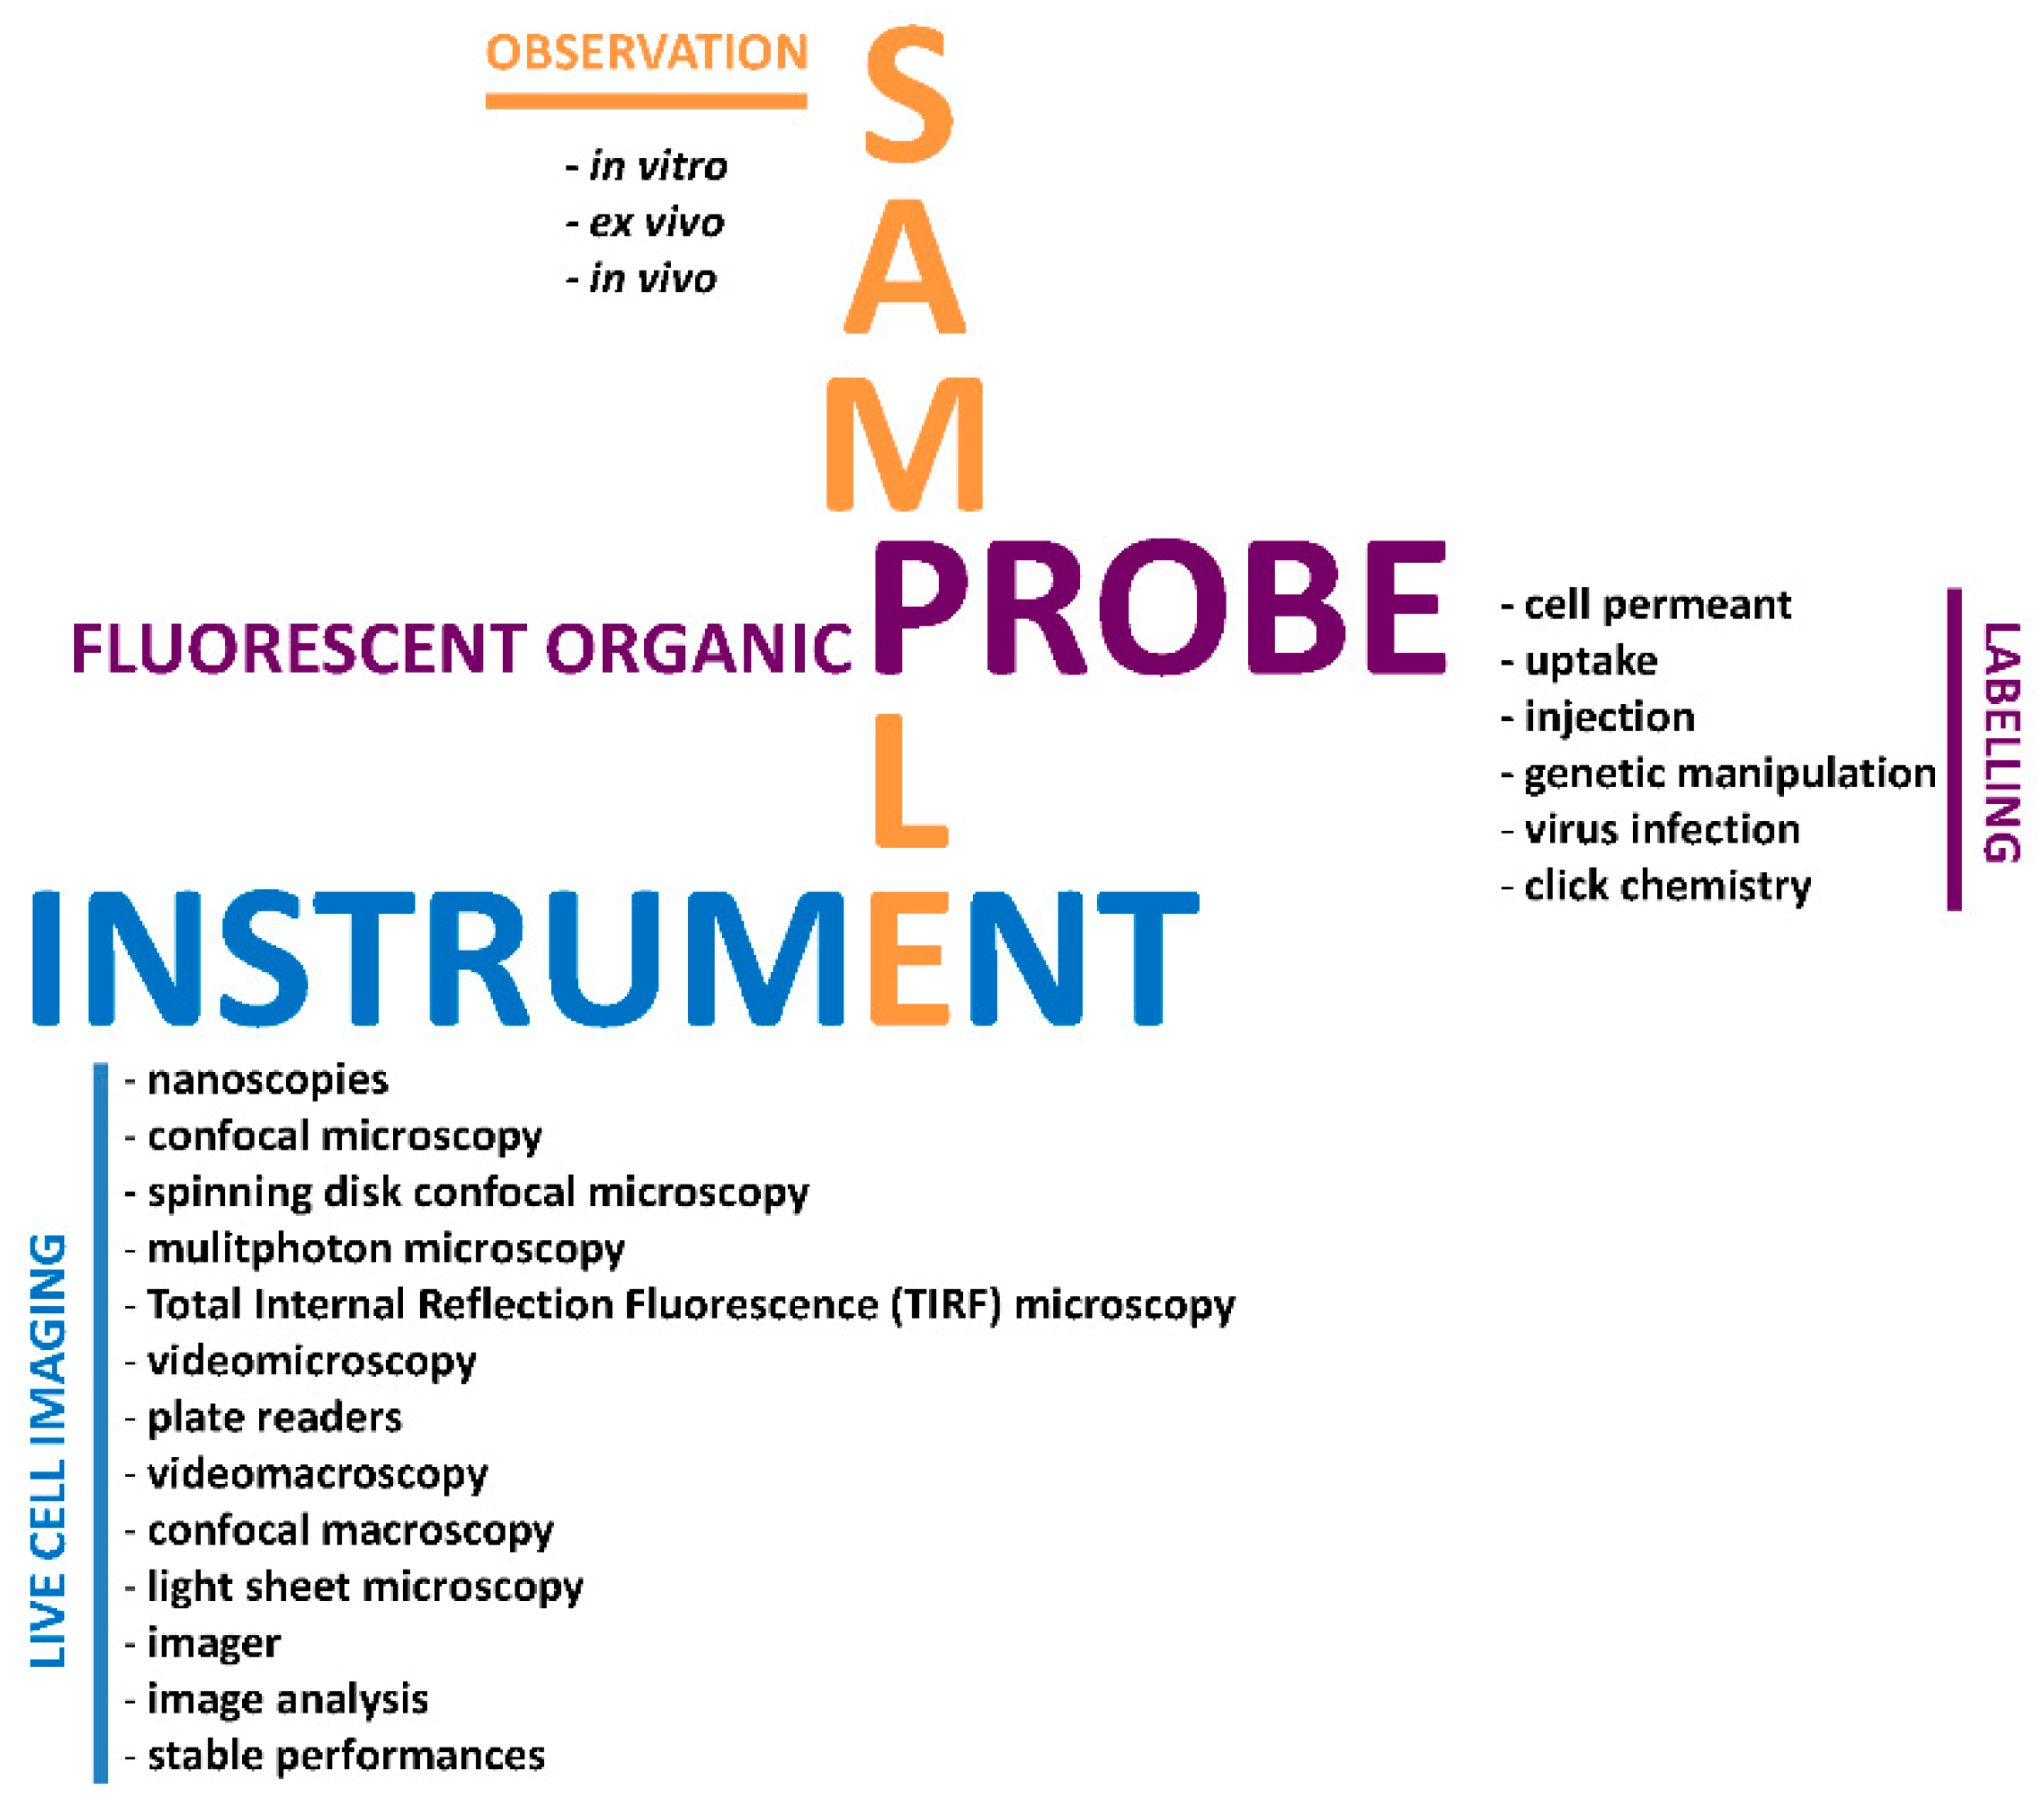
“Probe, Sample, and Instrument (PSI)”: The Hat-Trick for Fluorescence Live Cell Imaging

 ,
,
Abstract
:1. Introduction
2. Photophysical Properties of Fluorescent Organic Probes
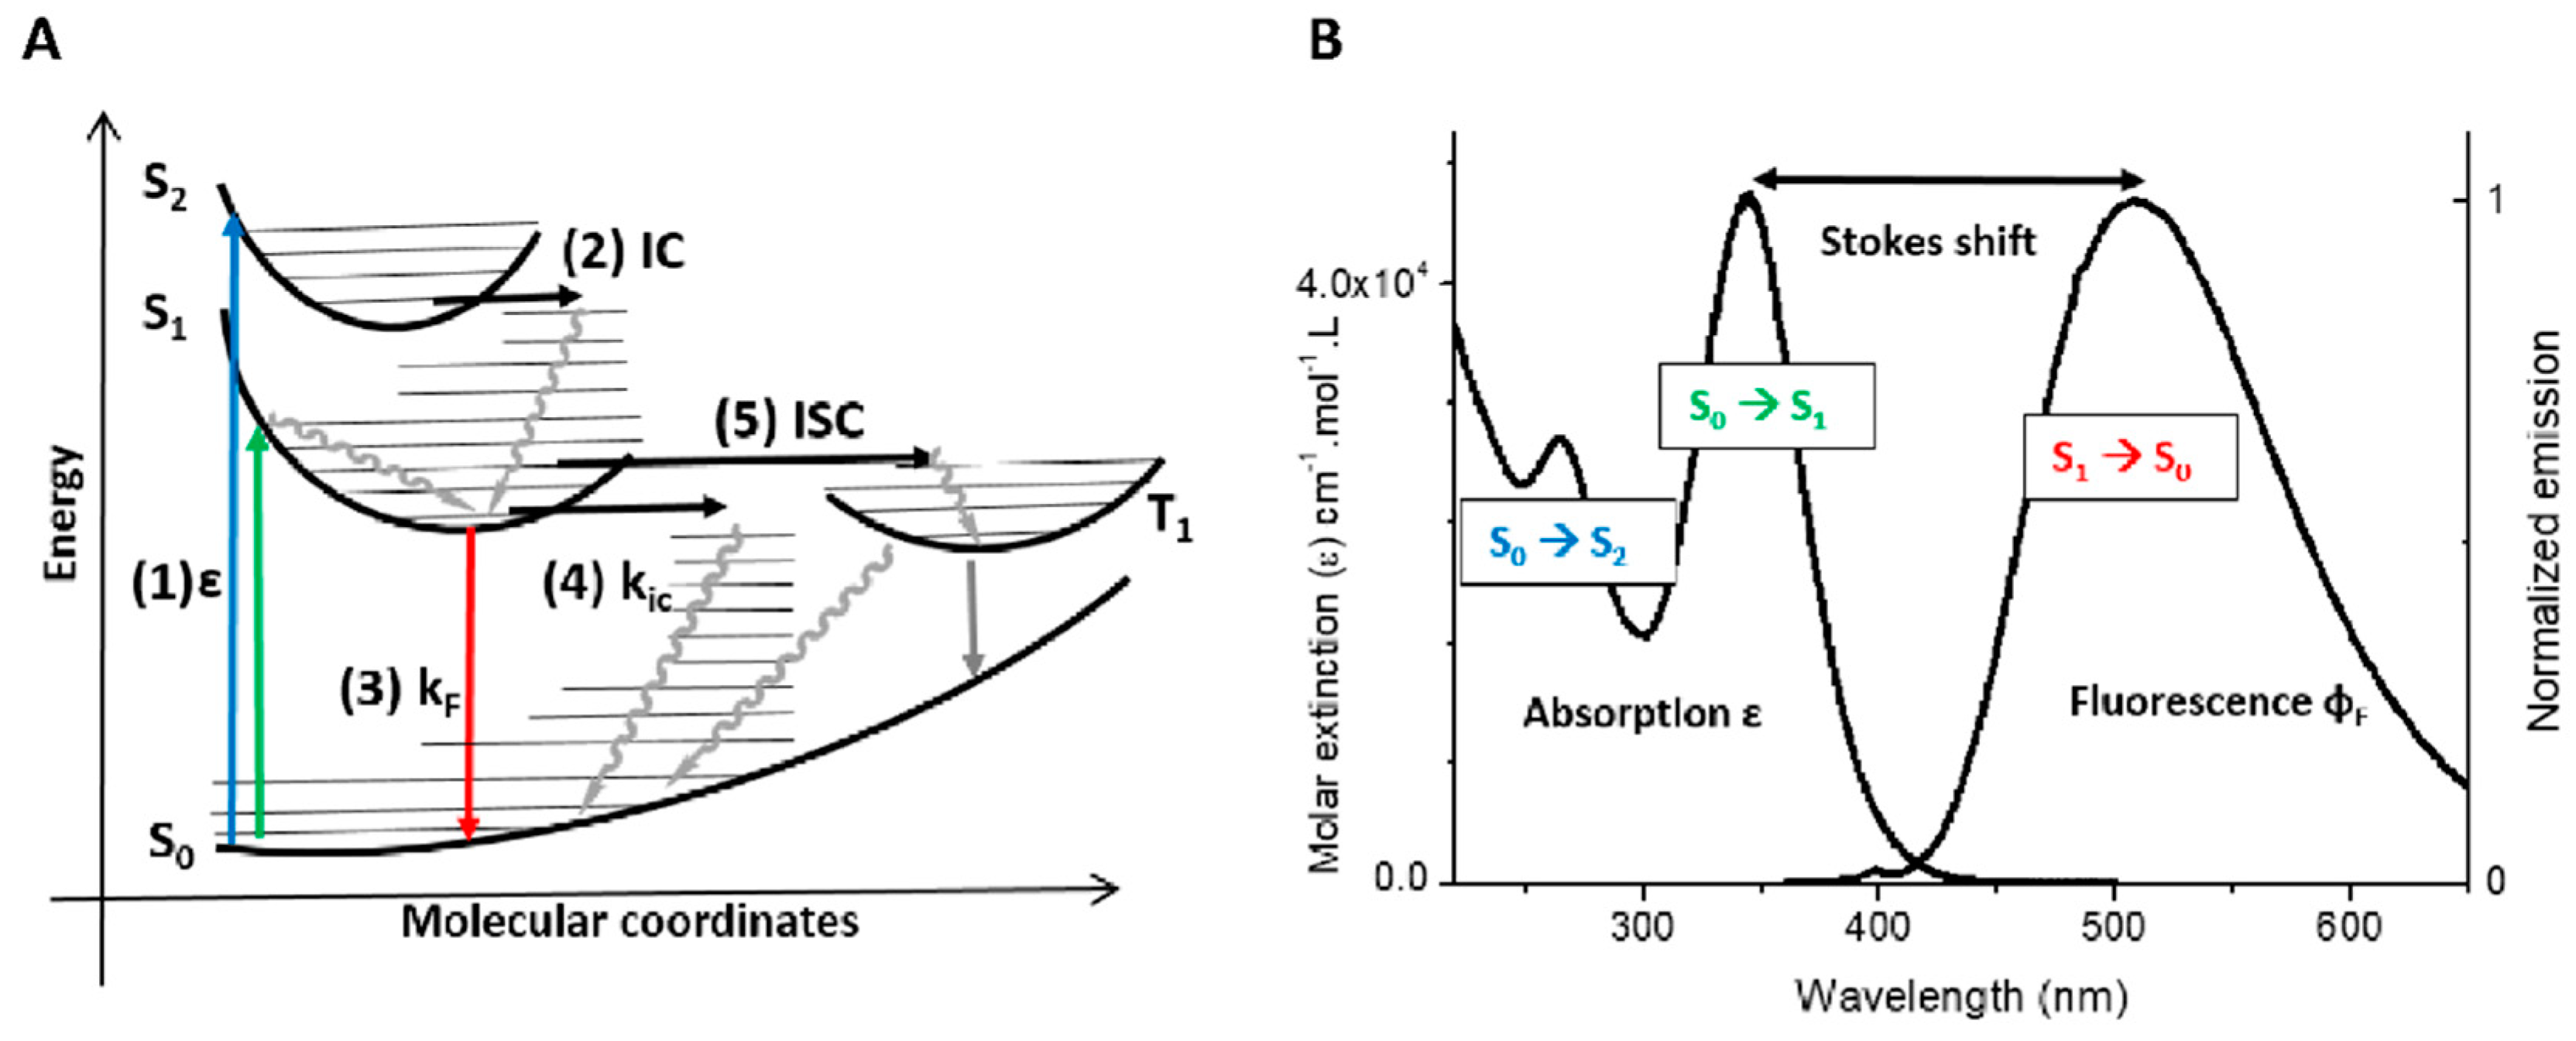
2.1. General Properties
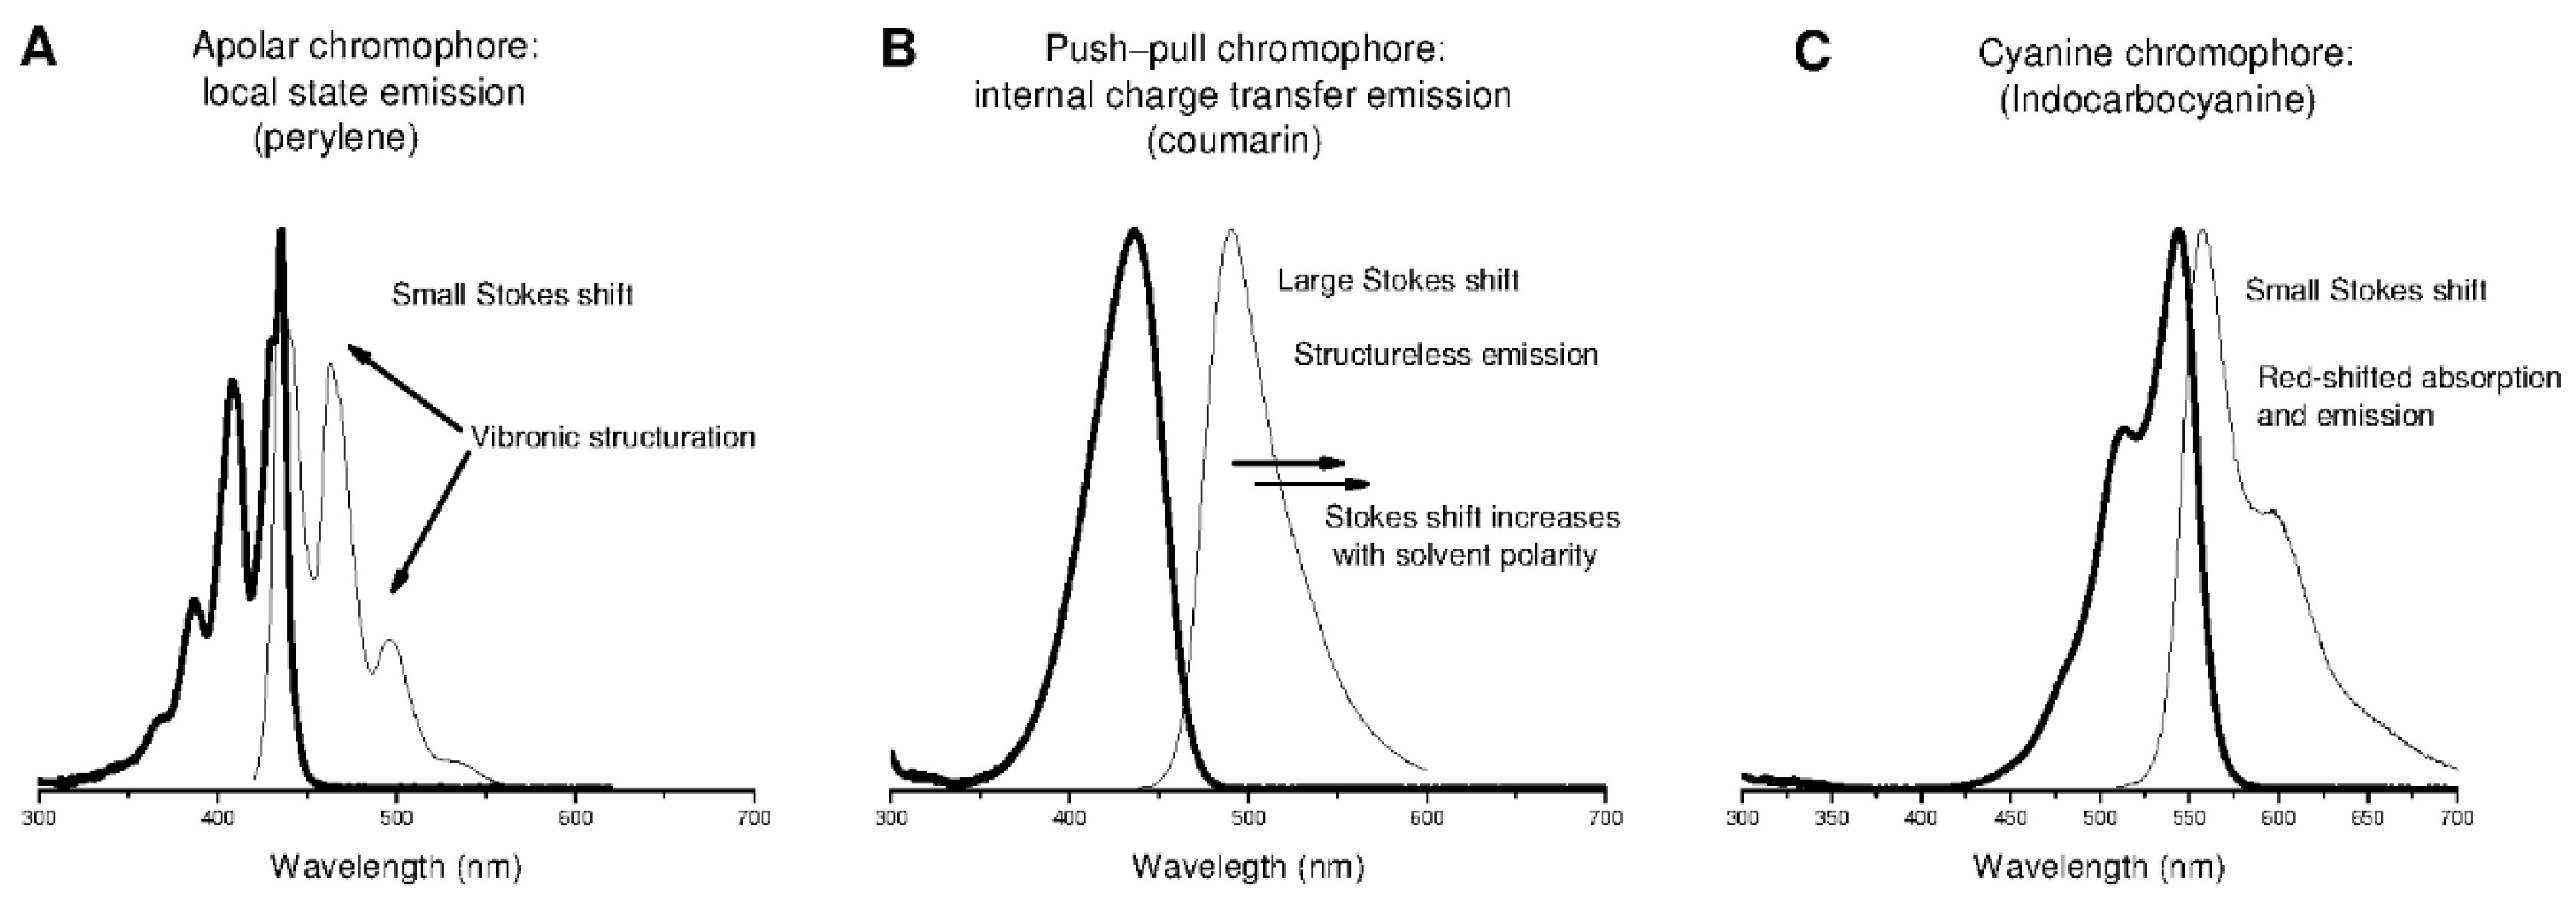
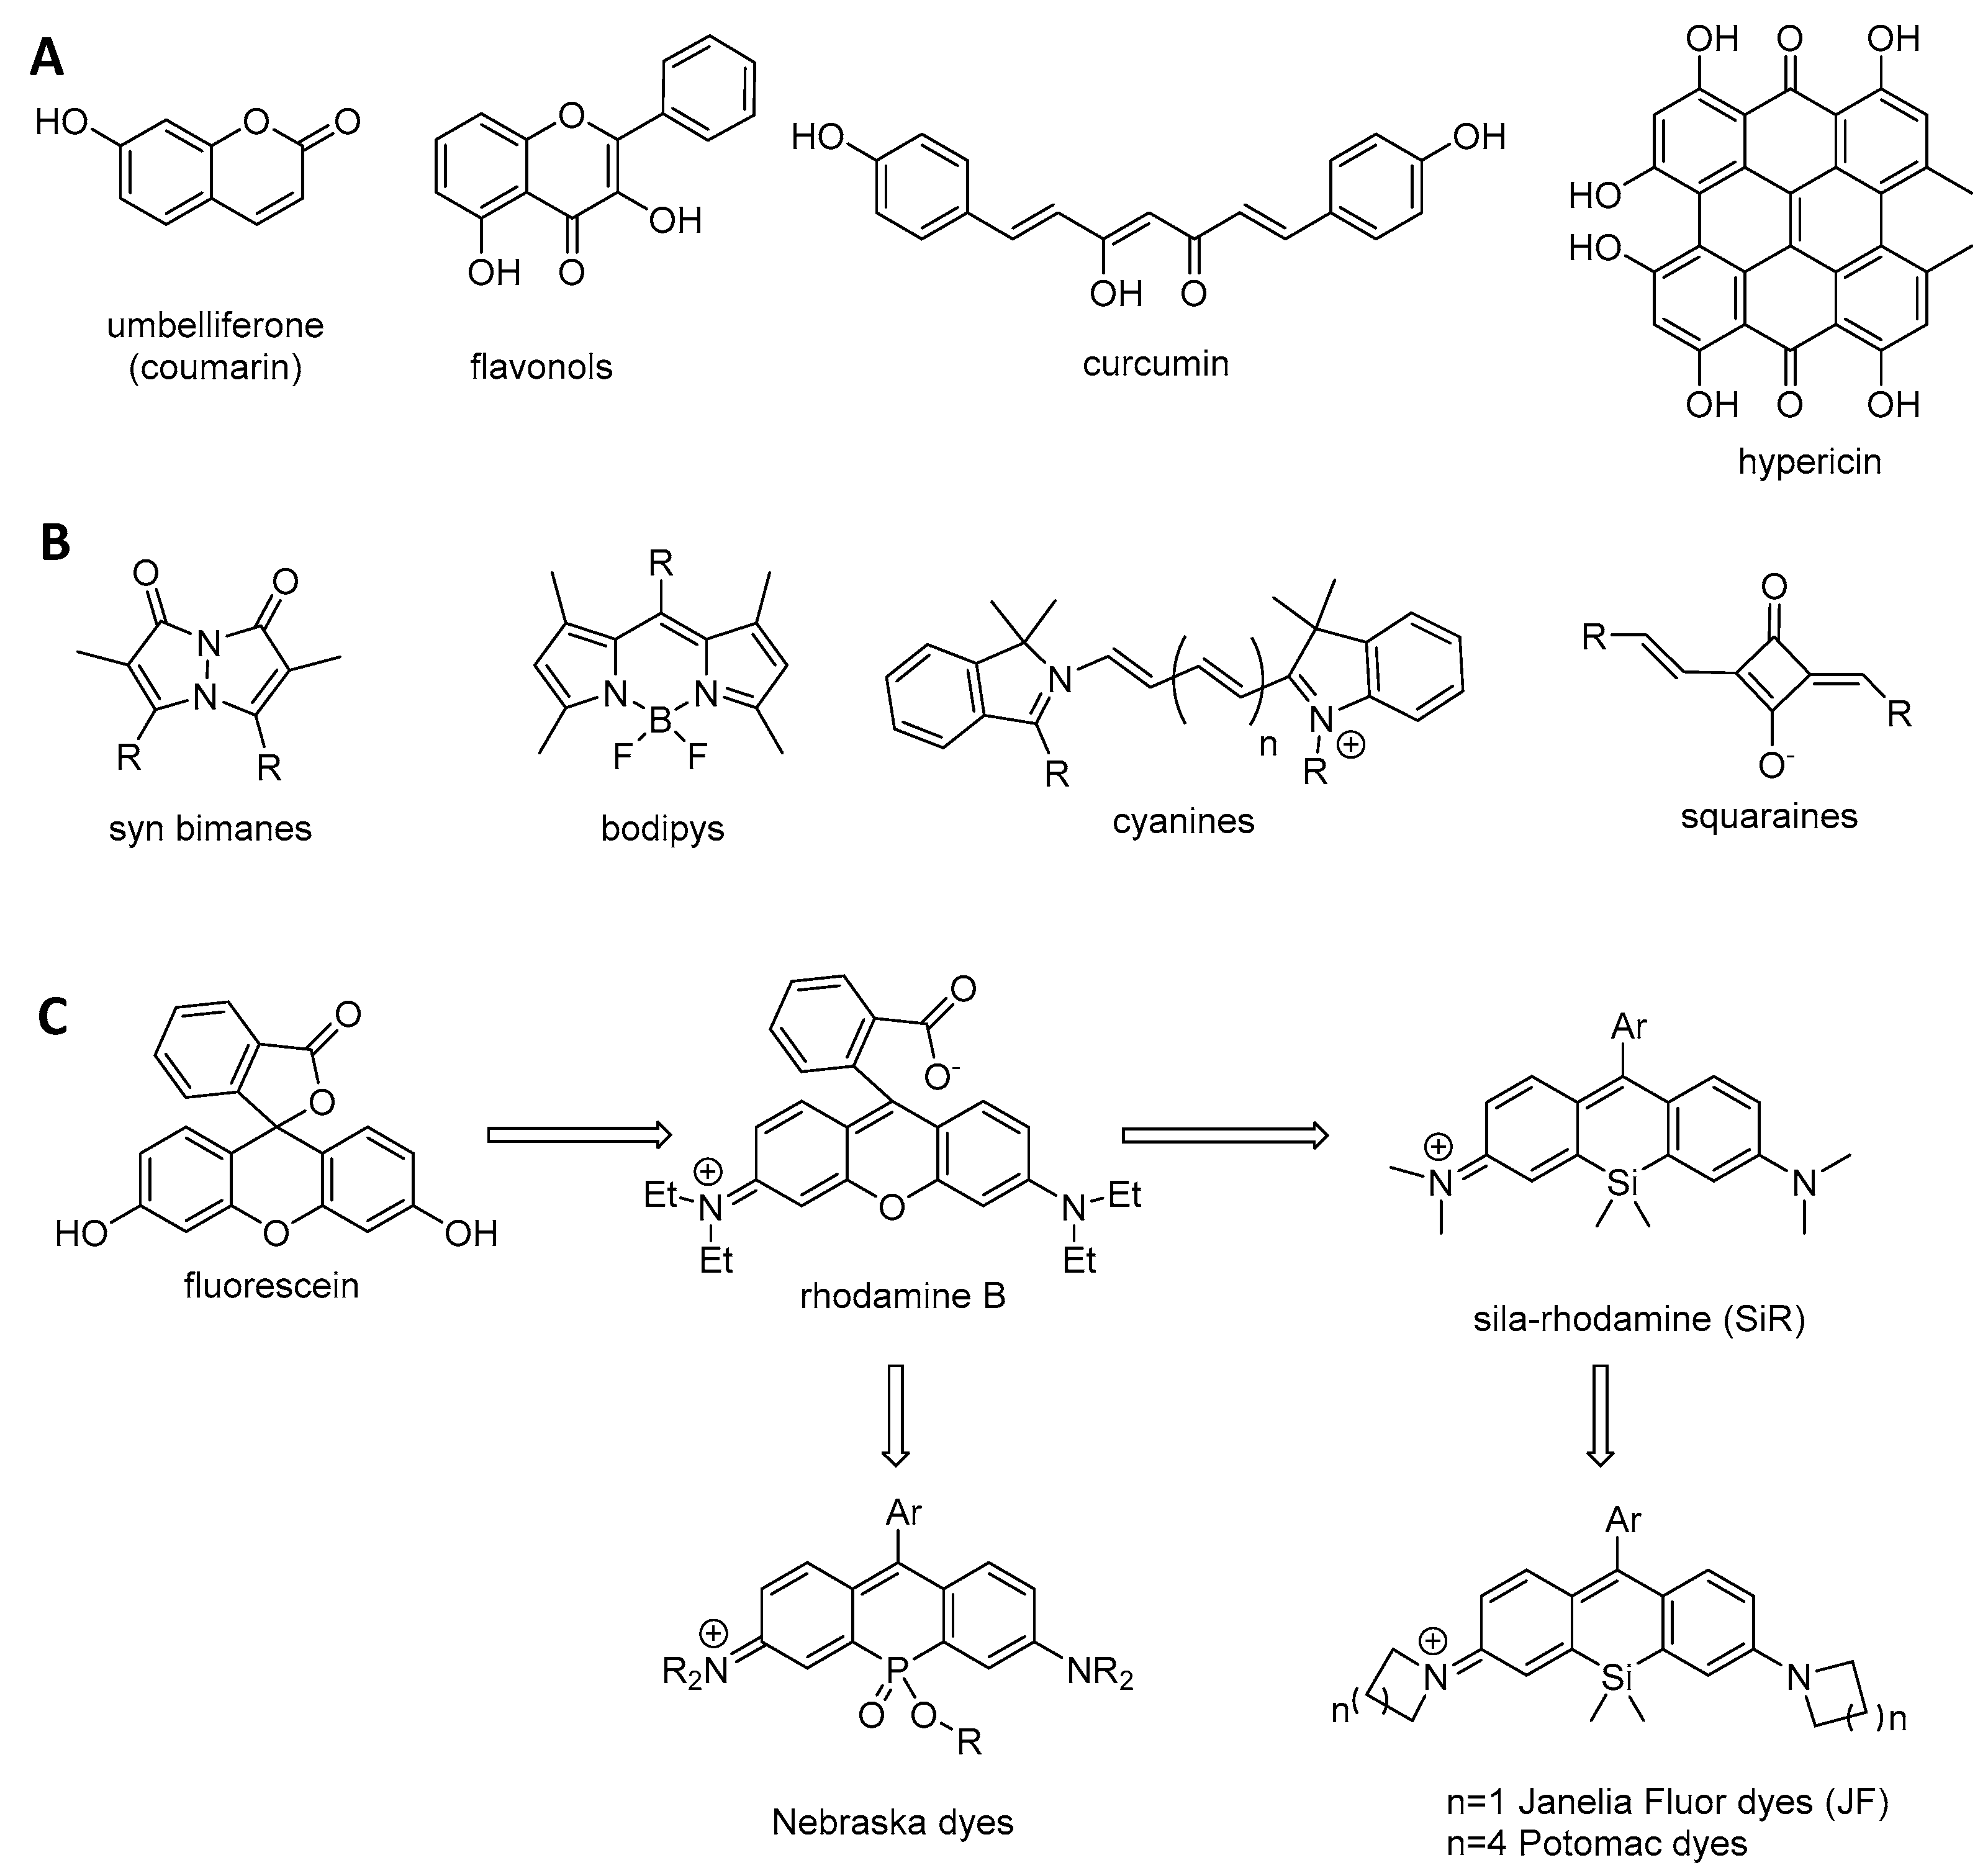
2.2. Small Organic Fluorophore Classification and Structure–Fluorescence Relationship
- -
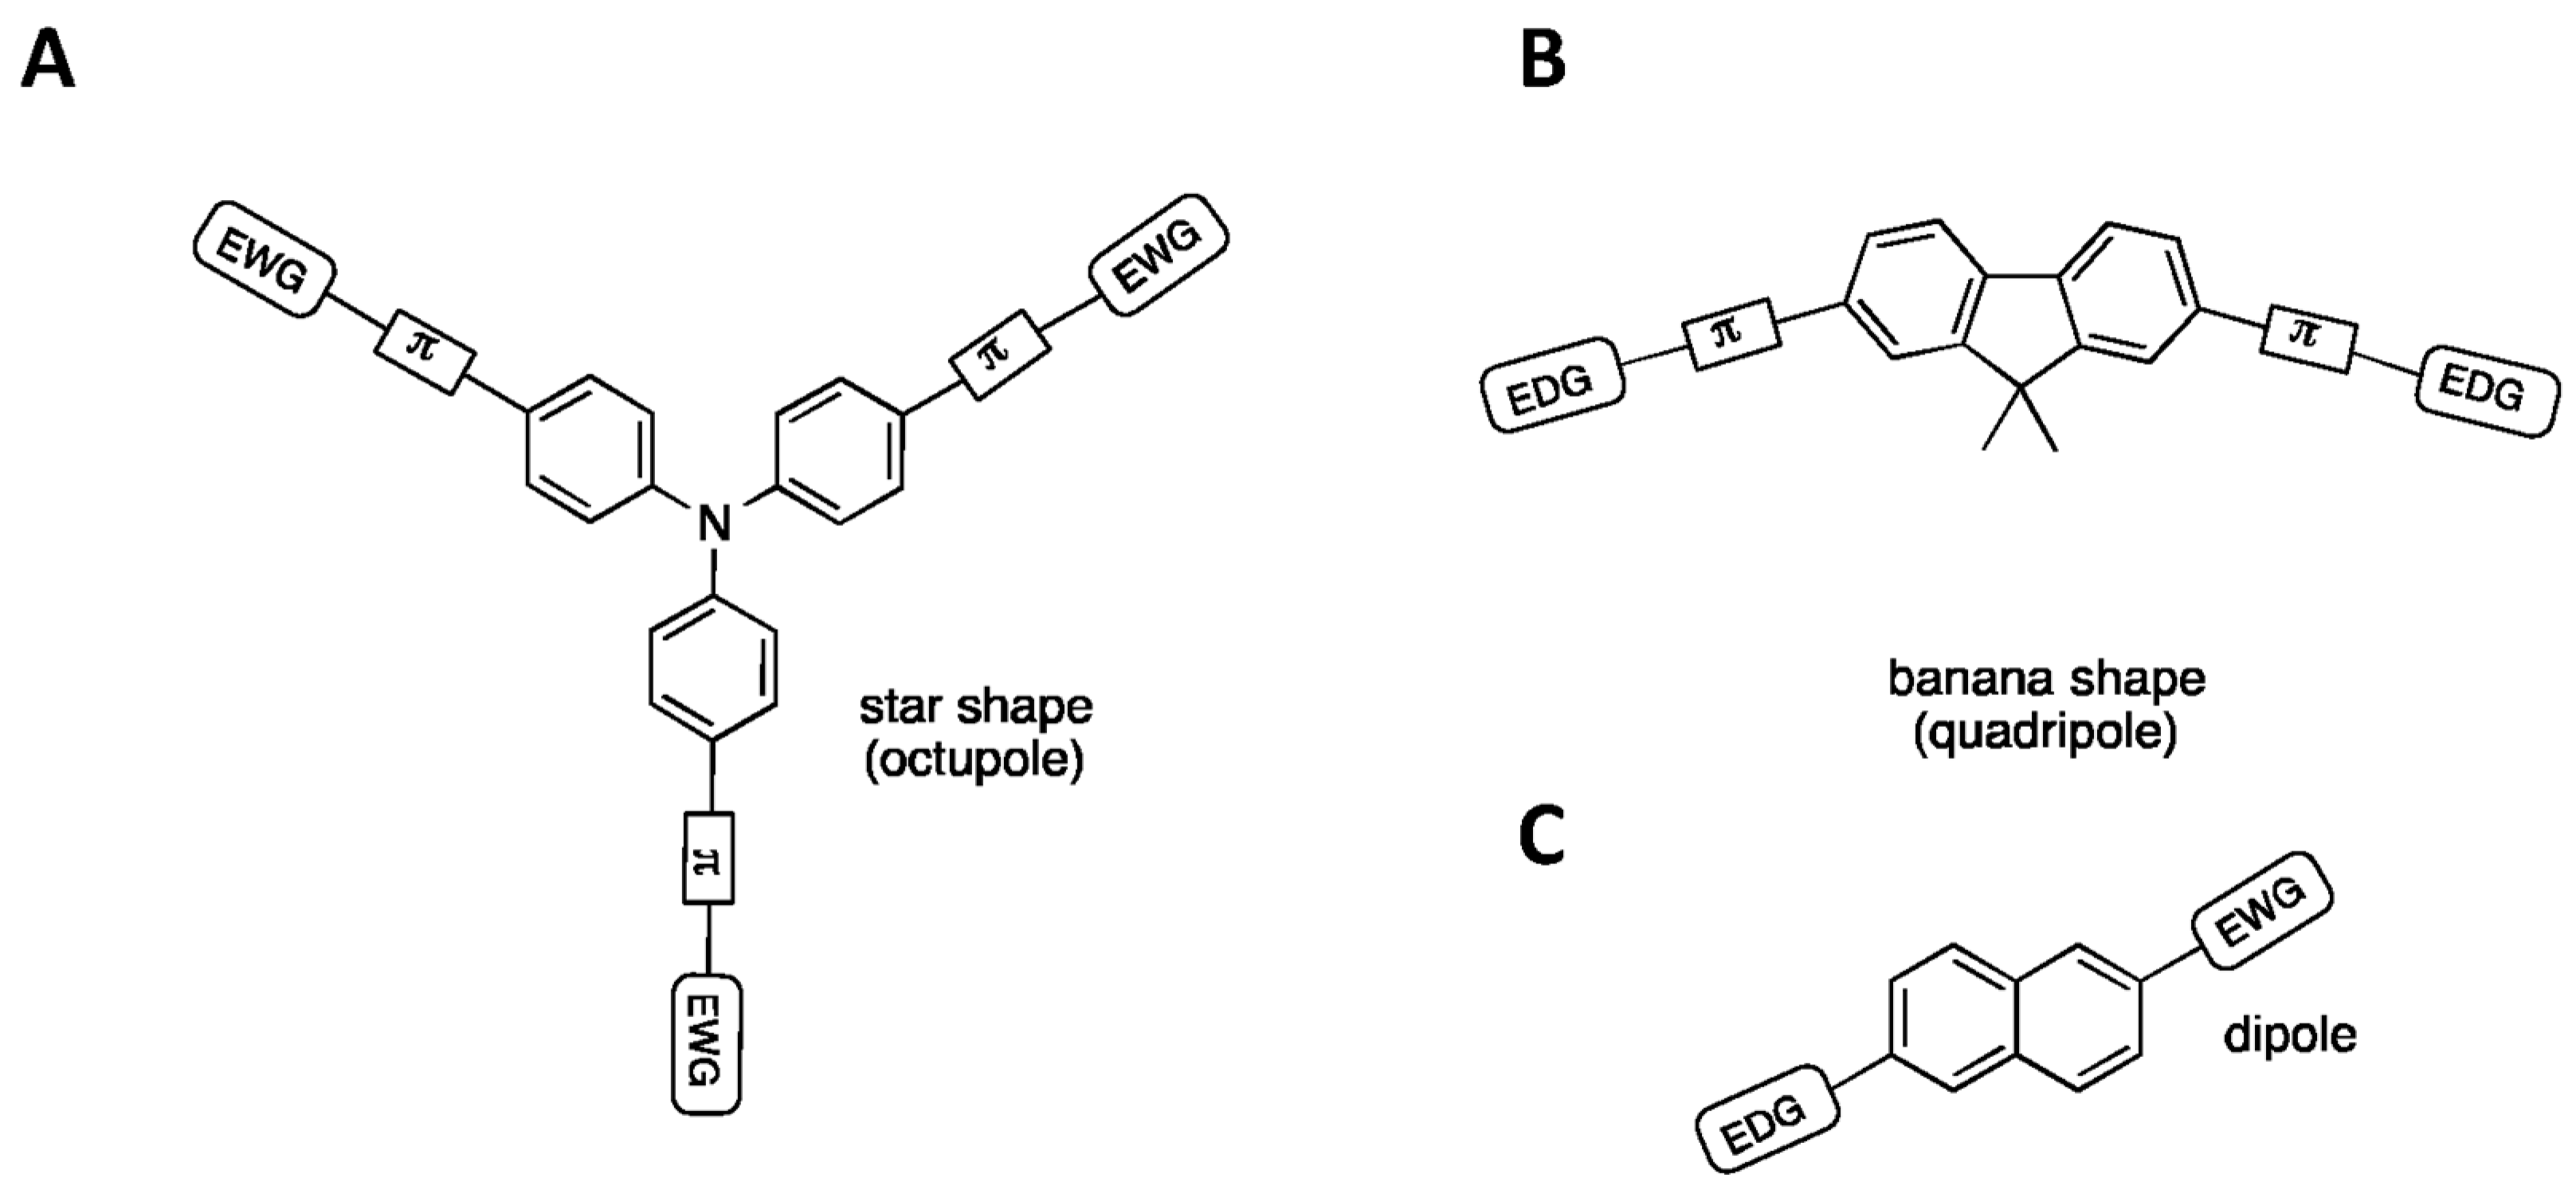
- Apolar chromophores in which local state emission occurs with no electron donor and accepting groups. Due to this absence, electrons remain localized at the excited state. Local state emission features small Stokes shifts, and can present vibronic structures and symmetry if the π-conjugated system is very rigid. The most common apolar fluorophores are perylenes, anthracenes, rubrenes, and pyrenes.
- -
- Push–pull chromophores possessing strong electron donor and accepting groups. These groups favor electron delocalization along all of the π-conjugated system, leading to significant electron density change or internal charge transfer (iCT) at excited states manifested by large Stokes shifts. As iCT excited states are more polar than fundamental states, the Stokes shift increases with the polarity of the solvent. The most common push–pull fluorophores are coumarins [43].
- -
- Cyanine chromophores featuring an electron delocalization along a π-conjugated system with an odd number of atoms. They usually possess a thoroughly delocalized charge and small Stokes shifts. The most common cyanine fluorophores are cyanines, squaraines, xanthenes, and bodipy [44].
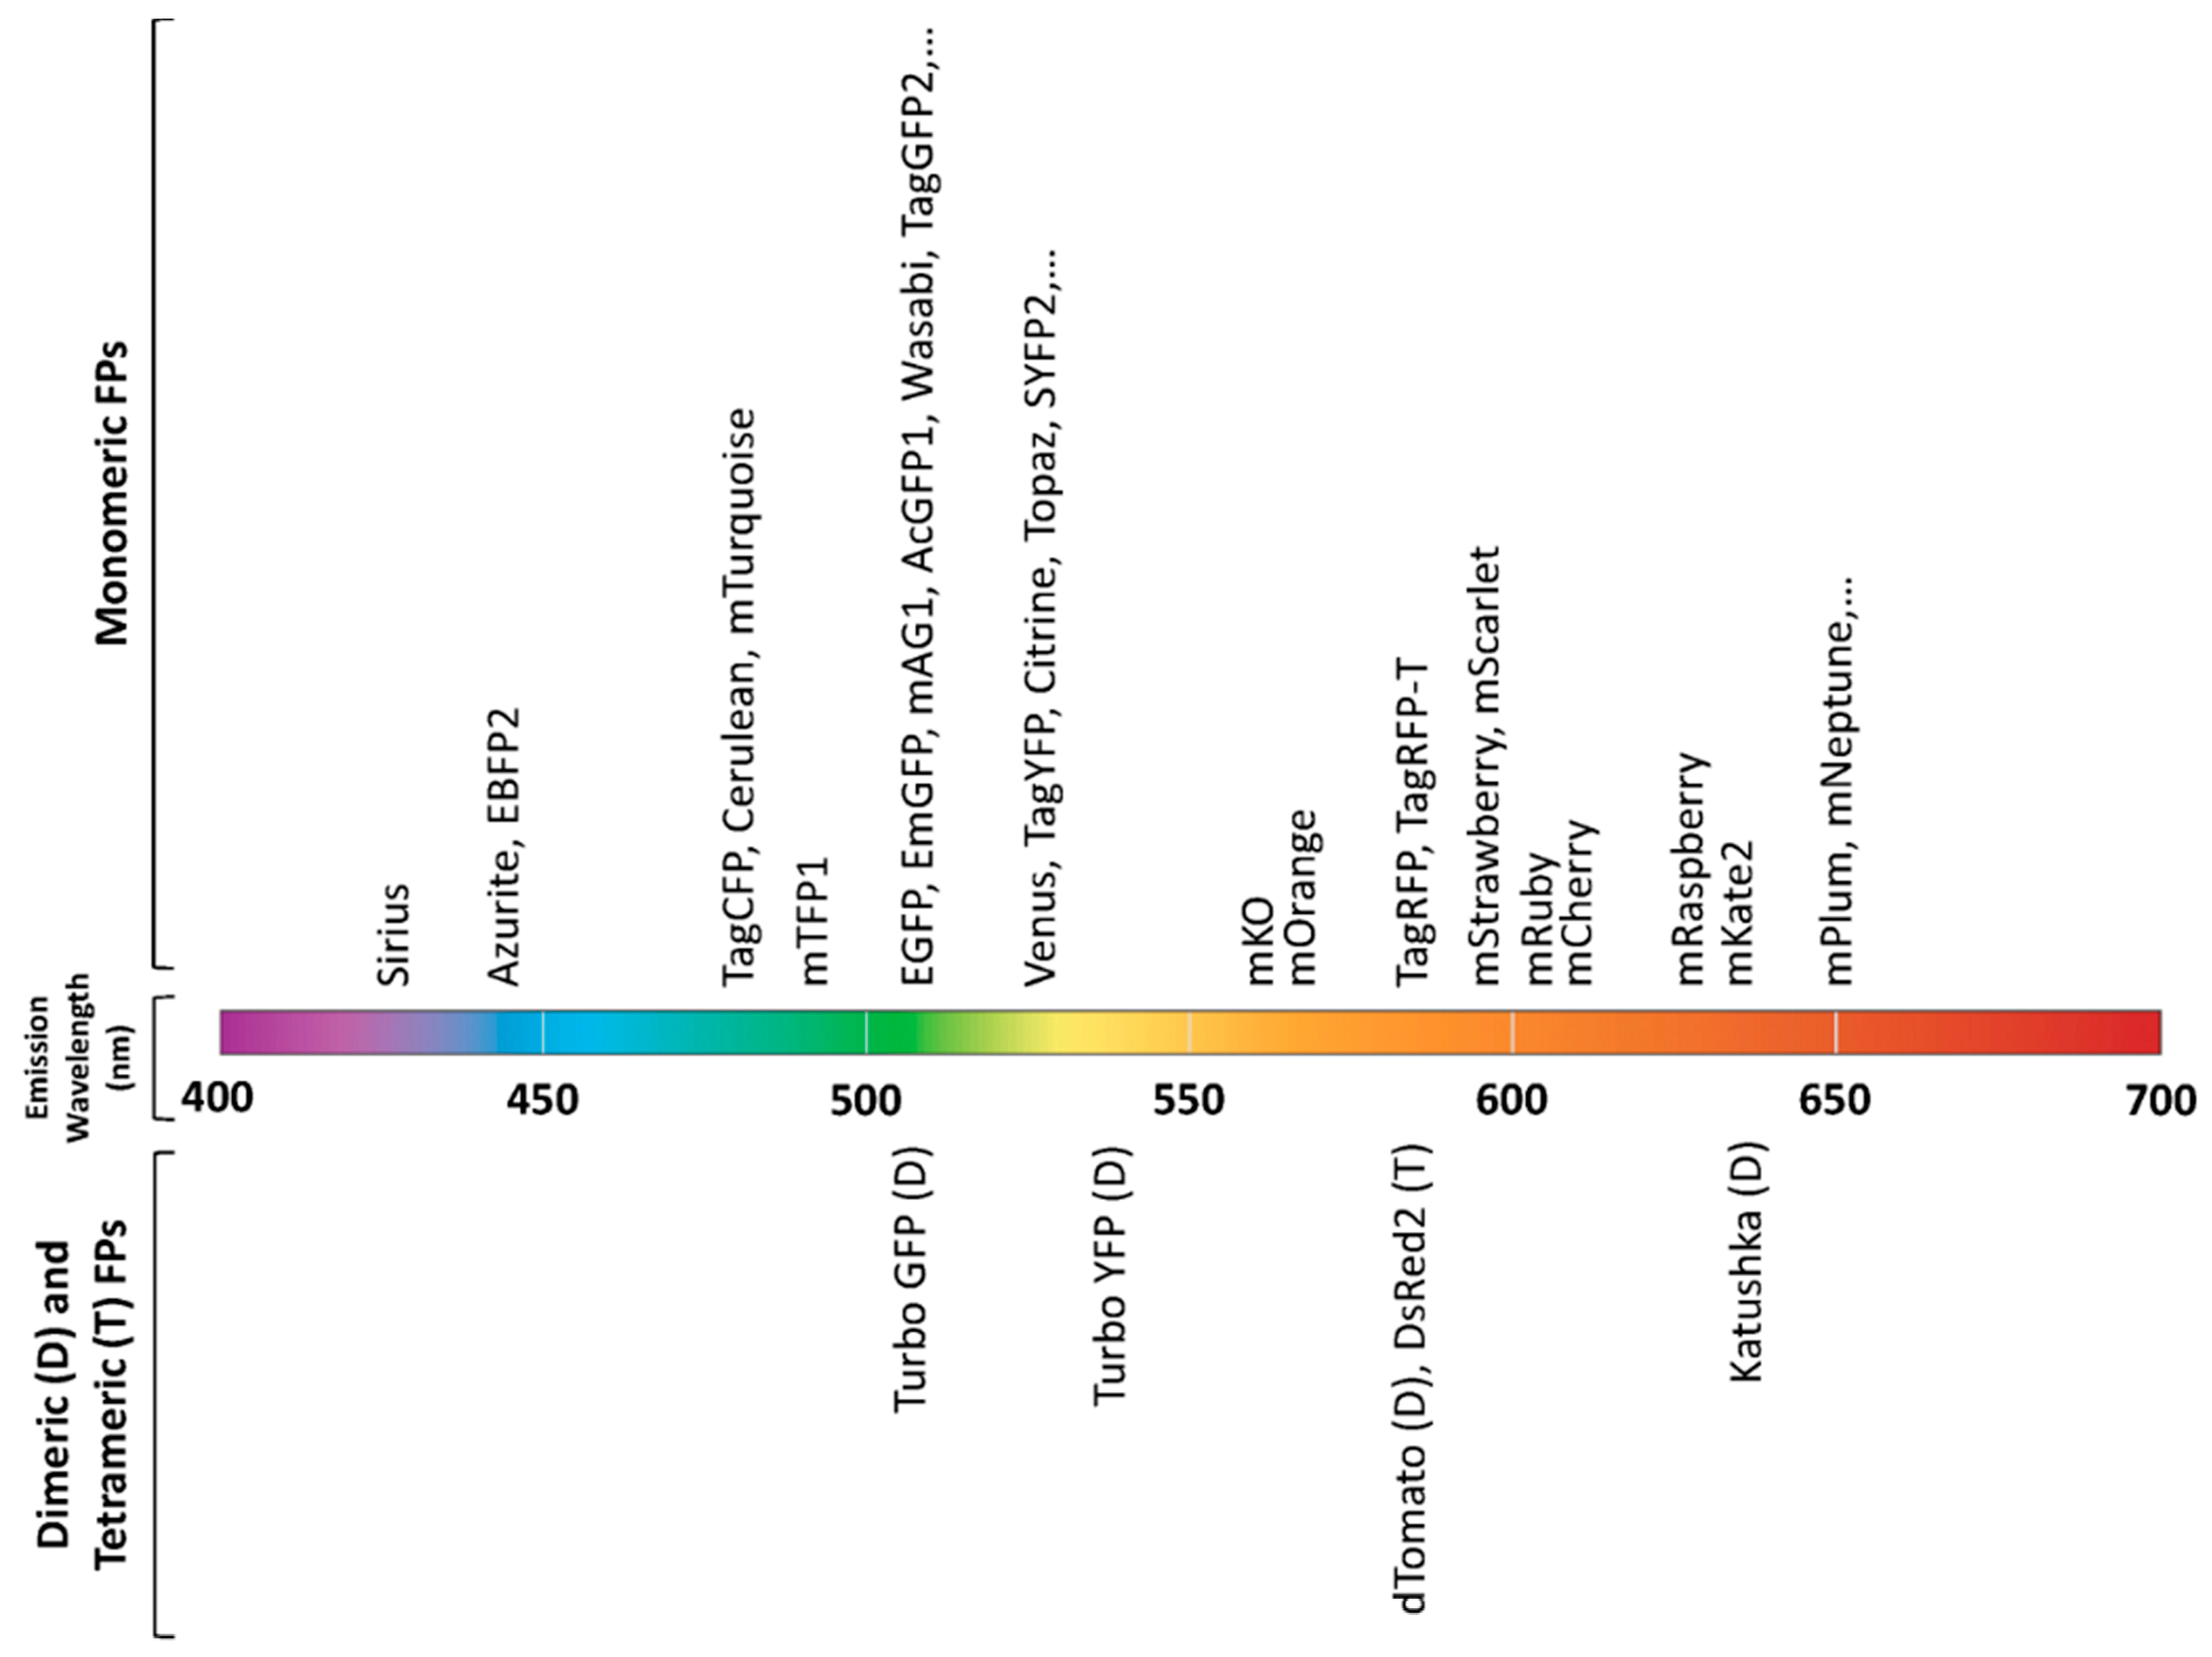
2.3. Fluorescent Proteins (FPs)
- -
- Sensors based on a single FP with no additional protein domain used for the detection of pH, Cl−, metal ions, and redox potential variations. Changes of brightness or excitation–emission wavelengths depend on the environment.
- -
- Sensors built on a single FP fused to conformationally sensitive detector domain(s) (Ca2+, hydrogen peroxyde, phosphorylation, membrane potential). Conformational changes affect spectral properties of the FP.
- -
- FRET-based sensors with a change in efficiency of resonance energy transfer between two spectrally differing FPs (Ca2+, cyclic nucleotides, glutamate, kinases, …).
- -
- Translocation sensors. FP fused to specific protein domains demonstrates environmentally dependent changes in intracellular compartments.
2.4. Fluorescence Lifetime Imaging Microscopy (FLIM)
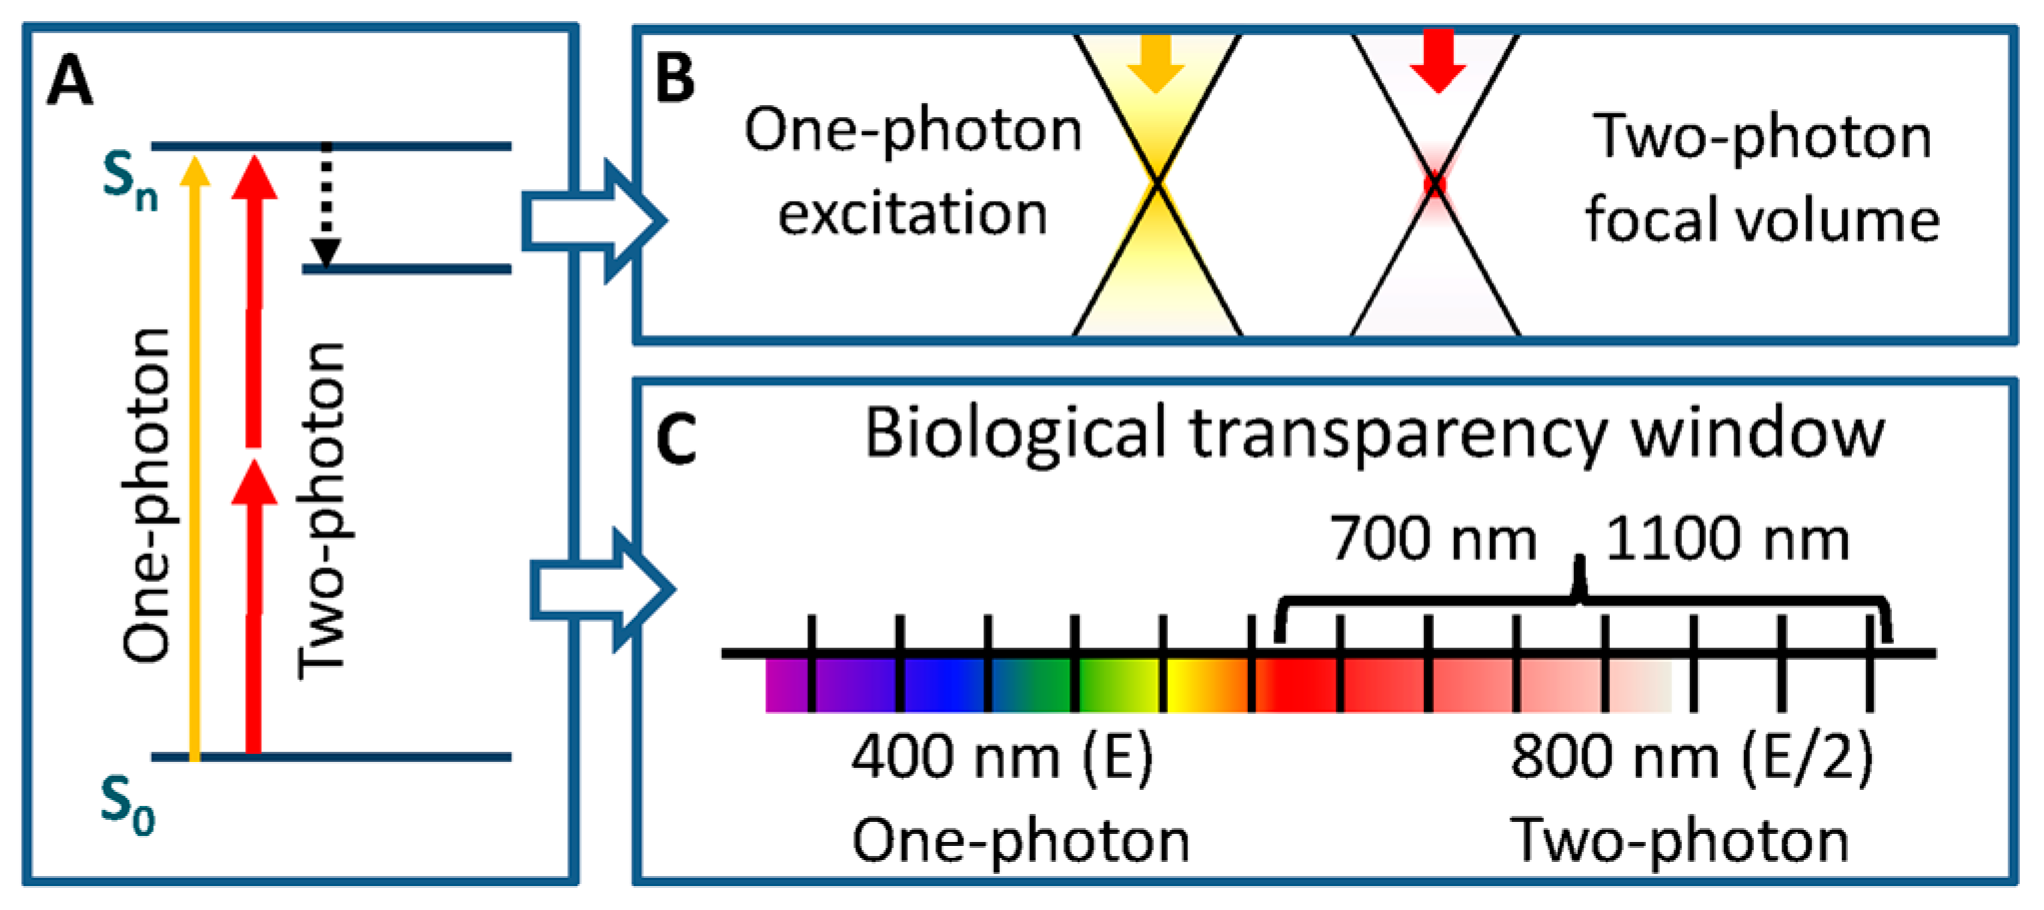
2.5. Fluorescent Organic Probes in Two-Photon (2P) Microscopy
2.6. Fluorescent Organic Probes in Nanoscopy
- -
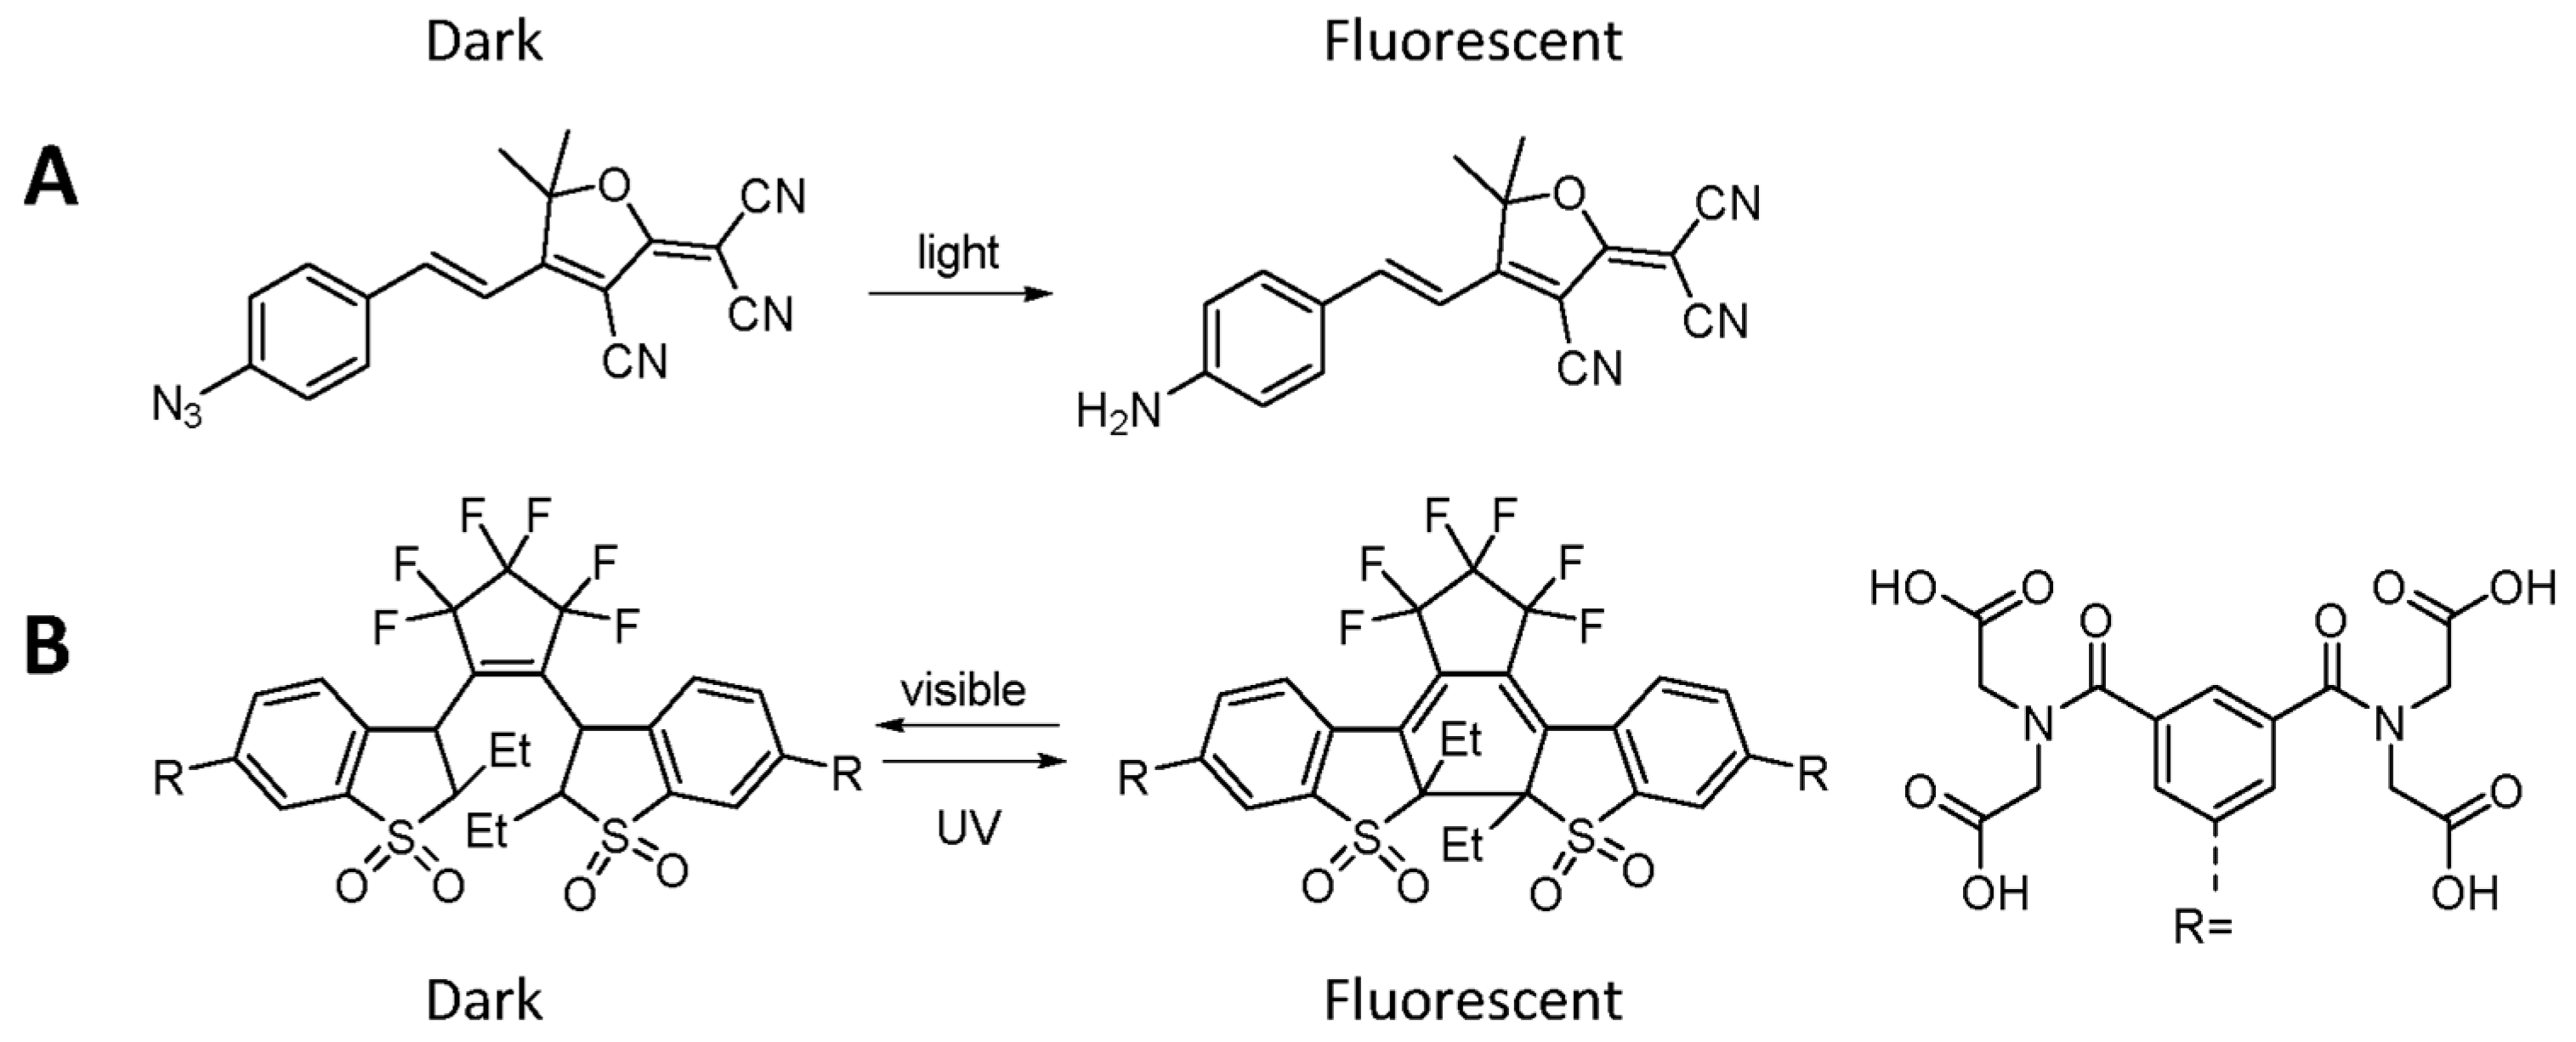
- Photoactivatable FPs (PAFPs) which undergo activation from a nonfluorescent (dark) state to a fluorescent state (PATagRFP, PAmKate, …).
- -
- Photoswitchable (also called photoconvertible) FPs (PSFPs) that can be converted from one fluorescent state to another (Dendra2, mEos2, …).
- -
- Reversibly photoswitchable FPs (rsFPs). rsFPs can be photoswitched repeatedly between fluorescent and nonfluorescent states (rsEGFP, rsTagRFP, …).
3. Strategies for Labeling Living Samples with Fluorescent Probes
3.1. Strategies of Labeling for Isolated Living Cells
3.1.1. Fluorescent Labeling to Monitor Cell Viability
3.1.2. Fluorescent Labeling for Cell Tracking
3.1.3. Fluorescent Labeling to Identify Membrane, Organelles, and Macromolecules
3.1.4. Fluorescent Labeling to Monitor Cellular Activities
- Protein Function
- Cell Metabolism
3.2. Strategies of Labeling Living Cells within Organotypic Slices or Organs
3.3. Strategies for Labeling Living Cells within an Organism
3.3.1. Injection of Fluorescent Probes and Labeled Cells
3.3.2. Transfection through Electroporation and Transgenic Organisms
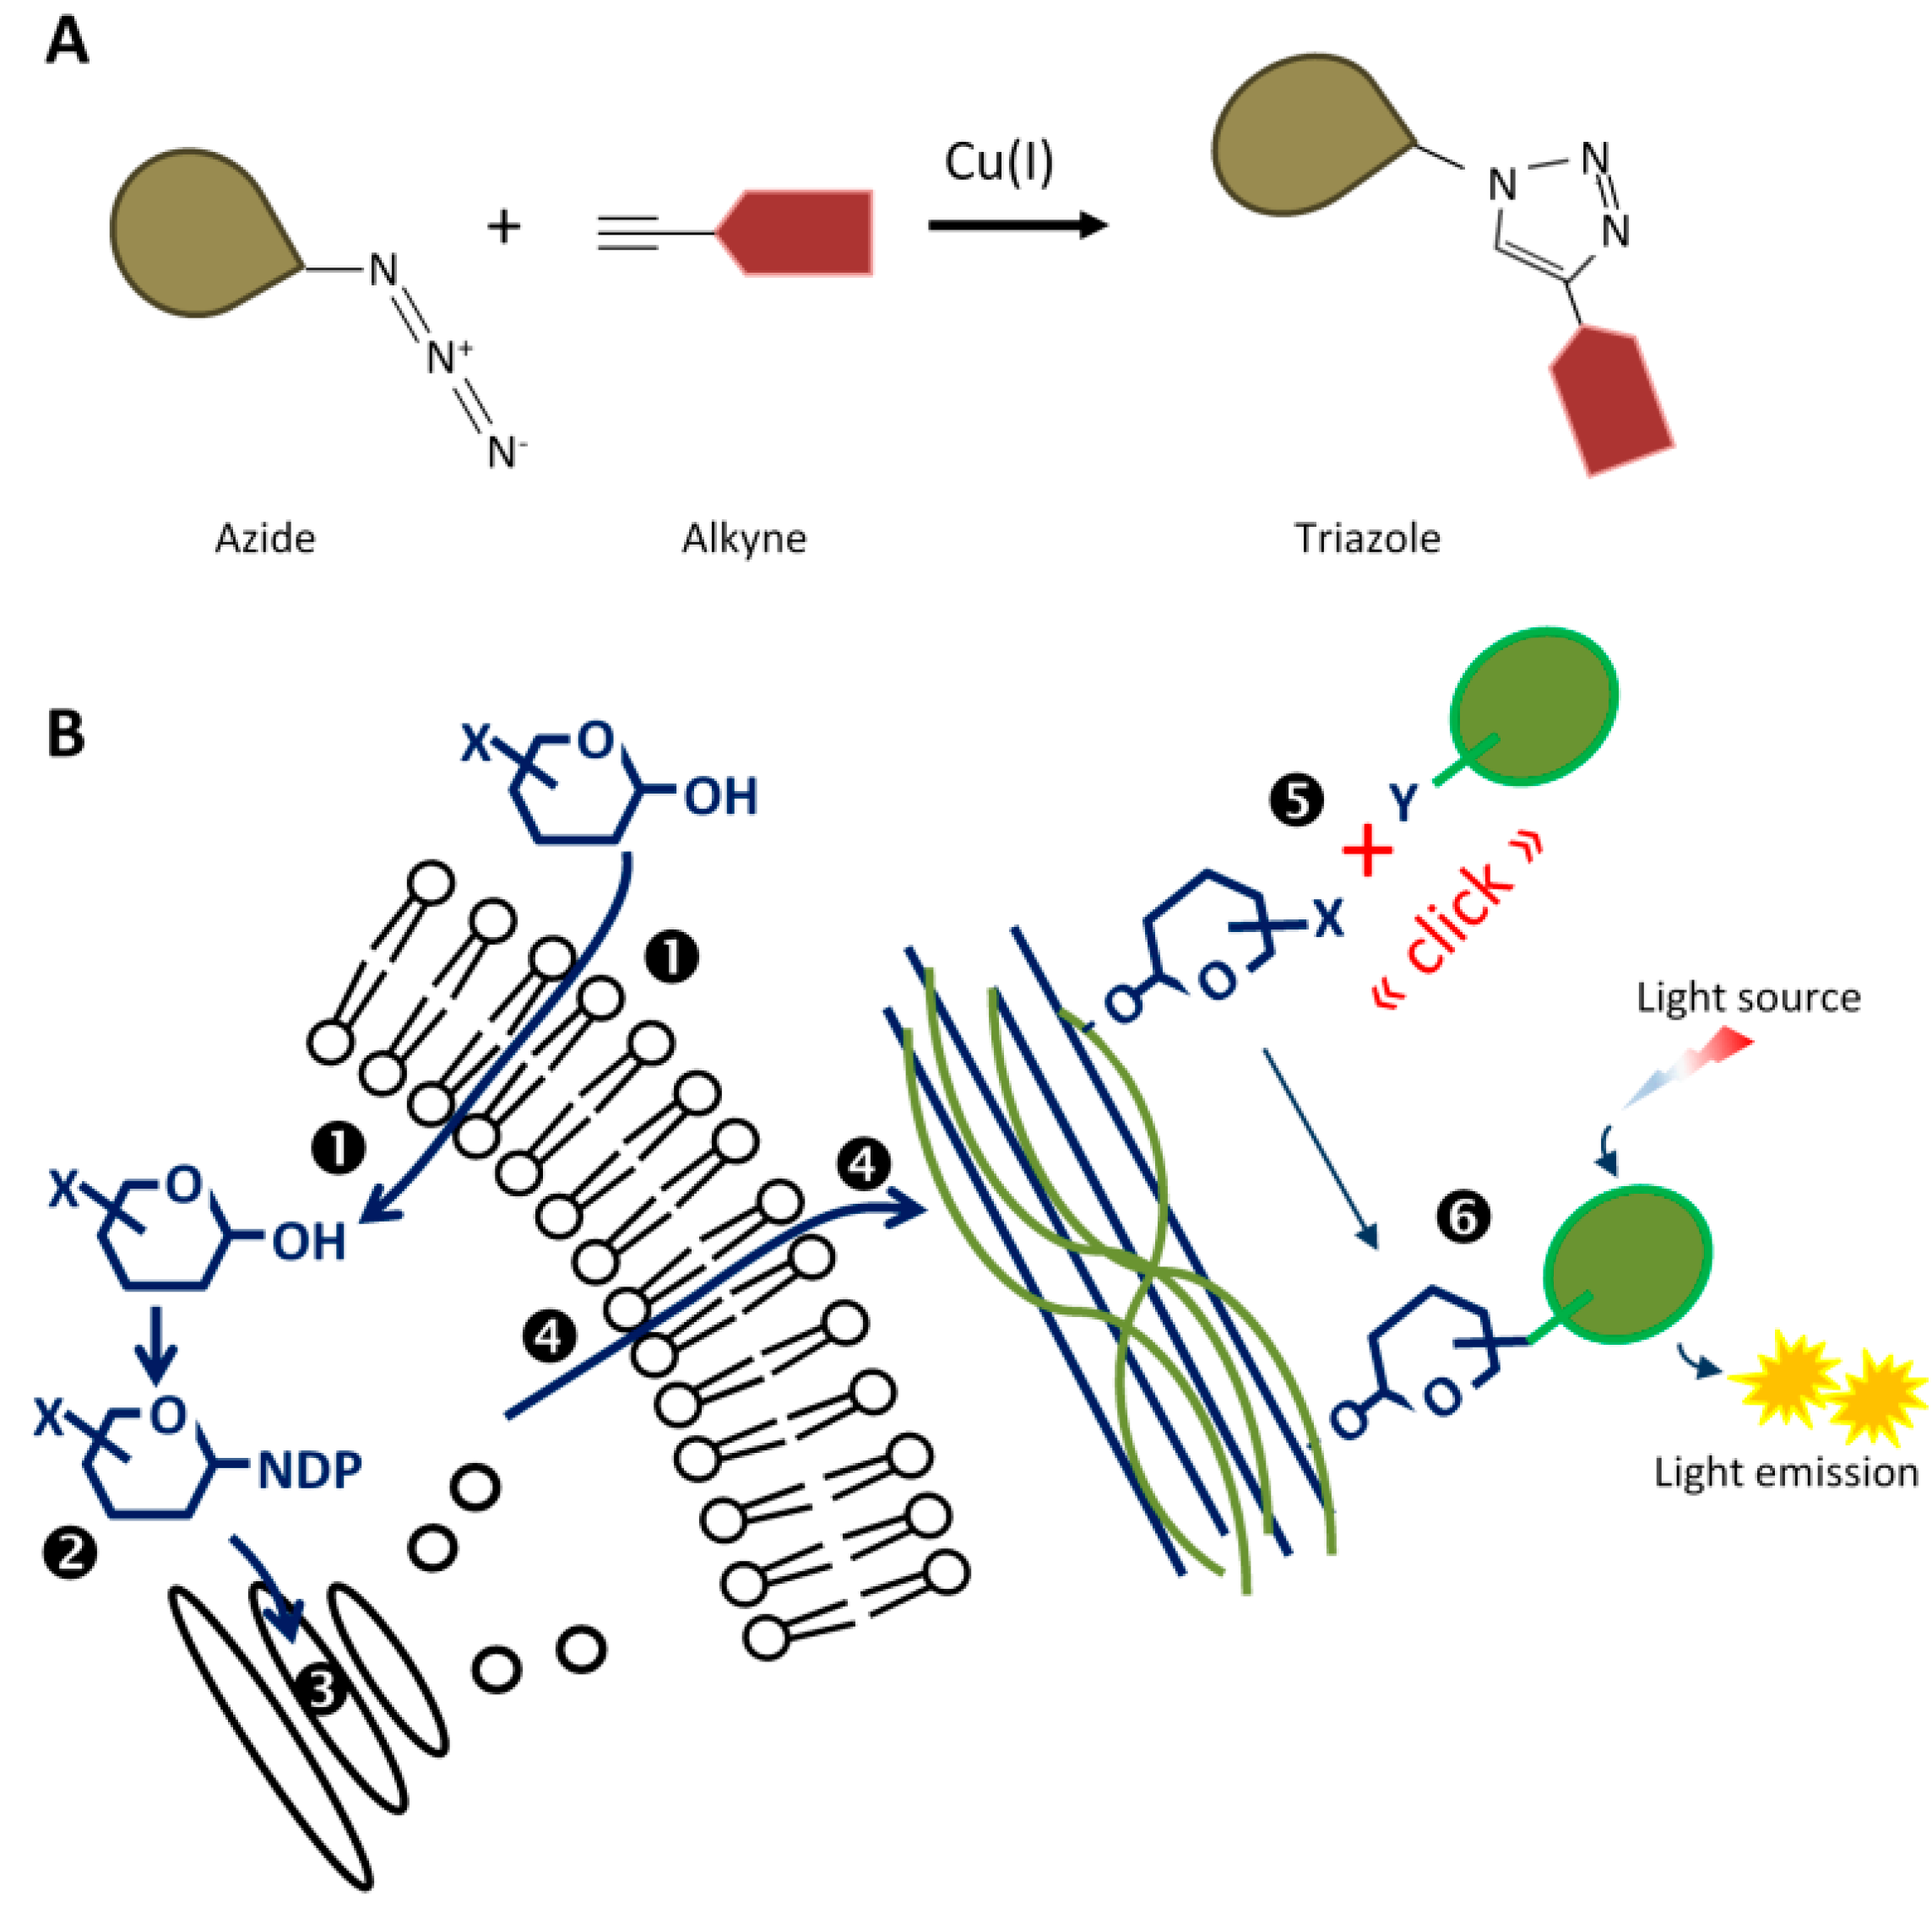
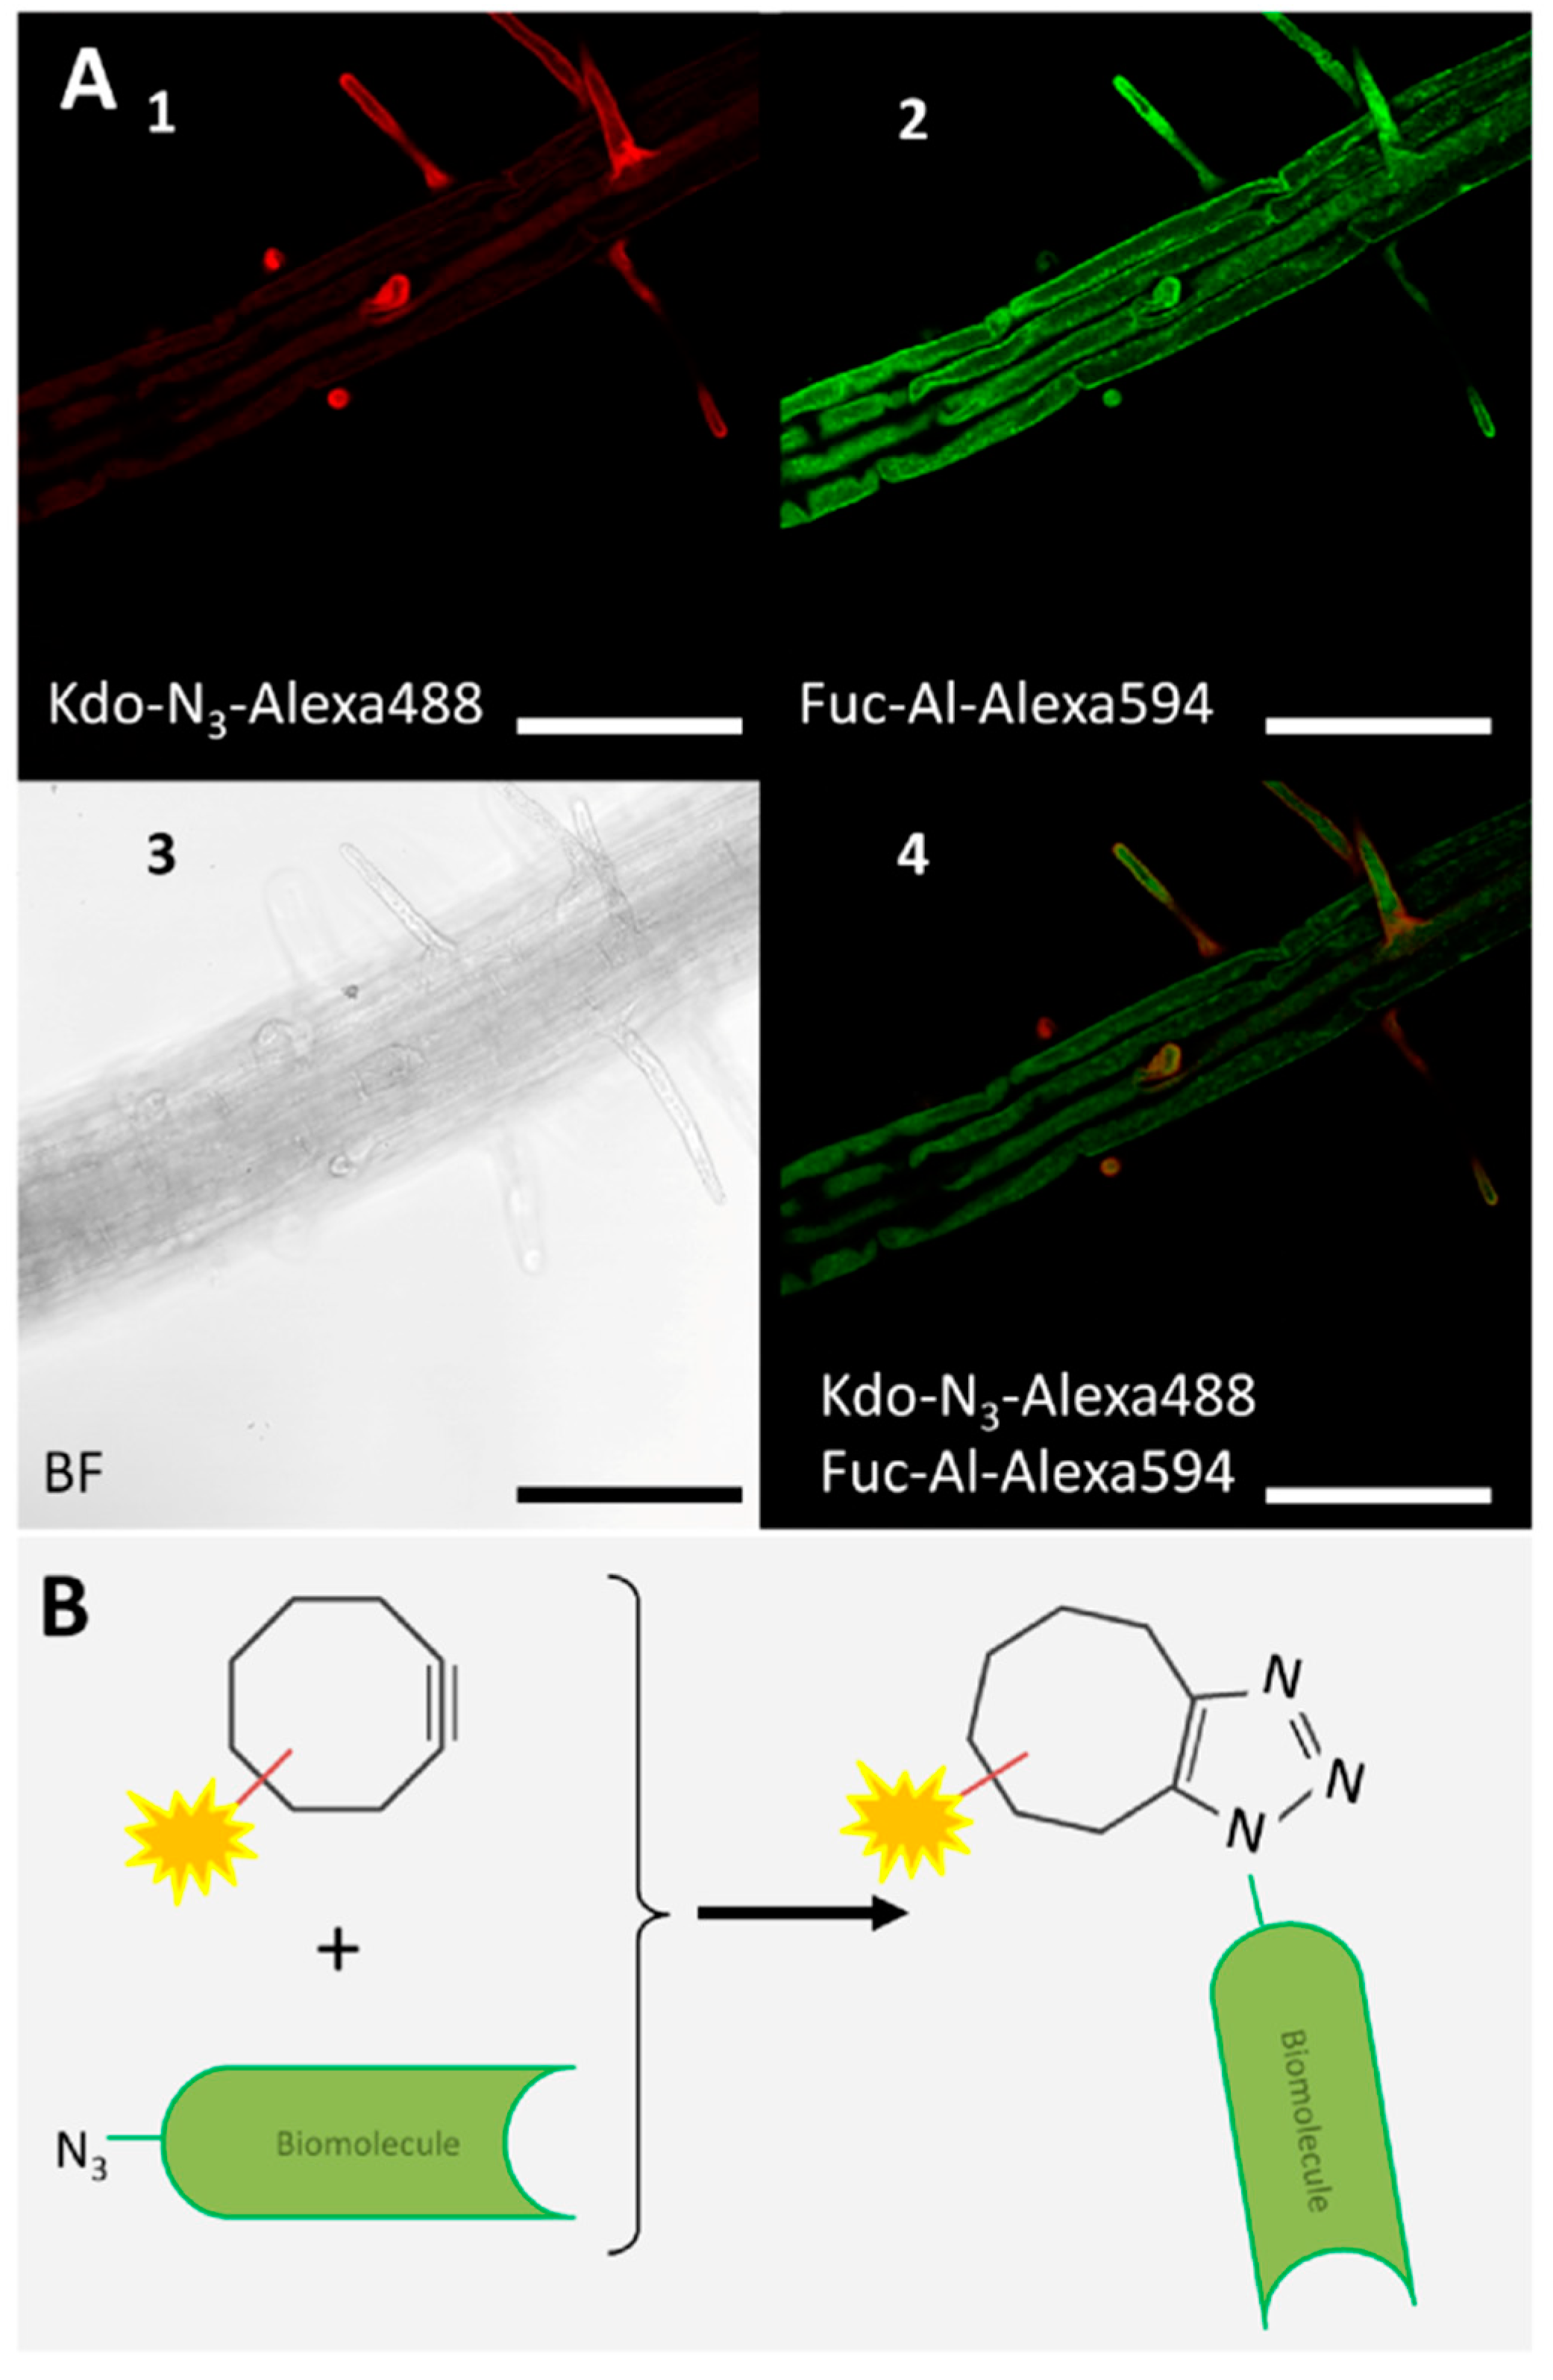
3.3.3. Click Chemistry in Living Organisms
4. Progress in Synthesis of Organic Fluorescent Probes
4.1. Development of Small Near-Infrared Organic Molecules to Reduce Fine Cytotoxicity and to Image Thicker Samples
4.2. Development of Organic Probes to Increase Resolution in Microscopy
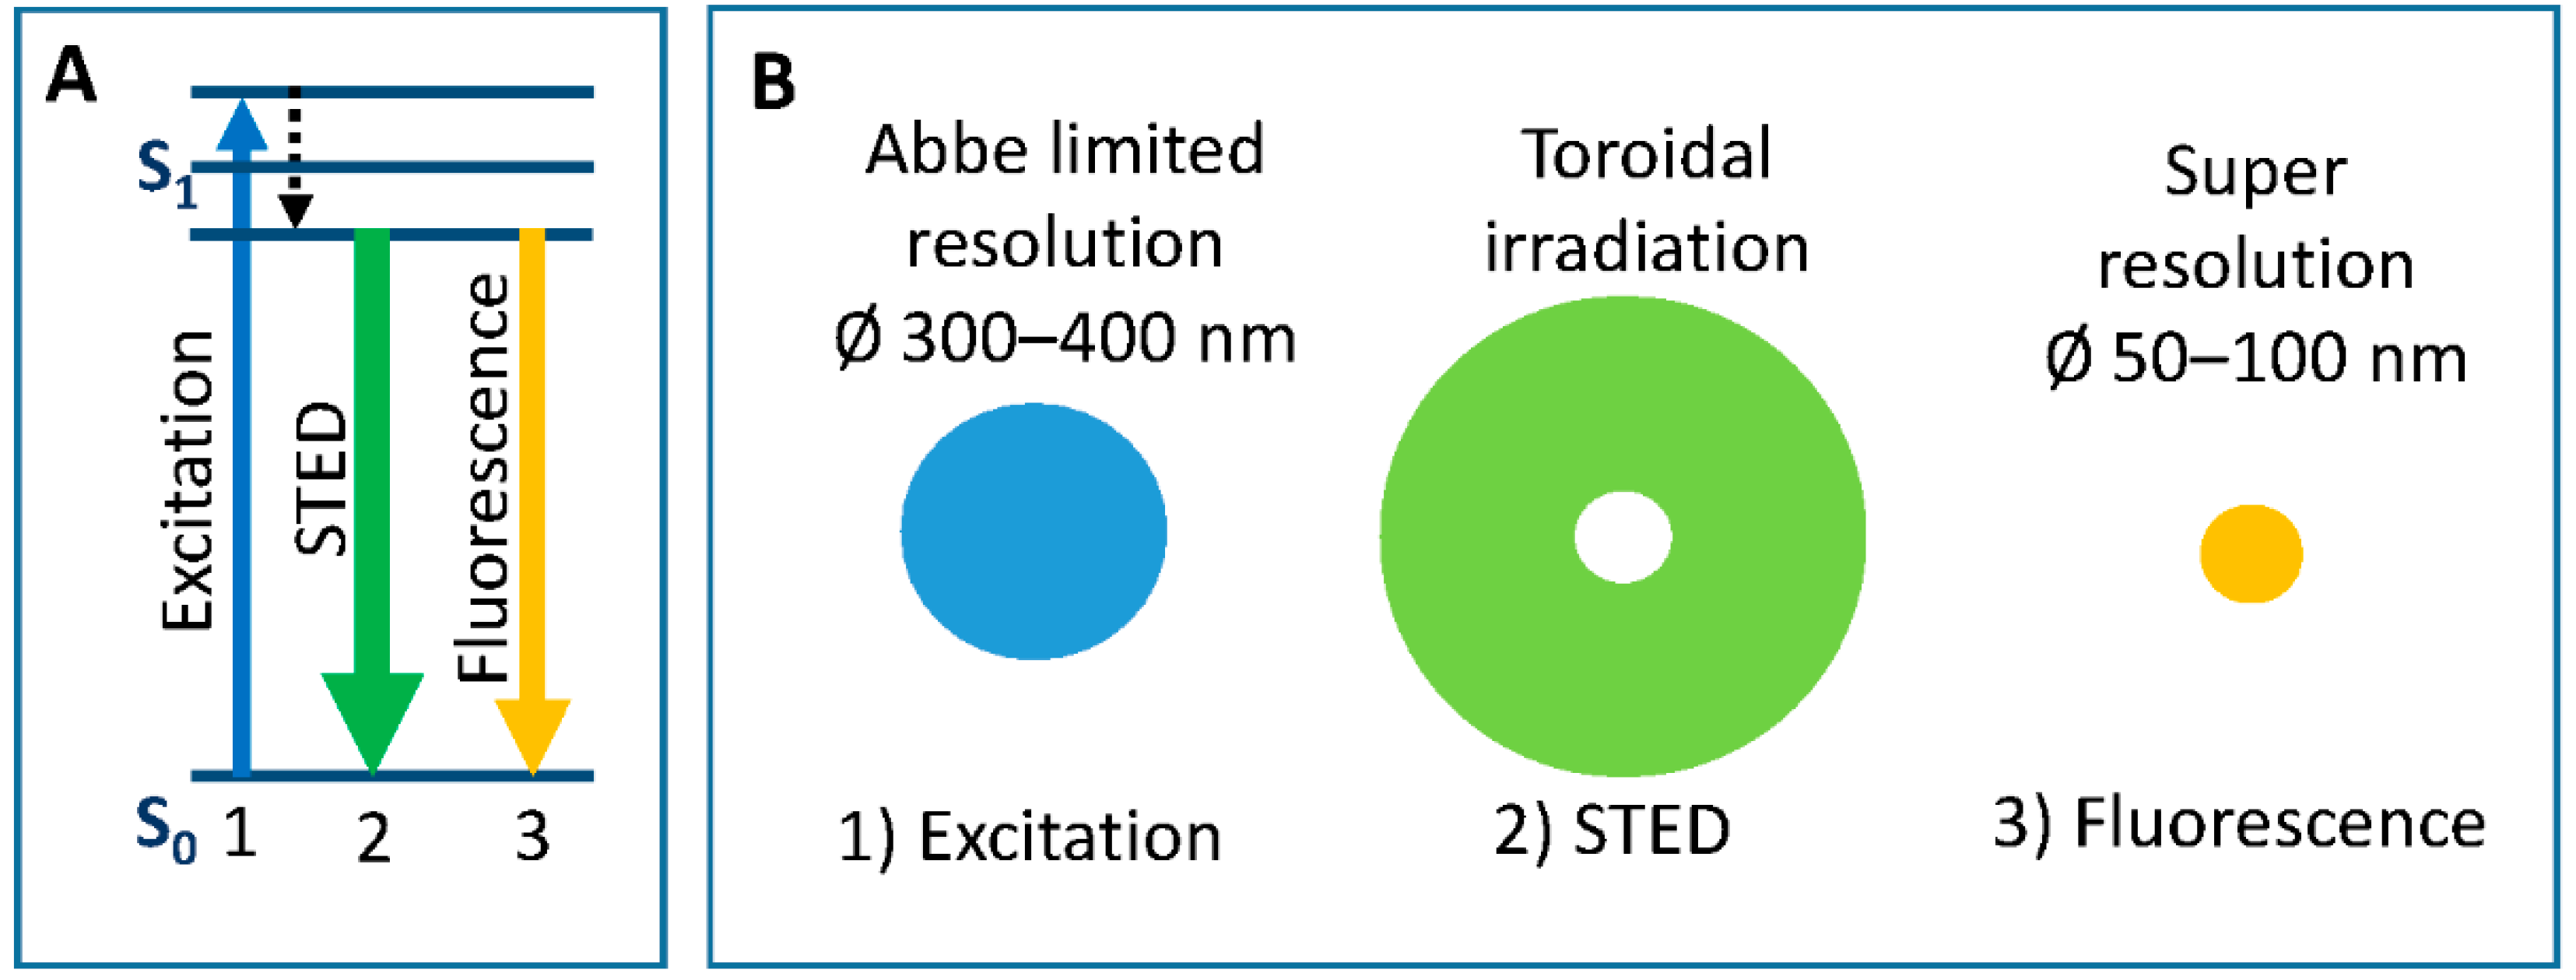
4.2.1. Development of Organic Probes for STED Nanoscopy
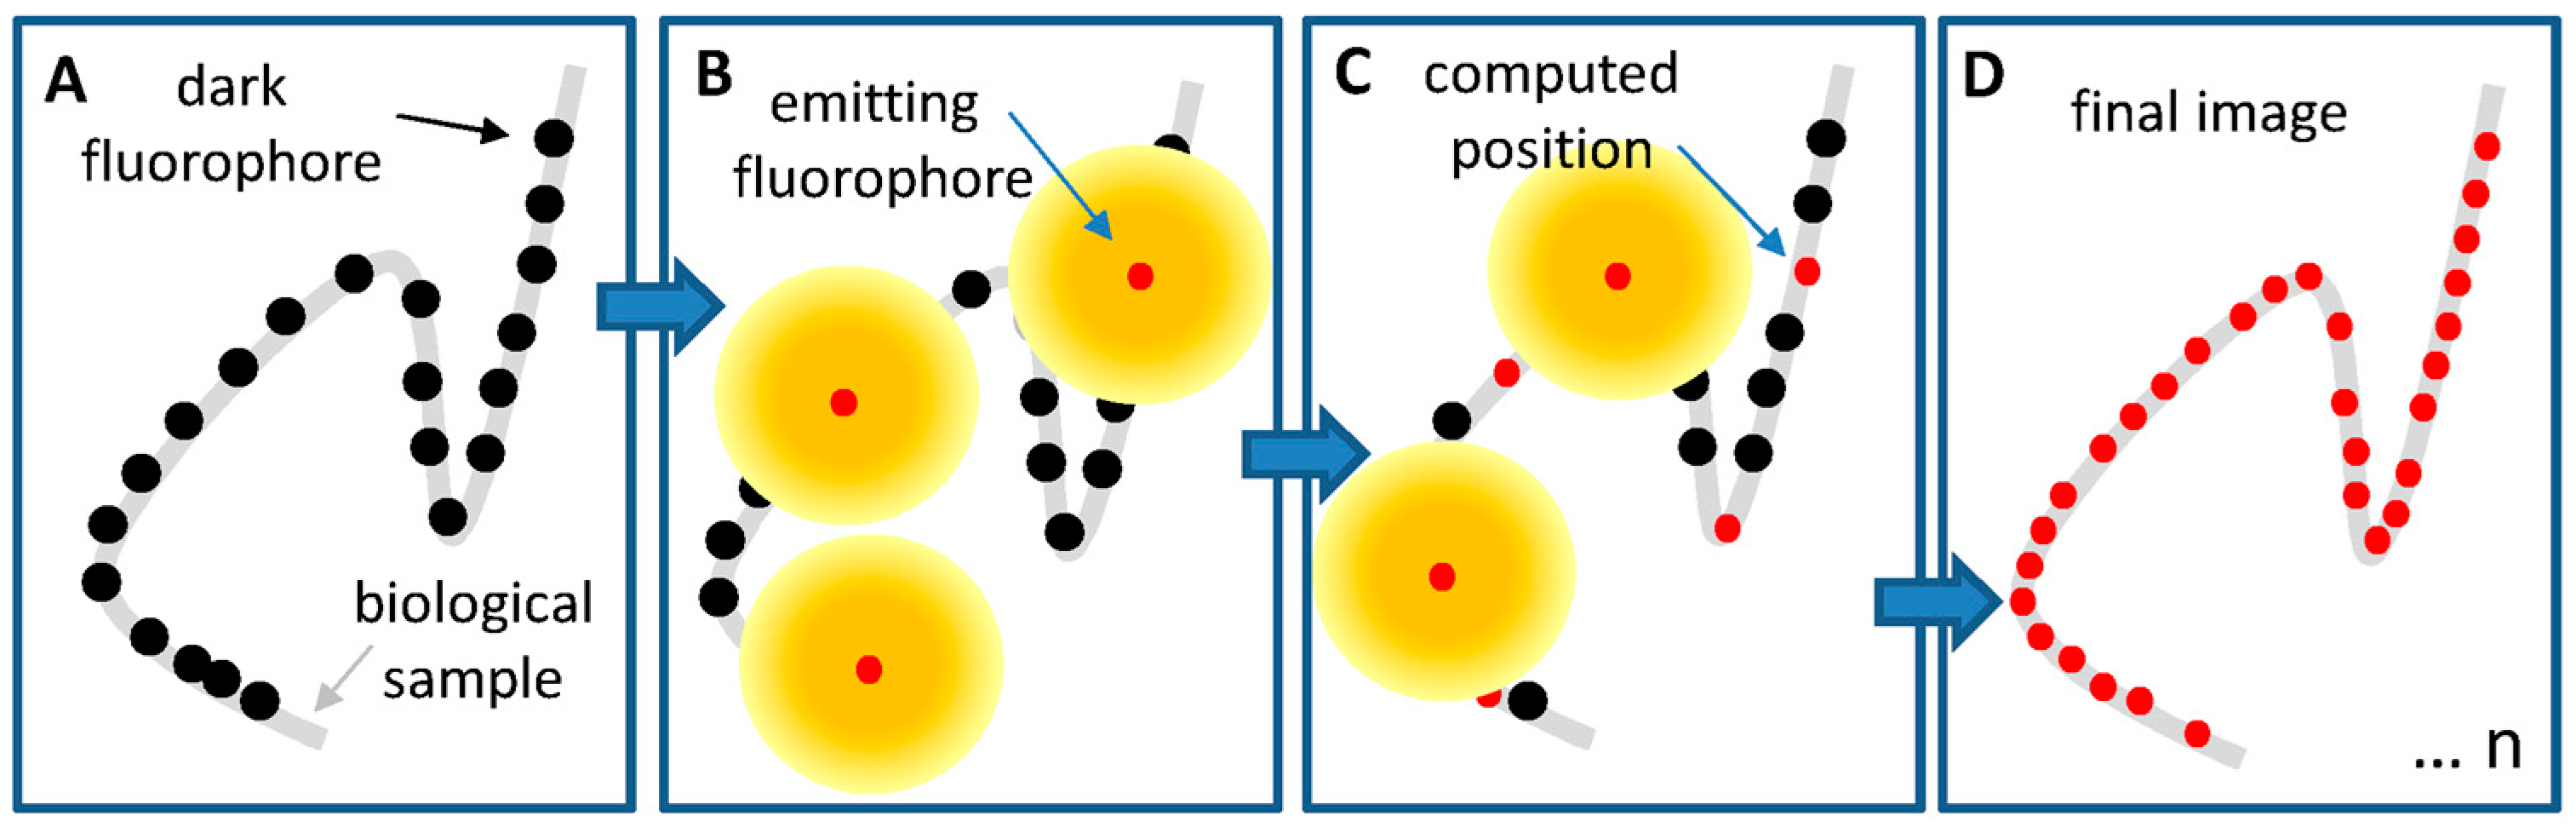
4.2.2. Development of Organic Probes for Stochastic Approaches
5. Generation, Collection, Detection, and Analysis of the Fluorescence Signal from Living Samples
5.1. Light Sources
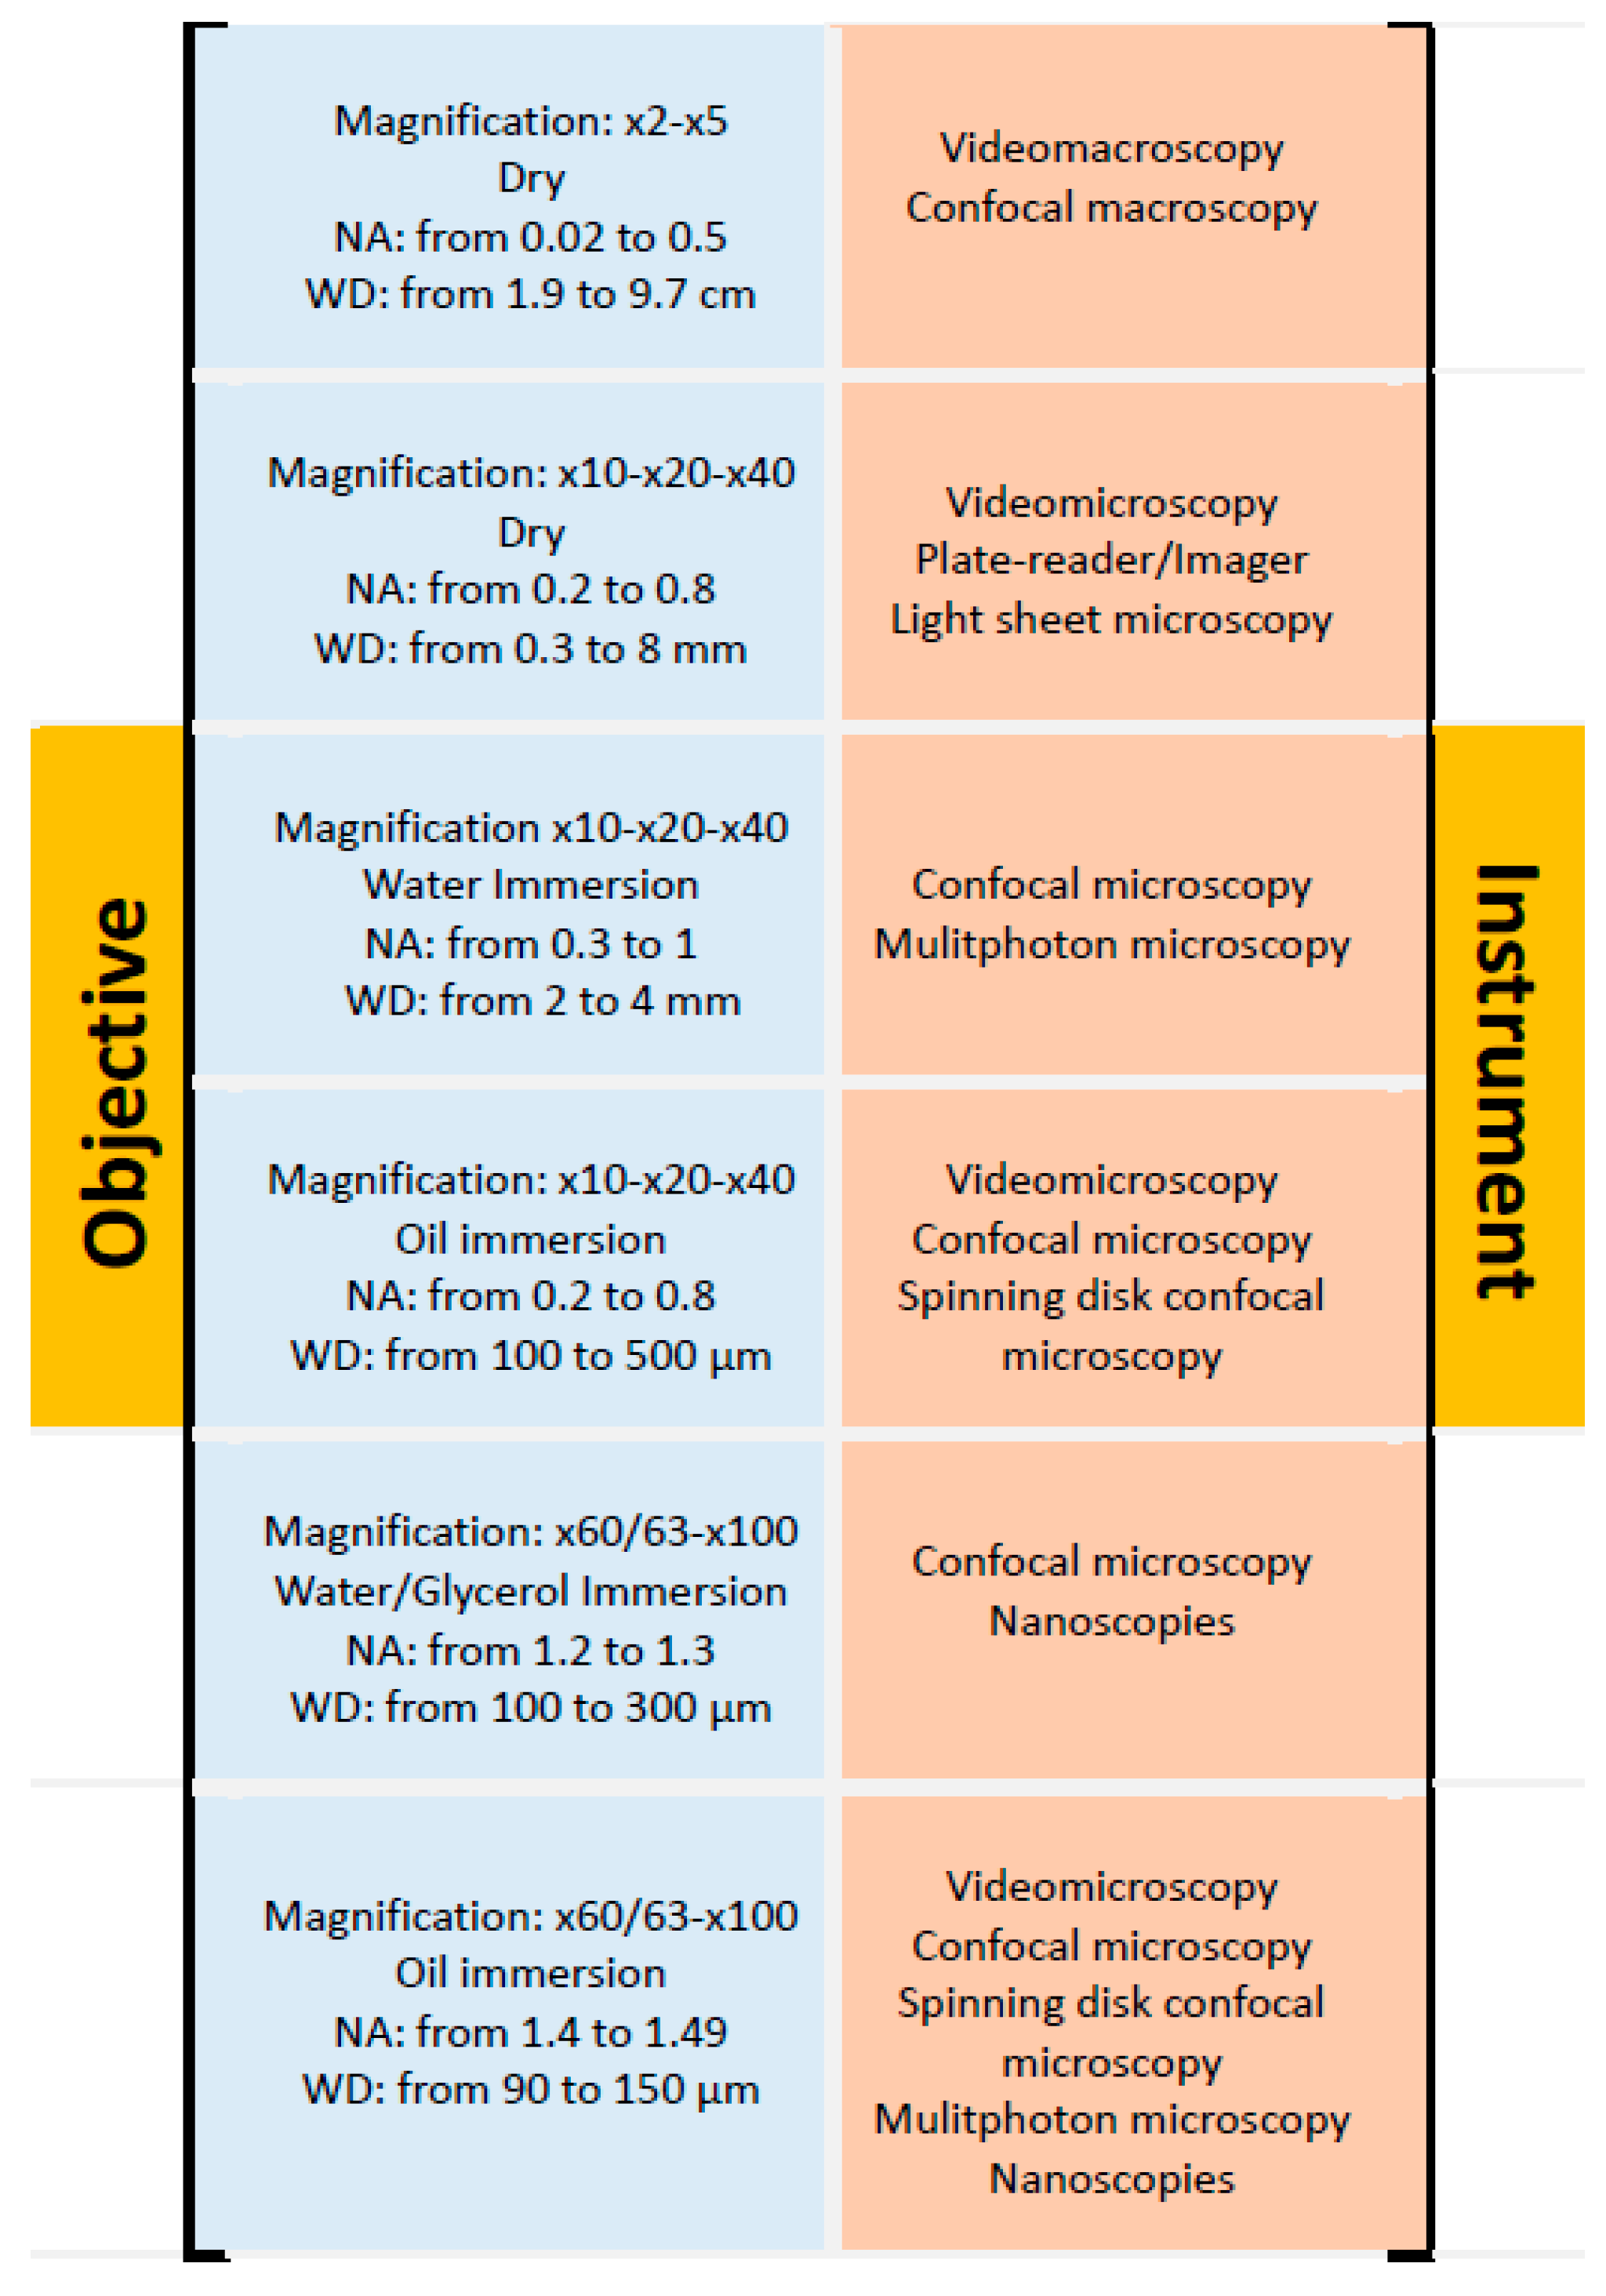
5.2. Objectives
5.3. Detectors
5.4. Instrument Performance
5.5. Image Processing
6. Conclusions
Author Contributions
Funding
Conflicts of Interest
References
- Tsien, R.Y. Constructing and exploiting the fluorescent protein paintbox (Nobel Lecture). Angew. Chem. Int. Ed. 2009, 48, 5612–5626. [Google Scholar] [CrossRef] [PubMed]
- Chudakov, D.M.; Matz, M.V.; Lukyanov, S.; Lukyanov, K.A. Fluorescent proteins and their applications in imaging living cells and tissues. Physiol. Rev. 2010, 90, 1103–1163. [Google Scholar] [CrossRef] [PubMed]
- Betzig, E. Nobel lecture: Single moleciles, cells, and super-resolution optics. Rev. Mod. Phys. 2015, 87, 1153. [Google Scholar] [CrossRef]
- Hell, S.W. Nobel lecture: Nanoscopy with freely propagating light. Rev. Mod. Phys. 2015, 87, 1169. [Google Scholar] [CrossRef]
- Moerner, W.E. Nobel lecture: Single-molecule spectroscopy, imaging, and photocontrol: Foundations for super-resolution microscopy. Rev. Mod. Phys. 2015, 87, 1183. [Google Scholar] [CrossRef]
- Sahl, S.J.; Hell, S.W.; Jakobs, S. Fluorescence nanoscopy in cell biology. Nat. Rev. Mol. Cell. Biol. 2017, 18, 685–701. [Google Scholar] [CrossRef] [PubMed]
- Borlinghaus, R.T.; Birk, H.; Schreiber, F. Detectors for sensitive detection: HyD. In Current Microscopy Contributions to Advances in Science and Technology, 1st ed.; Mendez-Vilas, A., Ed.; Formatex Research Center: Badajoz, Spain, 2012; Volume 2, pp. 818–825. [Google Scholar]
- Michalet, X.; Cheng, A.; Antelman, J.; Suyama, M.; Arisaka, K.; Weiss, S. Hybrid photodetector for single-molecule spectroscopy and microscopy. Proc. SPIE Int. Soc. Opt. Eng. 2008, 6862. [Google Scholar] [CrossRef]
- Juris, A.; Balzani, V.; Barigelletti, F.; Campagna, S.; Belser, P.; von Zelewsky, A. Ru(II) polypyridine complexes: Photophysics, photochemistry, eletrochemistry, and chemiluminescence. Coord. Chem. Rev. 1988, 84, 85–277. [Google Scholar] [CrossRef]
- Fernández-Moreira, V.; Thorp-Greenwood, F.L.; Coogan, M.P. Application of d6 transition metal complexes in fluorescence cell imaging. Chem. Commun. 2010, 46, 186–202. [Google Scholar] [CrossRef] [PubMed]
- Zhao, Q.; Huang, C.; Li, F. Phosphorescent heavy-metal complexes for bioimaging. Chem. Soc. Rev. 2011, 40, 2508–2524. [Google Scholar] [CrossRef] [PubMed]
- Andraud, C.; Maury, O. Lanthanide complexes for nonlinear optics: From fundamental aspects to applications. Eur. J. Inorg. Chem. 2009, 2009, 4357–4371. [Google Scholar] [CrossRef]
- Sy, M.; Nonat, A.; Hildebrandt, N.; Charbonnière, L.J. Lanthanide-based luminescence biolabelling. Chem. Commun. 2016, 52, 5080–5095. [Google Scholar] [CrossRef] [PubMed]
- Bünzli, J.C.G. Lanthanide luminescence for biomedical analyses and imaging. Chem. Rev. 2010, 110, 2729–2755. [Google Scholar] [CrossRef] [PubMed]
- Chatterjee, D.K.; Rufaihah, A.J.; Zhang, Y. Upconversion fluorescence imaging of cells and small animals using lanthanide doped nanocrystals. Biomaterials 2008, 29, 937–943. [Google Scholar] [CrossRef] [PubMed]
- Shen, J.; Zhao, L.; Han, G. Lanthanide-doped upconverting luminescent nanoparticle platforms for optical imaging-guided drug delivery and therapy. Adv. Drug Deliv. Rev. 2013, 65, 744–755. [Google Scholar] [CrossRef] [PubMed]
- Dong, H.; Du, S.R.; Zheng, X.-Y.; Lyu, G.M.; Sun, L.D.; Li, L.D.; Zhang, P.Z.; Zhang, C.; Yan, C.H. Lanthanide nanoparticles: From design toward bioimaging and therapy. Chem. Rev. 2015, 115, 10725–10815. [Google Scholar] [CrossRef] [PubMed]
- Reisch, A.; Klymchenko, A.S. Fluorescent polymer nanoparticles based on dyes: Seeking brighter tools for bioimaging. Small 2016, 12, 1968–1992. [Google Scholar] [CrossRef] [PubMed]
- Mettra, B.; Appaix, F.; Olesiak-Banska, J.; Le Bahers, T.; Leung, A.; Matczyszyn, K.; Samoc, M.; van der Sanden, B.; Monnereau, C.; Andraud, C. A fluorescent polymer probe with high selectivity toward vascular endothelial cells for and beyond noninvasive two-photon intravital imaging of brain vasculature. ACS Appl. Mater. Interfaces 2016, 8, 17047–17059. [Google Scholar] [CrossRef] [PubMed]
- Petryayeva, E.; Algar, W.R.; Medintz, I.L. Quantum dots in bioanalysis: A review of applications across various platforms for fluorescence spectroscopy and imaging. Appl. Spectrosc. 2013, 67, 215–252. [Google Scholar] [CrossRef] [PubMed]
- Zhou, J.; Yang, Y.; Zhang, C. Toward biocompatible semiconductor Quantum Dots: From biosynthesis and bioconjugation to biomedical Application. Chem. Rev. 2015, 115, 11669–11717. [Google Scholar] [CrossRef] [PubMed]
- Bilan, R.; Fleury, F.; Nabiev, I.; Sukhanova, A. Quantum Dot surface chemistry and functionalization for cell targeting and imaging. Bioconjug. Chem. 2015, 26, 609–624. [Google Scholar] [CrossRef] [PubMed]
- Hong, G.; Diao, S.; Antaris, A.L.; Dai, H. Carbon nanomaterials for biological imaging and nanomedicinal therapy. Chem. Rev. 2015, 115, 10816–10906. [Google Scholar] [CrossRef] [PubMed]
- Wolfbeis, O.S. An overview of nanoparticles commonly used in fluorescent bioimaging. Chem. Soc. Rev. 2015, 44, 4743–4768. [Google Scholar] [CrossRef] [PubMed] [Green Version]
- Yao, J.; Yang, M.; Duan, Y. Chemistry, biology, and medicine of fluorescent nanomaterials and related systems: New insights into biosensing, bioimaging, genomics, diagnostics, and therapy. Chem. Rev. 2014, 114, 6130–6178. [Google Scholar] [CrossRef] [PubMed]
- Lemke, E.A.; Schultz, C. Principles for designing fluorescent sensors and reporters. Nat. Chem. Biol. 2011, 7, 480–483. [Google Scholar] [CrossRef] [PubMed]
- Suzuki, Y.; Yokoyama, K. Development of functional fluorescent molecular probes for the detection of biological substances. Biosensors 2015, 5, 337–363. [Google Scholar] [CrossRef] [PubMed]
- Lewis, M.W.; Robalino, I.V.; Keyhani, N.O. Uptake of the fluorescent probe FM4-64 by hyphae and haemolymph-derived in vivo hyphal bodies of the entomopathogenic fungus Beauveria bassiana. Microbiology 2009, 155, 3110–3120. [Google Scholar] [CrossRef] [PubMed] [Green Version]
- Levine, M.N.; Hoang, T.T.; Raines, R.T. Fluorogenic probe for constitutive cellular endocytosis. Chem. Biol. 2013, 20, 614–618. [Google Scholar] [CrossRef] [PubMed]
- Chow, Y.T.; Chen, S.; Wang, R.; Liu, C.; Kong, C.W.; Li, R.A.; Cheng, S.H.; Sun, D. Single cell transfection through precise microinjection with quantitatively controlled injection volumes. Sci. Rep. 2016, 6, 24127. [Google Scholar] [CrossRef] [PubMed]
- Sahoo, H. Fluorescent labeling techniques in biomolecules: A flashback. RSC Adv. 2012, 2, 7017–7029. [Google Scholar] [CrossRef]
- Dean, K.M.; Palmer, A.E. Advances in fluorescence labeling strategies for dynamic cellular imaging. Nat. Chem. Biol. 2014, 7, 512–523. [Google Scholar] [CrossRef] [PubMed]
- Fornwald, J.A.; Lu, Q.; Boyce, F.M.; Ames, R.S. Gene expression in mammalian cells using BacMam, a modified baculovirus system. Methods Mol. Biol. 2016, 1350, 95–116. [Google Scholar] [PubMed]
- Icha, J.; Weber, M.; Waters, J.C.; Norden, C. Phototoxicity in live fluorescence microscopy, and how to avoid it. Bioessays 2017, 39, 1700003. [Google Scholar] [CrossRef] [PubMed]
- Santi, P.A. Light sheet fluorescence microscopy: A review. J. Histochem. Cytochem. 2011, 59, 129–138. [Google Scholar] [CrossRef] [PubMed]
- Chatterjee, K.; Pratiwi, F.W.; Wu, F.C.M.; Chen, P.; Chen, B.C. Recent progress in light sheet microscopy for biological applications. Appl. Spectrosc. 2018, 72, 1137–1169. [Google Scholar] [CrossRef] [PubMed]
- Miller, D.R.; Jarrett, J.W.; Hassan, A.M.; Dunn, A.K. Deep tissue imaging with multiphoton fluorescence microscopy. Curr. Opin. Biomed. Eng. 2017, 4, 32–39. [Google Scholar] [CrossRef] [PubMed]
- Van den Wildenberg, S.M.J.L.; Prevo, B.; Peterman, E.J.G. A brief Introduction to single-molecule fluorescence methods. Methods Mol. Biol. 2018, 1665, 93–113. [Google Scholar] [PubMed]
- Combs, C.A.; Shroff, H. Fluorescence microscopy: A concise guide to current imaging methods. Curr. Protoc. Neurosci. 2017, 79. [Google Scholar] [CrossRef]
- Turro, N.J.; Ramamurthy, V.; Scaiano, J.C. Modern Molecular Photochemistry of Organic Molecules; University Science books: Sauslito, CA, USA, 2010; p. 1120. ISBN 978-1-891389-25-2. [Google Scholar]
- Lakowicz, J.R. Principles of Fluorescence Spectroscopy, 3rd ed.; Springer Science: New York, NY, USA, 2006; p. 954. ISBN 978-0-387-31278-1. [Google Scholar]
- Valeur, B.; Berberan-Santos, M.N. Molecular Fluorescence: Principles and Applications; Wiley-VCH Verlag GmbH & Co. KGaA: Weinheim, Germany, 2012; p. 592. ISBN 978-3-527-65000-2. [Google Scholar]
- Kivala, M.; Diederich, F. Acetylene-derived strong organic acceptors for planar and nonplanar push−pull chromophores. Acc. Chem. Res. 2009, 42, 235–248. [Google Scholar] [CrossRef] [PubMed]
- Mishra, A.; Behera, R.K.; Behera, P.K.; Mishra, B.K.; Behera, G.B. Cyanines during the 1990s: A review. Chem. Rev. 2000, 100, 1973–2012. [Google Scholar] [CrossRef] [PubMed]
- Taniguchi, M.; Lindsey, J.S. Database of absorption and fluorescence spectra of >300 common compounds for use in photochemCAD. Photochem. Photobiol. 2017, 94, 290–327. [Google Scholar] [CrossRef] [PubMed]
- Yang, Z.; Cao, J.; He, Y.; Yang, J.H.; Kim, T.; Peng, X.; Kim, J.S. Macro-/micro-environment-sensitive chemosensing and biological imaging. Chem. Soc. Rev. 2014, 43, 4563–4601. [Google Scholar] [CrossRef] [PubMed]
- Kim, Y.E.; Chen, J.; Chan, J.R.; Langen, R. Engineering a polarity-sensitive biosensor for time-lapse imaging of apoptotic processes and degeneration. Nat. Methods 2010, 7, 67–73. [Google Scholar] [CrossRef] [PubMed]
- Signore, G.; Nifosì, R.; Albertazzi, L.; Storti, B.; Bizzarri, R. Polarity-sensitive coumarins tailored to live cell imaging. J. Am. Chem. Soc. 2010, 132, 1276–1288. [Google Scholar] [CrossRef] [PubMed]
- López-Duarte, I.; Vu, T.T.; Izquierdo, M.A.; Bull, J.A.; Kuimova, M.K. A molecular rotor for measuring viscosity in plasma membranes of live cells. Chem. Commun. 2014, 50, 5282–5284. [Google Scholar] [CrossRef] [PubMed]
- Haidekker, M.A.; Ling, T.; Anglo, M.; Stevens, H.Y.; Frangos, J.A.; Theodorakis, E.A. New fluorescent probes for the measurement of cell membrane viscosity. Chem. Biol. 2001, 8, 123–131. [Google Scholar] [CrossRef]
- Vyšniauskas, A.; Balaz, M.; Anderson, H.L.; Kuimova, M.K. Dual mode quantitative imaging of microscopic viscosity using a conjugated porphyrin dimer. Phys. Chem. Chem. Phys. 2015, 17, 7548–7554. [Google Scholar] [CrossRef] [PubMed] [Green Version]
- Ipuy, M.; Billon, C.; Micouin, G.; Samarut, J.; Andraud, C.; Bretonnière, Y. Fluorescent push–pull pH-responsive probes for ratiometric detection of intracellular pH. Org. Biomol. Chem. 2014, 12, 3641–3648. [Google Scholar] [CrossRef] [PubMed]
- Gutscher, M.; Pauleau, A.L.; Marty, L.; Brach, T.; Wabnitz, G.H.; Samstag, Y.; Meyer, A.J.; Dick, T.P. Real-time imaging of the intracellular glutathione redox potential. Nat. Methods 2008, 5, 553–559. [Google Scholar] [CrossRef] [PubMed]
- Gross, D.; Loew, L.M.; Webb, W.W. Optical imaging of cell membrane potential changes induced by applied electric fields. Biophys. J. 1986, 50, 339–348. [Google Scholar] [CrossRef] [Green Version]
- Barsu, C.; Cheaib, R.; Chambert, S.; Queneau, Y.; Maury, O.; Cottet, D.; Wege, H.; Douady, J.; Bretonnière, Y.; Andraud, C. Neutral push-pull chromophores for nonlinear optical imaging of cell membranes. Org. Biomol. Chem. 2010, 8, 142–150. [Google Scholar] [CrossRef] [PubMed]
- Axelrod, D.; Koppel, D.E.; Schlessinger, J.; Elson, E.; Webb, W.W. Mobility measurement by analysis of fluorescence photobleaching recovery kinetics. Biophys. J. 1976, 16, 1055–1069. [Google Scholar] [CrossRef] [Green Version]
- Klymchenko, A.S. Solvatochromic and fluorogenic dyes as environment-sensitive probes: Design and biological applications. Acc. Chem. Res. 2017, 50, 366–375. [Google Scholar] [CrossRef] [PubMed]
- Lee, M.H.; Kim, J.S.; Sessler, J.L. Small molecule-based ratiometric fluorescence probes for cations, anions, and biomolecules. Chem. Soc. Rev. 2015, 44, 4185–4191. [Google Scholar] [CrossRef] [PubMed] [Green Version]
- Hildebrandt, N.; Spillmann, C.M.; Algar, W.R.; Pons, T.; Stewart, M.H.; Oh, E.; Susumu, K.; Díaz, S.A.; Delehanty, J.B.; Medintz, I.L. Energy transfer with semiconductor quantum dot bioconjugates: A versatile platform for biosensing, energy harvesting, and other developing applications. Chem. Rev. 2017, 117, 536–711. [Google Scholar] [CrossRef] [PubMed]
- Shimomura, O.; Johnson, F.H.; Saiga, Y. Extraction, purification and properties of aequorin, a bioluminescent protein from the luminous hydromedusan, Aequorea. J. Cell. Comp. Physiol. 1962, 59, 223–239. [Google Scholar] [CrossRef] [PubMed]
- Shagin, D.A.; Barsova, E.V.; Yanushevich, Y.G.; Fradkov, A.F.; Lukyanov, K.A.; Labas, Y.A.; Semenova, T.N.; Ugalde, J.A.; Meyers, A.; Nunez, J.M.; et al. GFP-like proteins as ubiquitous metazoan superfamily: Evolution of functional features and structural complexity. Mol. Biol. Evol. 2004, 21, 841–850. [Google Scholar] [CrossRef] [PubMed]
- Deheyn, D.D.; Kubokawa, K.; McCarthy, J.K.; Murakami, A.; Porrachia, M.; Rouse, G.W.; Holland, N.D. Endogenous green fluorescent protein (GFP) in amphioxus. Biol. Bull. 2007, 213, 95–100. [Google Scholar] [CrossRef] [PubMed]
- Shcherbakova, D.M.; Subach, O.M.; Verkhusha, V.V. Red fluorescent proteins: Advanced imaging applications and future design. Angew. Chem. Int. Ed. Engl. 2012, 51, 10724–10738. [Google Scholar] [CrossRef] [PubMed]
- Cranfill, P.J.; Sell, B.R.; Baird, M.A.; Allen, J.R.; Lavagnino, Z.; Gruiter, H.M.; de Kremers, G.J.; Davidson, M.W.; Ustione, A.; Piston, D.W. Quantitative assessment of fluorescent proteins. Nat. Methods 2016, 13, 557–562. [Google Scholar] [CrossRef] [PubMed] [Green Version]
- Shaner, N.C.; Campbell, R.E.; Steinbach, P.A.; Giepmans, B.N.; Palmer, A.E.; Tsien, R.Y. Improved monomeric red, orange and yellow fluorescent proteins derived from Discosoma sp. red fluorescent protein. Nat. Biotechnol. 2004, 22, 1567–1572. [Google Scholar] [CrossRef] [PubMed]
- Shcherbo, D.; Merzlyak, E.M.; Chepurnykh, T.V.; Fradkov, A.F.; Ermakova, G.V.; Solovieva, E.A.; Lukyanov, K.A.; Bogdanova, E.A.; Zaraisky, A.G.; Lukyanov, S.; et al. Bright far-red fluorescent protein for whole-body imaging. Nat. Methods 2007, 4, 741–746. [Google Scholar] [CrossRef] [PubMed]
- Shcherbo, D.; Murphy, C.S.; Ermakova, G.V.; Solovieva, E.A.; Chepurnykh, T.V.; Shcheglov, A.S.; Verkhusha, V.V.; Pletnev, V.Z.; Hazelwood, K.L.; Roche, P.M.; et al. Far-red fluorescent tags for protein imaging in living tissues. Biochem. J. 2009, 418, 567–574. [Google Scholar] [CrossRef] [PubMed] [Green Version]
- Berezin, M.Y.; Achilefu, S. Fluorescence lifetime measurements and biological imaging. Chem. Rev. 2010, 110, 2641–2684. [Google Scholar] [CrossRef] [PubMed]
- Becker, W. Fluorescence lifetime imaging—Techniques and applications. J. Microsc. 2012, 247, 119–136. [Google Scholar] [CrossRef] [PubMed]
- Chen, L.C.; Lloyd, W.R.; Chang, C.W.; Sud, D.; Mycek, M.A. Fluorescence lifetime imaging microscopy for quantitative biological imaging. Methods Cell Biol. 2013, 114, 457–488. [Google Scholar] [PubMed]
- Suhling, K.W.; French, P.M.; Phillips, D. Time-resolved fluorescence microscopy. Photochem. Photobiol. Sci. 2005, 4, 13–22. [Google Scholar] [CrossRef] [PubMed]
- Suhling, K.; Hirvonen, L.M.; Levitt, J.A.; Chung, P.H.; Tregidgo, C.; Le Marois, A.; Rusakov, D.A.; Zheng, K.; Ameer-Beg, S.; Poland, S.; et al. Fluorescence lifetime imaging (FLIM): Basic concepts and some recent developments. Med. Photonics 2015, 27, 3–40. [Google Scholar] [CrossRef]
- Sailer, B.L.; Valdez, J.G.; Steinkamp, J.A.; Crissman, H.A. Apoptosis induced with different cycle-perturbing agents produces differential changes in the fluorescence lifetime of DNA-bound ethidium bromide. Cytometry 1998, 31, 208–216. [Google Scholar] [CrossRef] [Green Version]
- Cubeddu, R.; Canti, G.; Taroni, P.; Valentini, G. Time-gated fluorescence imaging for the diagnosis of tumors in a murine model. Photochem. Photobiol. 1993, 57, 480–485. [Google Scholar] [CrossRef] [PubMed]
- Picot, A.; D’Aléo, A.; Baldeck, P.L.; Grichine, A.; Duperray, A.; Andraud, C.; Maury, O. Long-lived two-photon excited luminescence of water-soluble europium complex: Applications in biological imaging using two-photon scanning microscopy. J. Am. Chem. Soc. 2008, 130, 1532–1533. [Google Scholar] [CrossRef] [PubMed]
- Yang, C.J.; Jockusch, S.; Vicens, M.; Turro, N.J.; Tan, W. Light-switching excimer probes for rapid protein monitoring in complex biological fluids. Proc. Natl. Acad. Sci. USA 2005, 102, 17278–17283. [Google Scholar] [CrossRef] [PubMed] [Green Version]
- Lu, Y.; Zhao, J.; Zhang, R.; Liu, Y.; Liu, D.; Goldys, E.M.; Yang, X.; Xi, P.; Sunna, A.; Lu, J.; et al. Tunable lifetime multiplexing using luminescent nanocrystals. Nat. Photonics 2014, 8, 32–36. [Google Scholar] [CrossRef]
- Zhong, W.; Urayama, P.; Mycek, M.A. Imaging fluorescence lifetime modulation of a ruthenium-based dye in living cells: The potential for oxygen sensing. J. Phys. D Appl. Phys. 2003, 36, 1689. [Google Scholar] [CrossRef]
- Gerritsen, H.C.; Sanders, R.; Draaijer, A.; Ince, C.; Levine, Y.K. Fluorescence lifetime imaging of oxygen in living cells. J. Fluoresc. 1997, 7, 11–15. [Google Scholar] [CrossRef]
- Gatzogiannis, E.; Chen, Z.; Wei, L.; Wombacher, R.; Kao, Y.T.; Yefremov, G.; Cornish, V.W.; Min, W. Mapping protein-specific micro-environments in live cells by fluorescence lifetime imaging of a hybrid genetic-chemical molecular rotor tag. Chem. Commun. 2012, 48, 8694–8696. [Google Scholar] [CrossRef] [PubMed]
- Carlsson, K.; Liljeborg, A.; Andersson, R.M.; Brismar, H. Confocal pH imaging of microscopic specimens using fluorescence lifetimes and phase fluorometry: Influence of parameter choice on system performance. J. Microsc. 2000, 199, 106–114. [Google Scholar] [CrossRef] [PubMed]
- Hanson, K.M.; Behne, M.J.; Barry, N.P.; Mauro, T.M.; Gratton, E.; Clegg, R.M. Two-photon fluorescence lifetime imaging of the skin stratum corneum pH gradient. Biophys. J. 2002, 83, 1682–1690. [Google Scholar] [CrossRef]
- Bajar, B.T.; Wang, E.S.; Zhang, S.; Lin, M.Z.; Chu, J. A guide to fluorescent protein FRET pairs. Sensors 2016, 16, E1488. [Google Scholar] [CrossRef] [PubMed]
- Pawlicki, M.; Collins, H.A.; Denning, R.G.; Anderson, H.L. Two-photon absorption and the design of two-photon dyes. Angew. Chem. Int. Ed. 2009, 48, 3244–3266. [Google Scholar] [CrossRef] [PubMed]
- He, G.S.; Tan, L.S.; Zheng, Q.; Prasad, P.N. Multiphoton absorbing materials: Molecular designs, characterizations, and applications. Chem. Rev. 2008, 108, 1245–1330. [Google Scholar] [CrossRef] [PubMed]
- Denk, W.; Strickler, J.H.; Webb, W.W. Two-photon laser scanning fluorescence microscopy. Science 1990, 248, 73–76. [Google Scholar] [CrossRef] [PubMed]
- Helmchen, F.; Denk, W. Deep tissue two-photon microscopy. Nat. Methods 2005, 2, 932–940. [Google Scholar] [CrossRef] [PubMed]
- Kim, D.; Ryu, H.G.; Ahn, K.H. Recent development of two-photon fluorescent probes for bioimaging. Org. Biomol. Chem. 2014, 12, 4550–4566. [Google Scholar] [CrossRef] [PubMed] [Green Version]
- Kim, H.M.; Cho, B.R. Small-molecule two-photon probes for bioimaging applications. Chem. Rev. 2015, 115, 5014–5055. [Google Scholar] [CrossRef] [PubMed]
- Rumi, M.; Ehrlich, J.E.; Heikal, A.A.; Perry, J.W.; Barlow, S.; Hu, Z.; McCord-Maughon, D.; Parker, T.C.; Röckel, H.; Thayumanavan, S. Structure−property relationships for two-photon absorbing chromophores: Bis-donor diphenylpolyene and bis(styryl)benzene derivatives. J. Am. Chem. Soc. 2000, 122, 9500–9510. [Google Scholar] [CrossRef]
- Drobizhev, M.; Makarov, N.S.; Tillo, S.E.; Hughes, T.E.; Rebane, A. Two-photon absorption properties of fluorescent proteins. Nat. Methods 2011, 8, 393–399. [Google Scholar] [CrossRef] [PubMed] [Green Version]
- Molina, R.S.; Tran, T.M.; Campbell, R.E.; Lambert, G.G.; Salih, A.; Shaner, N.C.; Hughes, T.E.; Drobizhev, M. Blue-shifted green fluorescent protein homologues are brighter than enhanced Green Fluorescent Protein under two-photon excitation. J. Phys. Chem. Lett. 2017, 8, 2548–2554. [Google Scholar] [CrossRef] [PubMed]
- Hell, S.W. Far-field optical nanoscopy. Science 2007, 316, 1153–1158. [Google Scholar] [CrossRef] [PubMed]
- Müller, T.; Schumann, C.; Kraegeloh, A. STED microscopy and its applications: New insights into cellular processes on the nanoscale. Chem. Phys. Chem. 2012, 13, 1986–2000. [Google Scholar] [CrossRef] [PubMed]
- Eggeling, C.; Willig, K.I.; Barrantes, F.J. STED microscopy of living cells—New frontiers in membrane and neurobiology. J. Neurochem. 2013, 126, 203–212. [Google Scholar] [CrossRef] [PubMed]
- Sednev, M.V.; Belov, V.N.; Hell, S.W. Fluorescent dyes with large Stokes shifts for super-resolution optical microscopy of biological objects: A review. Methods Appl. Fluoresc. 2015, 3, 042004. [Google Scholar] [CrossRef] [PubMed]
- Hess, S.T.; Girirajan, T.P.K.; Mason, M.D. Ultra-high resolution imaging by fluorescence photoactivation localization microscopy. Biophys. J. 2006, 91, 4258–4272. [Google Scholar] [CrossRef] [PubMed]
- Subach, F.V.; Patterson, G.H.; Manley, S.; Gillette, J.M.; Lippincott-Schwartz, J.; Verkhusha, V.V. Photoactivatable mCherry for high-resolution two-color fluorescence microscopy. Nat. Methods 2009, 6, 153–159. [Google Scholar] [CrossRef] [PubMed] [Green Version]
- Schoen, I.; Ries, J.; Klotzsch, E.; Ewers, H.; Vogel, V. Binding-activated localization microscopy of DNA structures. Nano Lett. 2011, 11, 4008–4011. [Google Scholar] [CrossRef] [PubMed] [Green Version]
- Rust, M.J.; Bates, M.; Zhuang, X. Sub-diffraction-limit imaging by stochastic optical reconstruction microscopy (STORM). Nat. Methods 2006, 3, 793–796. [Google Scholar] [CrossRef] [PubMed] [Green Version]
- Bates, M.; Huang, B.; Dempsey, G.T.; Zhuang, X. Multicolor super-resolution imaging with photo-switchable fluorescent probes. Science 2007, 317, 1749–1753. [Google Scholar] [CrossRef] [PubMed]
- Irie, M.; Fukaminato, T.; Matsuda, K.; Kobatake, S. Photochromism of diarylethene molecules and crystals: Memories, switches, and actuators. Chem. Rev. 2014, 114, 12174–12277. [Google Scholar] [CrossRef] [PubMed]
- Nienhaus, K.; Nienhaus, G.U. Fluorescent proteins for live-cell imaging with super-resolution. Chem. Soc. Rev. 2014, 43, 1088–1106. [Google Scholar] [CrossRef] [PubMed]
- Shcherbakova, D.M.; Sengupta, P.; Lippincott-Schwartz, J.; Verkhusha, V.V. Photocontrollable fluorescent proteins for superresolution imaging. Annu. Rev. Biophys. 2014, 43, 303–329. [Google Scholar] [CrossRef] [PubMed]
- Yang, N.J.; Hinner, M.J. Getting across the cell membrane: An overview for small molecules, peptides, and proteins. Methods Mol. Biol. 2015, 1266, 29–53. [Google Scholar] [PubMed]
- Mobbs, P.; Becker, D.; Williamson, R.; Bate, M.; Warner, A. Techniques for dye injection and cell labeling. In Microelectrode Techniques, The Plymouth Workshop Handbook, 2nd ed.; Ogden, D.C., Ed.; The Company of Biologists Ltd.: Cambridge, UK, 1994; pp. 361–387. [Google Scholar]
- Strouse, J.J.; Ivnitski-Steele, I.; Waller, A.; Young, S.M.; Perez, D.; Evangelisti, A.M.; Ursu, O.; Bologa, C.G.; Carter, M.B.; Salas, V.M.; et al. Fluorescent substrates for flow cytometric evaluation of efflux inhibition in ABCB1, ABCC1, and ABCG2 transporters. Anal. Biochem. 2013, 437, 77–87. [Google Scholar] [CrossRef] [PubMed] [Green Version]
- Jobsis, P.D.; Rothstein, E.C.; Balaban, R.S. Limited utility of acetoxymethyl (AM)-based intracellular delivery systems, in vivo: Interference by extracellular esterases. J. Microsc. 2007, 226, 74–81. [Google Scholar] [CrossRef] [PubMed]
- Bozyczko-Coyne, D.; McKenna, B.W.; Connors, T.J.; Neff, N.T. A rapid fluorometric assay to measure neuronal survival in vitro. J. Neurosci. Methods 1993, 50, 205–216. [Google Scholar] [CrossRef]
- Vaudry, D.; Rousselle, C.; Basille, M.; Falluel-Morel, A.; Pamantung, T.F.; Fontaine, M.; Fournier, A.; Vaudry, H.; Gonzalez, B.J. Pituitary adenylate cyclase-activating polypeptide protects rat cerebellar granule neurons against ethanol-induced apoptotic cell death. Proc. Natl. Acad. Sci. USA 2002, 99, 6398–6403. [Google Scholar] [CrossRef] [PubMed] [Green Version]
- Raoult, E.; Bénard, M.; Komuro, H.; Lebon, A.; Vivien, D.; Fournier, A.; Vaudry, H.; Vaudry, D.; Galas, L. Cortical-layer-specific effects of PACAP and tPA on interneuron migration during post-natal development of the cerebellum. J. Neurochem. 2014, 130, 241–254. [Google Scholar] [CrossRef] [PubMed] [Green Version]
- Uenishi, E.; Shibasaki, T.; Takahashi, H.; Seki, C.; Hamaguchi, H.; Yasuda, T.; Tatebe, M.; Oiso, Y.; Takenawa, T.; Seino, S. Actin dynamics regulated by the balance of neuronal Wiskott-Aldrich Syndrome Protein (N-WASP) and cofilin activities determines the biphasic response of glucose-induced insulin secretion. J. Biol. Chem. 2013, 288, 25851–25864. [Google Scholar] [CrossRef] [PubMed]
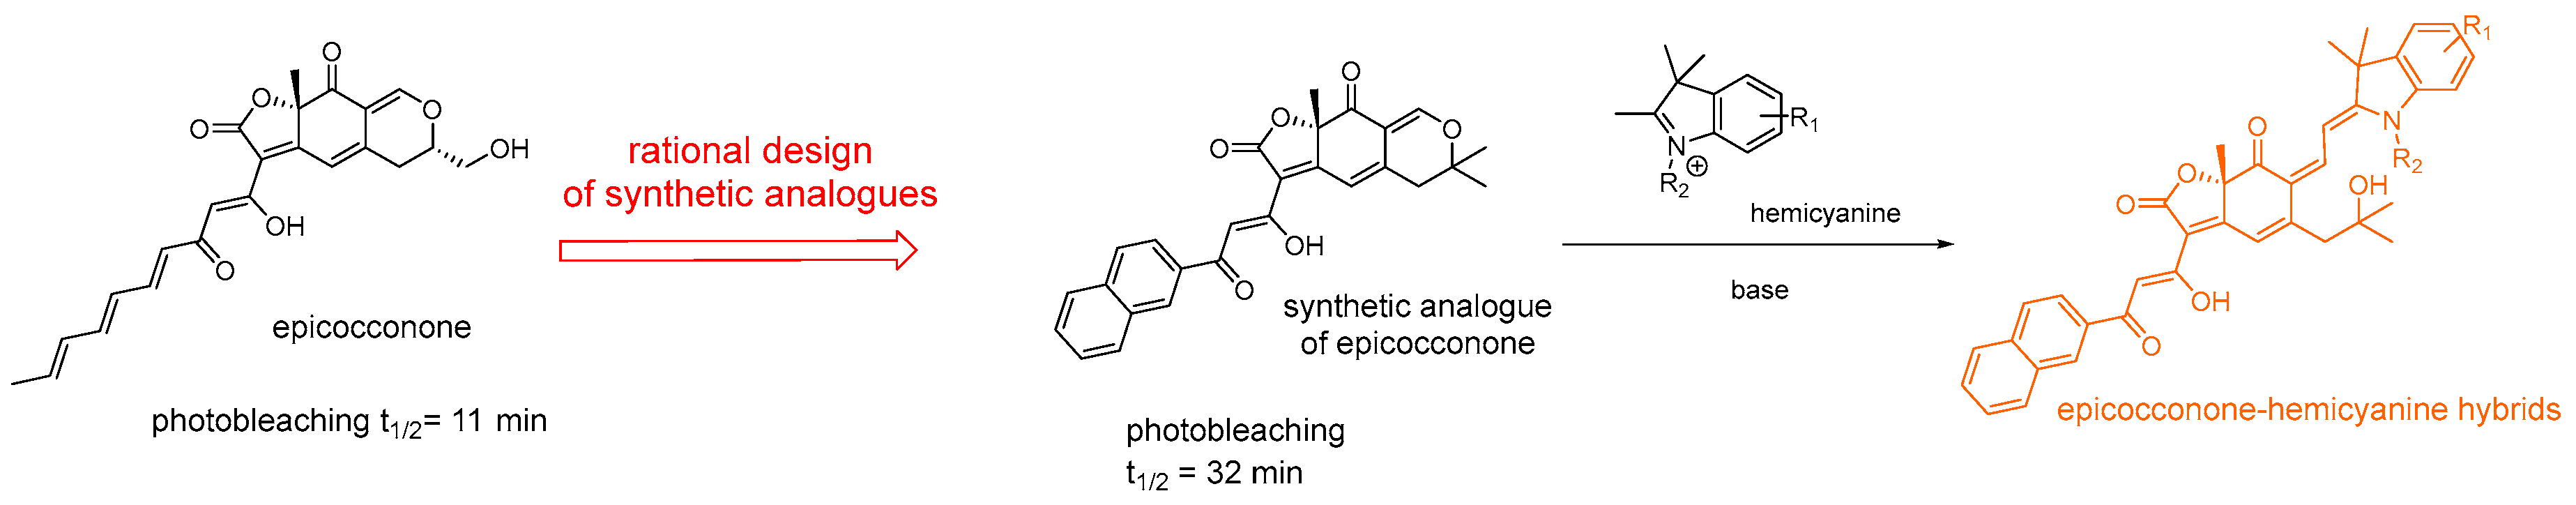
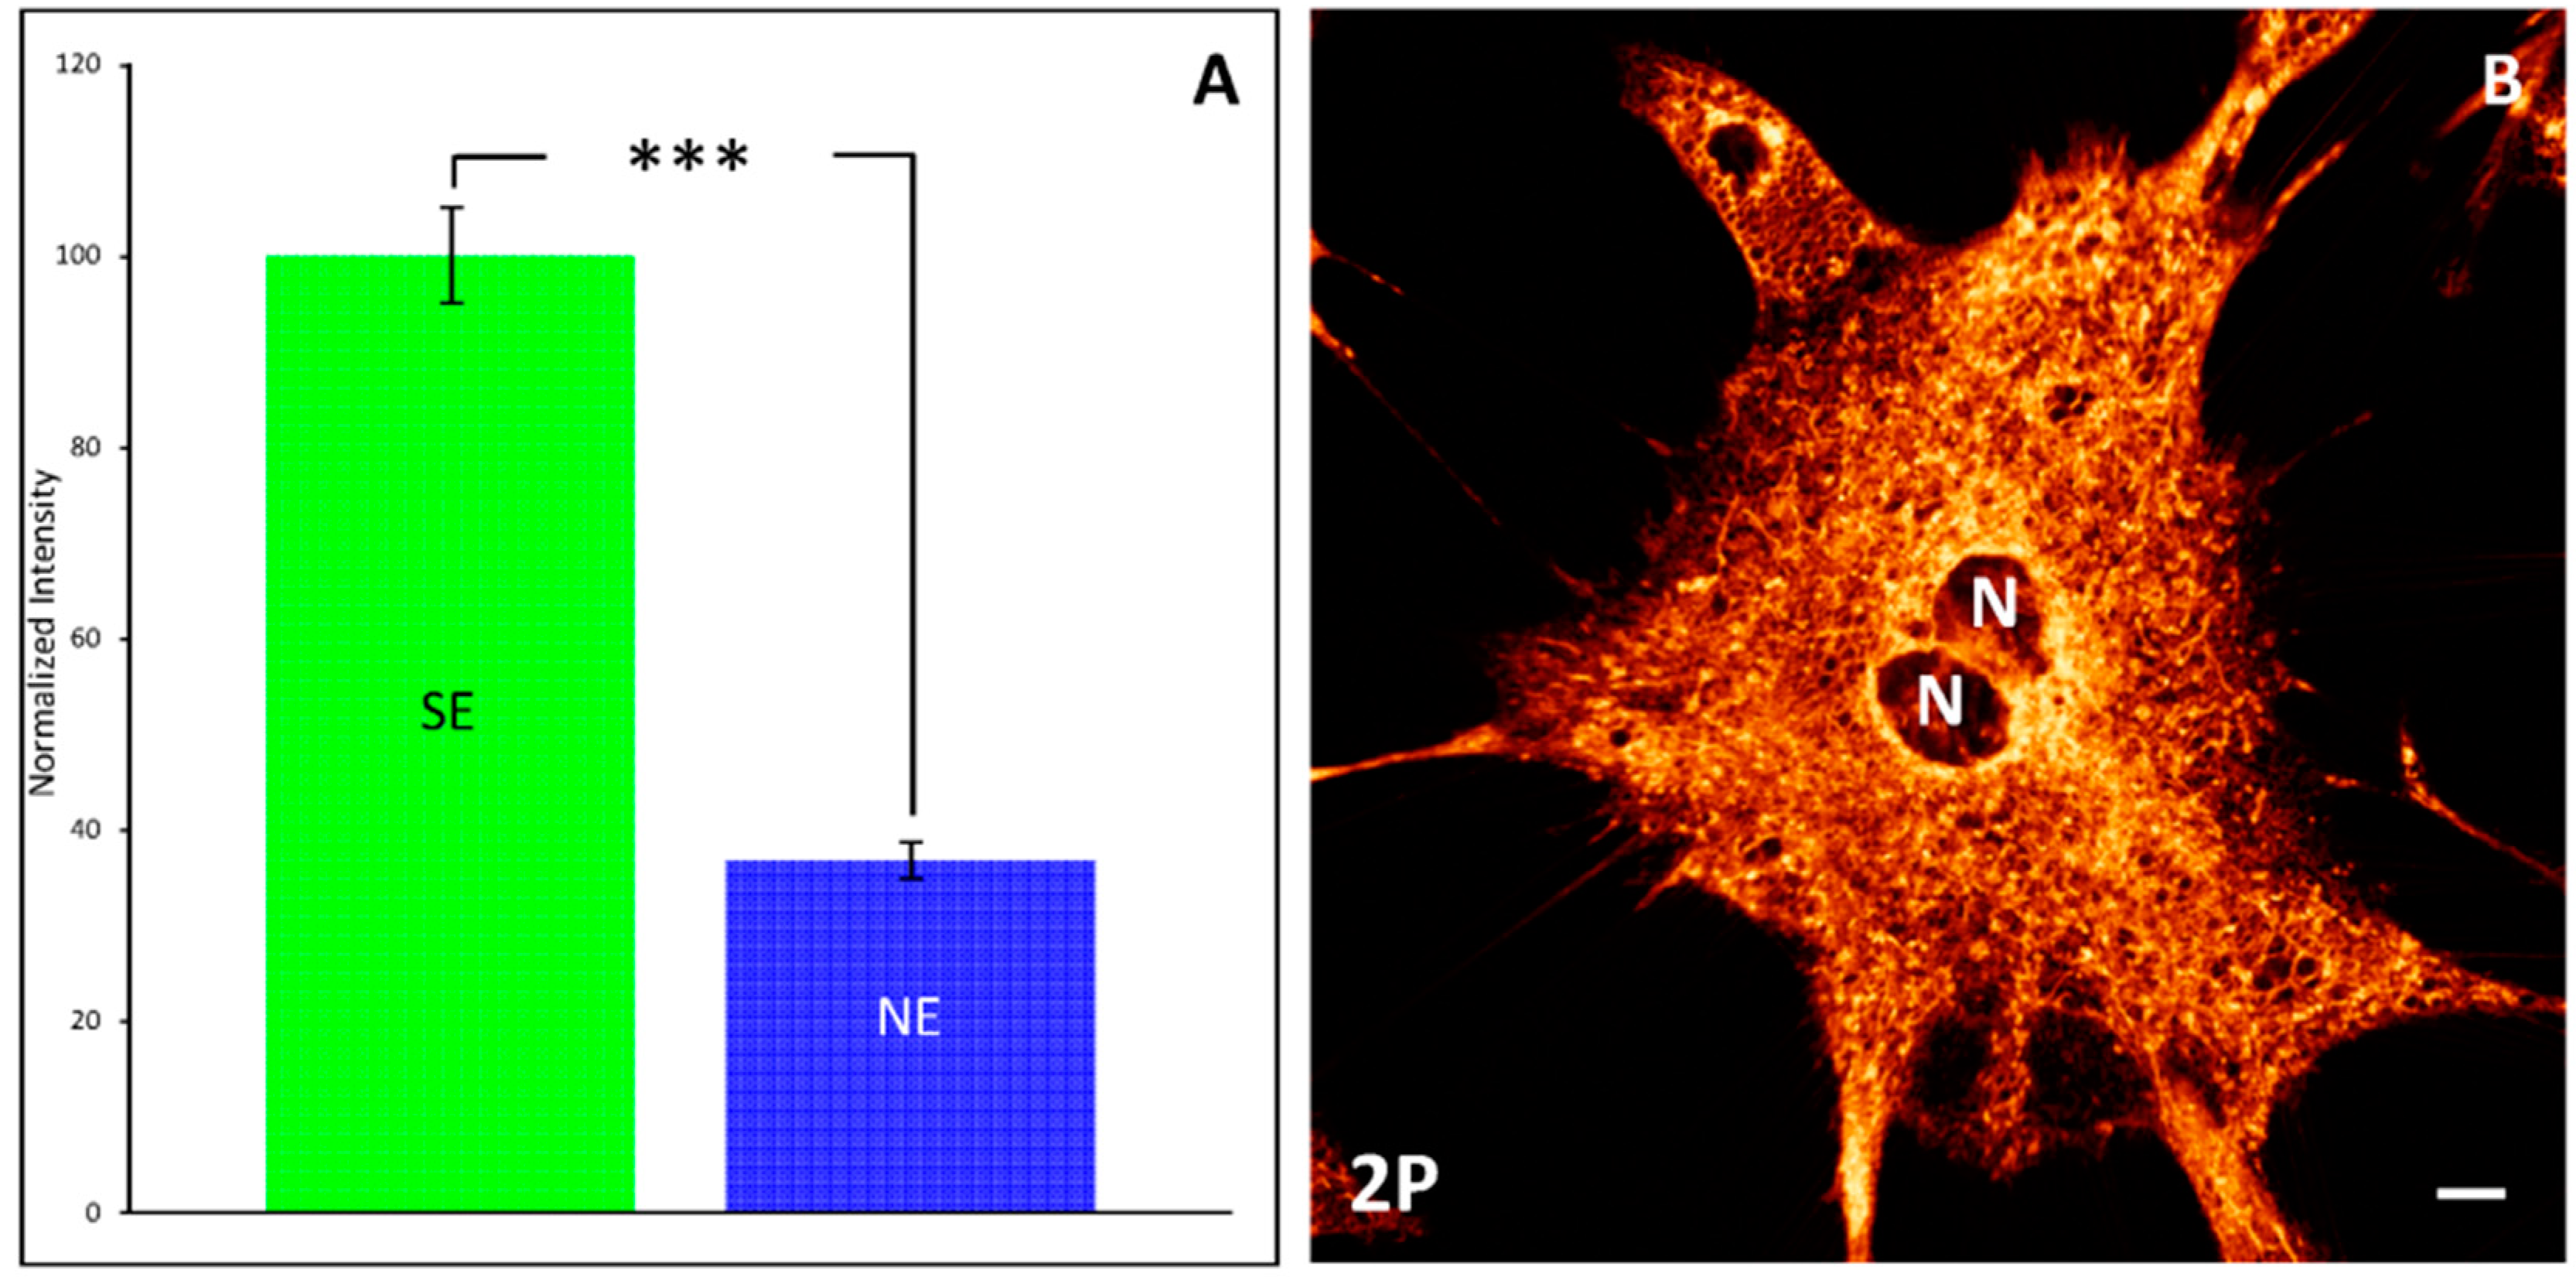
- Schapman, D.; Perraudeau, C.; Bénard, M.; Gallarvardin, T.; Boulangé, A.; Leleu, S.; Lebon, A.; Franck, X.; Galas, L. Characterization of fluorescent synthetic epicocconone-based dye through advanced light microscopies for live cell imaging applications. Dyes Pigment. 2017, 141, 394–405. [Google Scholar] [CrossRef]
- Pasquier, J.; Galas, L.; Boulangé-Lecomte, C.; Rioult, D.; Bultelle, F.; Magal, P.; Webb, G.; Le Foll, F. Different modalities of intercellular membrane exchanges mediate cell-to-cell p-glycoprotein transfers in MCF-7 breast cancer cells. J. Biol. Chem. 2012, 287, 7374–7387. [Google Scholar] [CrossRef] [PubMed]
- Bantly, A.D.; Gray, B.D.; Breslin, E.; Weinstein, E.G.; Muirhead, K.A.; Ohlsson-Wilhelm, B.M.; Moore, J.S. CellVue Claret, a new far-red dye, facilitates polychromatic assessment of immune cell proliferation. Immunol. Investig. 2007, 36, 581–605. [Google Scholar] [CrossRef] [PubMed]
- Beem, E.; Segal, M.S. Evaluation of stability and sensitivity of cell fluorescent labels when used for cell migration. J. Fluoresc. 2013, 23, 975–987. [Google Scholar] [CrossRef] [PubMed]
- Takeshita, Y.; Obermeier, B.; Cotleur, A.; Sano, Y.; Kanda, T.; Ransohoff, R.M. An in vitro blood-brain barrier model combining shear stress and endothelial cell/astrocyte co-culture. J. Neurosci. Methods 2014, 232, 165. [Google Scholar] [CrossRef] [PubMed]
- Hendrickson, O.D.; Zherdev, A.V. Analytical application of lectins. Crit. Rev. Anal. Chem. 2018, 48, 279–292. [Google Scholar] [CrossRef] [PubMed]
- Monsigny, M.; Roche, A.C.; Sene, C.; Maget-Dana, R.; Delmotte, F. Sugar-lectin interactions: How does wheat-germ agglutinin bind sialoglycoconjugates? Eur. J. Biochem. 1979, 104, 147–153. [Google Scholar] [CrossRef]
- Panchuk-Voloshina, N.; Haugland, R.P.; Bishop-Stewart, J.; Bhalgat, M.K.; Millard, P.J.; Mao, F.; Leung, W.Y.; Haugland, R.P. Alexa dyes, a series of new fluorescent dyes that yield exceptionally bright, photostable conjugates. J. Histochem. Cytochem. 1999, 47, 1179–1188. [Google Scholar] [CrossRef] [PubMed]
- Berlier, J.E.; Rothe, A.; Buller, G.; Bradford, J.; Gray, D.R.; Filanoski, B.J.; Telford, W.G.; Yue, S.; Liu, J.; Cheung, C.Y.; et al. Quantitative comparison of long-wavelength Alexa Fluor dyes to Cy dyes: Fluorescence of the dyes and their bioconjugates. J. Histochem. Cytochem. 2003, 51, 1699–1712. [Google Scholar] [CrossRef] [PubMed]
- Bénard, M.; Schapman, D.; Lebon, A.; Monterroso, B.; Bellenger, M.; Le Foll, F.; Pasquier, J.; Vaudry, H.; Vaudry, D.; Galas, L. Structural and functional analysis of tunneling nanotubes (TnTs) using gCW STED and gconfocal approaches. Biol. Cell 2015, 107, 419–425. [Google Scholar] [CrossRef] [PubMed]
- Latt, S.A.; Stetten, G.; Juergens, L.A.; Willard, H.F.; Scher, C.D. Recent developments in the detection of deoxyribonucleic acid synthesis by 33258 Hoechst fluorescence. J. Histochem. Cytochem. 1975, 23, 493–505. [Google Scholar] [CrossRef] [PubMed]
- Bucevicius, J.; Lukinavičius, G.; Gerassimaité, R. The use of Hoeschst dyes for DNA staining and beyond. Chemosensors 2018, 6, 18. [Google Scholar] [CrossRef]
- Pasquier, J.; Guerrouahen, B.S.; Al Thawadi, H.; Ghiabi, P.; Maleki, M.; Abu-Kaoud, N.; Jacob, A.; Mirshahi, M.; Galas, L.; Rafii, S.; et al. Preferential transfer of mitochondria from endothelial to cancer cells through tunneling nanotubes modulates chemoresistance. J. Transl. Med. 2013, 11, 94. [Google Scholar] [CrossRef] [PubMed] [Green Version]
- Caicedo, A.; Fritz, V.; Brondello, J.M.; Ayala, M.; Dennemont, I.; Abdellaoui, N.; de Fraipont, F.; Moisan, A.; Prouteau, C.A.; Boukhaddaoui, H.; et al. MitoCeption as a new tool to assess the effects of mesenchymal stem/stromal cell mitochondria on cancer cell metabolism and function. Sci. Rep. 2015, 5, 9073. [Google Scholar] [CrossRef] [PubMed] [Green Version]
- Nzigou Mombo, B.; Gerbal-Chaloin, S.; Bokus, A.; Daujat-Chavanieu, M.; Jorgensen, C.; Hugnot, J.P.; Vignais, M.L. MitoCeption: Transferring isolated human MSC mitochondria to glioblastoma stem cells. J. Vis. Exp. 2017, 120, e55245. [Google Scholar] [CrossRef] [PubMed]
- Haugland, R.P. The Handbook: A Guide to Fluorescent Probes and Labeling Technologies, 10th ed.; Molecular Probes, Invitrogen Corp.: Carlsbad, CA, USA, 2005; p. 1126. ISBN 978-0971063648. [Google Scholar]
- Han, Y.; Li, M.; Qiu, F.; Zhang, M.; Zhang, Y.H. Cell-permeable organic fluorescent probes for live-cell long-term super-resolution imaging reveal lysosome-mitochondrion interactions. Nat. Commun. 2017, 8, 1307. [Google Scholar] [CrossRef] [PubMed] [Green Version]
- McCann, T.E.; Kosaka, N.; Koide, Y.; Mitsunaga, M.; Choyke, P.L.; Nagano, T.; Urano, Y.; Kobayashi, H. Activatable optical imaging with a silica-rhodamine based near infrared (SiR700) fluorophore: A comparison with cyanine based dyes. Bioconjug. Chem. 2011, 22, 2531–2538. [Google Scholar] [CrossRef] [PubMed]
- Lukinavičius, G.; Umezawa, K.; Olivier, N.; Honigmann, A.; Yang, G.; Plass, T.; Mueller, V.; Reymond, L.; Corrêa, I.R., Jr.; Luo, Z.G.; et al. Near-infrared fluorophore for live-cell super-resolution microscopy of cellular proteins. Nat. Chem. 2013, 5, 132–139. [Google Scholar] [CrossRef] [PubMed]
- Fong, M.; Lesnik, J.; Li, G.; Antes, T.J.; Lu, B. Cyto-Tracers™: Novel lentiviral-based molecular imaging tools. Biotechiques 2018, 49, 5. [Google Scholar] [CrossRef]
- Baskin, J.M.; Prescher, J.A.; Laughlin, S.T.; Agard, N.J.; Chang, P.V.; Miller, I.A.; Lo, A.; Codelli, J.A.; Bertozzi, C.R. Copper-free click chemistry for dynamic in vivo imaging. Proc. Natl. Acad. Sci. USA 2007, 104, 16793–16797. [Google Scholar] [CrossRef] [PubMed] [Green Version]
- Niederwieser, A.; Späte, A.K.; Nguyen, L.D.; Jüngst, C.; Reutter, W.; Wittmann, V. Two-color glycan labeling of live cells by a combination of Diels–Alder and click chemistry. Angew. Chem. Int. Ed. 2013, 52, 4265–4268. [Google Scholar] [CrossRef] [PubMed]
- Dumont, M.; Lehner, A.; Vauzeilles, B.; Malassis, J.; Marchant, A.; Smyth, K.; Linclau, B.; Baron, A.; Mas Pons, J.; Anderson, C.T.; et al. Plant cell wall imaging by metabolic click-mediated labelling of rhamnogalacturonan II using azido 3-deoxy-d-manno-oct-2-ulosonic acid. Plant J. 2016, 85, 437–447. [Google Scholar] [CrossRef] [PubMed]
- Chang, P.V.; Chen, X.; Smyrniotis, C.; Xenakis, A.; Hu, T.; Bertozzi, C.R.; Wu, P. Metabolic labeling of sialic acids in living animals with alkynyl sugars. Angew. Chem. Int. Ed. 2009, 48, 4030–4033. [Google Scholar] [CrossRef] [PubMed]
- Hoogenboom, J.; Berghuis, N.; Cramer, D.; Geurts, R.; Zuilhof, H.; Wennekes, T. Direct imaging of glycans in Arabidopsis roots via click labeling of metabolically incorporated azido-monosaccharides. BMC Plant Biol. 2016, 16, 220. [Google Scholar] [CrossRef] [PubMed]
- García-Plazaola, J.I.; Fernández-Marín, B.; Duke, S.; Hernández, A.; López-Arbeloa, F.; Becerril, J.M. Autofluorescence: Biological functions and technical applications. Plant. Sci. 2015, 236, 136–145. [Google Scholar] [CrossRef] [PubMed]
- Millie, D.; Schofield, O.; Kirkpatrick, G.; Johnsen, G.; Evens, T. Using absorbance and fluorescence spectra to discriminate microalgae. Eur. J. Phycol. 2002, 37, 313–322. [Google Scholar] [CrossRef]
- Elias, S.; Delestre, C.; Ory, S.; Marais, S.; Courel, M.; Vazquez-Martinez, R.; Bernard, S.; Coquet, L.; Malagon, M.M.; Driouich, A.; et al. Chromogranin A induces the biogenesis of granules with calcium- and actin-dependent dynamics and exocytosis in constitutively secreting cells. Endocrinology 2012, 153, 4444–4456. [Google Scholar] [CrossRef] [PubMed]
- Kube, S.; Hersch, N.; Naumovska, E.; Gensch, T.; Hendriks, J.; Franzen, A.; Landvogt, L.; Siebrasse, J.P.; Kubitscheck, U.; Hoffmann, B.; et al. Fusogenic Liposomes as nanocarriers for the delivery of intracellular proteins. Langmuir 2017, 33, 1051–1059. [Google Scholar] [CrossRef] [PubMed]
- Griffin, B.A.; Adams, S.R.; Tsien, R.Y. Specific covalent labeling of recombinant protein molecules inside live cells. Science 1998, 281, 269–272. [Google Scholar] [CrossRef] [PubMed]
- Keppler, A.; Gendreizig, S.; Gronemeyer, T.; Pick, H.; Vogel, H.; Johnsson, K. A general method for the covalent labeling of fusion proteins with small molecules in vivo. Nat. Biotechnol. 2003, 21, 86–89. [Google Scholar] [CrossRef] [PubMed]
- Gautier, A.; Juillerat, A.; Heinis, C.; Corrêa, I.R., Jr.; Kindermann, M.; Beaufils, F.; Johnsson, K. An engineered protein tag for multiprotein labeling in living cells. Chem. Biol. 2008, 15, 128–136. [Google Scholar] [CrossRef] [PubMed]
- Los, G.V.; Darzins, A.; Karassina, N.; Zimprinch, C.; Learish, R.; McDougall, M.G.; Encell, L.P.; Friedman-Ohana, R.; Wood, M.; Vidurgiris, G.; et al. HaloTagTM interchangeable labeling technology for cell imaging and protein capture. Promega Cell Notes 2005, 11, 2–6. [Google Scholar]
- Crivat, G.; Taraska, J.W. Imaging proteins inside cells with fluorescent tags. Trends Biotechnol. 2012, 30, 8–16. [Google Scholar] [CrossRef] [PubMed] [Green Version]
- Martin, B.R.; Giepmans, B.N.; Adams, S.R.; Tsien, R.Y. Mammalian cell-based optimization of the biarsenical-binding tetracysteine motif for improved fluorescence and affinity. Nat. Biotechnol. 2005, 23, 1308–1314. [Google Scholar] [CrossRef] [PubMed]
- Bosch, P.J.; Corrêa, I.R., Jr.; Sonntag, M.H.; Ibach, J.; Brunsveld, L.; Kanger, J.S.; Subramaniam, V. Evaluation of fluorophores to label SNAP-tag fused proteins for multicolor single-molecule tracking microscopy in live cells. Biophys. J. 2014, 107, 803–814. [Google Scholar] [CrossRef] [PubMed]
- England, C.G.; Luo, H.; Cai, W. HaloTag technology: A versatile platform for biomedical applications. Bioconjug. Chem. 2015, 26, 975–986. [Google Scholar] [CrossRef] [PubMed]
- Meng, X.; Liu, J.; Yu, X.; Li, J.; Lu, X.; Shen, T. Pluronic F127 and D-α-tocopheryl polyethylene glycol succinate (TPGS) mixed micelles for targeting drug delivery across the blood brain barrier. Sci. Rep. 2017, 7, 2964. [Google Scholar] [CrossRef] [PubMed]
- Galas, L.; Lamacz, M.; Garnier, M.; Roubos, E.W.; Tonon, M.C.; Vaudry, H. Involvement of extracellular and intracellular calcium sources in TRH-induced alpha-MSH secretion from frog melanotrope cells. Mol. Cell. Endocrinol. 1998, 138, 25–39. [Google Scholar] [CrossRef]
- Galas, L.; Garnier, M.; Lamacz, M. Calcium waves in frog melanotrophs are generated by intracellular inactivation of TTX-sensitive membrane Na+ channel. Mol. Cell. Endocrinol. 2000, 170, 197–209. [Google Scholar] [CrossRef]
- Bénard, M.; Gonzalez, B.J.; Schouft, M.T.; Falluel-Morel, A.; Vaudry, D.; Chan, P.; Vaudry, H.; Fontaine, M. Characterization of C3a and C5a receptors in rat cerebellar granule neurons during maturation. Neuroprotective effect of C5a against apoptotic cell death. J. Biol. Chem. 2004, 279, 43487–43496. [Google Scholar] [CrossRef] [PubMed]
- Gach, K.; Belkacemi, O.; Lefranc, B.; Perlikowski, P.; Masson, J.; Walet-Balieu, M.L.; Do-Rego, J.C.; Galas, L.; Schapman, D.; Lamtahri, R.; et al. Detection, characterization and biological activities of [bisphospho-thr3,9]ODN, an endogenous molecular form of ODN released by astrocytes. Neuroscience 2015, 290, 472–484. [Google Scholar] [CrossRef] [PubMed]
- Qu, H.; Xing, W.; Wu, F.; Wang, Y. Rapid and inexpensive method of loading fluorescent dye into pollen tubes and root hairs. PLoS ONE 2016, 11, e0152320. [Google Scholar] [CrossRef] [PubMed]
- Ona-Jodar, T.; Gerkau, N.J.; Sara Aghvami, S.; Rose, C.R.; Egger, V. Two-photon Na+ imaging reports somatically evoked action potentials in rat olfactory bulb mitral and granule cell neurites. Front. Cell. Neurosci. 2017, 11, 50. [Google Scholar] [CrossRef] [PubMed]
- Nejdl, L.; Moravanska, A.; Smerkova, K.; Mravec, F.; Krizkova, S.; Pomorski, A.; Krężel, A.; Macka, M.; Adam, V.; Vaculovicova, M. Short-sweep capillary electrophoresis with a selective zinc fluorescence imaging reagent FluoZin-3 for determination of free and metalothionein-2a-bound Zn2+ ions. Anal. Chim Acta. 2018, 1017, 41–47. [Google Scholar] [CrossRef] [PubMed]
- Suzuki, Y.; Komatsu, H.; Ikeda, T.; Saito, N.; Araki, S.; Citterio, D.; Hisamoto, D.; Kitamura, Y.; Kubota, T.; Nakagawa, J.; et al. Design and synthesis of Mg2+-selective fluoroionophores based on a coumarin derivative and application for Mg2+ measurement in a living cell. Anal. Chem. 2002, 74, 1423–1428. [Google Scholar] [CrossRef] [PubMed]
- Falluel-Morel, A.; Aubert, N.; Vaudry, D.; Basille, M.; Fontaine, M.; Fournier, A.; Vaudry, H.; Gonzalez, B.J. Opposite regulation of the mitochondrial apoptotic pathway by C2-ceramide and PACAP through a MAP-kinase-dependent mechanism in cerebellar granule cells. J. Neurochem. 2004, 91, 1231–1243. [Google Scholar] [CrossRef] [PubMed] [Green Version]
- Zahid, A.; Despres, J.; Bénard, M.; Nguema-Ona, E.; Leprince, J.; Vaudry, D.; Rihouey, C.; Vicré-Gibouin, M.; Driouich, A.; Follet-Gueye, M.L. Arabinogalactan Proteins from Baobab and Acacia Seeds Influence Innate Immunity of Human Keratinocytes in vitro. J. Cell. Physiol. 2017, 232, 2558–2568. [Google Scholar] [CrossRef] [PubMed]
- Chennoufi, R.; Bougherara, H.; Gagey-Eilstein, N.; Dumat, B.; Henry, E.; Subra, F.; Bury-Moné, S.; Mahuteau-Betzer, F.; Tauc, P.; Teulade-Fichou, M.P.; et al. Mitochondria-targeted triphenylamine derivatives activatable by two-photon excitation for triggering and imaging cell apoptosis. Sci. Rep. 2016, 6, 21458. [Google Scholar] [CrossRef] [PubMed]
- Bortolozzi, R.; von Gradowski, S.; Ihmels, H.; Schäfer, K.; Viola, G. Selective ratiometric detection of H2O2 in water and in living cells with boronobenzo[b]quinolizinium derivatives. Chem. Commun. 2014, 50, 8242–8245. [Google Scholar] [CrossRef] [PubMed]
- Huo, Y.; Miao, J.; Han, L.; Li, Y.; Li, Z.; Shi, Y.; Guo, W. Selective and sensitive visualization of endogenous nitric oxide in living cells and animals by a Si-rhodamine deoxylactam-based near-infrared fluorescent probe. Chem. Sci. 2017, 8, 6857–6864. [Google Scholar] [CrossRef] [PubMed] [Green Version]
- Hayashi, T.; Fukuda, N.; Uchiyama, S.; Inada, N. A cell-permeable fluorescent polymeric thermometer for intracellular temperature mapping in mammalian cell lines. PLoS ONE 2015, 10, e0117677. [Google Scholar] [CrossRef] [PubMed]
- Figueroa, J.A.; Vignesh, K.S.; Deepe, G.S., Jr.; Caruso, J. Selectivity and specificity of small molecule fluorescent dyes/probes used for the detection of Zn2+ and Ca2+ in cells. Metallomics 2014, 6, 301–315. [Google Scholar] [CrossRef] [PubMed]
- Chen, Z.; Truong, T.M.; Ai, H.-W. Illuminating brain activities with fluorescent protein-based biosensors. Chemosensors 2017, 5, 32. [Google Scholar] [CrossRef] [PubMed]
- Bertolin, G.; Sizaire, F.; Herbomel, G.; Reboutier, D.; Prigent, C.; Tramier, M. A FRET biosensor reveals spatiotemporal activation and functions of aurora kinase A in living cells. Nat. Commun. 2016, 7, 12674. [Google Scholar] [CrossRef] [PubMed] [Green Version]
- Miyawaki, A. Development of probes for cellular functions using fluorescent proteins and fluorescence resonance energy transfer. Annu. Rev. Biochem. 2011, 80, 357–373. [Google Scholar] [CrossRef] [PubMed]
- Demeautis, C.; Sipieter, F.; Roul, J.; Chapuis, C.; Padilla-Parra, S.; Riquet, F.B.; Tramier, M. Multiplexing PKA and ERK1&2 kinases FRET biosensors in living cells using single excitation wavelength dual colour FLIM. Sci. Rep. 2017, 7, 41026. [Google Scholar] [PubMed]
- Martin, K.J.; McGhee, E.J.; Schwarz, J.P.; Drysdale, M.; Brachmann, S.M.; Stucke, V.; Sansom, O.J.; Anderson, K.I. Accepting from the best donor; analysis of long-lifetime donor fluorescent protein pairings to optimise dynamic FLIM-based FRET experiments. PLoS ONE 2018, 13, e0183585. [Google Scholar] [CrossRef] [PubMed]
- Franck, C.M.; Westermann, J.; Boisson-Dernier, A. Imaging Ca2+ dynamics in wild-type and NADPH oxidase-deficient mutant pollen tubes with yellow cameleon and confocal laser scanning microscopy. Methods Mol. Biol. 2017, 1669, 103–116. [Google Scholar] [PubMed]
- Jazi, A.A.; Ploetz, E.; Arizki, M.; Dhandayuthapani, B.; Waclawska, I.; Krämer, R.; Ziegler, C.; Cordes, T. Caging and photoactivation in single-Molecule Förster Resonance Energy Transfer experiments. Biochemistry. 2017, 56, 2031–2041. [Google Scholar] [CrossRef] [PubMed]
- FitzHarris, G. Monitoring microtubule dynamics in the mouse egg using photoactivatable-GFP-tubulin. Methods Mol. Biol. 2018, 1818, 137–144. [Google Scholar] [PubMed]
- Dyer, L.A.; Patterson, C. A novel ex vivo culture method for the embryonic mouse heart. J. Vis. Exp. 2013, 75, e50359. [Google Scholar] [CrossRef] [PubMed]
- Dailey, M.E.; Eyo, U.; Hass, J.; Kurpius, D. Imaging microglia in brain slices and slice cultures. Cold Spring Harb. Protoc. 2013. [Google Scholar] [CrossRef] [PubMed]
- Owusu-Ansah, E.; Yavari, A.; Banerjee, U. A protocol for in vivo detection of reactive oxygen species. Protocol Exch. 2008. [Google Scholar] [CrossRef]
- Cameron, D.B.; Galas, L.; Jiang, Y.; Raoult, E.; Vaudry, D.; Komuro, H. Cerebellar cortical-layer-specific control of neuronal migration by pituitary adenylate cyclase-activating polypeptide. Neuroscience 2007, 146, 697–712. [Google Scholar] [CrossRef] [PubMed] [Green Version]
- Fahrion, J.K.; Komuro, Y.; Li, Y.; Ohno, N.; Littner, Y.; Raoult, E.; Galas, L.; Vaudry, D.; Komuro, H. Rescue of neuronal migration deficits in a mouse model of fetal Minamata disease by increasing neuronal Ca2+ spike frequency. Proc. Natl. Acad. Sci. USA 2012, 109, 5057–5062. [Google Scholar] [CrossRef] [PubMed]
- Rakymzhan, A.; Radbruch, H.; Niesner, R.A. Quantitative imaging of Ca2+ by 3D-FLIM in live tissues. Adv. Exp. Med. Biol. 2017, 1035, 135–141. [Google Scholar] [PubMed]
- Cameron, D.B.; Kasai, K.; Jiang, Y.; Hu, T.; Saeki, Y.; Komuro, H. Four distinct phases of basket/stellate cell migration after entering their final destination (the molecular layer) in the developing cerebellum. Dev. Biol. 2009, 332, 309–324. [Google Scholar] [CrossRef] [PubMed]
- Mironov, S.L.; Skorova, E.; Taschenberger, G.; Hartelt, N.; Nikolaev, V.O.; Lohse, M.J.; Kügler, S. Imaging cytoplasmic cAMP in mouse brainstem neurons. BMC Neurosci. 2009, 10, 29. [Google Scholar] [CrossRef] [PubMed]
- Uesaka, N.; Nishiwaki, M.; Yamamoto, N. Single cell electroporation method for axon tracing in cultured slices. Dev. Growth Differ. 2008, 50, 475–477. [Google Scholar] [CrossRef] [PubMed] [Green Version]
- Henri, O.; Pouehe, C.; Houssari, M.; Galas, L.; Nicol, L.; Edwards-Lévy, F.; Henry, J.P.; Dumesnil, A.; Boukhalfa, I.; Banquet, S.; et al. Selective Stimulation of Cardiac Lymphangiogenesis Reduces Myocardial Edema and Fibrosis Leading to Improved Cardiac Function Following Myocardial Infarction. Circulation 2016, 133, 1484–1497. [Google Scholar] [CrossRef] [PubMed] [Green Version]
- Pak, Y.L.; Swamy, K.M.; Yoon, J. Recent progress in fluorescent imaging probes. Sensors 2015, 15, 24374–24396. [Google Scholar] [CrossRef] [PubMed]
- Icha, J.; Schmied, C.; Sidhaye, J.; Tomancak, P.; Preibisch, S.; Norden, C. Using light sheet fluorescence microscopy to image zebrafish eye development. J. Vis. Exp. 2016, 110, e53966. [Google Scholar] [CrossRef] [PubMed]
- Levy, S.L.; White, J.J.; Lackey, E.P.; Schwartz, L.; Sillitoe, R.V. WGA-Alexa Conjugates for Axonal Tracing. Curr. Protoc. Neurosci. 2017, 79, 1–28. [Google Scholar] [PubMed]
- Morishita, Y.; Kuroiwa, A.; Suzuki, T. Quantitative analysis of tissue deformation dynamics reveals three characteristic growth modes and globally aligned anisotropic tissue deformation during chick limb development. Development 2015, 142, 1672–1683. [Google Scholar] [CrossRef] [PubMed] [Green Version]
- Porat-Shliom, N.; Chen, Y.; Tora, M.; Shitara, A.; Masedunskas, A.; Weigert, R. In vivo tissue-wide synchronization of mitochondrial metabolic oscillations. Cell Rep. 2014, 9, 514–521. [Google Scholar] [CrossRef] [PubMed]
- Terai, T.; Nagano, T. Small-molecule fluorophores and fluorescent probes for bioimaging. Pflugers Arch. 2013, 465, 347–359. [Google Scholar] [CrossRef] [PubMed]
- Tury, A.; Mairet-Coello, G.; DiCicco-Bloom, E. The cyclin-dependent kinase inhibitor p57Kip2 regulates cell cycle exit, differentiation, and migration of embryonic cerebral cortical precursors. Cereb. Cortex 2011, 21, 1840–1856. [Google Scholar] [CrossRef] [PubMed]
- Mehrotra, P. Biosensors and their applications—A review. J. Oral Biol. Craniofac. Res. 2016, 6, 153–159. [Google Scholar] [CrossRef] [PubMed]
- Brudno, Y.; Desai, R.M.; Kwee, B.J.; Joshi, N.S.; Aizenberg, M.; Mooney, D.J. In vivo targeting through click chemistry. ChemMedChem. 2015, 10, 617–620. [Google Scholar] [CrossRef] [PubMed]
- Kharkar, P.M.; Rehmann, M.S.; Skeens, K.M.; Maverakis, E.; Kloxin, A.M. Thiol-ene click hydrogels for therapeutic delivery. ACS Biomater. Sci. Eng. 2016, 2, 165–179. [Google Scholar] [CrossRef] [PubMed]
- Smeets, N.M.; Bakaic, E.; Patenaude, M.; Hoare, T. Injectable poly(oligoethylene glycol methacrylate)-based hydrogels with tunable phase transition behaviours: Physicochemical and biological responses. Acta Biomater. 2014, 10, 4143–4155. [Google Scholar] [CrossRef] [PubMed]
- O’Shea, T.M.; Aimetti, A.A.; Kim, E.; Yesilyurt, V.; Langer, R. Synthesis and characterization of a library of in-situ curing, nonswelling ethoxylated polyol thiol-ene hydrogels for tailorable macromolecule delivery. Adv. Mater. 2015, 27, 65–72. [Google Scholar] [CrossRef] [PubMed]
- Somerville, C.R.; Bauer, S.; Brininstool, G.; Facette, M.; Hamann, T.; Milne, J.; Osborne, E.; Paredez, A.; Persson, S.; Raab, T.; et al. Toward a systems approach to understanding plant cell walls. Science 2004, 306, 2206–2211. [Google Scholar] [CrossRef] [PubMed]
- McClosky, D.D.; Wang, B.; Chen, G.; Anderson, C.T. The click-compatible sugar 6-deoxy-alkynyl glucose metabolically incorporates into Arabidopsis root hair tips and arrests their growth. Phytochemistry 2016, 123, 16–24. [Google Scholar] [CrossRef] [PubMed] [Green Version]
- Bukowski, N.; Pandey, J.L.; Doyle, L.; Richard, T.L.; Anderson, C.T.; Zhu, Y. Development of a clickable designer monolignol for interrogation of lignification in plant cell walls. Bioconjug. Chem. 2014, 25, 2189–2196. [Google Scholar] [CrossRef] [PubMed]
- Pandey, J.L.; Kiemle, S.N.; Richard, T.L.; Zhu, Y.; Cosgrove, D.J.; Anderson, C.T. Investigating biochemical and developmental dependencies of lignification with a click-compatible monolignol analog in Arabidopsis thaliana stems. Front. Plant. Sci. 2016, 7, 1309. [Google Scholar] [CrossRef] [PubMed]
- Anderson, C.T.; Wallace, I.S.; Somerville, C.R. Metabolic click-labeling with a fucose analog reveals pectin delivery, architecture, and dynamics in Arabidopsis cell walls. Proc. Natl. Acad. Sci. USA 2012, 109, 1329–1334. [Google Scholar] [CrossRef] [PubMed] [Green Version]
- Wang, B.; McClosky, D.D.; Anderson, C.T.; Chen, G. Synthesis of a suite of click-compatible sugar analogs for probing carbohydrate metabolism. Carbohydr. Res. 2016, 433, 54–62. [Google Scholar] [CrossRef] [PubMed] [Green Version]
- Chang, P.V.; Prescher, J.A.; Sletten, E.M.; Baskin, J.M.; Miller, I.A.; Agard, N.J.; Lo, A.; Bertozzi, C.R. Copper-free click chemistry in living animals. Proc. Natl. Acad. Sci. USA 2010, 107, 1821–1826. [Google Scholar] [CrossRef] [PubMed] [Green Version]
- Lavis, L.D.; Raines, R.T. Bright building blocks for chemical biology. ACS Chem. Biol. 2014, 9, 855–866. [Google Scholar] [CrossRef] [PubMed]
- Lavis, L.D. Chemistry is dead. Long live chemistry. Biochemistry 2017, 56, 5165–5170. [Google Scholar] [CrossRef] [PubMed]
- Umezawa, K.; Citterio, D.; Suzuki, K. New trends in near-infrared fluorophores for bioimaging. Anal. Sci. 2014, 30, 327–349. [Google Scholar] [CrossRef] [PubMed]
- Kiyose, K.; Kojima, H.; Nagano, T. Functional near-infrared fluorescent probes. Chem. Asian J. 2008, 3, 506–515. [Google Scholar] [CrossRef]
- Hong, G.; Antaris, A.L.; Dai, H. Near-infrared fluorophores for biomedical imaging. Nat. Biomed. Eng. 2017, 1, 0010. [Google Scholar] [CrossRef]
- Duval, R.; Duplais, C. Fluorescent natural products as probes and tracers in biology. Nat. Prod. Rep. 2017, 34, 161–193. [Google Scholar] [CrossRef] [PubMed]
- De Moliner, F.; Kielland, N.; Lavilla, R.; Vendrell, M. Modern synthetic avenues for the preparation of functional fluorophores. Angew. Chem. Int. Ed. 2017, 56, 3758–3769. [Google Scholar] [CrossRef] [PubMed]
- Alford, R.; Simpson, H.M.; Duberman, J.; Hill, G.C.; Ogawa, M.; Regino, C.; Kobayashi, H.; Choyke, P.L. Toxicity of organic fluorophores used in molecular imaging: Literature review. Mol. Imaging 2009, 8. [Google Scholar] [CrossRef]
- Taraska, J.W.; Puljung, M.C.; Zagotta, W.N. Short-distance probes for protein backbone structure based on energy transfer between bimane and transition metal ions. Proc. Natl. Acad. Sci. USA 2009, 106, 16227–16232. [Google Scholar] [CrossRef] [PubMed] [Green Version]
- Kowada, T.; Maeda, H.; Kikuchi, K. BODIPY-based probes for the fluorescence imaging of biomolecules in living cells. Chem. Soc. Rev. 2015, 44, 4953–4972. [Google Scholar] [CrossRef] [PubMed]
- Sun, W.; Guo, S.; Hu, C.; Fan, J.; Peng, X. Recent development of chemosensors based on cyanine platforms. Chem. Rev. 2016, 116, 7768–7817. [Google Scholar] [CrossRef] [PubMed]
- Shindy, H.A. Fundamentals in the chemistry of cyanine dyes: A review. Dyes Pigment. 2017, 145, 505–513. [Google Scholar] [CrossRef]
- Johnson, J.R.; Fu, N.; Arunkumar, E.; Leevy, W.M.; Gammon, S.T.; Piwnica-Worms, D.; Smith, B.D. Squaraine rotaxanes: Superior substitutes for Cy-5 in molecular probes for near-infrared fluorescence cell imaging. Angew. Chem. Int. Ed. 2007, 46, 5528–5531. [Google Scholar] [CrossRef] [PubMed]
- Podgorski, K.; Terpetschnig, E.; Klochko, O.P.; Obukhova, O.M.; Haas, K. Ultra-bright and -stable red and near-infrared squaraine fluorophores for in vivo two-photon imaging. PLoS ONE 2012, 7, e51980. [Google Scholar] [CrossRef] [PubMed]
- Lavis, L.D. Teaching old dyes new tricks: Biological probes built from fluoresceins and rhodamines. Ann. Rev. Biochem. 2017, 86, 825–843. [Google Scholar] [CrossRef] [PubMed]
- Kushida, Y.; Nagano, T.; Hanaoka, K. Silicon-substituted xanthene dyes and their applications in bioimaging. Analyst 2015, 140, 685–695. [Google Scholar] [CrossRef] [PubMed]
- Ikeno, T.; Nagano, T.; Hanaoka, K. Silicon-substituted xanthene dyes and their unique photophysical properties for fluorescent probes. Chem. Asian J. 2017, 12, 1435–1446. [Google Scholar] [CrossRef] [PubMed]
- Grimm, J.B.; Brown, T.A.; Tkachuk, A.N.; Lavis, L.D. General synthetic method for Si-fluorescein and Si-rhodamines. ACS Cent. Sci. 2017, 3, 975–985. [Google Scholar] [CrossRef] [PubMed]
- Grimm, J.B.; Muthusamy, A.K.; Liang, Y.; Brown, T.A.; Lemon, W.C.; Patel, R.; Lu, R.; Macklin, J.J.; Keller, P.J.; Ji, N.; et al. A general method to fine-tune fluorophores for live-cell and in vivo imaging. Nat. Methods 2017, 14, 987–994. [Google Scholar] [CrossRef] [PubMed] [Green Version]
- Zhou, X.; Lai, R.; Beck, J.R.; Li, H.; Stains, C.I. Nebraska Red: A phosphinate-based near-infrared fluorophore scaffold for chemical biology applications. Chem. Commun. 2016, 52, 12290–12293. [Google Scholar] [CrossRef] [PubMed]
- Chai, X.; Cui, X.; Wang, B.; Yang, F.; Cai, Y.; Wu, Q.; Wang, T. Near-infrared phosphorus-substituted rhodamine with emission wavelength above 700nm for bioimaging. Chem. Eur. J. 2015, 21, 16754–16758. [Google Scholar] [CrossRef] [PubMed]
- Bell, P.J.; Karuso, P. Epicocconone, a novel fluorescent compound from the fungus epicoccum nigrum. J. Am. Chem. Soc. 2003, 125, 9304–9305. [Google Scholar] [CrossRef] [PubMed]
- Karuso, P.; Loa Kum Cheung, W.; Peixoto, P.A.; Boulangé, A.; Franck, X. Epicocconone-hemycyanine hybrids: Near infrared flurophores for protein staining and cell imaging. Chem. Eur. 2017, 23, 1820–1829. [Google Scholar] [CrossRef] [PubMed]
- Boulangé, A.; Peixoto, P.A.; Franck, X. Diastereoselective IBX oxidative dearomatization of phenols by remote induction: Towards the epicocconone core framework. Chem. Eur. 2011, 17, 10241–10245. [Google Scholar] [CrossRef] [PubMed]
- Peixoto, P.A.; Boulangé, A.; Ball, M.; Naudin, B.; Alle, T.; Cosette, P.; Karuso, P.; Franck, X. Design and synthesis of epicocconone analogues with improved fluorescence properties. J. Am. Chem. Soc. 2014, 136, 15248–15256. [Google Scholar] [CrossRef] [PubMed]
- Syzgantseva, O.A.; Tognetti, V.; Joubert, L.; Boulangé, A.; Peixoto, P.A.; Leleu, S.; Franck, X. Electronic excitations in epicocconone analogues: TDDFT methodological assessment guided by experiment. J. Phys. Chem. A 2012, 116, 8634–8643. [Google Scholar] [CrossRef] [PubMed]
- Syzgantseva, O.A.; Tognetti, V.; Boulangé, A.; Peixoto, P.A.; Leleu, S.; Franck, X.; Joubert, L. Evaluating charge transfert in epicocconone analogue: Toward a targeted design of fluorophores. J. Phys. Chem. A 2014, 118, 757–764. [Google Scholar] [CrossRef] [PubMed]
- Chatterjee, S.; Karuso, P.; Boulangé, A.; Peixoto, P.A.; Franck, X.; Datta, A. The role of different structural motifs in the ultrafast dynamics of second generation protein stains. J. Phys. Chem. B 2013, 117, 14951–14959. [Google Scholar] [CrossRef] [PubMed]
- Chatterjee, S.; Karuso, P.; Boulangé, A.; Franck, X.; Datta, A. Excited states dynamics of brightly fluorescent second generation epicocconone analogues. J. Phys. Chem. B 2015, 119, 6295–6303. [Google Scholar] [CrossRef] [PubMed]
- Hell, S.W.; Sahl, S.J.; Bates, M.; Zhuang, X.; Heintzmann, R.; Booth, M.J.; Bewersdorf, J.; Shtengel, G.; Hess, H.; Tinnefeld, P. The 2015 super-resolution microscopy roadmap. J. Phys. Appl. Phys. 2015, 48, 443001. [Google Scholar] [CrossRef]
- Zheng, Q.F.; Juette, M.; Jockusch, S.R.; Wasserman, M.; Zhou, Z.B.; Altman, R.C.; Blanchard, S. Ultra-stable organic fluorophores for single-molecule research. Chem. Soc. Rev. 2014, 43, 1044–1056. [Google Scholar] [CrossRef] [PubMed] [Green Version]
- Henderson, B.W.; Dougherty, T.J. How does photodynamic therapy work? Photochem. Photobiol. 1992, 55, 145–157. [Google Scholar] [CrossRef] [PubMed]
- DeRosa, M.C.; Crutchley, R.J. Photosensitized singlet oxygen and its applications. Coord. Chem. Rev. 2002, 233–234, 351–371. [Google Scholar] [CrossRef]
- Butkevich, A.N.; Mitronova, G.Y.; Sidenstein, S.C.; Klocke, J.L.; Kamin, D.; Meineke, D.N.H.; D’Este, E.; Kraemer, P.T.; Danzl, J.G.; Belov, V.N.; et al. Fluorescent rhodamines and fluorogenic carbopyronines for super-resolution STED microscopy in living cells. Angew. Chem. Int. Ed. 2016, 55, 3290–3294. [Google Scholar] [CrossRef] [PubMed]
- Sreedharan, S.; Gill, M.R.; Garcia, E.; Saeed, H.K.; Robinson, D.; Byrne, A.; Cadby, A.; Keyes, T.E.; Smythe, C.; Pellett, P. Multimodal super-resolution optical microscopy using a transition-metal-based probe provides unprecedented capabilities for imaging both nuclear chromatin and mitochondria. J. Am. Chem. Soc. 2017, 139, 15907–15913. [Google Scholar] [CrossRef] [PubMed]
- Lukinavičius, G.; Mitronova, Y.G.; Schnorrenberg, S.; Butkevich, A.N.; Barthel, H.; Belov, V.N.; Hell, S.W. Fluorescent dyes and probes for super-resolution microscopy of microtubules and tracheoles in living cells and tissues. Chem. Sci. 2018, 9, 3324–3334. [Google Scholar] [CrossRef] [PubMed] [Green Version]
- Butkevich, A.N.; Ta, H.; Ratz, M.; Stoldt, S.; Jakobs, S.; Belov, V.N.; Hell, S.W. Two-Color 810 nm STED nanoscopy of living cells with endogenous SNAP-tagged fusion proteins. ACS Chem. Biol. 2018, 13, 475–480. [Google Scholar] [CrossRef] [PubMed]
- Thompson, A.D.; Bewersdorf, J.; Toomre, D.; Schepartz, A. HIDE probes: A new toolkit for visualizing organelle dynamics, longer and at super-resolution. Biochemistry 2017, 56, 5194–5201. [Google Scholar] [CrossRef] [PubMed]
- Saurabh, S.; Perez, A.M.; Comerci, C.J.; Shapiro, L.; Moerner, W.E. Super-resolution imaging of live bacteria cells using a genetically directed, highly photostable fluoromodule. J. Am. Chem. Soc. 2016, 138, 10398–10401. [Google Scholar] [CrossRef] [PubMed]
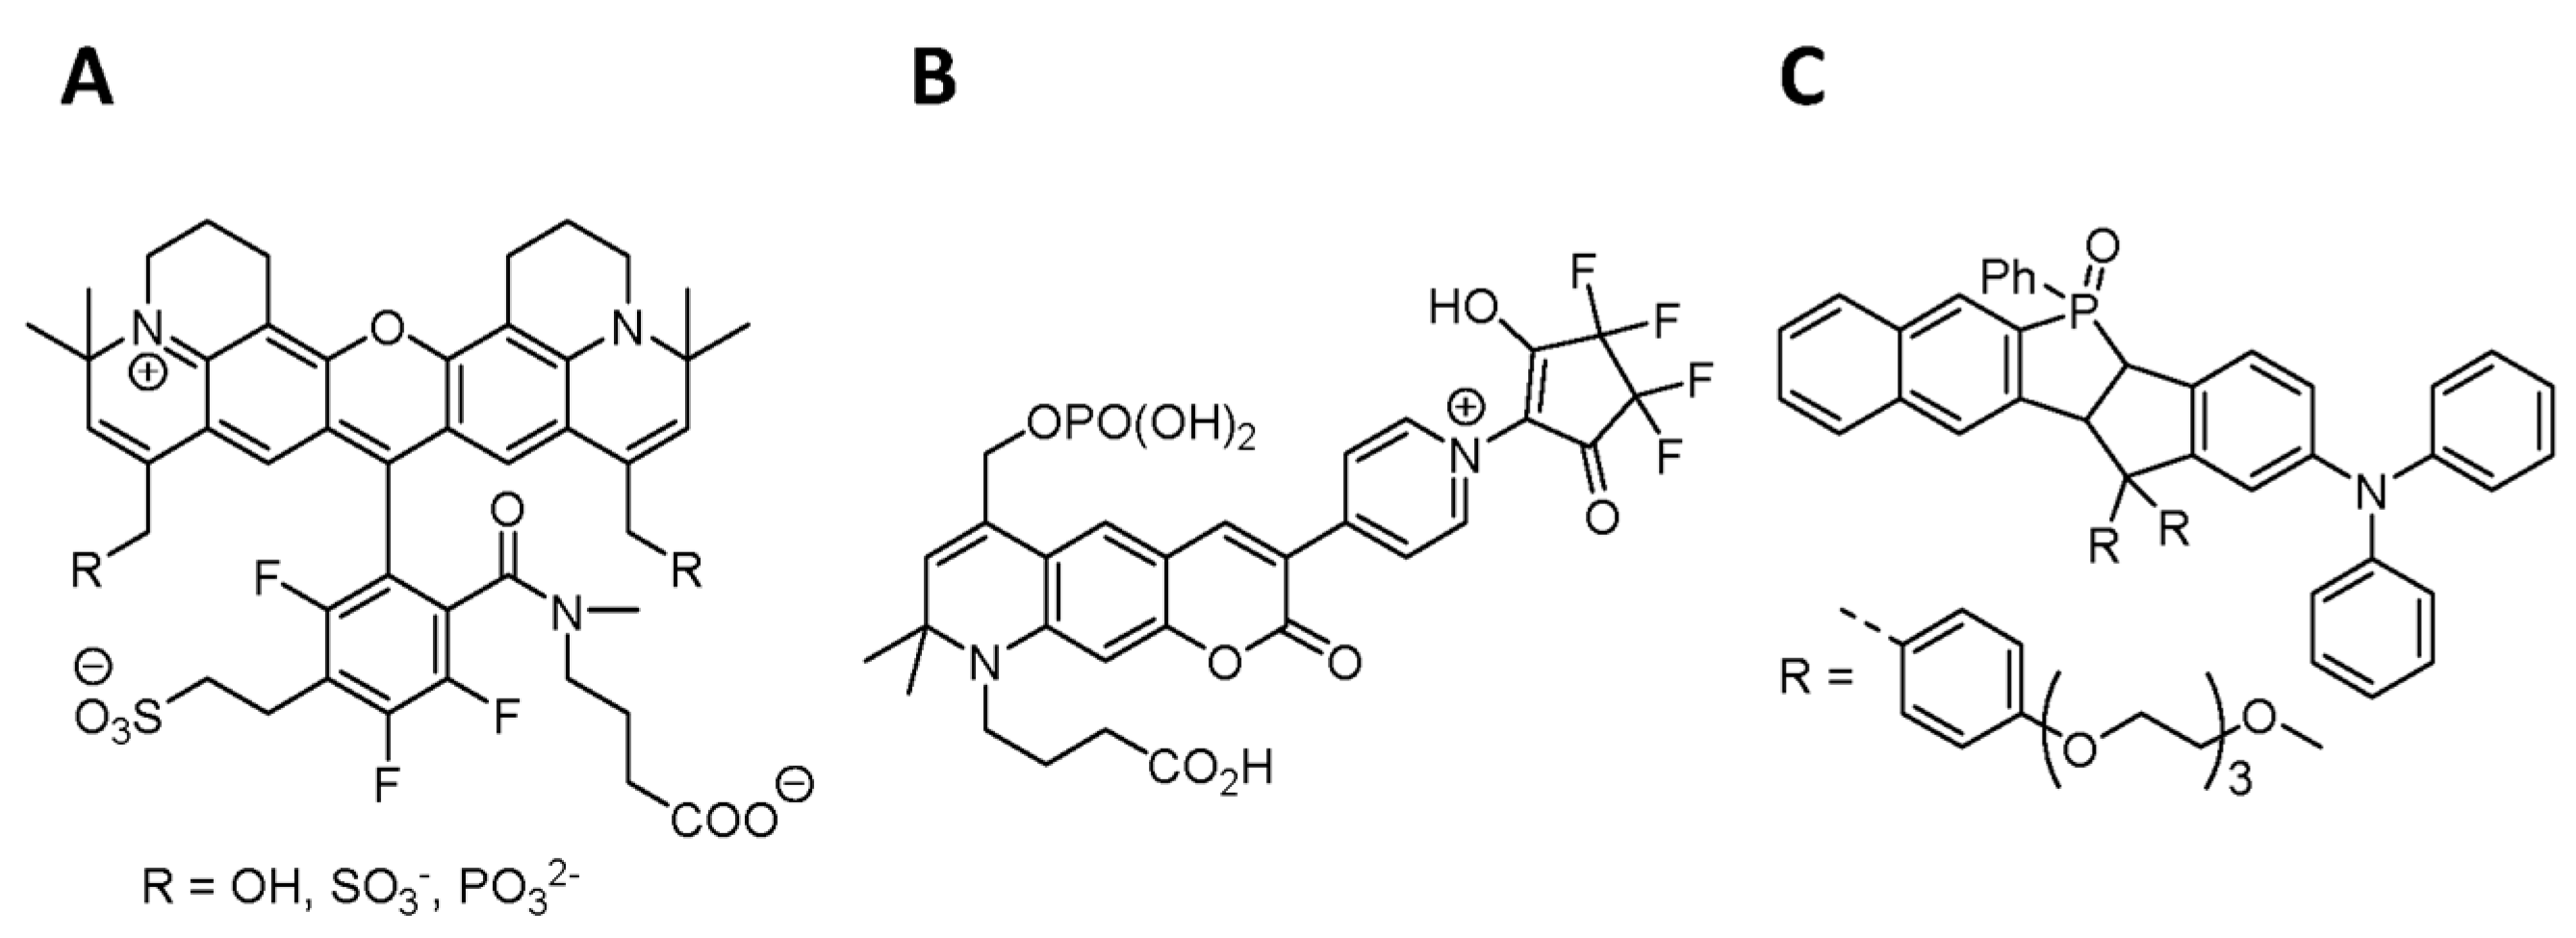
- Kolmakov, K.; Wurm, C.A.; Hennig, R.; Rapp, E.; Jakobs, S.; Belov, V.N.; Hell, S.W. Red-emitting rhodamines with hydroxylated, sulfonated, and phosphorylated dye residues and their use in fluorescence nanoscopy. Chem. Eur. J. 2012, 18, 12986–12998. [Google Scholar] [CrossRef] [PubMed]
- Nizamov, S.; Sednev, M.V.; Bossi, M.L.; Hebisch, E.; Frauendorf, H.; Lehnart, S.E.; Belov, V.N.; Hell, S.W. “Reduced” coumarin dyes with an O-phosphorylated 2,2-dimethyl-4-(hydroxymethyl)-1,2,3,4-tetrahydroquinoline fragment: Synthesis, spectra, and STED microscopy. Chem. Eur. J. 2016, 22, 11631–11642. [Google Scholar] [CrossRef] [PubMed]
- Wang, C.; Fukazawa, A.; Taki, M.; Sato, Y.; Higashiyama, T.; Yamaguchi, S. A phosphole oxide based fluorescent dye with exceptional resistance to photobleaching: A practical tool for continuous imaging in STED microscopy. Angew. Chem. Int. Ed. 2015, 54, 15213–15217. [Google Scholar] [CrossRef] [PubMed]
- Yang, S.K.; Shi, X.; Park, S.; Ha, T.; Zimmerman, S.C. A dendritic single-molecule fluorescent probe that is monovalent, photostable and minimally blinking. Nat. Chem. 2013, 5, 692–697. [Google Scholar] [CrossRef] [PubMed] [Green Version]
- Van der Velde, J.H.M.; Ploetz, E.; Hiermaier, M.; Oelerich, J.; de Vries, J.W.; Roelfes, G.; Cordes, T. Mechanism of intramolecular photostabilization in self-healing cyanine fluorophores. Chem. Phys. Chem. 2013, 14, 4084–4093. [Google Scholar] [CrossRef] [PubMed]
- Cortés, E.; Huidobro, P.A.; Sinclair, H.G.; Guldbrand, S.; Peveler, W.J.; Davies, T.; Parrinello, S.; Görlitz, F.; Dunsby, C.; Neil, M.A.A.; et al. Plasmonic nanoprobes for StimulaTed Emission Depletion nanoscopy. ACS Nano 2016, 10, 10454–10461. [Google Scholar] [CrossRef] [PubMed]
- Lord, S.J.; Conley, N.R.; Lee, H.D.; Samuel, R.; Liu, N.; Twieg, R.J.; Moerner, W.E. A photoactivatable push−pull fluorophore for single-molecule imaging in live cells. J. Am. Chem. Soc. 2008, 130, 9204–9205. [Google Scholar] [CrossRef] [PubMed]
- Dempsey, G.T.; Bates, M.; Kowtoniuk, W.E.; Liu, D.R.; Tsien, R.Y.; Zhuang, X. Photoswitching mechanism of cyanine dyes. J. Am. Chem. Soc. 2009, 131, 18192–18193. [Google Scholar] [CrossRef] [PubMed]
- Heilemann, M.; Margeat, E.; Kasper, R.; Sauer, M.; Tinnefeld, P. Carbocyanine dyes as efficient reversible. single-molecule optical switch. J. Am. Chem. Soc. 2005, 127, 3801–3806. [Google Scholar] [CrossRef] [PubMed]
- Dempsey, G.T.; Vaughan, J.C.; Chen, K.H.; Bates, M.; Zhuang, X. Evaluation of fluorophores for optimal performance in localization-based super-resolution imaging. Nat. Methods 2011, 8, 1027–1036. [Google Scholar] [CrossRef] [PubMed]
- Minoshima, M.; Kikuchi, K. Photostable and photoswitching fluorescent dyes for super-resolution imaging. J. Biol. Inorg. Chem. 2017, 22, 639–652. [Google Scholar] [CrossRef] [PubMed]
- Roubinet, B.; Weber, M.; Shojaei, H.; Bates, M.; Bossi, M.L.; Belov, V.N.; Irie, M.; Hell, S.W. Fluorescent photoswitchable diarylethenes for biolabeling and single-molecule localization microscopies with optical superresolution. J. Am. Chem. Soc. 2017, 139, 6611–6620. [Google Scholar] [CrossRef] [PubMed]
- Rodriguez, P.C.; Pereira, D.B.; Borgkvist, A.; Wong, M.Y.; Barnard, C.; Sonders, M.S.; Zhang, H.; Sames, D.; Sulzer, D. Fluorescent dopamine tracer resolves individual dopaminergic synapses and their activity in the brain. Proc. Natl. Acad. Sci. USA 2013, 110, 870–875. [Google Scholar] [CrossRef] [PubMed]
- Yu, Z.; Ohulchanskyy, T.Y.; An, P.; Prasad, P.N.; Lin, Q. Fluorogenic, two-photon-triggered photoclick chemistry in live mammalian cells. J. Am. Chem. Soc. 2013, 135, 16766–16769. [Google Scholar] [CrossRef] [PubMed]
- Jing, C.; Cornish, V.W. A fluorogenic TMP-tag for high signal-to-background intracellular live cell imaging. ACS Chem. Biol. 2013, 8, 1704–1712. [Google Scholar] [CrossRef] [PubMed]
- Pimenta, F.M.; Chiappetta, G.; Le Saux, T.; Vinh, J.; Jullien, L.; Gautier, A. Chromophore renewal and fluorogen-binding tags: A match made to last. Sci. Rep. 2017, 7, 12316. [Google Scholar] [CrossRef] [PubMed]
- Marx, V. Is super-resolution microscopy right for you? Nat. Methods 2013, 10, 1157–1163. [Google Scholar] [CrossRef] [PubMed]
- Webb, S.E.; Zanetti-Domingues, L.; Coles, B.C.; Rolfe, D.J.; Wareham, R.J.; Martin-Fernandez, M.L. Multicolour single molecule imaging on cells using a supercontinuum source. Biomed. Opt. Express 2012, 3, 400–406. [Google Scholar] [CrossRef] [PubMed]
- Khanna, V.K. LEDs, OLEDs, and their applications in illumination and displays. In Fundamentals of Solid-State Lighting; Taylor & Francis Group, Ed.; CRC Press: London, UK, 2014. [Google Scholar]
- So, P.T.; Masters, B.R.; Berland, K.M. Two-photon excitation fluorescence microscopy. Annu. Rev. Biomed. Eng. 2000, 2, 399–429. [Google Scholar] [CrossRef] [PubMed]
- Graf, R.; Rietdorf, J.; Zimmerman, T. Live cell spinning disk microscopy. Adv. Biochem. Eng./Biotechnol. 2005, 95, 57–75. [Google Scholar]
- Bethge, P.; Chéreau, R.; Avignone, E.; Marsicano, G.; Nägerl, U.V. Two-photon excitation STED microscopy in two colors in acute brain slices. Biophys. J. 2013, 104, 778–785. [Google Scholar] [CrossRef] [PubMed]
- Godin, A.G.; Lounis, B.; Cognet, L. Super-resolution microscopy approaches for live cell imaging. Biophys J. 2014, 107, 1777–1784. [Google Scholar] [CrossRef] [PubMed]
- Martini, N.; Bewersdorf, J.; Hell, S.W. A new high-aperture glycerol immersion objective lens and its application to 3D-fluorescence microscopy. J. Microsc. 2002, 206, 146–151. [Google Scholar] [CrossRef] [PubMed]
- Gregor, I.; Enderlein, J. Focusing astigmatic Gaussian beams through optical systems with a high numerical aperture. Opt. Lett. 2005, 30, 2527–2529. [Google Scholar] [CrossRef] [PubMed]
- Geusebroek, J.M.; Cornelissen, F.; Smeulders, A.; Geerts, H. Robust autofocusing in microscopy. Cytometry 2000, 39, 1–9. [Google Scholar] [CrossRef] [Green Version]
- Bénard, M.; Lebon, A.; Komuro, H.; Vaudry, D.; Galas, L. Ex vivo imaging of postnatal cerebellar granule cell migration using confocal macroscopy. J. Vis. Exp. 2015, 99, e52810. [Google Scholar] [CrossRef] [PubMed]
- Quan, T.; Zeng, S.; Huang, Z. Localization capability and limitation of electron-multiplying charge-coupled, scientific complementary metal-oxide semiconductor, and charge-coupled devices for super-resolution imaging. J. Biomed. Opt. 2010, 15, 066005. [Google Scholar] [CrossRef] [PubMed]
- DeWeert, M.J.; Cole, J.B.; Sparks, A.W.; Acker, A. Photon transfer methods and results for electron multiplication CCDs. Proc. SPIE 2004, 5558, 248–259. [Google Scholar]
- Coates, C.G.; Denvir, D.J.; Conroy, E.; McHale, N.G.; Thornbury, K.; Hollywood, M. Back-illuminated electron multiplying technology: The world’s most sensitive CCD for ultralow-light microscopy. In Manipulation and Analysis of Biomolecules, Cells, and Tissues; Nicolau, D.V., Enderlein, J., Leif, R.C., Farkas, D.L., Eds.; Int. Soc. Optical Engineering: Bellingham, WA, USA, 2003; Volume 4962, pp. 319–328. [Google Scholar]
- To See or Not to See. Can Non-Cooled sCMOS Cameras Do the Job? Available online: https://www.imaging-git.com/applications/see-or-not-see (accessed on 13 September 2018).
- Zucker, R.M. Quality assessment of confocal microscopy slide-based systems: Instability. Cytometry A 2006, 69, 659–676. [Google Scholar] [CrossRef] [PubMed]
- Adler, J.; Pagakis, S.N. Reducing image distorsions due to the temperature-related microscope stage drift. J. Microsc. 2003, 210, 131–137. [Google Scholar] [CrossRef] [PubMed]
- Arbelle, A.; Reyes, J.; Chen, J.Y.; Lahav, G.; Riklin Raviv, T.A. Probabilistic approach to joint cell tracking and segmentation in high-throughput microscopy videos. Med. Image Anal. 2018, 47, 140–152. [Google Scholar] [CrossRef] [PubMed]
- Helmuth, J.A.; Burckhardt, C.J.; Koumoutsakos, P.; Greber, U.F.; Sbalzarini, I.F. A novel supervised trajectory segmentation algorithm identifies distinct types of human adenovirus motion in host cells. J. Struct. Biol. 2007, 159, 347–358. [Google Scholar] [CrossRef] [PubMed]
- Cordelières, F.P.; Petit, V.; Kumasaka, M.; Debeir, O.; Letort, V.; Gallagher, S.J.; Larue, L. Automated cell tracking and analysis in phase-contrast videos (iTrack4U): Development of Java software based on combined mean-shift processes. PLoS ONE 2013, 8, e81266. [Google Scholar]


| Application | Type of Sample | Method of Labelling | Probes (Non Exhaustive) | References (Non Exhaustive) |
|---|---|---|---|---|
| Cell viability | isolated cell or multi cell layers | permeation | Calcein-AM | [109,110,175] |
| isolated cell or multi cell layers | permeation | acetate derivatives of fluorescein (FDA) | [110,111] | |
| organ | permeation | Syto 61, Sytox Orange, TO-PRO-1/3 | [173,174] | |
| Cell tracking | isolated cell/organ/organism | permeation/injection | CellTracker/DiI/Cyto-Tracers/WGA | [114,116,176,179,185,186] |
| isolated cell | incorporation in lipid membrane | CellVue, CytoID Red | [115,116,117] | |
| isolated cell/organ/organism | infection (lentivectors) | Cyto-Tracers | [132] | |
| organ/organism | injection | Dextran-conjugated/SiR | [182,188] | |
| organism | transfection/electroporation | Plasmid contruction | [140,141] | |
| Identification of membrane, organelles and macromolecules | ||||
| plasma membrane | isolated cell/organ/organism | reversible binding | WGA | [114,122] |
| plasma membrane | organ | reversible binding | IB4 | [174] |
| cytoskeleton | isolated cell/organ | permeation | SiR-Actin/Tubulin/Taxanes | [130,131,237] |
| nucleus | isolated cell or multi cell layers | permeation | Hoechst/SYTO/Nuc/dinuclear RuII-based complex 14+ | [112,113,123,124,237] |
| mitochondria | isolated cell/organ/organism | permeation | Mitotracker | [125,126,127,187] |
| lysosome | isolated cell/organ/organism | permeation | Lysotracker, SiR-Lysosome | [128,129,130,131] |
| glycan | isolated cell/organ/organism | click chemistry | azide or alkyl monosaccharide | [133,134,201] |
| plant primary cell wall | isolated cell/organ/organism | click chemistry | azide or alkyl monosaccharide | [135,137,197,200] |
| plant secondary cell wall | isolated cell/organ/organism | click chemistry | azide or alkyl monolignol | [198] |
| Cellular activity | ||||
| potential membrane activity | isolated cell | permeation | JC-1 | [160] |
| ionic indicator | isolated cell or multi cell layers | permeation | fluo-4 (Ca2+), SBFI (Na2+), Fluo-Zin, KMG-20/27 | [151,152,153,154,156,157,158] |
| ionic indicator | multilayers, organ | permeation | oregon green (Ca2+) | [176,177] |
| ROS detection | isolated cell or multi cell layers | permeation | H2DCFDA, RedocSensor, SiR-NO, … | [160,161,162,163] |
| caspase activity | isolated cell or multi cell layers | permeation | FITC-ZVAD-FMK | [110] |
| plamid contruction/Biosensors | isolated cell | transfection | GFP family or derivative protein | [140,165] |
| plamid contruction/Biosensors | organ/organism | transfection by electroporation | GFP family or derivative protein | [181,189,190] |
| pathway signal transduction | isolated cell | infection (bacculovirus) | BacMam system | [113] |
| pathway signal transduction | isolated cell | transfection | FRET Biosensors | [166,167,168,169,170,171] |
| pathway signal transduction | organ | infection (HSV) | Biosensors | [179,180] |
| Wide-Field Microscopy | Advanced Light Imaging Approaches | ||||||||
|---|---|---|---|---|---|---|---|---|---|
| Light Source | Mercury Arc Lamp | Xenon Arc Lamp | LED | Laser 1P | Laser 2P | STED | |||
| Liquid light guide/Direct coupling | Gas | Diode | Supercontinuum | Solid-State | Depletion | ||||
| Power range (mW) | 100–300 | 3000–5000 | 50–500 | 5–20 | 10–50 | 0.5–5 | 700–4000 | 1500–2000 | |
| Maximum power (mW) | 2 * | 25 * | 250 * | 5 * | 8 * | 0.45 * | 2850 ** | 300–450 *** | |
| Living Cells | Phototoxicity | ++ | +++ | ++++ | ++ | ++ | + | +++++ | +++++ |
| Photobleaching | +++ | ++++ | +++++ | +++ | +++ | ++ | + | +++++ | |
| Duration of Acquisition | |||
|---|---|---|---|
| Instrumental parameter | One-Time Acquisition (s or few min) | Short Time-Lapse (tens of min) | Long Time-Lapse (several hours) |
| Power Laser | - | + | + + + |
| Field of Illumination | - | - | - |
| Detector Sensitivity | - | - | - |
| Drift and Shift (x,y,z) | - | + + | + + + + |
| Temperature and CO2 | + | + + | + + + + |
© 2018 by the authors. Licensee MDPI, Basel, Switzerland. This article is an open access article distributed under the terms and conditions of the Creative Commons Attribution (CC BY) license (http://creativecommons.org/licenses/by/4.0/).
Share and Cite
Galas, L.; Gallavardin, T.; Bénard, M.; Lehner, A.; Schapman, D.; Lebon, A.; Komuro, H.; Lerouge, P.; Leleu, S.; Franck, X. “Probe, Sample, and Instrument (PSI)”: The Hat-Trick for Fluorescence Live Cell Imaging. Chemosensors 2018, 6, 40. https://doi.org/10.3390/chemosensors6030040
Galas L, Gallavardin T, Bénard M, Lehner A, Schapman D, Lebon A, Komuro H, Lerouge P, Leleu S, Franck X. “Probe, Sample, and Instrument (PSI)”: The Hat-Trick for Fluorescence Live Cell Imaging. Chemosensors. 2018; 6(3):40. https://doi.org/10.3390/chemosensors6030040
Chicago/Turabian StyleGalas, Ludovic, Thibault Gallavardin, Magalie Bénard, Arnaud Lehner, Damien Schapman, Alexis Lebon, Hitoshi Komuro, Patrice Lerouge, Stéphane Leleu, and Xavier Franck. 2018. "“Probe, Sample, and Instrument (PSI)”: The Hat-Trick for Fluorescence Live Cell Imaging" Chemosensors 6, no. 3: 40. https://doi.org/10.3390/chemosensors6030040