Article

From Batch to Flow Stripping Analysis with Screen-Printed Electrodes: A Possible Way to Decentralize Trace Inorganic Analysis

1
Dipartimento di Scienze Teoriche ed Applicate, Università degli Studi dell’Insubria, Via Dunant, 3, 22100 Varese, Italy
2
Dipartimento di Scienza ed Alta Tecnologia, Università degli Studi dell’Insubria, Via Valleggio, 11, 21100 Como, Italy
*
Author to whom correspondence should be addressed.
Chemosensors 2018, 6(3), 37; https://doi.org/10.3390/chemosensors6030037
Submission received: 31 July 2018 / Revised: 29 August 2018 / Accepted: 3 September 2018 / Published: 5 September 2018
(This article belongs to the Special Issue Printed Electroanalytical Tools for De-Centralized Applications)

Abstract

:
Decentralization of on-site and in-site trace metal analysis has been a key topic over the last 30 years, owing to the increasing need for environmental protection as well as industrial and health-based field applications. In trace (and ultratrace) metal analysis, electrochemical stripping analysis with mercury (or bismuth) screen-printed film electrodes has shown a fast growth in popularity thanks to the good limits of detection, the ease of application in the field, and the low cost. Moreover, the availability of new wall-jet flow cells has opened the opportunity for their use in in situ industrial monitoring. The analytical figures of merit in stripping voltammetry with screen-printed electrodes (SPEs) under decentralized conditions and/or with sensor arrays are heavily affected by some analytical factors, primarily the presence of a pseudo-reference electrode, the efficiency of mass transport during the preconcentration step, and the need for external calibration. A careful model investigation of the analytical parameters for an efficient use of SPEs in decentralized conditions has been undertaken and discussed. Different instrumental approaches were investigated, comparing optimized batch conditions and flow cell operation under either continuous flow or stopped-flow sample injection. The stripping efficiency under wall-jet flow conditions was found to be high and comparable to that in batch conditions, leading to sub-ppb (μg/L) limit of detection (LOD) figures. Finally, external calibration in stripping voltammetry was studied as a viable alternative to conventional standard addition quantitation. Results showed, indeed, that external calibration was demonstrated to be reliable for quantitation of Pb and Cd in real water samples.

1. Introduction

Anodic stripping voltammetry (ASV) has always been regarded as an extremely sensitive electroanalytical technique and is often the greatest competition for plasma spectroscopies, particularly ICP-MS, for trace metal analysis [1]. These methods exploit the properties of certain electrodic materials to preconcentrate analytes—not just inorganic but also electroactive (bio)organic molecules—on their surface and analyze them by stripping back to the bulk of solution. Despite its toxicity, mercury still plays a major role in electrochemistry thanks to its physicochemical properties and its good analytical figures in electroanalysis, particularly robustness, reproducibility, and sensitivity for heavy metal determination [2,3,4]. The use of screen-printed electrodes (SPEs) was a second important step in stripping electroanalysis [5]. Apart from the low cost and excellent analytical performance in organic and bioanalytical chemistry [6,7], the microminiaturization of SPEs dramatically reduced the required amounts of metallic mercury, to the point of having it predeposited as salt on the working electrode, significantly reducing its environmental impacts [8]. In accordance with the European directive related to the restriction of metallic mercury, its substitution in favor of alternative metal coatings, such as bismuth or antimony, is an important research topic [9,10]. However, the need to investigate trace analytes under in-the-field and/or decentralized applications with potentially complex sample matrixes prompted us to continue using mercury(II) as the best choice for such study, thanks to the profound knowledge of its chemistry and electrochemical behavior [2,3,4]. Doubtless, bismuth(III) will be soon a viable alternative in this field, provided that a better understanding of its complex aqueous chemistry is reached [9].
The preconcentration step is the most critical aspect for in situ or in-the-field use of screen-printed electrodes in stripping analysis at trace levels. In fact, very low limits of detection and analytical sensitivities can only be reached by providing an optimized and reproducible mass transport to the electrode during the preconcentration step in batch conditions, as well as using a solvent exchange approach when complex matrixes are involved [11]. A different instrumental approach appeared in the ‘80s, involving the use of flow injection analysis for the stripping determination of trace analytes. It gained interest in the scientific community, with good analytical figures of merit and claimed patents [5,12], but it was apparently undergoing a slow oblivion. In recent years, however, this instrumental approach has resurfaced [13,14]. The availability of new, commercial low-volume wall-jet flow cells for screen-printed electrodes may be one of the main reasons for the revitalization of this technique. In organic chemistry, interesting results have already been reported [15]; more work seems, instead, to be needed for trace inorganic analysis. A recent preliminary report has shown how continuous flow operation seemed to be unsuited for their high noise, whereas flow injection was proposed as a reliable approach, with good limits of detection and reproducibility [16].
In this manuscript, a careful investigation of the analytical parameters for efficient use of SPEs in potential decentralized conditions is undertaken and discussed. Different instrumental approaches are investigated, comparing optimized batch conditions and flow cell operation, either under continuous flow or stopped-flow sample injection. Finally, external calibration in stripping voltammetry is studied, as a viable alternative to conventional standard addition quantitation.

2. Materials and Methods

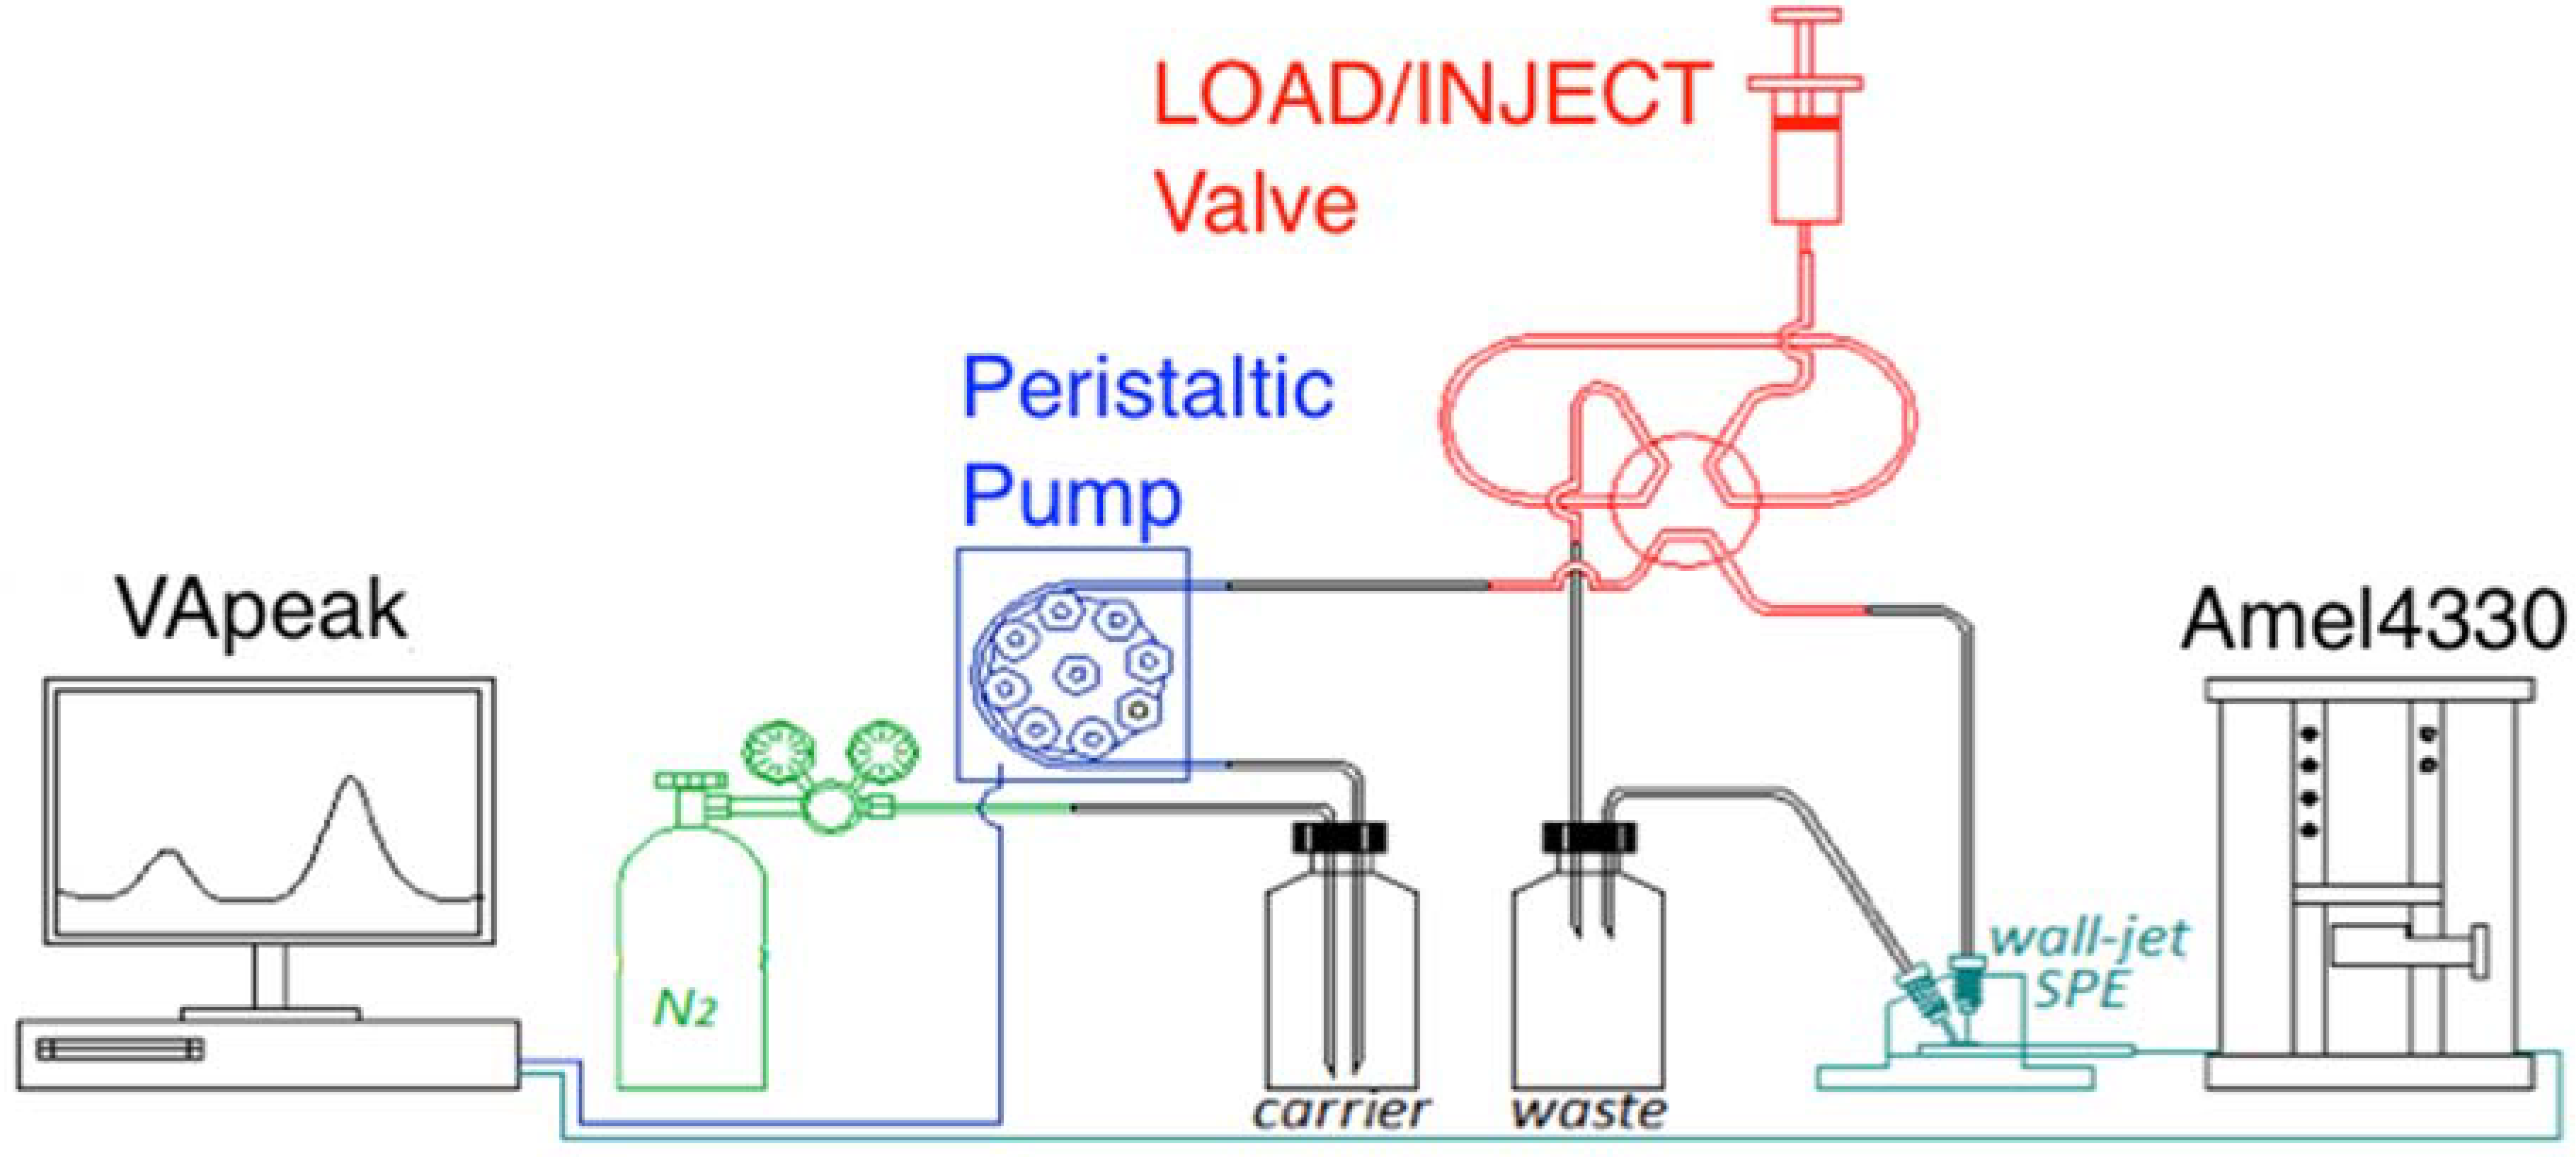
2.1. Instrumental Setup

Screen-printed electrodes (SPEs) were bought from DropSens (DropSens S.L, Asturias, Spain). Electrodes were printed on a 33 mm × 10 mm × 0.5 mm ceramic alumina substrate under the code DRP-C110, with carbon electrodes for working and counter, and silver for the reference electrode. The surface area of the working carbon electrode is 16 mm2. In the presence of chloride in the sample solution, a film of AgCl is grown; the presence of chloride ions is therefore a necessary requirement for using SPEs in stripping analysis.
For electroanalytical experiments, an Amel 4330 versatile electroanalytical instrument (Amel Srl, Milano, Italy) was used. The Amel 4330 instrument proved very effective for stripping analysis because of its integrated voltammetric cell, which enables automatic stirring and degassing throughout all electroanalytic steps. Moreover, a Perimax 12 peristaltic pump (Spetec, Erding, Germany) for stopped-flow and flow injection operations can be easily interfaced.
The Amel4330 instrument, the batch cell, and the peristaltic pump are fully handled and controlled by the Windows-based VApeak software. This software has been developed by us to allow full instrumental control, as well as full data analysis (peak finding, peak height and area calculations), and quantitation via external calibration or standard additions without requiring any external modules.
All quantitative calculations were done as peak height. The conventional use of linear baselines can, however, result in underestimating peak heights in voltammetry [17]. The use of spline baselines in VApeak was suitably exploited to improve the reliability of the calibration calculations. Analytical sensitivity was defined as the slope of the best-fit calibration line. Limits of detection (LOD) were determined following IUPAC guidelines [18] as 3 σ/m, where σ was determined by running ten replicate analyses on a standard sample near the limit of detection, and m is the analytical sensitivity. Limits of quantitation (LOQ) were then calculated as 10 σ/m.
All the PTFE beakers and cells, round-bottomed flasks in polypropylene, polypropylene tubes, and pipette tips used for preparation and storage of samples and solutions were rinsed with copious amounts of double-distilled water.
Hydrochloric and nitric acid (TraceSelect from Fluka) were purified by sub-boiling distillation in a quartz–Teflon apparatus. Sodium chloride (Trace Select) was purchased from Fluka.
Cadmium and lead standard stock solutions (1000 mg/L) were from Sigma-Aldrich and diluted as required. Mercury stock solution (80 mg/L) was prepared from mercury(II) chloride (CarloErba, Milan Italy) in 1.3 M hydrochloric acid.
High-purity MilliQ water (from MilliPore, Burlington, MA, USA) was used for all solutions and standards, except if otherwise indicated.

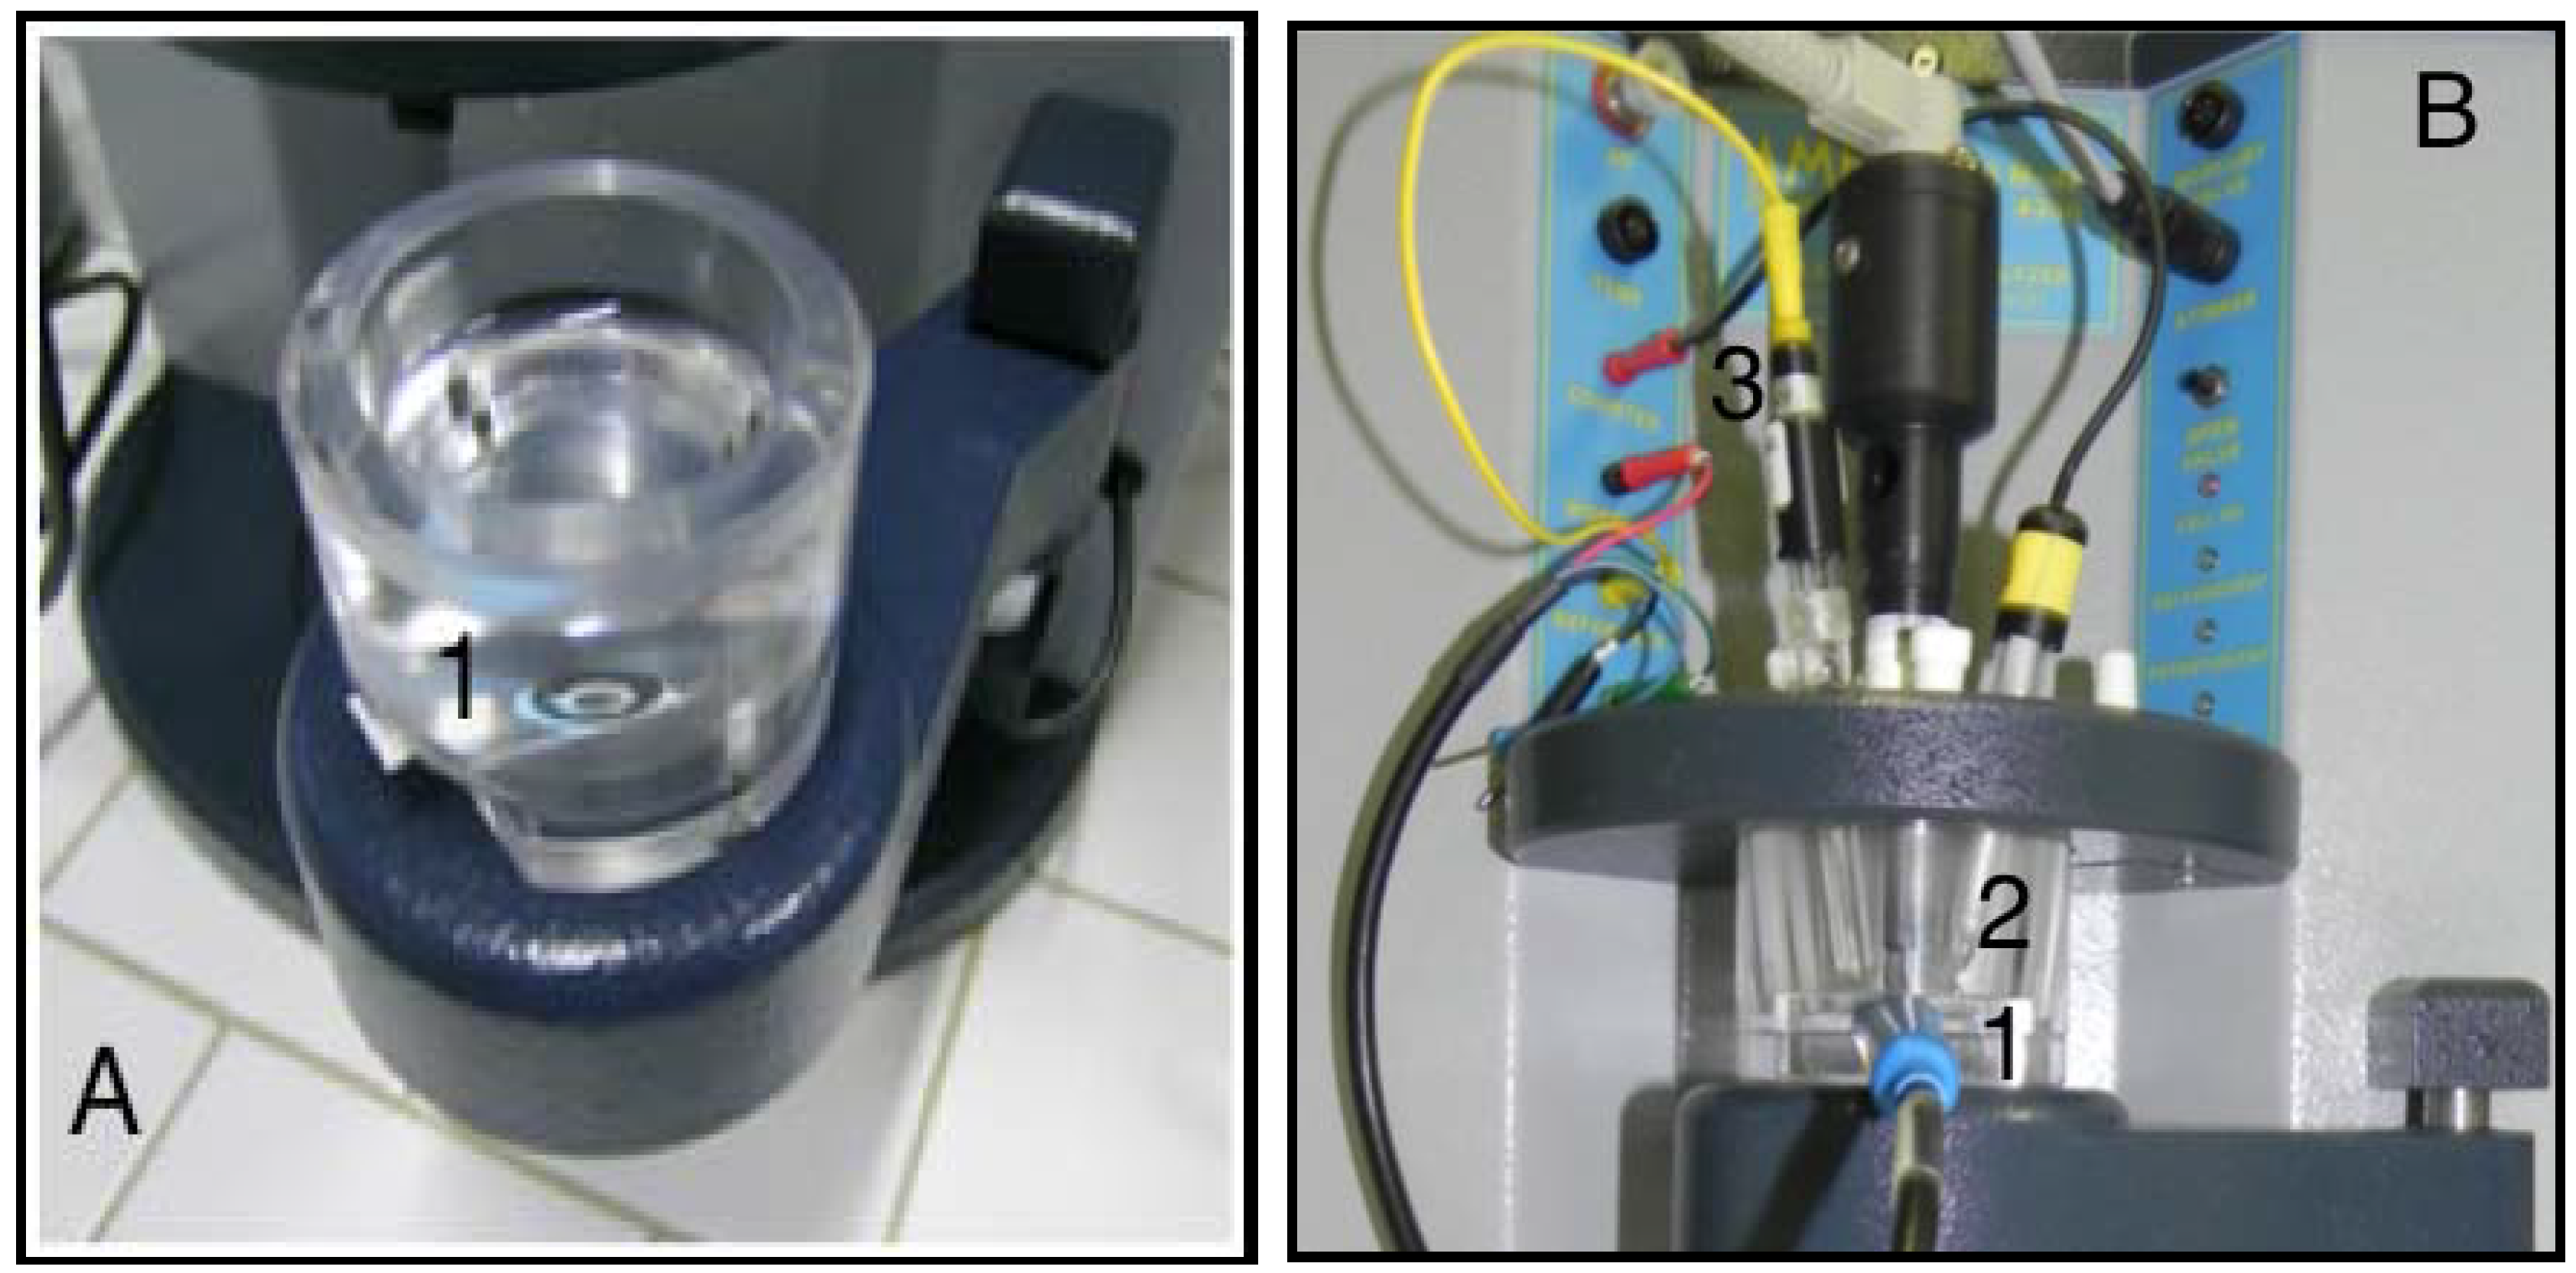
2.2. Cells and Flow System

For performing stripping voltammetry under batch conditions, a specially designed, plastic-made cell (mod.4330-PX) was supplied by AMEL (#1 in Figure 1A) and assembled on an Amel4330 instrument (Figure 1B).
The screen-printed electrode was placed on the bottom of the cell, kept in place, and sealed by a Viton O-ring. A palette top stirrer (#2 in Figure 1B) was then placed above the active area of the electrode, and moved by a stepped motor in the range 0–800 rpm under computer control. In this way, mass transport to the electrode under stirred conditions was optimized, preventing, at the same time, water or acid vapors from degrading the electric contacts to the SPE. All experiments were conducted at 400 rpm. Moreover, this cell allowed the use of an external 3 M KCl Ag/AgCl reference electrode in order to reference all potentials (#3 in Figure 1B). In those cases where the internal pseudo-reference Ag wire was used, a 0.01 M chloride concentration had to be kept constant in the cell solution, and potentials were referred to the reference electrode.
The analytical step of analyte redissolution was initially done by differential pulse in the potential range between −1000 and −250 mV in order to account for all chloride activity. However, under our actual conditions, the stripping scan could be stopped at −500 mV, to save analysis time. The differential pulse profile was performed with pulse height of 50 mV and a voltage step of 5 mV. A final cleaning step was done at −250 mV for 10 s.
The flow system was home-made in our laboratory using a Perimax 12 peristaltic cell, a six-port injection valve (Omnifit, Cambridge, UK) for the loading (“LOAD”) and the injection (“INJECT”) of samples in flow injection analysis (FIA) experiments, and a low-volume wall-jet Plexiglas flow cell DRP-FLWCL from Dropsens, Spain. The fluidic cell was run at 1.0 mL/min flow of eluent in order to have best conditions inside the wall-jet cell.
The full instrumental scheme for flow stripping, for both stopped-flow and flow injection analysis, is depicted in Figure 2.
For stopped-flow stripping voltammetry (SF-SV), the peristaltic pump was operated in the preconcentration and cleaning step, whereas it was switched off during the stripping analytical step. The complete flow timing is described in Figure 3.
For flow injection analysis stripping voltammetry (FIA-SV), the standard and sample solutions were injected via the Omnifit valve equipped with a 0.5 mL loop. The flow timing procedure was kept similar to that reported in Reference [16]. The setup of the fluidic system was performed using potassium ferricyanide (50 mM in 1 M KNO3/0.1 M KCl solution) reduction as a model reaction at 0 mV and amperometric detection.
For both flow injection and stopped-flow experiments, the fluidic setup was kept unchanged in order to allow a full comparison of the analytic performance in the two types of operation. Obviously, the Omnifit injection valve was operated only for flow injection analyses.

2.3. Measurement Procedures

Prior to the analysis, screen-printed electrodes were cleaned in ethanol, rinsed in water, and left in a 0.01 M hydrochloric acid solution. No problems of lead contamination were found. Screen-printed electrodes were used in a standard 3-wire configuration.
For comparison purposes, an external Ag/AgCl (3 M KCl) electrode was used as a reference in the batch cell instead of the internal Ag electrode of the SPE. The chloride ion activity had to be kept constant throughout all experiments.
Prior to any analysis, a mercury film was grown on the working electrode using a plating solution of 80 mg/L HgCl2 in 1.3 M HCl at −1000 mV under a stirring (or flowing) time of 200 s. The analysis can theoretically be performed on this film without any other addition of the mercury salt. However, it was found that the addition of a 100-fold diluted plating solution to standards and samples greatly increased the reproducibility of the analysis. This is well known in the literature, since the diluted mercury solution helped to stabilize the mercury film and made the amalgam formation easier.
In flow analysis, a 0.8 mg/L HgCl2 solution at pH = 2 and aCl = 10−2 M was used as the blank and eluent solution.
Between each sample, rinsing of the cell and the SPE surface was done with MilliQ water acidified to pH = 2 with hydrochloric acid. In all solutions, if the chloride activity was different from 10−2 M, sodium chloride or nitric acid were used for adjustment, and stripping potentials were corrected for chloride activity.
For standard addition quantitation, the sample was analyzed first. Then, three additions of a multistandard containing both Cd and Pb to reach a final standard concentration of around 15 and 25 μg/L were performed and the effects analyzed.
External calibration was done before the samples were analyzed by using a linear calibration line. A series of five standard solutions containing Pb and Cd in a range between 0 and the limit of linearity (LOL) were prepared in the same matrix as the samples (in our case, an acidified synthetic water). Normally, calibration is performed between 0 and 25 μg/L.
The five standard solutions were sequentially analyzed, and the best fit was computed to obtain the calibration line. The samples were then analyzed and the two analytes were quantified using the parameters of the best-fit calibration line.

3. Results and Discussion

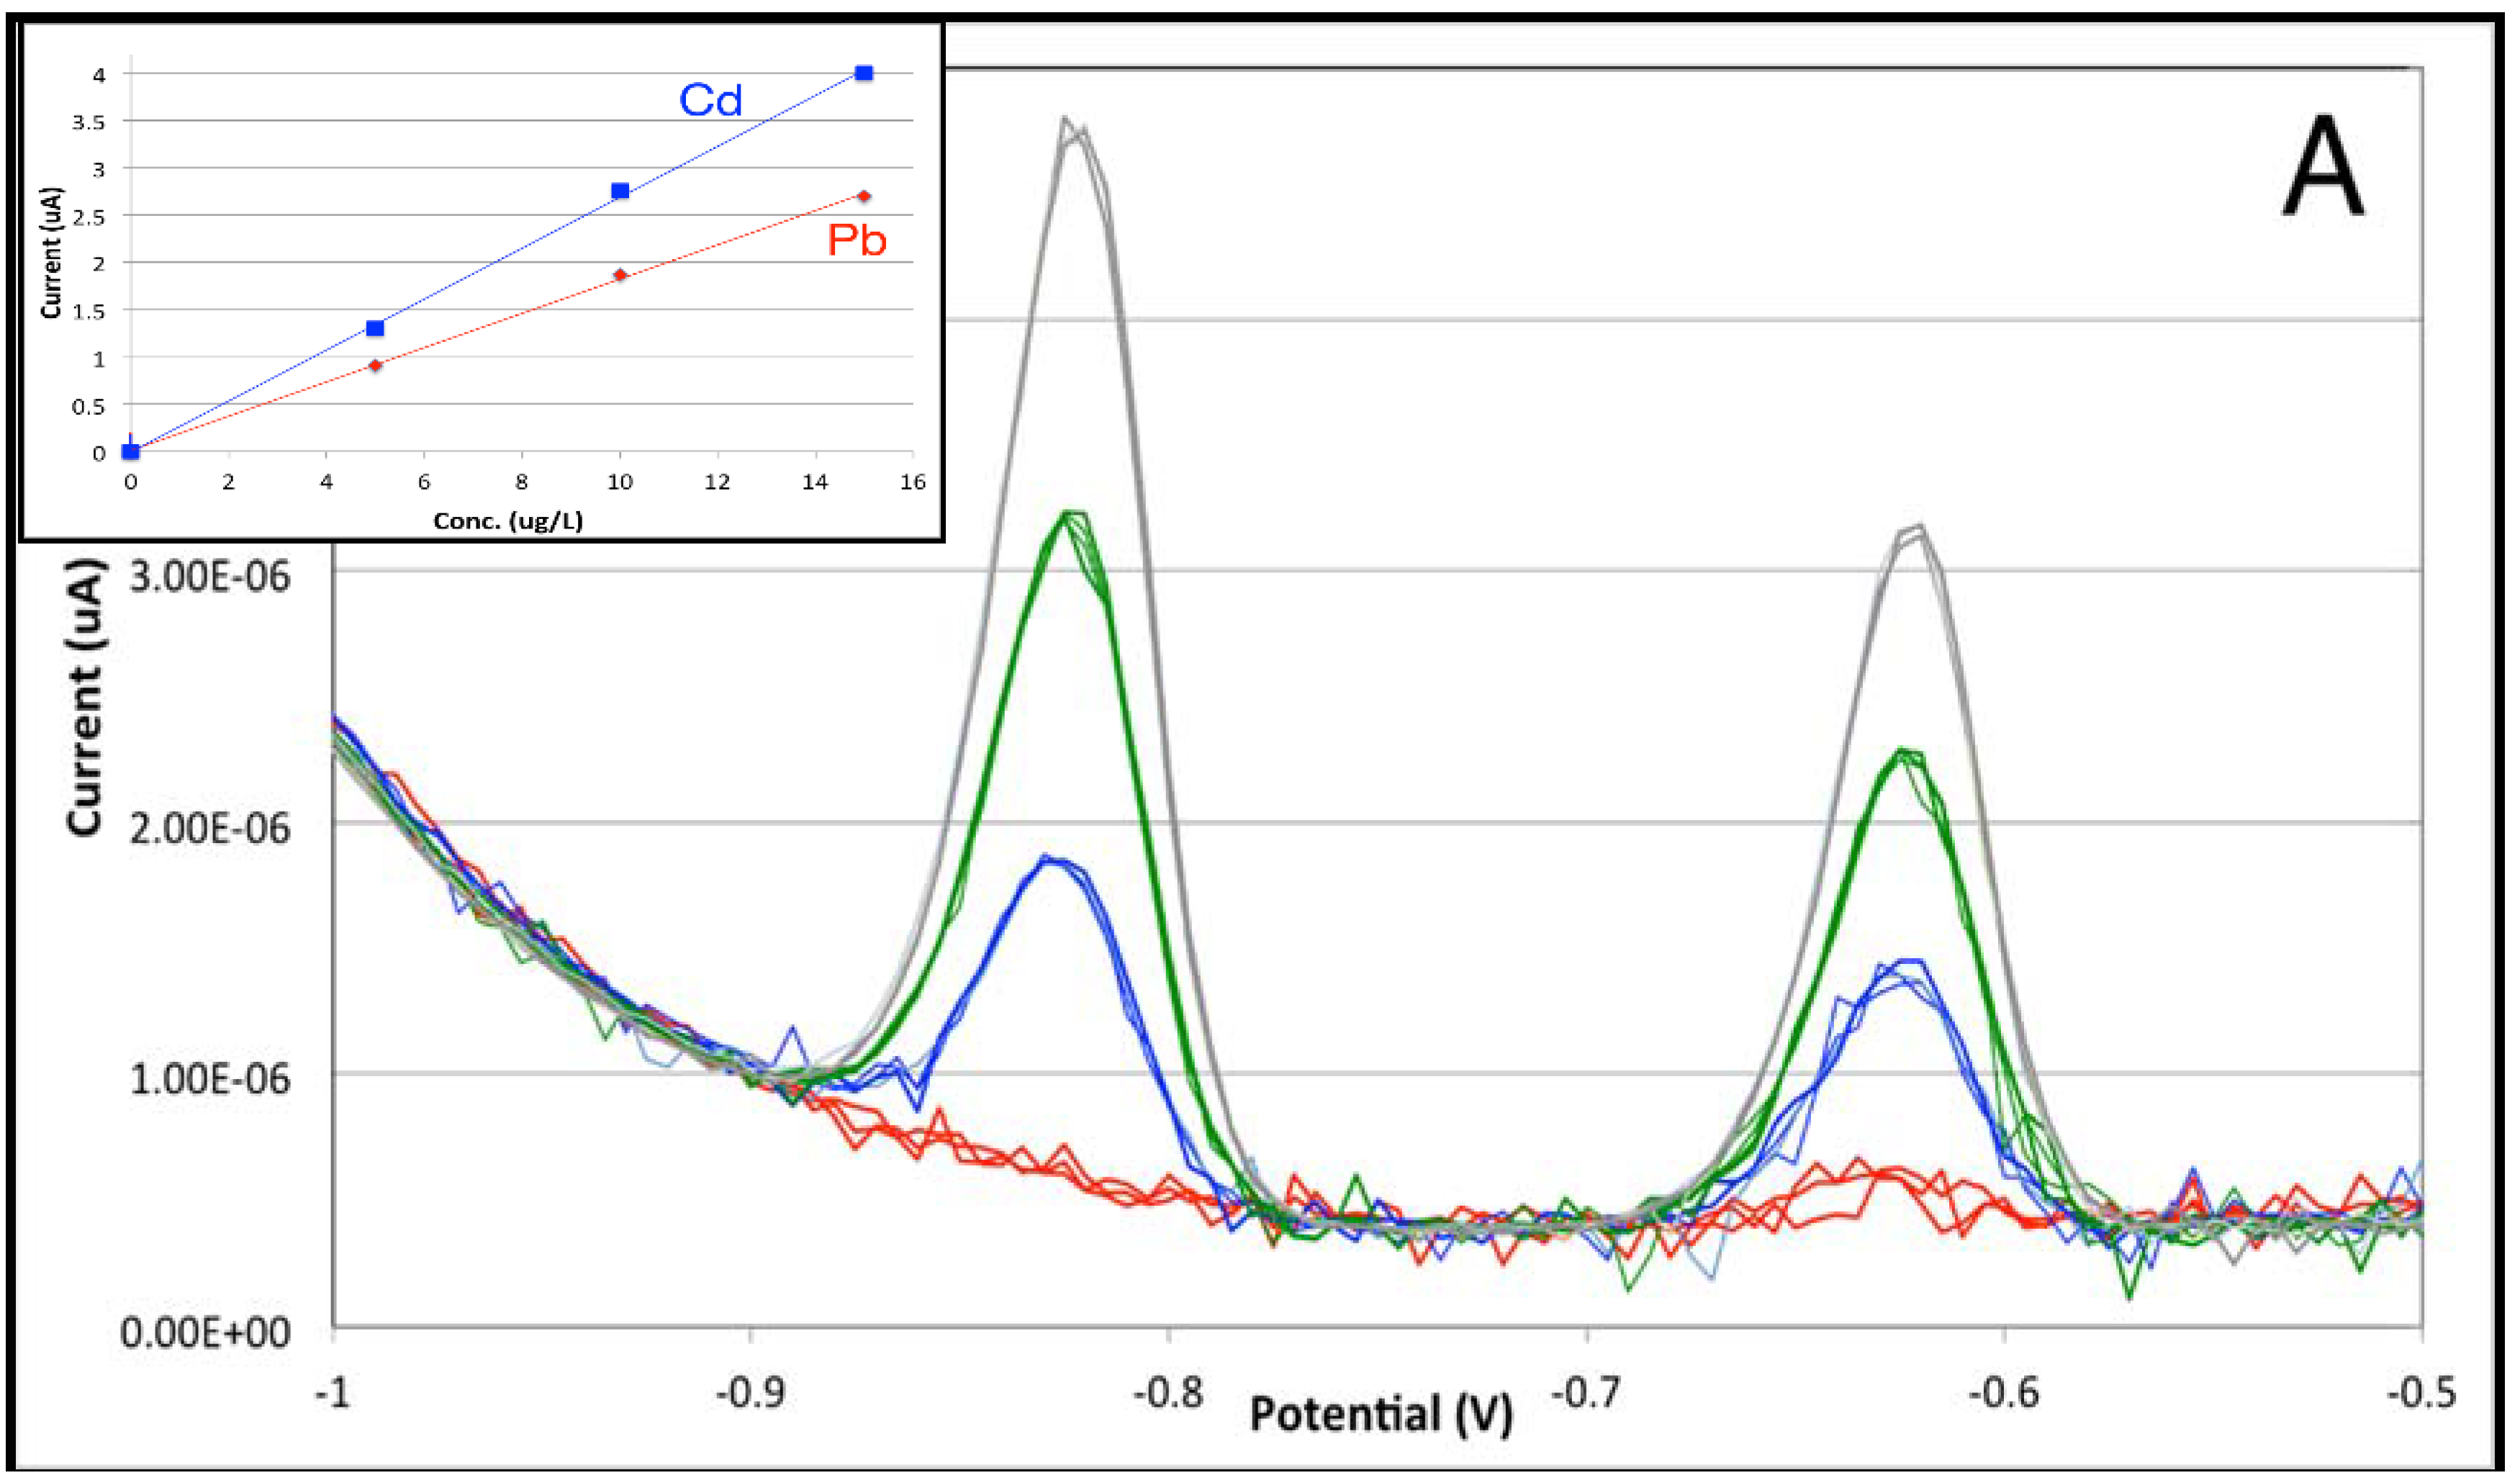
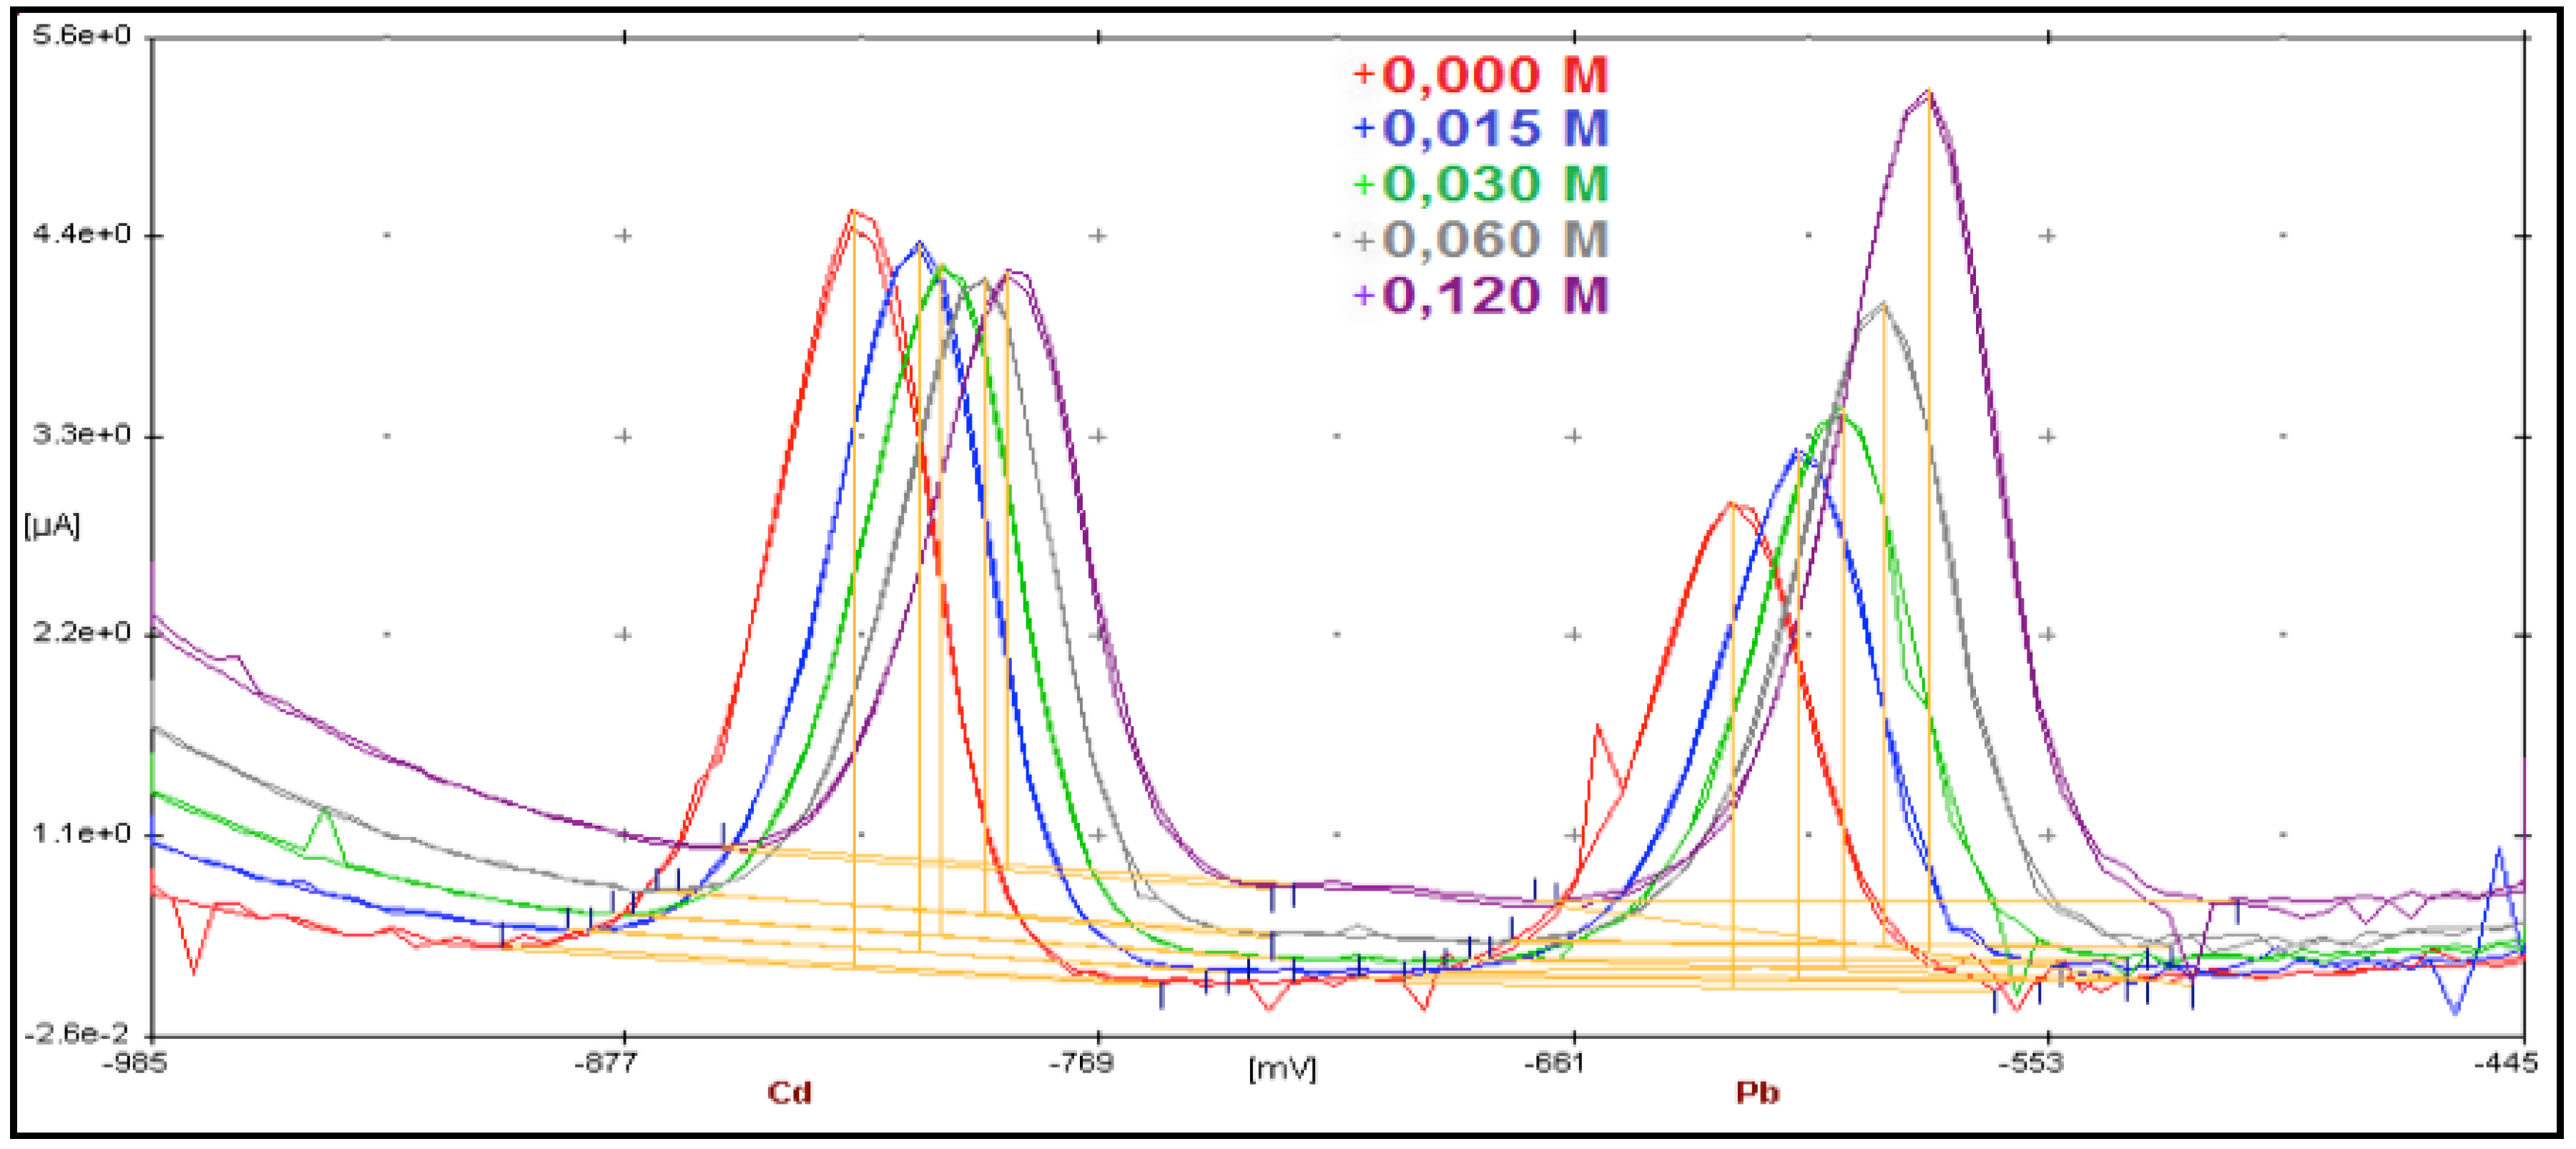
3.1. From Batch to Stopped-Flow Differential Pulse Stripping Voltammetry

One the most critical aspects of screen-printed electrodes is the intrinsic pseudo-reference character of the silver electrode, since potentials are dependent on the halide activity in the analyte solution. The Cd and Pb signals in batch stripping analysis on a water solution of around pH = 2 with HCl were compared using either the internal silver electrode of the screen-printed electrode or an external 3 M KCl Ag/AgCl electrode. This was made possible thanks to the versatility of the AMEL batch cell, which allows both reference electrodes to be used and easily selected. A signal shift of about 150 mV towards more negative potential is observed using the internal Ag electrode of the SPE, in agreement with a quasi-Nernstian behavior. A more detailed investigation of the SPE at different chloride ion activities is shown in Figure 4. The red trace is the blank solution, with following additions of 5 μg/L each of Cd and Pb standard solution.
Interestingly, the potential shift with changing chloride ion activity is accompanied by a change in the analytical sensitivity of Cd and Pb in particular. This observation is not unexpected, because of the different speciation chemistry of the two metals. However, two important consequences can be seen. On one side, deposition potentials always have to be corrected for the actual chloride activity; on the other side, the chloride concentration has to be taken as constant during all calibration and quantitation steps.
The analytical behavior of the stripping analysis of cadmium and lead between 0 and 15 μg/L was compared between batch (Figure 5A) and stopped-flow conditions (Figure 5B).
It is immediately evidenced that the intensity of the stripping signals is similar within a factor of 2 in the batch and flow cells, indicating that the efficiency of mass transfer to the working electrode is similar in both cases. However, the use of the flow cell leads to a higher noise contribution, although its typical spike appearance may be removed by moving median filtering followed by low-order Savitsky–Golay smoothing [19]. Both features are already integrated into the VApeak software and can be performed automatically, if necessary. Accordingly, the analytical figures of merit calculated for the two calibration curves (Table 1) show that the sensitivity and intercepts are quite similar, whereas limits of detection and of quantitation are lower for the batch cell. Interestingly, the LODs for Pb and Cd in the batch cell are well under 0.1 μg/L, approaching those classically reported for mercury-film-coated glassy carbon electrodes; the advantages of SPEs in terms of cost and versatility are now fully demonstrated.
This difference in the analytical sensitivities between batch and stopped-flow conditions can likely be ascribed to restricted diffusion inside the low-volume flow cell, since the speciation chemistry is kept unchanged. However, it is harmless for analytical purposes, provided that the fluidodynamic conditions are kept constant and reproducible.
An important point to be investigated relating to screen-printed electrodes under stirred or flow conditions is the repeatability between different electrodes and the durability of the active electrode surfaces. A comparison among three different screen-printed electrodes shows how the standard deviations for the analytical sensitivity are always below 10% for both analytes.
The durability of the electrode was then investigated by repeating standard calibration analysis. The analytical sensitivity slowly decreases with the increasing number of analysis rounds, reaching a 10% decrease from the initial value after 150 analyses for Cd and over 200 analyses for Pb. After 200 analyses, the electrode surface is significantly modified, which is particularly evident for the working and counter electrodes (Figure 6).
The degradation of the counter electrode was not found to be relevant, since the use of an external glassy carbon electrode as counter did not improve analytical figures of merit. Consequently, the degradation of the analytical sensitivity with increasing analysis number is to be attributed to surface modifications of the working electrode only.
The main difference between batch and flow techniques is the methodology used for the quantitative analysis. Under batch conditions, quantitation is well known to be easily done via standard additions, and no further investigation has been done. Accordingly, acidified tap water samples from the town of Como were analyzed after being spiked at 5 μg/L; recoveries in the 95–105% range were found for both lead and cadmium.
Under flow conditions, instead, standard addition is quite clumsy to perform and almost impossible if a continuous flow of sample is analyzed for automated decentralized analysis. External calibration was then found to be particularly suited for stopped-flow stripping, either for the simplicity of changing standards and samples or for the reproducibility that is guaranteed by the instrumental setup. The VApeak software was particularly efficient in this respect since it has a dedicated section for external calibration in stripping analysis.
The calibration under stopped flow was performed with five standards of Pb and Cd between 0 and 25 μg/L. A series of synthetic water samples was then analyzed; results are shown in Table 2.
The samples were analyzed in random order to avoid error accumulation. It is noteworthy that all samples analyzed are within a maximum error of 10%, with deviations from certified values mostly in the ±3% level. The analytical reproducibility was always found to remain in this range.
This result is quite important in light of decentralizing SPE-based techniques in the field, such as for continuous monitoring of real streams, where addition of standards is really unpractical.

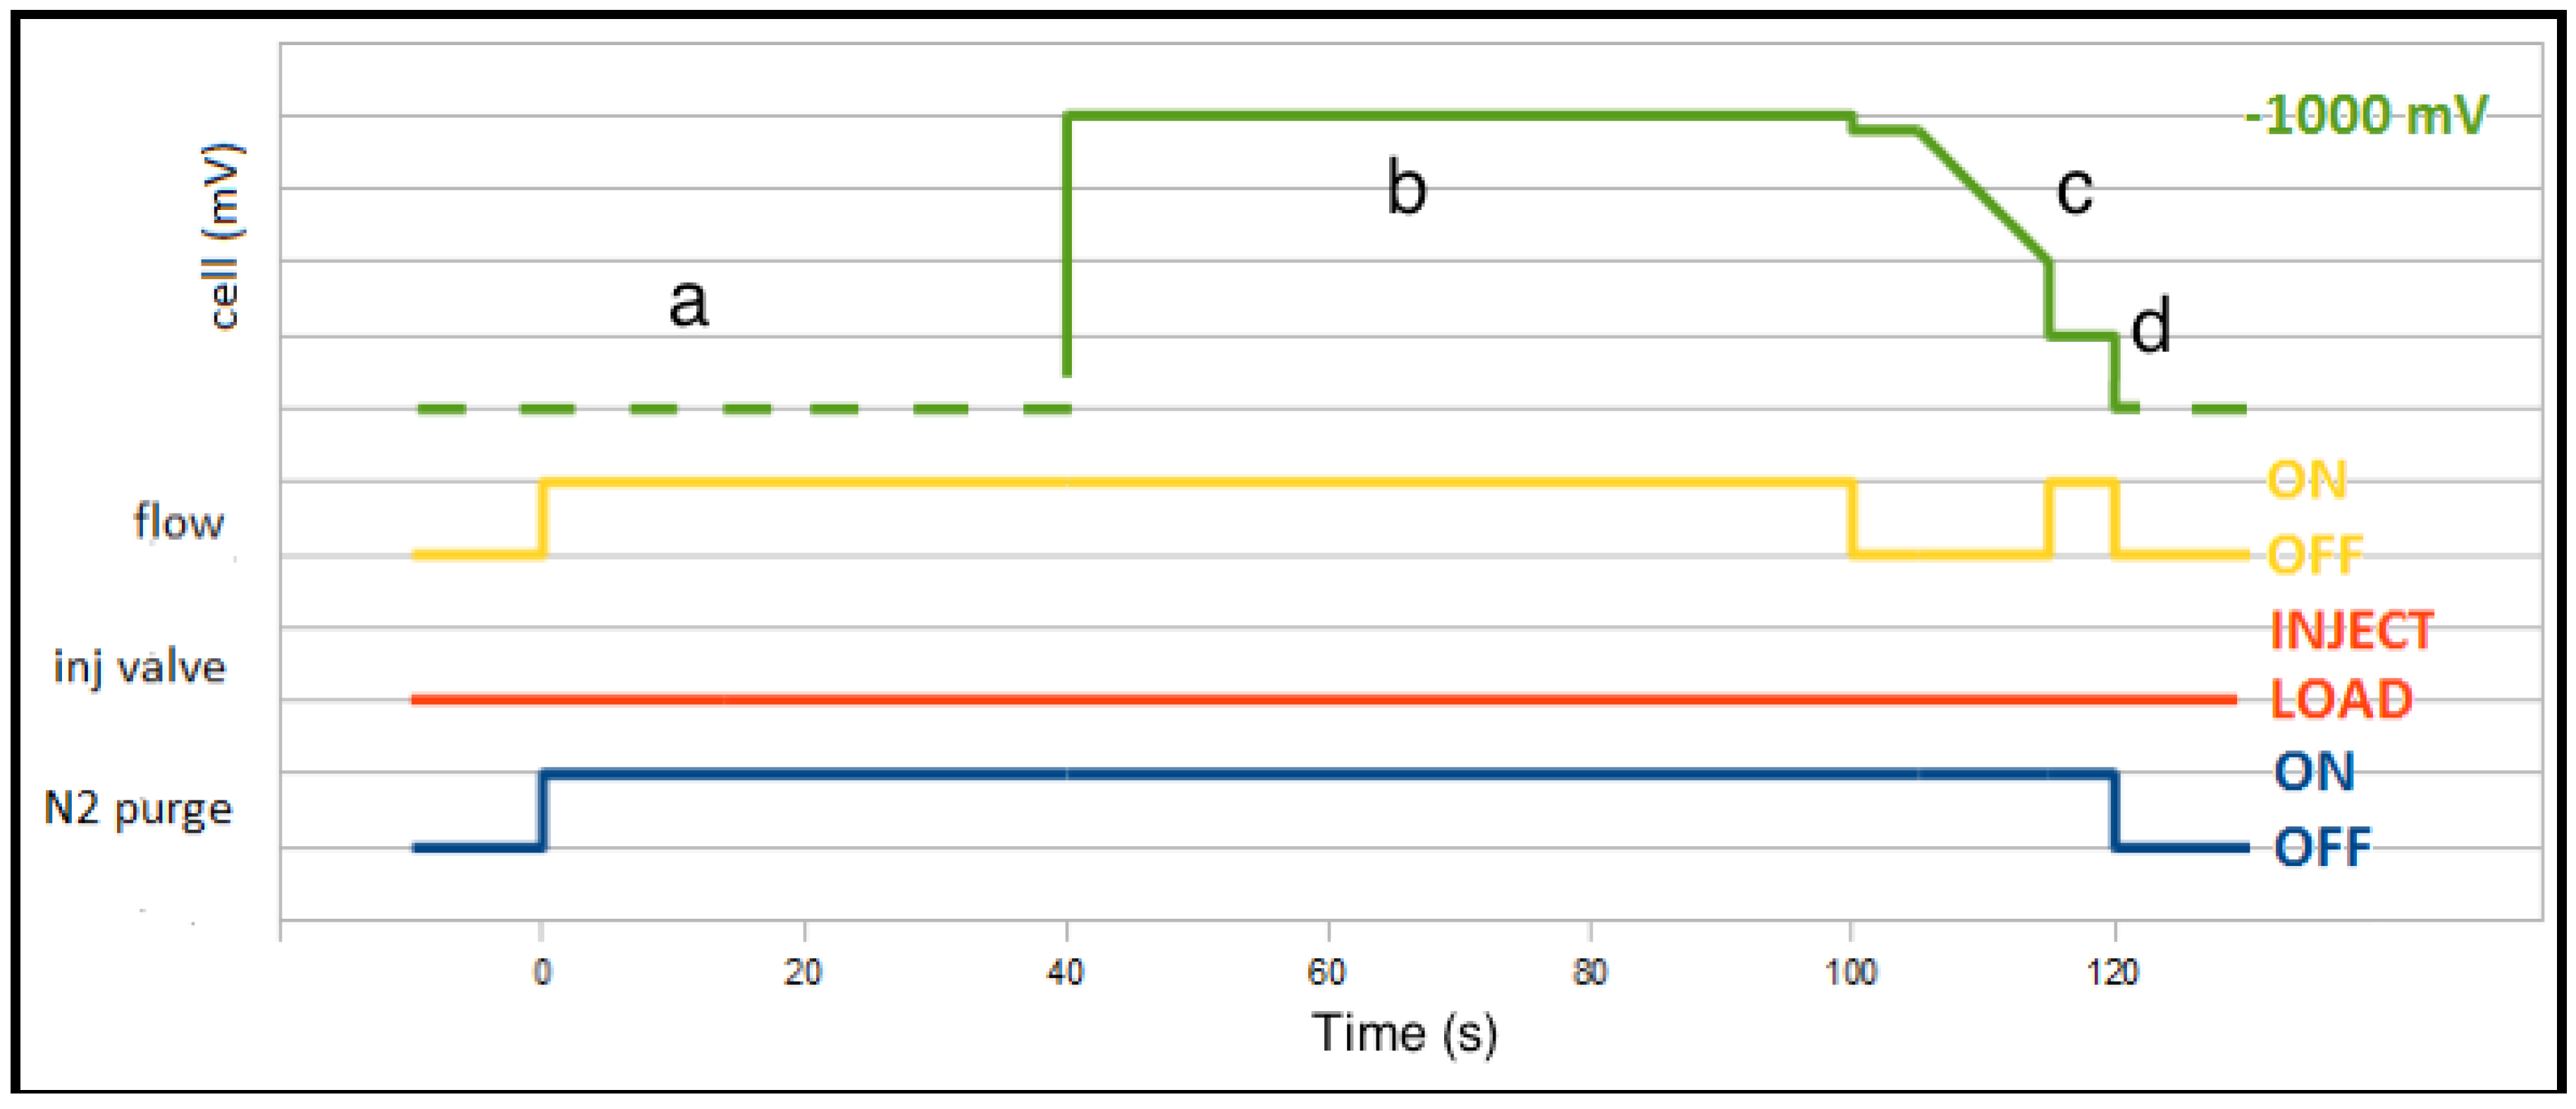
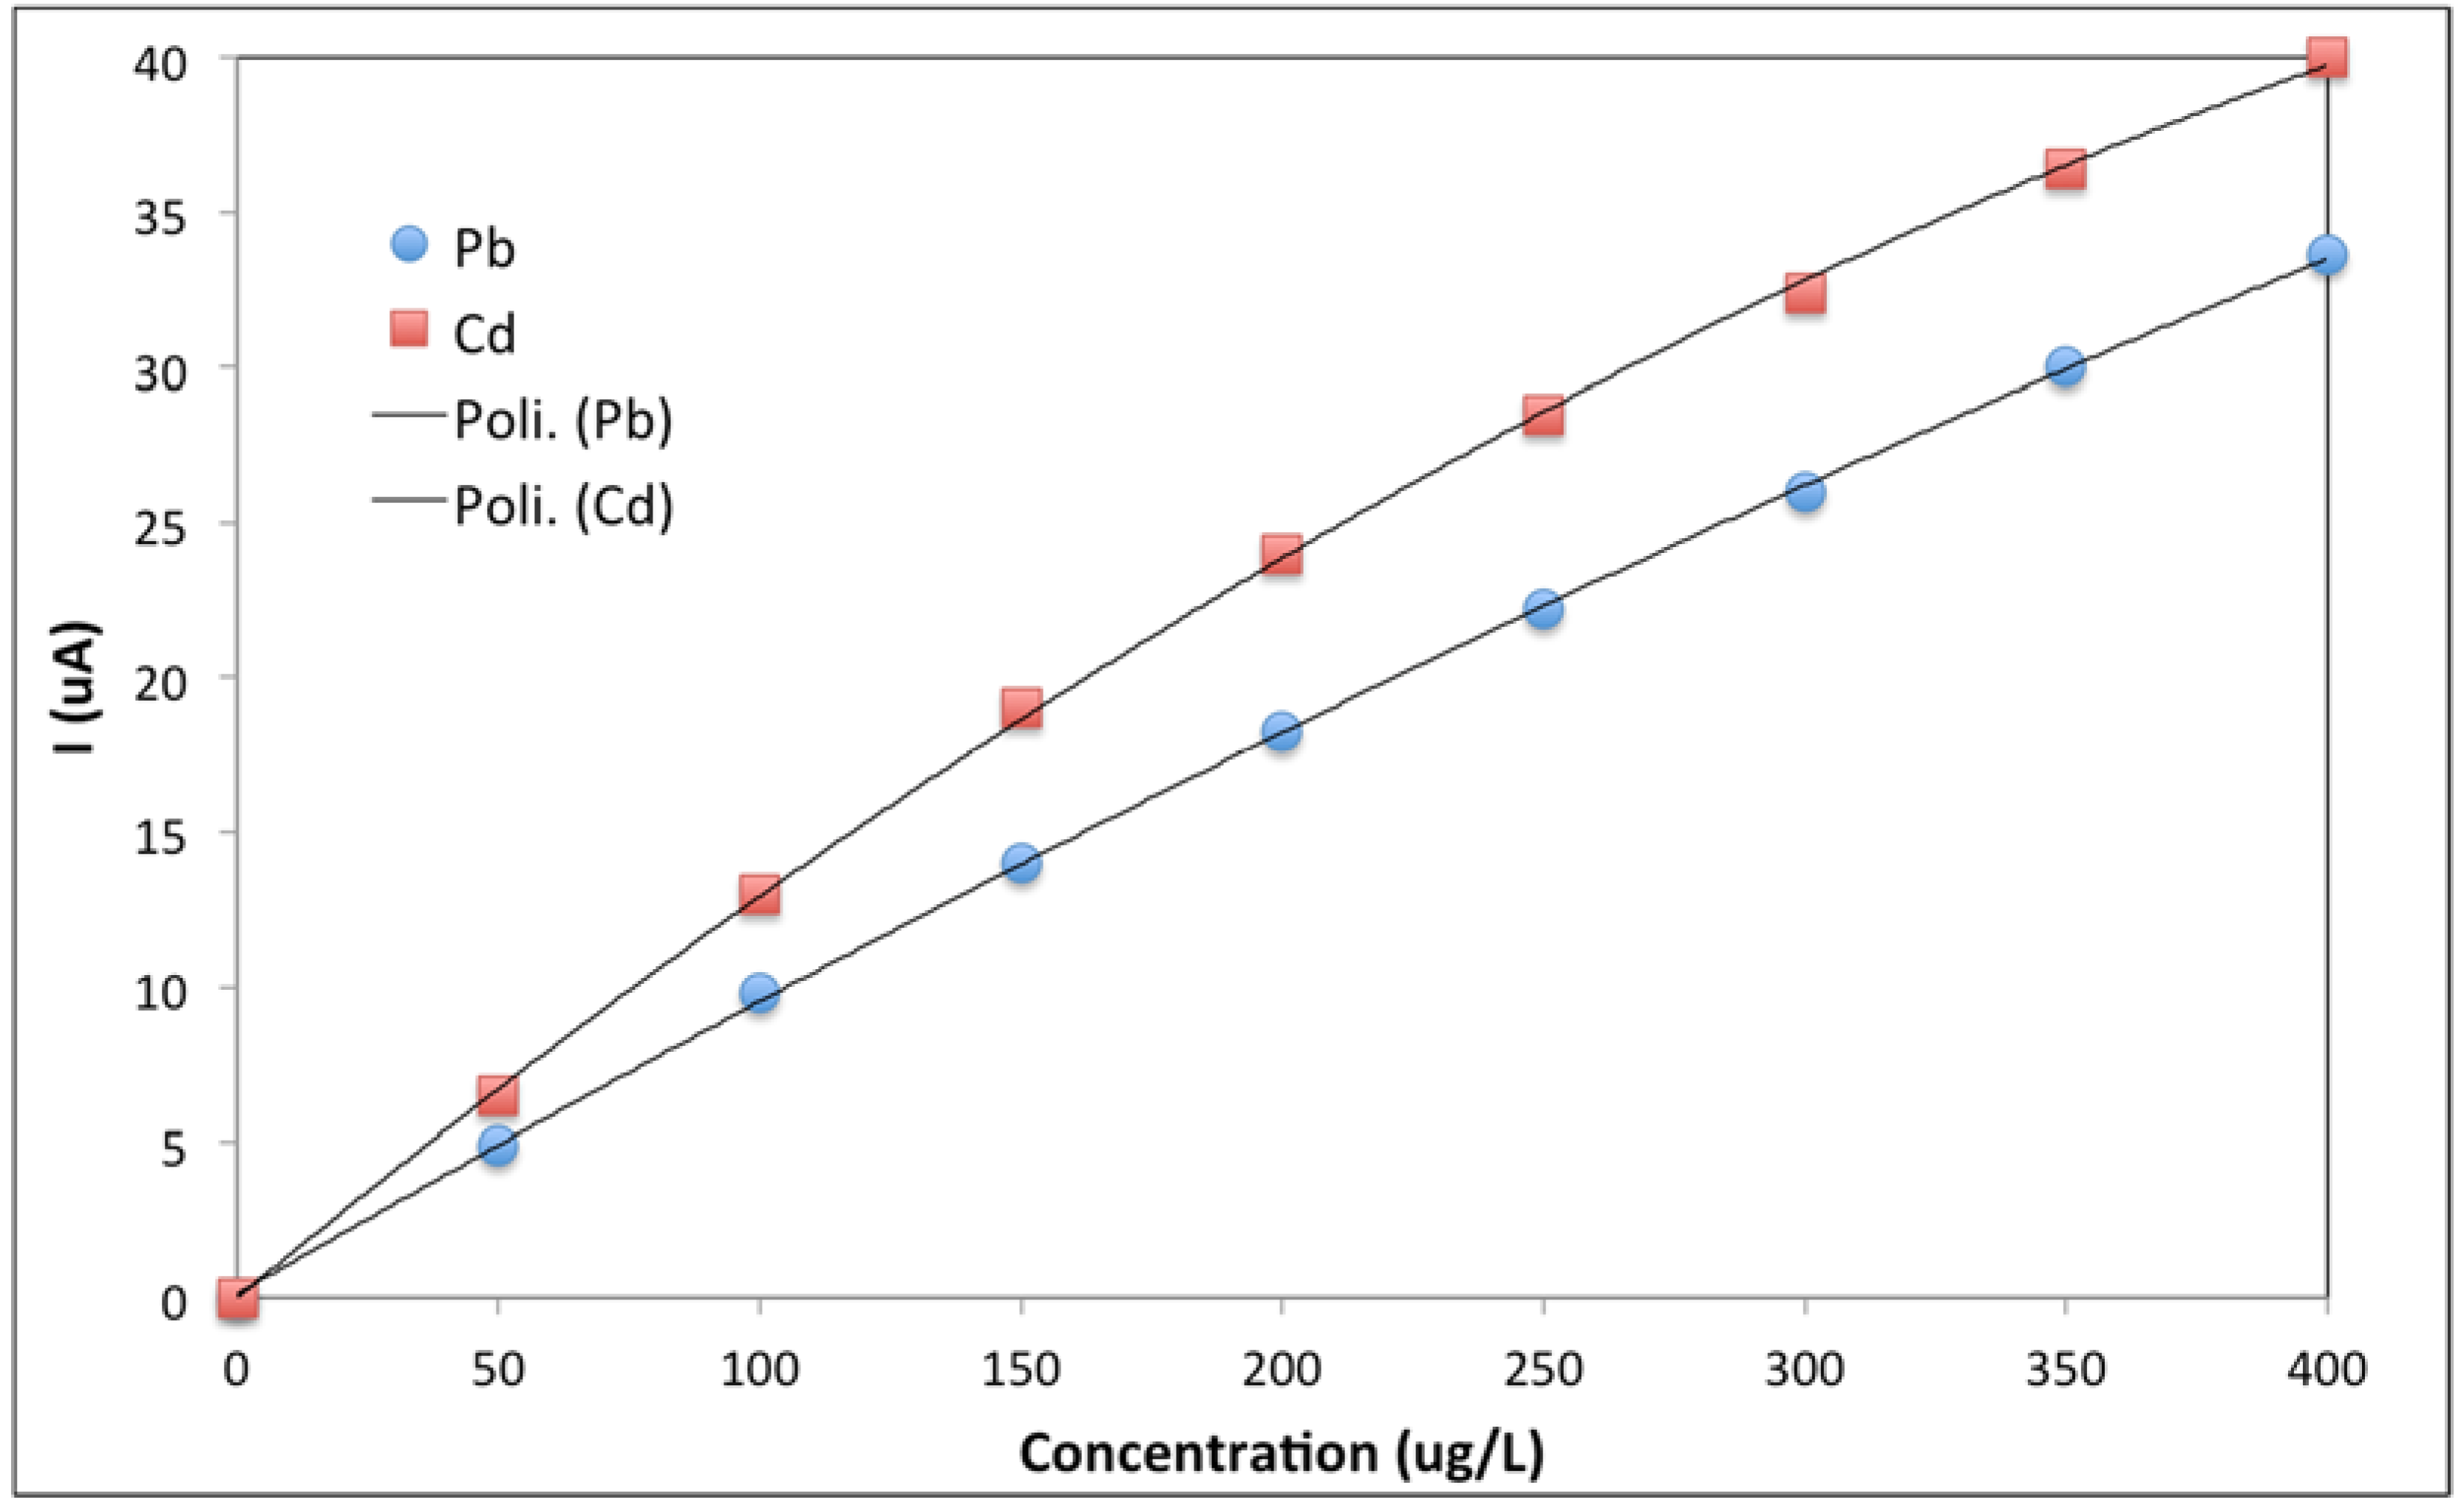
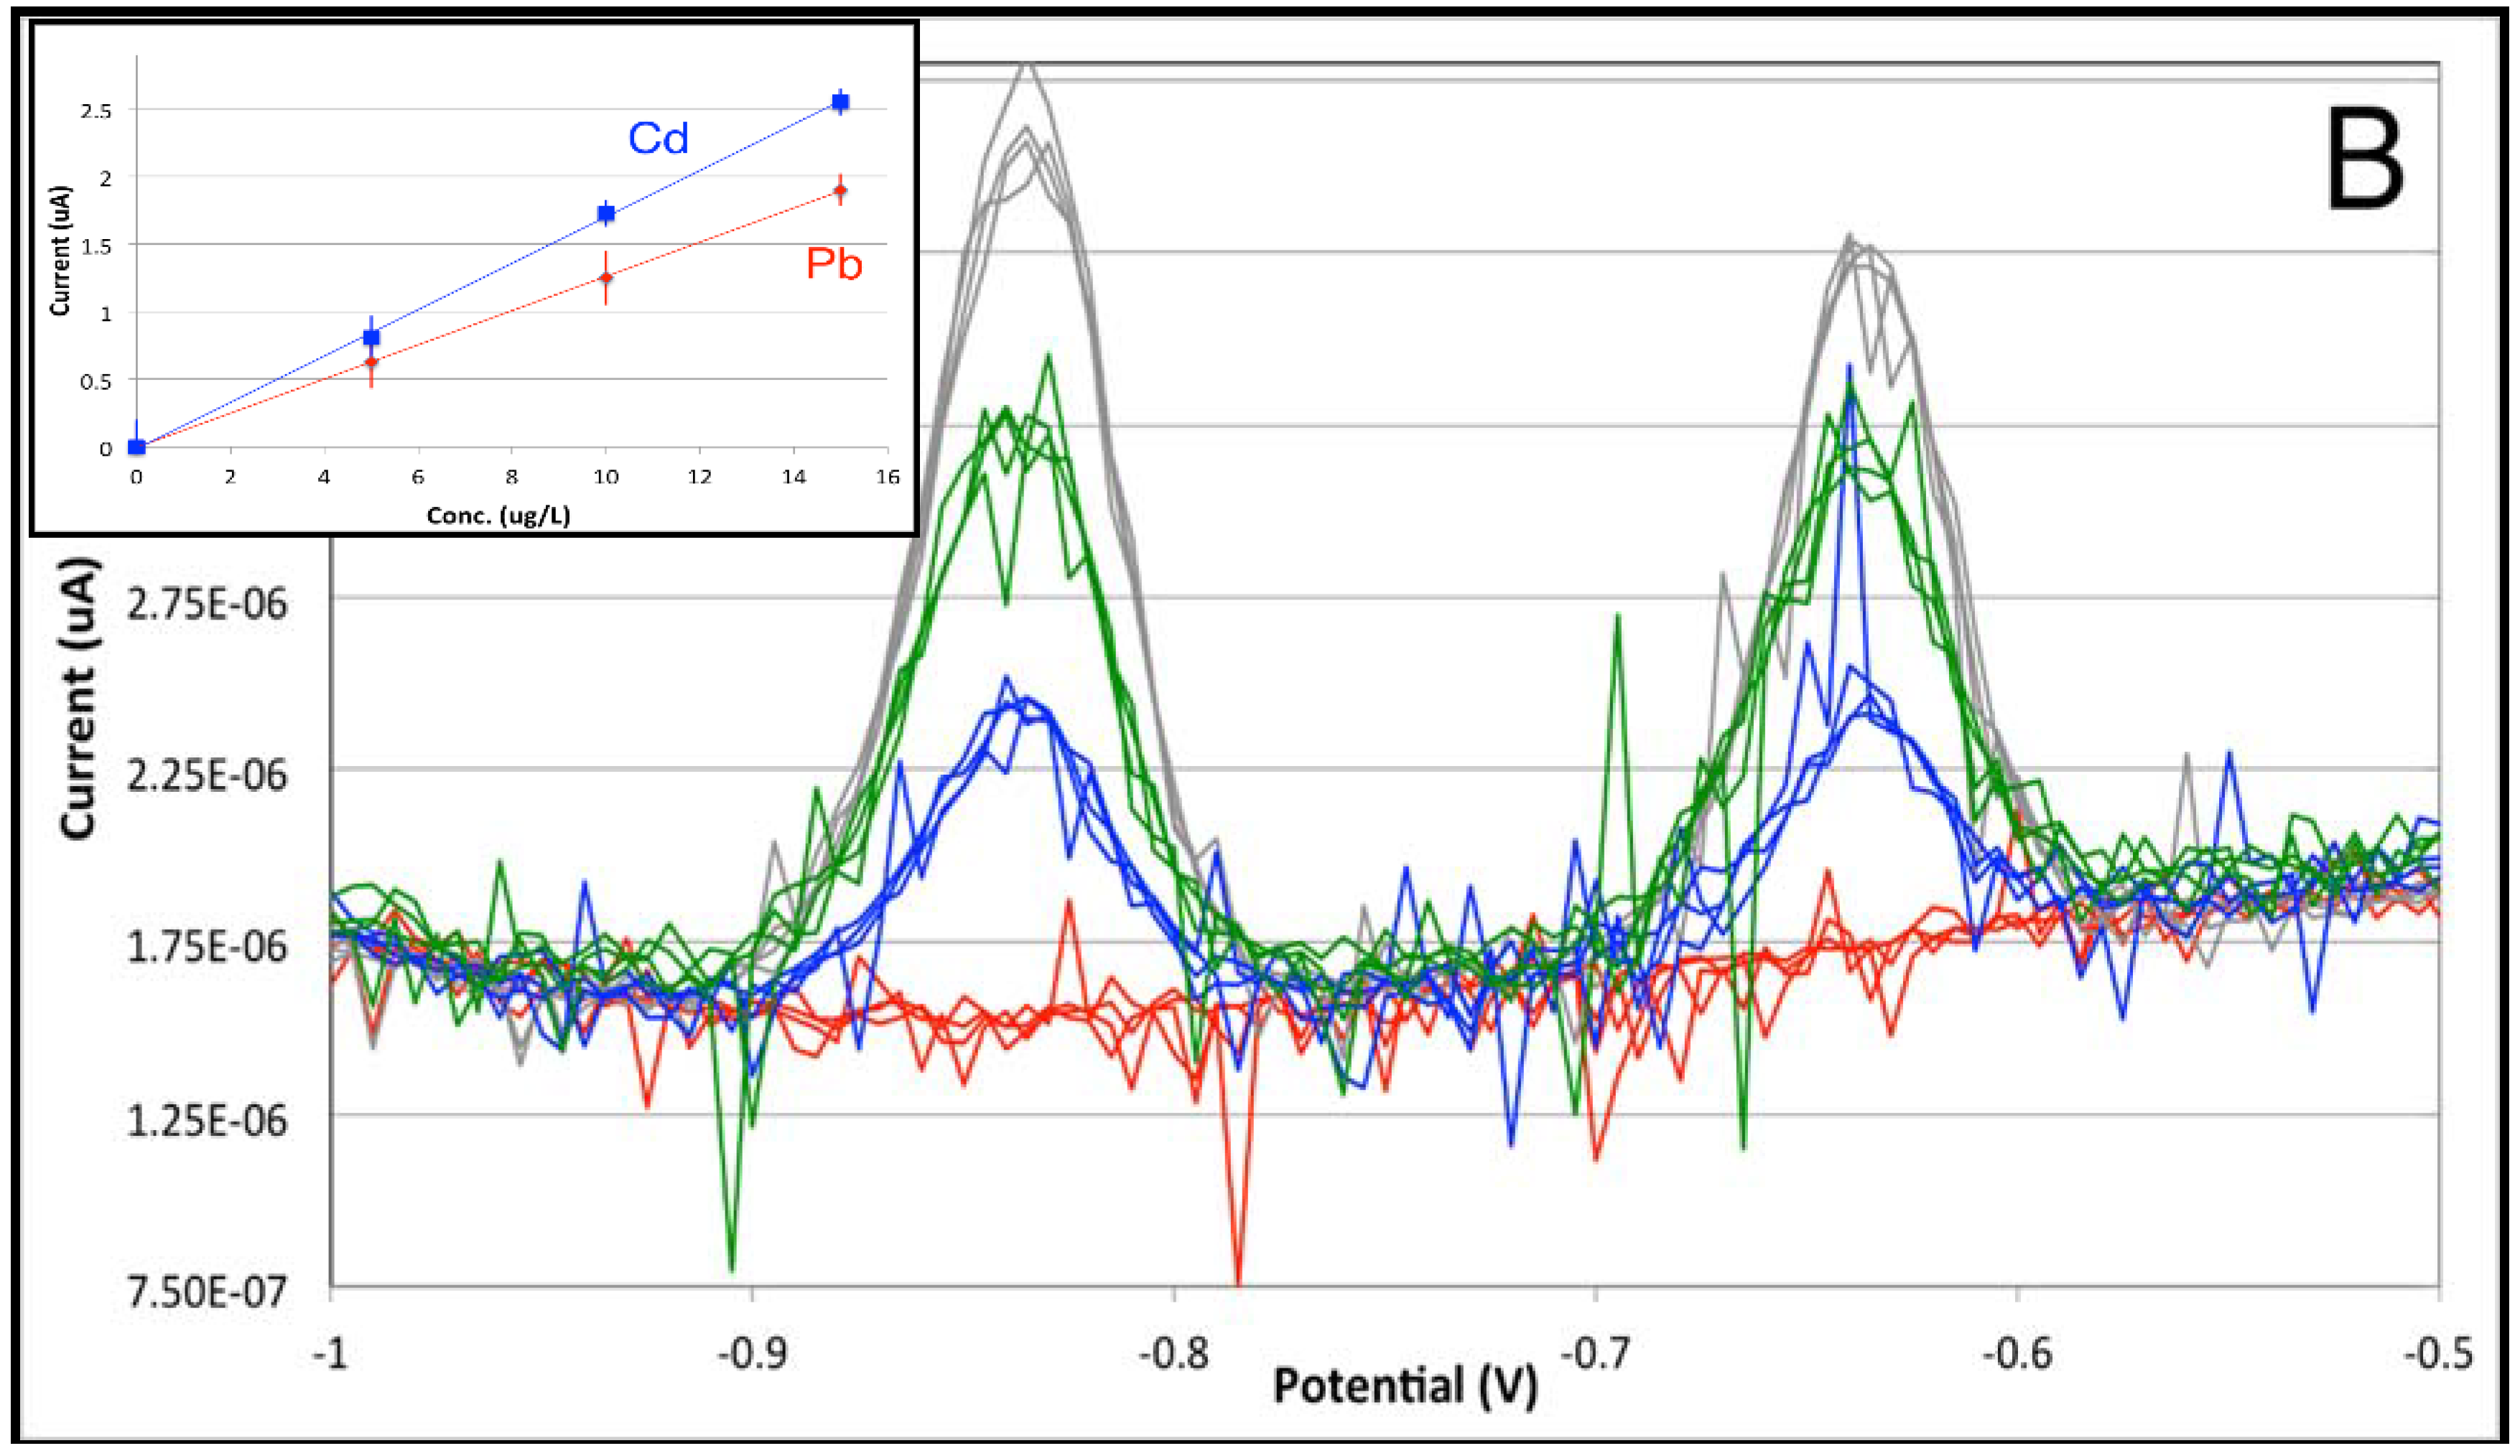
3.2. From Stopped-Flow to Flow Injection Analysis in Differential Pulse Stripping Voltammetry

The major disadvantage of stopped-flow operations in stripping voltammetry is the noise occurring during the redissolution step. The source of this noise is likely to be ascribed to two major causes, one being related to bubble formation on the electrode surface and the other to the low volume of the wall-jet cell. However, the use of flow injection during the deposition step has been proposed to improve both noise and analytical reproducibility in flow stripping analysis [16]. Our instrumental setup was then devised in order to make a direct comparison between stopped-flow and flow injection conditions for stripping voltammetry. The shape and the reproducibility of injection peaks werre investigated using ferricyanide reduction as model reaction under amperometric detection (Figure 7).
In accordance with a low-dispersion system, the FIA peaks showed rectangular shapes with fast recovery to baseline [20]. The injection peak is considered terminated within 100 s without any carryover. This is important for calculating the correct timing for stripping steps in FIA-SV. Moreover, reproducibility between consecutive injections was found to be excellent.
The analytical redissolution step was then performed under identical fluidic conditions, under quiescent solution in the cell: the sample for stopped flow, or pure electrolyte for flow injection. A preliminary investigation of flow-injection stripping voltammetry of Pb and Cd between 0 and 25 μg/L was very indicative of the correct implementation of the fluidic setup, giving good linearity and a relatively low background noise level. A comparison of the analytical performance between SF-SV and FIA-SV was done on a synthetic water sample at a Pb and Cd concentration of 15 μg/L (Figure 8).
It is immediately evident that the flow injection analysis shows significantly lower noise than does stopped-flow analysis. A simplistic view of noise arising from microbubble formation at the electrode surface should therefore be discarded. It appears plausible that the noise is related to the presence of the sample inside the low-volume flow cell, maybe influencing the ideal diffusion control of Pb and Cd re-dissolving into the solution. In any case, the stopped-flow technique will always be very sensitive to the sample matrix. Consequently, flow injection stripping voltammetry will be the technique of choice particularly with complex matrix samples, since the analytical step is always done in pure eluent solution.
A detailed investigation of the analytical figures of merit was then undertaken, with particular emphasis on the analytical sensibility for inter-electrode reproducibility and limits of detection (Table 3).
The analytical sensitivities are lower than those found in stopped flow. In flow injection stripping, the preconcentration step is, in fact, related not to the deposition time, as in conventional batch or stopped-flow stripping, but to the loop volume, which is injected during the preconcentration step. The duration of the preconcentration step is, therefore, not related to the desired enrichment of the analytes at the mercury electrode, but has to be selected in order to have the injected peaks returning to baseline before starting the analytical step of analyte redissolution. The sensitivity in this approach is easily increased by changing the loop volume as desired, and setting the preconcentration time as a function of peak duration.
Apparently, there are few problems of saturation of the mercury film. The linearity in the calibration curves for both Pb and Cd is excellent, with LOL values up to 100 μg/L; the curves then tend to bend at higher concentrations, as can be expected (Figure 9).
Quantitative analysis results were studied via external calibration within the limit of linearity of 100 μg/L. Provided that samples and standards shared the same matrix, results were found to be similar to those reported for the stopped-flow stripping voltammetry. Analytical results for three acidified tap water samples spiked at 5 μg/L with lead and cadmium are summarized in Table 4. Similar conclusions were reported in a recent investigation [16].
However, it can already be estimated visually from Figure 9 that calibration curves for both Pb and Cd can be easily fitted by second-order polynomials. Quantitation is, thus, possible up to concentration levels around a few hundreds of μg/L by exploiting the nonlinear calibration curve. This result will widen the application of flow injection stripping voltammetry since sample pretreatment and/or dilution is often unpractical for in situ analysis under a decentralized approach.
The limits of detection were calculated following IUPAC guidelines; values around 0.35 μg/L for Pb for Cd were found, which are similar to those found for the stopped-flow technique. A simple increase of the injected loop volume will immediately result in a decrease of the detection limits without any adverse effect thanks to the extended linearity of the flow injection technique.

4. Conclusions

Screen-printed electrodes have been demonstrated to play an increasing role in ultratrace inorganic chemistry, as already observed for organic analysis [15]. These results have been linked to a careful control of matrix chemistry, chloride ion activity in particular, and to the recent development of batch and flow cells for optimized hydrodynamic conditions during the preconcentration steps. Main results for batch, stopped-flow, and flow injection analysis are summarized in Table 5.
Batch analysis still shows the best analytical figures of merit, particularly in terms of sensitivity and limits of detection. Flow cells are, however, rapidly filling the gap; flow injection is confirmed to be superior to stopped flow, both in terms of signal-to-noise ratio and sample consumption. Moreover, sample throughput is significantly increased in flow cells since external calibration can be used as the preferred method of quantitation with respect to standard addition.
Finally, the feasibility of using nonlinear calibration procedures for flow injection stripping voltammetry will open new and unexplored possibilities in screen-printed electrode/flow injection stripping voltammetry for in situ decentralized analysis in industrial environments. Provisions for mercury substitution in real working conditions are under investigation, as well as hardware and software developments to fulfill all analytical needs for decentralization.

Author Contributions

Conceptualization, C.D., D.M., A.P. and S.R.; Writing—original draft, C.D.

Funding

Research was funded by Fondo di Ateneo per la Ricerca (FAR)—Università degli Studi dell’Insubria.

Acknowledgments

Fabio Stropeni is gratefully acknowledged for his chemical expertise and for performing the laboratory experiments. The authors also wish to thank Bruno Giacomel and Flavio Villa of AMEL srl (Milano, Italy) for the electrochemical instrumentation and joint project collaboration, and PierPaolo Protti for scientific discussions.

Conflicts of Interest

The authors declare no conflict of interest.

References

  1. Ochsenkühn-Petropoulou, M.; Ochsenkühn, K.M. Comparison of inductively coupled plasma-atomic emission spectrometry, anodic stripping voltammetry and instrumental neutron-activation analysis for the determination of heavy metals in airborne particulate matter. Fres. J. Anal. Chem. 2001, 369, 629–632. [Google Scholar] [CrossRef]
  2. Wang, J. Analytical Electrochemistry, 3rd ed.; Wiley: Hoboken, NJ, USA, 2006. [Google Scholar]
  3. Ozkan, S.A. Principles and Techniques of Electroanalytical Stripping Methods for Pharmaceutically Active Compounds in Dosage Forms and Biological Samples. Curr. Pharm. Anal. 2009, 5, 127–143. [Google Scholar] [CrossRef]
  4. Economou, A.; Fielden, P.R. Applications, potentialities and limitations of adsorptive stripping analysis on mercury film electrodes. Trends Anal. Chem. 1997, 16, 286–292. [Google Scholar] [CrossRef]
  5. Wang, J. Decentralized Electrochemical Monitoring of Trace Metals: From Disposable Strips to Remote Electrodes. Analyst 1994, 119, 763–766. [Google Scholar] [CrossRef]
  6. Arduini, F.; Amine, A.; Moscone, D.; Ricci, F.; Palleschi, G. Fast, sensitive and cost-effective detection of nerve agents in the gas phase using a portable instrument and an electrochemical biosensor. Anal. Bioanal. Chem. 2007, 388, 1049–1057. [Google Scholar] [CrossRef] [PubMed]
  7. Arduini, F.; Cassisi, A.; Amine, A.; Ricci, F.; Moscone, D.; Palleschi, G. Electrocatalytic oxidation of thiocholine at chemically modified cobalt hexacyanoferrate screen-printed electrodes. J. Electroanal. Chem. 2009, 626, 66–74. [Google Scholar] [CrossRef]
  8. Palchetti, I.; Laschi, S.; Mascini, M. Miniaturised stripping-based carbon modified sensor for in field analysis of heavy metals. Anal. Chim. Acta 2005, 530, 61–67. [Google Scholar] [CrossRef]
  9. Gomez, V.S.; Barcelò, C.; Serrano, N.; Esteban, M. Antimony film screen-printed carbon electrode for stripping analysis of Cd(II), Pb(II), and Cu(II) in natural sample. Anal. Chim. Acta 2015, 855, 34–40. [Google Scholar]
  10. Hoĉevar, S.B.; Ogorevc, B.; Wang, J.; Pihlar, B. A Study on Operational Parameters for Advanced Use of Bismuth Film Electrode in Anodic Stripping Voltammetry. Electroanalysis 2002, 14, 1707–1712. [Google Scholar] [CrossRef]
  11. Romanus, A.; Mueller, H.; Kirsch, D. Application of adsorptive stripping voltammetry (AdSV) for the analysis of trace metals in brine. Fresenius J. Anal. Chem. 1991, 340, 371–376. [Google Scholar] [CrossRef]
  12. Economou, A. Recent developments in on-line electrochemical stripping analysis—An overview of the last 12 years. Anal. Chim. Acta 2010, 683, 38–51. [Google Scholar] [CrossRef] [PubMed]
  13. Honeychurch, K.C. Screen-printed electrochemical sensors and biosensors for monitoring metal pollutants. Sci. J. 2012, 2, 1–51. [Google Scholar] [CrossRef]
  14. Guell, R.; Fontas, C.; Aragay, G.; Merkoci, A.; Antico, E. Screen-printed electrodes incorporated in a flow system for the decentralized monitoring of lead, cadmium and copper in natural and wastewater samples. Int. J. Environ. Anal. Chem. 2012, 93, 1–12. [Google Scholar] [CrossRef]
  15. Mozo, J.D.; Carbajo, J.; Sturm, J.C.; Nunez-Vergara, L.J.; Salgado, P.; Squella, J.A. Determination of Nifuroxazide by flow injection linear adsorptive stripping voltammetry on a screen-printed carbon nanofiber modified electrode. Electroanalysis 2010, 24, 676–682. [Google Scholar] [CrossRef]
  16. Dossi, C.; Stropeni, F.; Monticelli, D. Screen Printed Electrode-flow stripping voltammetry for inorganic analysis. In Sensors-Lecture Notes in Electrical Engineering; Compagnone, D., Baldini, F., Di Natale, C., Betta, G., Siciliano, P., Eds.; Springer: Berlin, Germany, 2015; Chapter 25; Volume 319. [Google Scholar]
  17. Pizeta, I.; Omanovic, D.; Branica, M. The influence of data treatment on the interpretation of experimental results in voltammetry. Anal. Chim. Acta 1999, 401, 163–172. [Google Scholar] [CrossRef] [Green Version]
  18. Mocak, J.; Bond, A.M.; Mitchell, S.; Schollary, G. A statistical overview of standard (IUPAC and ACS) and new procedures for determining the limits of detection and quantification: Application to voltammetric and stripping techniques. IUPAC Technical Report 1997. Pure Appl. Chem. 1997, 69, 297–328. [Google Scholar] [CrossRef]
  19. Jakubowska, M.; Piech, R.; Dzierwa, T.; Wcislo, J.; Kubiak, W.W. The evaluation method of smoothing algorithms in voltammetry. Electroanalysis 2003, 15, 1729–1736. [Google Scholar] [CrossRef]
  20. Margoshes, M.; Burns, D.A. Treatise on Analytical Chemistry, Part 1-Theory and Practice, 2nd ed.; Elving, P.J., Mossotti, E.V.G., Kolthoff, I.K., Eds.; Wiley: New York, NY, USA, 1984; Volume 4, p. 413. [Google Scholar]
Figure 1. (A) The batch cell with screen-printed electrode (SPE) (A-1); (B) The assembled cell on an Amel4330 instrument: SPE cable connector (B-1); palette top stirrer (B-2); external electrodes (B-3).
Chemosensors 06 00037 g001
Figure 2. Instrumental scheme of the flow system to perform voltammetric stripping analyses under stopped-flow (SF-SV) or under flow injection analysis (FIA-SV).
Chemosensors 06 00037 g002
Figure 3. Timing diagram of stopped-flow operation in the stripping voltammetric analysis of Pb and Cd. Steps: (a) optional preanalysis degassing under open-cell condition; (b) preconcentration; (c) stripping analysis; (d) cleaning. Lines: Green, solid line: applied cell potential; Green, dashed line: open-cell conditions, with no current flowing. Yellow: sample flow; Red: injection valve position; Blue: N2 purge.
Chemosensors 06 00037 g003
Figure 4. Stripping analysis of Pb and Cd at 15 μg/L at pH = 2 and chloride ion activity of 10−2 M. Effect of the addition of chloride ions on stripping signals using the internal pseudo-reference Ag electrode.
Chemosensors 06 00037 g004
Figure 5. Comparison of stripping analysis signals of Pb and Cd between 0 and 15 μg/L with a preconcentration time of 60 s. (A) Using batch cell; (B) using stopped-flow conditions. Inset: Calibration lines for Cd (in blue) and Pb (in red). Reference electrode: internal pseudo-reference.
Chemosensors 06 00037 g005aChemosensors 06 00037 g005b
Figure 6. Optical microscopy pictures of the surface of the screen-printed electrode before (left) and after (right) performing 200 stripping voltammetric analyses. Experimental conditions as in Figure 4.
Chemosensors 06 00037 g006
Figure 7. Shape and reproducibility of consecutive flow injection analyses in potassium ferricyanide reduction at 0 mV as model reaction.
Chemosensors 06 00037 g007
Figure 8. Comparison of analytical signals of Pb and Cd at 15 μg/L obtained in stopped-flow (SF-SV red trace) and in flow injection (FIA-SV blue trace) stripping voltammetry.
Chemosensors 06 00037 g008
Figure 9. Calibration curves in flow injection analysis stripping voltammetry for Pb and Cd between 0 and 400 μg/L. Discrete points: experimental data; black lines: second-order polynomial interpolating curves.
Chemosensors 06 00037 g009
Table 1. Figures of merit of Cd and Pb analysis under differential pulse stripping voltammetry. Comparison between batch and stopped-flow conditions.
Cell TypeFigure of MeritCdPb
BatchSensitivity (μA × L × μg−1)0.28310.1681
Intercept (μA)−0.3060.098
Limit of Detection (μg/L)0.170.19
Limit of Quantitation (μg/L)0.580.64
Stopped-FlowSensitivity (μA × L × μg−1)0.16350.1202
Intercept (μA)0.1890.279
Limit of Detection (μg/L)0.580.62
Limit of Quantitation (μg/L)1.982.06
Table 2. Reference sample analyses in stopped-flow stripping voltammetry with external calibration. Flow = 1.0 mL/min; Preconcentration time = 60 s.
AnalytePeak Height (μA)Calculated Concentration (μg/L)Expected Concentration (μg/L)% Recovery
Cd2.444915.2815102%
0.84635.115105%
4.375327.5625110%
3.304120.7520103%
1.59459.871099%
Pb1.985714.491596%
0.66574.57591%
3.479425.7225103%
2.680719.722098%
1.35329.741097%
Table 3. Reproducibility and figures of merit of Cd and Pb analysis under flow-injection analysis differential pulse stripping voltammetry.
Measure TypeFigure of MeritCdPb
Electrode 1Sensitivity (μA × L × μg−1)0.13820.09095
Intercept (μA)−0.1854−0.0936
Electrode 2Sensitivity (μA × L × μg−1)0.13630.08795
Intercept (μA)−0.3284−0.1461
Electrode 3Sensitivity (μA × L × μg−1)0.13350.09007
Intercept (μA)−0.450−0.1820
Mean result of three electrodesLimit of Detection (μg/L)0.320.35
Limit of Quantitation (μg/L)1.061.08
Table 4. Stripping analysis of Cd and Pb under flow-injection analysis differential pulse stripping voltammetry on spiked samples at 5 μg/L with lead and cadmium.
CdPb
Found (μg/L)%RecoveryFound (μg/L)%Recovery
Sample 14.8096%4.99100%
Sample 24.5190%4.6092%
Sample 34.8897%4.8196%
Table 5. Analytical figures of merit for stripping analysis of Cd and Pb under different conditions.
BatchStopped FlowFlow Injection Analysis
CdPbCdPbCdPb
Sensitivity (μA × L × μg−1)0.28310.16810.16350.12020.13810.0909
Limit of Detection (μg/L)0.170.190.580.620.320.35
Analytical Errors<5%<5%<10%<10% <10%<10%
Analysis Time a175 s175 s220 s
Sample Volume10–25 mL1–2 mL0.5 mL (loop volume)
a preconcentration time: 60 s for batch and stopped flow; 110 s at 0.5 mL loop for flow injection analysis.

