

Potentiometric Phosphate Ion Sensor Based on Electrochemically Modified All-Solid-State Copper Electrode for Phosphate Ions’ Detection in Real Water

Abstract
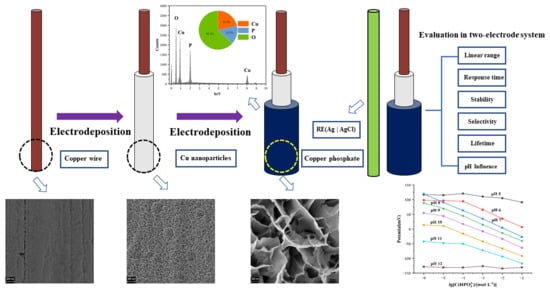
:
1. Introduction
2. Materials and Methods
2.1. Reagents and Apparatus
2.2. Electrode Pretreatment and Fabrication
2.3. Electrode Performance Characterization
3. Results and Discussion
3.1. Electrochemical Characteristics of the Copper Electrode Modified with a Copper Nanoparticle Film in a Na2HPO4 Solution
3.2. SEM and EDS Analysis of the Copper Phosphate Electrode
3.3. Response Characteristics of the Copper Phosphate Electrode
3.3.1. Response Slope, Detection Linear Range, Detection Limit and Reproducibility
3.3.2. Response Time
3.3.3. Electrode Stability and Lifetime
3.3.4. Electrode Selectivity
3.3.5. pH Interference on the Phosphate Ions’ Measurement
3.3.6. Analysis of Real Samples
3.3.7. Comparison of the Copper Phosphate Electrode and Previously Reported Electrodes
4. Conclusions
Author Contributions
Funding
Institutional Review Board Statement
Informed Consent Statement
Data Availability Statement
Conflicts of Interest
References
- Conley, D.J.; Paerl, H.W.; Howarth, R.W.; Boesch, D.F.; Seitzinger, S.P.; Havens, K.E.; Lancelot, C.; Likens, G.E. ECOLOGY Controlling Eutrophication: Nitrogen and Phosphorus. Science 2009, 323, 1014–1015. [Google Scholar] [CrossRef]
- Lan, Y.B.; Gai, S.; Cheng, K.; Yang, F. Advances in biomass thermochemical conversion on phosphorus recovery: Water eutrophication prevention and remediation. Environ. Sci. Wat. Res. Technol. 2022, 8, 1173–1187. [Google Scholar] [CrossRef]
- Schindler, D.W.; Hecky, R.E.; Findlay, D.L.; Stainton, M.P.; Parker, B.R.; Paterson, M.J.; Beaty, K.G.; Lyng, M.; Kasian, S.E.M. Eutrophication of lakes cannot be controlled by reducing nitrogen input: Results of a 37-year whole-ecosystem experiment. Proc. Natl. Acad. Sci. USA 2008, 105, 11254–11258. [Google Scholar] [CrossRef]
- Block, G.A.; Hulbert-Shearon, T.E.; Levin, N.W.; Port, F.K. Association of serum phosphorus and calcium x phosphate product with mortality risk in chronic hemodialysis patients: A national study. Am. J. Kidney Dis. 1998, 31, 607–617. [Google Scholar] [CrossRef]
- Bergwitz, C.; Juppner, H. Phosphate Sensing. Adv. Chronic Kidney Dis. 2011, 18, 132–144. [Google Scholar] [CrossRef]
- Jamal, S.A.; Vandermeer, B.; Raggi, P.; Mendelssohn, D.C.; Chatterley, T.; Dorgan, M.; Lok, C.E.; Fitchett, D.; Tsuyuki, R.T. Effect of calcium-based versus non-calcium-based phosphate binders on mortality in patients with chronic kidney disease: An updated systematic review and meta-analysis. Lancet 2013, 382, 1268–1277. [Google Scholar] [CrossRef]
- Cakmak, E.K.; Hartl, M.; Kisser, J.; Cetecioglu, Z. Phosphorus mining from eutrophic marine environment towards a blue economy: The role of bio-based applications. Water Res. 2022, 219, 118505. [Google Scholar] [CrossRef]
- Elser, J.J.; Bracken, M.E.S.; Cleland, E.E.; Gruner, D.S.; Harpole, W.S.; Hillebrand, H.; Ngai, J.T.; Seabloom, E.W.; Shurin, J.B.; Smith, J.E. Global analysis of nitrogen and phosphorus limitation of primary producers in freshwater, marine and terrestrial ecosystems. Ecol. Lett. 2007, 10, 1135–1142. [Google Scholar] [CrossRef]
- Egle, L.; Rechberger, H.; Krampe, J.; Zessner, M. Phosphorus recovery from municipal wastewater: An integrated comparative technological, environmental and economic assessment of P recovery technologies. Sci. Total Environ. 2016, 571, 522–542. [Google Scholar] [CrossRef]
- McDowell, R.W.; Dils, R.M.; Collins, A.L.; Flahive, K.A.; Sharpley, A.N.; Quinn, J. A review of the policies and implementation of practices to decrease water quality impairment by phosphorus in New Zealand, the UK, and the US. Nutr. Cycl. Agroecosyst. 2016, 104, 289–305. [Google Scholar] [CrossRef]
- Hatta, M.; Measures, C.I.; Ruzicka, J. Determination of traces of phosphate in sea water automated by programmable flow injection: Surfactant enhancement of the phosphomolybdenum blue response. Talanta 2019, 191, 333–341. [Google Scholar] [CrossRef]
- Li, Q.Y.; Zhao, W.H.; Miao, H.; Han, X.T. Effects and improvements of different reagents preservation methods on the determination of phosphate in seawater by phosphomolybdenum blue spectrophotometric method. Mar. Pollut. Bull. 2019, 139, 136–140. [Google Scholar] [CrossRef]
- Lopez-Ruiz, B. Advances in the determination of inorganic anions by ion chromatography. J. Chromatogr. A 2000, 881, 607–627. [Google Scholar] [CrossRef]
- Cheong, C.K.; Miura, T.; Nonose, N. Determination of phosphate in seawater by ion chromatography inductively coupled plasma sector field mass spectrometry. Limnol. Oceanogr. Meth. 2021, 19, 682–691. [Google Scholar] [CrossRef]
- Bowden, A.; Diamond, D. The determination of phosphorus in a microfluidic manifold demonstrating long-term reagent lifetime and chemical stability utilising a colorimetric method. Sens. Actuator B Chem. 2003, 90, 170–174. [Google Scholar] [CrossRef]
- Chen, H.W.; Zhao, L.L.; Yu, F.B.; Du, Q.L. Detection of phosphorus species in water: Technology and strategies. Analyst 2019, 144, 7130–7148. [Google Scholar] [CrossRef]
- Hu, J.B.; Stein, A.; Buhlmann, P. Rational design of all-solid-state ion-selective electrodes and reference electrodes. Trac Trends Anal. Chem. 2016, 76, 102–114. [Google Scholar] [CrossRef]
- Privett, B.J.; Shin, J.H.; Schoenfisch, M.H. Electrochemical Sensors. Anal. Chem. 2010, 82, 4723–4741. [Google Scholar] [CrossRef]
- Mahmud, M.A.P.; Ejeian, F.; Azadi, S.; Myers, M.; Pejcic, B.; Abbassi, R.; Razmjou, A.; Asadnia, M. Recent progress in sensing nitrate, nitrite, phosphate, and ammonium in aquatic environment. Chemosphere 2020, 259, 127492. [Google Scholar] [CrossRef]
- Miao, W.J.; Wang, L.; Liu, Q.; Guo, S.; Zhao, L.Z.; Peng, J.J. Rare earth ions-enhanced gold nanoclusters as fluorescent sensor array for the detection and discrimination of phosphate anions. Chem. Asian J. 2021, 16, 247–251. [Google Scholar] [CrossRef] [PubMed]
- Fan, C.; Lv, X.X.; Tian, M.; Yu, Q.C.; Mao, Y.Y.; Qiu, W.W.; Wang, H.; Liu, G.D. A terbium(III)-functionalized zinc(II)-organic framework for fluorometric determination of phosphate. Microchim. Acta 2020, 187, 84. [Google Scholar] [CrossRef] [PubMed]
- Xu, F.; Leng, W.; Lu, Q.W.; Li, K.P.; Zhang, Y.K.; Liu, J.Y.; Xu, L.Q.; Sheng, G.P. Ratiometric fluorescent sensing of phosphate ion in environmental water samples using flavin mononucleotide-functionalized Fe3O4 particles. Sci. Total Environ. 2023, 857, 159249. [Google Scholar] [CrossRef] [PubMed]
- Liu, J.Y.; Liu, Y.B.; Wang, W.; Zhang, S.Q.; Tang, L.; Ma, P.Y.; Song, D.Q.; Fei, Q. A ratiometric fluorescent sensor for the detection of phosphate. Luminescence 2023, 38, 152–158. [Google Scholar] [CrossRef] [PubMed]
- Jiang, Y.; Wang, X.C.; Zhao, G.; Shi, Y.Y.; Thuy, N.T.D.; Yang, H.L. SERS Determination of Trace Phosphate in Aquaculture Water Based on a Rhodamine 6G Molecular Probe Association Reaction. Biosensors 2022, 12, 319. [Google Scholar] [CrossRef] [PubMed]
- Radujevic, A.; Penavic, A.; Pavlovic, R.Z.; Badjic, J.D.; Anzenbacher, P. Cross-reactive binding versus selective phosphate sensing in an imine macrocycle sensor. Chem 2022, 8, 2228–2244. [Google Scholar] [CrossRef]
- Ma, Y.; Zhang, Y.Q.; Li, X.Y.; Yang, P.; Yue, J.Y.; Jiang, Y.; Tang, B. Linker-Eliminated Nano Metal-Organic Framework Fluorescent Probe for Highly Selective and Sensitive Phosphate Ratiometric Detection in Water and Body Fluids. Anal. Chem. 2020, 92, 3722–3727. [Google Scholar] [CrossRef]
- Zhu, J.M.; Han, G.W.; Hu, X.J.; Zuo, Y.F.; Chen, L.F.; Wang, F.; Yang, Y.; Jiang, F.H.; Sun, C.J.; Zhao, W.H.; et al. A Portable and Accurate Phosphate Sensor Using a Gradient Fabry-Perot Array. ACS Sens. 2020, 5, 1381–1388. [Google Scholar] [CrossRef]
- Pinyorospathum, C.; Rattanarat, P.; Chaiyo, S.; Siangproh, W.; Chailapakul, O. Colorimetric sensor for determination of phosphate ions using anti-aggregation of 2-mercaptoethanesulfonate-modified silver nanoplates and europium ions. Sens. Actuator B-Chem. 2019, 290, 226–232. [Google Scholar] [CrossRef]
- Xiao, D.; Yuan, H.Y.; Li, J.; Yu, R.Q. Surface-modified cobalt-based sensor as a phosphate-sensitive electrode. Anal. Chem. 1995, 67, 288–291. [Google Scholar] [CrossRef]
- Meruva, R.K.; Meyerhoff, M.E. Mixed potential response mechanism of cobalt electrodes toward inorganic phosphate. Anal. Chem. 1996, 68, 2022–2026. [Google Scholar] [CrossRef]
- Xu, K.; Kitazumi, Y.; Kano, K.; Shirai, O. Phosphate ion sensor using a cobalt phosphate coated cobalt electrode. Electrochim. Acta 2018, 282, 242–246. [Google Scholar] [CrossRef]
- Zhao, G.Y.; Fozia; Wen, H.B.; Dai, Z.M.; Nie, Y.H.; Jiang, J.R.; Xu, X.; Ying, M.; Hu, Z.L.; Xu, H. Preparation of a Phosphate Ion-Selective Electrode Using One-Step Process Optimized with Response Surface Method and its Application in Real Sample Detections. Electrocatalysis 2022, 13, 641–652. [Google Scholar] [CrossRef]
- Xu, K.B.; Li, Y.; Li, M. Potentiometric Phosphate Ion Sensor Based on Electrochemical Modified Tungsten Electrode. ACS Omega 2021, 6, 13795–13801. [Google Scholar] [CrossRef] [PubMed]
- Kabir, M.F.; Rahman, M.T.; Gurung, A.; Qiao, Q.Q. Electrochemical Phosphate Sensors Using Silver Nanowires Treated Screen Printed Electrodes. IEEE Sens. J. 2018, 18, 3480–3485. [Google Scholar] [CrossRef]
- Xu, K.B.; Wu, B.Y.; Wan, J.L.; Li, Y.; Li, M. A potentiometric phosphate ion sensor based on electrochemically modified nickel electrode. Electrochim. Acta 2022, 412, 140065. [Google Scholar] [CrossRef]
- Jeong, B.; Oh, J.S.; Kim, D.; Kim, D.G.; Kim, Y.I.; Heo, J.; Lee, H.K. Ion-Selective Electrode Based on a Novel Biomimetic Nicotinamide Compound for Phosphate Ion Sensor. Polymers 2022, 14, 3392. [Google Scholar] [CrossRef] [PubMed]
- Ben-Aissa, S.; De Marco, R.; Susmel, S. POM@PMO plastic electrode for phosphate electrochemical detection: A further improvement of the detection limit. Microchim. Acta 2023, 190, 135. [Google Scholar] [CrossRef]
- Wang, F.F.; Tong, J.H.; Li, Y.; Bian, C.; Sun, J.Z.; Xia, S.H. An Electrochemical Microsensor Based on a AuNPs-Modified Microband Array Electrode for Phosphate Determination in Fresh Water Samples. Sensors 2014, 14, 24472–24482. [Google Scholar] [CrossRef]
- Robinson, J.E.; Heineman, W.R.; Sagle, L.B.; Meyyappan, M.; Koehne, J.E. Carbon nanofiber electrode array for the detection of lead. Electrochem. Commun. 2016, 73, 89–93. [Google Scholar] [CrossRef]
- Aksu, S. Electrochemical equilibria of copper in aqueous phosphoric acid solutions. J. Electrochem. Soc. 2009, 156, C387. [Google Scholar] [CrossRef]
- Kumar, P.; Kim, D.M.; Hyun, M.H.; Shim, Y.B. An all-solid-state monohydrogen phosphate sensor based on a macrocyclic ionophore. Talanta 2010, 82, 1107–1112. [Google Scholar] [CrossRef] [PubMed]
- Zeitoun, R.; Biswas, A. Electrochemical Mechanisms in Potentiometric Phosphate Sensing Using Pure Cobalt, Molybdenum and Their Alloy for Environmental Applications. Electroanalysis 2021, 33, 421–430. [Google Scholar] [CrossRef]
- Debosz, M.; Kozma, J.; Porada, R.; Wieczorek, M.; Paluch, J.; Gyurcsányi, R.E.; Migdalski, J.; Koscielniak, P. 3D-printed manifold integrating solid contact ion-selective electrodes for multiplexed ion concentration measurements in urine. Talanta 2021, 232, 122491. [Google Scholar] [CrossRef] [PubMed]
- Sukesan, R.; Chen, Y.T.; Shahim, S.; Wang, S.L.; Sarangadharan, I.; Wang, Y.L. Instant Mercury Ion Detection in Industrial Waste Water with a Microchip Using Extended Gate Field-Effect Transistors and a Portable Device. Sensors 2019, 19, 2209. [Google Scholar] [CrossRef] [PubMed]
- Jupp, A.R.; Beijer, S.; Narain, G.C.; Schipper, W.; Slootweg, J.C. Phosphorus recovery and recycling—Closing the loop. Chem. Soc. Rev. 2021, 50, 87–101. [Google Scholar] [CrossRef] [PubMed]
- Liu, R.T.; Chi, L.N.; Wang, X.Z.; Sui, Y.M.; Wang, Y.; Arandiyan, H. Review of metal (hydr)oxide and other adsorptive materials for phosphate removal from water. J. Environ. Chem. Eng. 2018, 6, 5269–5286. [Google Scholar] [CrossRef]
- Xu, K.B.; Kitazumi, Y.; Kano, K.; Sasaki, T.; Shirai, O. Fabrication of a Phosphate Ion Selective Electrode Based on Modified Molybdenum Metal. Anal. Chem. 2020, 36, 201–206. [Google Scholar] [CrossRef]
- Özkütük, E.B.; Yildiz, B.; Gündüz, M.; Hür, E. Phosphate-imprinted polymer as an efficient modifier for the design of ion-selective electrode. J. Chem. Technol. Biotechnol. 2021, 96, 2604–2609. [Google Scholar] [CrossRef]


| Days | Potential (mV) of Different Concentrations | Linear Range | Slope | |||||
|---|---|---|---|---|---|---|---|---|
| 10−5 M | 10−4 M | 10−3 M | 10−2 M | 10−1 M | ||||
| 1 | 70.60 | 45.24 | 14.71 | −10.36 | −40.13 | 10−5–10−1 | −27.71 | >0.99 |
| 3 | 69.32 | 44.51 | 16.27 | −8.55 | −39.24 | 10−5–10−1 | −27.01 | >0.99 |
| 7 | 72.38 | 47.62 | 18.14 | −11.54 | −38.21 | 10−5–10−1 | −28.03 | >0.99 |
| 15 | 68.19 | 42.25 | 13.68 | −13.36 | −41.73 | 10−5–10−1 | −27.55 | >0.99 |
| 30 | 73.77 | 46.35 | 19.81 | −7.65 | −37.29 | 10−5–10−1 | −27.61 | >0.99 |
| 45 | 71.42 | 41.63 | 15.58 | −10.34 | −42.63 | 10−5–10−1 | −28.01 | >0.99 |
| 60 | 70.95 | 40.16 | 12.35 | −14.74 | −45.44 | 10−5–10−1 | −28.77 | >0.99 |
| 75 | 75.63 | 47.81 | 16.48 | −11.26 | −41.92 | 10−5–10−1 | −29.42 | >0.99 |
| 90 | 40.25 | 28.56 | 10.73 | −8.61 | −38.84 | 10−4–10−1 | −22.15 | >0.98 |
| Interfering Ions | Reagent | |
|---|---|---|
| S | Na2SO4 | −4.13 |
| NaHCO3 | −3.28 | |
| NaNO3 | −4.76 | |
| CCO | CCOONa | −3.57 |
| NaCl | −2.04 | |
| NaOH | −0.85 | |
| Na2SiO3 | −3.46 |
| Sample | pH | Adjusted pH | Added (mM) | Found (mM) | Recovery Rate (%) |
|---|---|---|---|---|---|
| Tap water | 7.20 | 8.03 | 0.1 | 0.097 0.002 | 97 |
| Drinking natural water | 7.63 | 9.02 | 1 | 1.02 0.01 | 102 |
| Laboratory wastewater | 5.28 | 7.02 | 10 | 9.50 0.4 | 95 |
| Sample | pH | Adjusted pH | Determined by CleverChem 380 Plus (μM) | Determined by ISE (μM) |
|---|---|---|---|---|
| Lake water | 8.24 | 7.01 | 5.33 0.08 | 6.04 0.21 |
| Aquatic water | 8.05 | 6.98 | 10.76 0.06 | 11.35 0.13 |
| Phosphate ISE Type | Detection Range/M | Detection Limit/M | Response Time (s) | pH Range | Lifetime | Ref. | |
|---|---|---|---|---|---|---|---|
| Co-PPy-OMC/GCE | 10−5–5 × 10⁻² | 6.81 × 10⁻⁶ | −31.6 | 9 | 3–5 | NG | [32] |
| Nickel | 10−5–10−1 | 10−5 | −81 | 20 | 4–7 | 4 weeks | [35] |
| Tungsten | 10−5–10−1 | 1 × 10⁻⁶ | −24.6 | 60 | 7–10 | 4 weeks | [33] |
| Cobalt wire | 10−5–10−1 | NG | −39 | 30 | 4.0–6.5 | 4 weeks | [31] |
| Molybdenum | 10−5–10−1 | 10−5 | −27.8 | 300 | 8–11 | 1 month | [47] |
| llP | 10−5–10−2 | 7.6 × 10⁻⁶ | −3.7 | 1800 | 2–7 | NG | [48] |
| Copper | 10−5–10−1 | 1 × 10⁻⁶ | −27.8 | 10 | 6–11 | 75 days | This work |
Disclaimer/Publisher’s Note: The statements, opinions and data contained in all publications are solely those of the individual author(s) and contributor(s) and not of MDPI and/or the editor(s). MDPI and/or the editor(s) disclaim responsibility for any injury to people or property resulting from any ideas, methods, instructions or products referred to in the content. |
© 2024 by the authors. Licensee MDPI, Basel, Switzerland. This article is an open access article distributed under the terms and conditions of the Creative Commons Attribution (CC BY) license (https://creativecommons.org/licenses/by/4.0/).
Share and Cite
He, Y.; Han, C.; Du, H.; Ye, Y.; Tao, C. Potentiometric Phosphate Ion Sensor Based on Electrochemically Modified All-Solid-State Copper Electrode for Phosphate Ions’ Detection in Real Water. Chemosensors 2024, 12, 53. https://doi.org/10.3390/chemosensors12040053
He Y, Han C, Du H, Ye Y, Tao C. Potentiometric Phosphate Ion Sensor Based on Electrochemically Modified All-Solid-State Copper Electrode for Phosphate Ions’ Detection in Real Water. Chemosensors. 2024; 12(4):53. https://doi.org/10.3390/chemosensors12040053
Chicago/Turabian StyleHe, Yang, Chenhua Han, Hao Du, Ying Ye, and Chunhui Tao. 2024. "Potentiometric Phosphate Ion Sensor Based on Electrochemically Modified All-Solid-State Copper Electrode for Phosphate Ions’ Detection in Real Water" Chemosensors 12, no. 4: 53. https://doi.org/10.3390/chemosensors12040053