Article

Semiconductor Heterojunction-AgNPs Mediated Surface-Enhanced Raman Spectroscopy (SERS) Sensor for Portable Miniaturized Detection Platform

1
School of Chemistry and Chemical Engineering, Hefei University of Technology, 193 Tunxi Road, Hefei 230009, China
2
Anhui Aochuang Environment Testing Co., Ltd., Weisan Road, Fuyang Economic and Technological Development Zone, Fuyang 236000, China
*
Author to whom correspondence should be addressed.
Chemosensors 2023, 11(9), 490; https://doi.org/10.3390/chemosensors11090490
Submission received: 26 July 2023 / Revised: 17 August 2023 / Accepted: 28 August 2023 / Published: 4 September 2023

Abstract

:
Micro/nanoplastic pollution in the water environment has received great attention worldwide. The rapid identification and analysis of micro/nanoplastics are crucial steps for monitoring animal safety and protecting human health. Herein, we developed a novel surface-enhanced Raman spectroscopy (SERS) sensor based on Co3O4/Co3S4/AgNPs array substrate for the detection and analysis of micro/nanoplastics. The semiconductor heterojunction-induced charge transfer, enhanced together with the electromagnetic enhancement of plasmon AgNPs, endow the sensor with high sensitivity, thus achieving exceptional analytical and detection capability for polystyrene (PS) nanospheres of different sizes ranging from 1 µm to 1 nm. The limits of detection (LOD) for PS nanospheres (size of 1 µm and 800 nm) was as low as 25 µg/mL, even with a portable Raman spectrometer. Additionally, the periodic Co3O4/Co3S4/AgNPs array generated high repeatability of Raman signals with relative standard deviation (RSD) values less than 7.6%. As proof of this concept, we further demonstrated the simulation detection of PS in actual water samples. We measured the SERS spectra of the different sizes and concentrations of PS spiked in lake water and city water. The results showed that the sensing platform realized trace detection of PS nanospheres in lake water with a detection limit of 14 µg/mL, and a quantitative detection of PS with linear relationship (R2 = 0.962). This SERS sensor has demonstrated fast analysis of PS nanospheres, which can provide a solid basis for the qualitative and quantitative detection of various micro/nanoplastics in the real water environments.

1. Introduction

The mass use of plastics in daily production and life has generated a large number of micro/nanoplastic fragments. These fragments will eventually enter the water environment and accumulate in the biological chain, thus causing irreversible damage to marine organisms and human beings. The rapid analysis and quantification of micro/nanoplastics has aroused widespread concern for monitoring their concentration and safeguarding public health. The existing plastic analytical methods generally involve a time-consuming and complex pretreatment process and depend mainly on laboratory-based instruments, which are usually incapable of real-time monitoring and detecting micro/nanoplastics in the environment [1,2,3]. Currently, surface-enhanced Raman scattering (SERS) has emerged as one of the most convenient and practical qualitative and quantitative analysis techniques for its fingerprint characteristics and the capabilities for rapid analysis. SERS has become a new trend to detect micro/nanoplastics, an attractive method for its real-time rapid monitoring of these plastics. For instance, Li’s laboratory [4] developed a SERS-based method for the detection of micro/nanoplastics in liquids and the detection of 100 nm-sized plastics down to 40 μg/mL; Mikac et al. [5] realized SERS detection of polystyrene microparticles at concentrations as low as 6.5 μg/mL. Consequently, a preeminent approach worth exploring is the realization of SERS monitoring of these plastics, which enables real-time monitoring and prompt detection efficiency.
SERS sensing performance is of paramount importance for real-world applications, and the most challenging and pressing problem is to explore high-performance SERS substrates. Sensitivity, reproducibility, and stability are primary metrics used to assess SERS sensor performance. Electromagnetic enhancement mechanism (EM) and chemical enhancement mechanism (CM), refs. [6,7], also called charge transfer enhancement, are believed to contribute to SERS enhancements and thereby improve SERS detection sensitivity. Noble metal nanostructures, such as Au and Ag nanomaterials, are mainly selected as efficient SERS substrates, while metal oxide semiconductors have also been developed as sensitive SERS substrates due to their low cost and high electronic activity. However, the SERS activity of simple metal oxide semiconductors is normally lower than their noble metal counterparts [8]. Recently, semiconductor heterojunction nanostructures have been explored and investigated as high performance of SERS substrates, in which the healing of the generated electron–hole pairs will be inhibited and, therefore, enable effective charge transfer enhancement [9]. Various semiconductor heterojunctions modified with Au or/and Ag are synthesized and employed as high-quality SERS sensors by combining the EM and CM effects at the semiconductor metal interface [10,11] to further improve their sensitivity.
Based on these ideas, two-dimensional (2D) nanomaterials, including graphene, MXenes and metal–organic frameworks (MOFs) etc., have been used to modify SERS materials to improve sensitivity owing to their large surface areas and favorable electronic properties [12,13,14]. It is noted that two-dimensional MOF arrays have revealed tremendous potential in SERS sensors due to the compact arrangement of arrays, which will generate highly uniform SERS signals [15,16,17]. Nevertheless, the SERS activity of pure MOFs will not be capable of satisfying most of the detection requirements. Researchers have attempted to decorate noble metal nanoparticles on the surface of MOF, leading to enormously improved SERS enhancement through localized surface plasmon resonance (LSPR). For example, Hu’s laboratory [18] prepared a hybrid SERS substrate by combining the properties of the abundant hotspots between the AuNPs and the adsorption performance of UiO-66-NH2 for trace molecules detection down to 6.5 ppb; Li et al. [19] optimized polyhedral HKUST-1@Ag structures exhibiting high SERS activity for detecting 4-aminothiophenol at a low concentration of 5 × 10⁻¹⁰ M. In addition, by using heterojunction-induced CM enhancement, novel SERS sensors based on MOF-derived materials were fabricated by embedding MOFs in appropriate single semiconductors or MOFs to form a heterojunction after calcination [20,21]. Through the incorporation of plasmonic noble metals on the heterojunction array, SERS sensors with high sensitivity and excellent reproducibility would be realized.
In this study, a MOF-derived semiconductor heterojunction array modified with plasma AgNPs was prepared as an efficient SERS substrate. The preparation process of the Co3O4/Co3S4/AgNPs substrate is shown in Figure 1. Briefly, a Zeolitic Imidazolate Framework-67 (ZIF-67) nanosheet array was synthesized via a simple hydrothermal method on Fluorine-Doped Tin Oxide-Coated Glass (FTO glass), and was then transformed into Co3O4 via calcination under air. Co3S4 is uniformly grown in situ on the Co3O4 nanosheet array through a simple solvothermal reaction and thereby forms a Co3O4/Co3S4 heterojunction. Lastly, the heterojunction was decorated with plasmonic AgNPs using a seed-mediated method. The SERS properties of the Co3O4/Co3S4/AgNPs substrate were studied systematically. The results showed that significant SERS enhancement and high signal reproducibility were realized. The rapid detection of PS with different concentrations and sizes was demonstrated. This SERS sensor successfully discerns and quantitatively analyzes the PS at a trace level.

2. Experimental Section

2.1. Chemicals

Cobalt nitrate hexahydrate (Co(NO3)2·6H2O, 98%), 2-Methylimidazole (2-MIM, 98%), Sodium sulfide nonahydrate (Na2S·9H2O, 98%), ethanol (C2H6O, AR), methanol (CH3OH, AR) and silver nitrate (AgNO3, 99.8%), Chloroauric acid (H AuCl4), ethylenediaminetetraacetic acid (EDTA, 98%), L-ascorbic acid (AA, 98%), and Sodium borohydride (NaBH4, 98%) were all purchased from Shanghai Sinopharm group (Shanghai, China). PS was produced by Shanghai Yiyuan Biotechnology Co., Ltd (Shanghai, China).

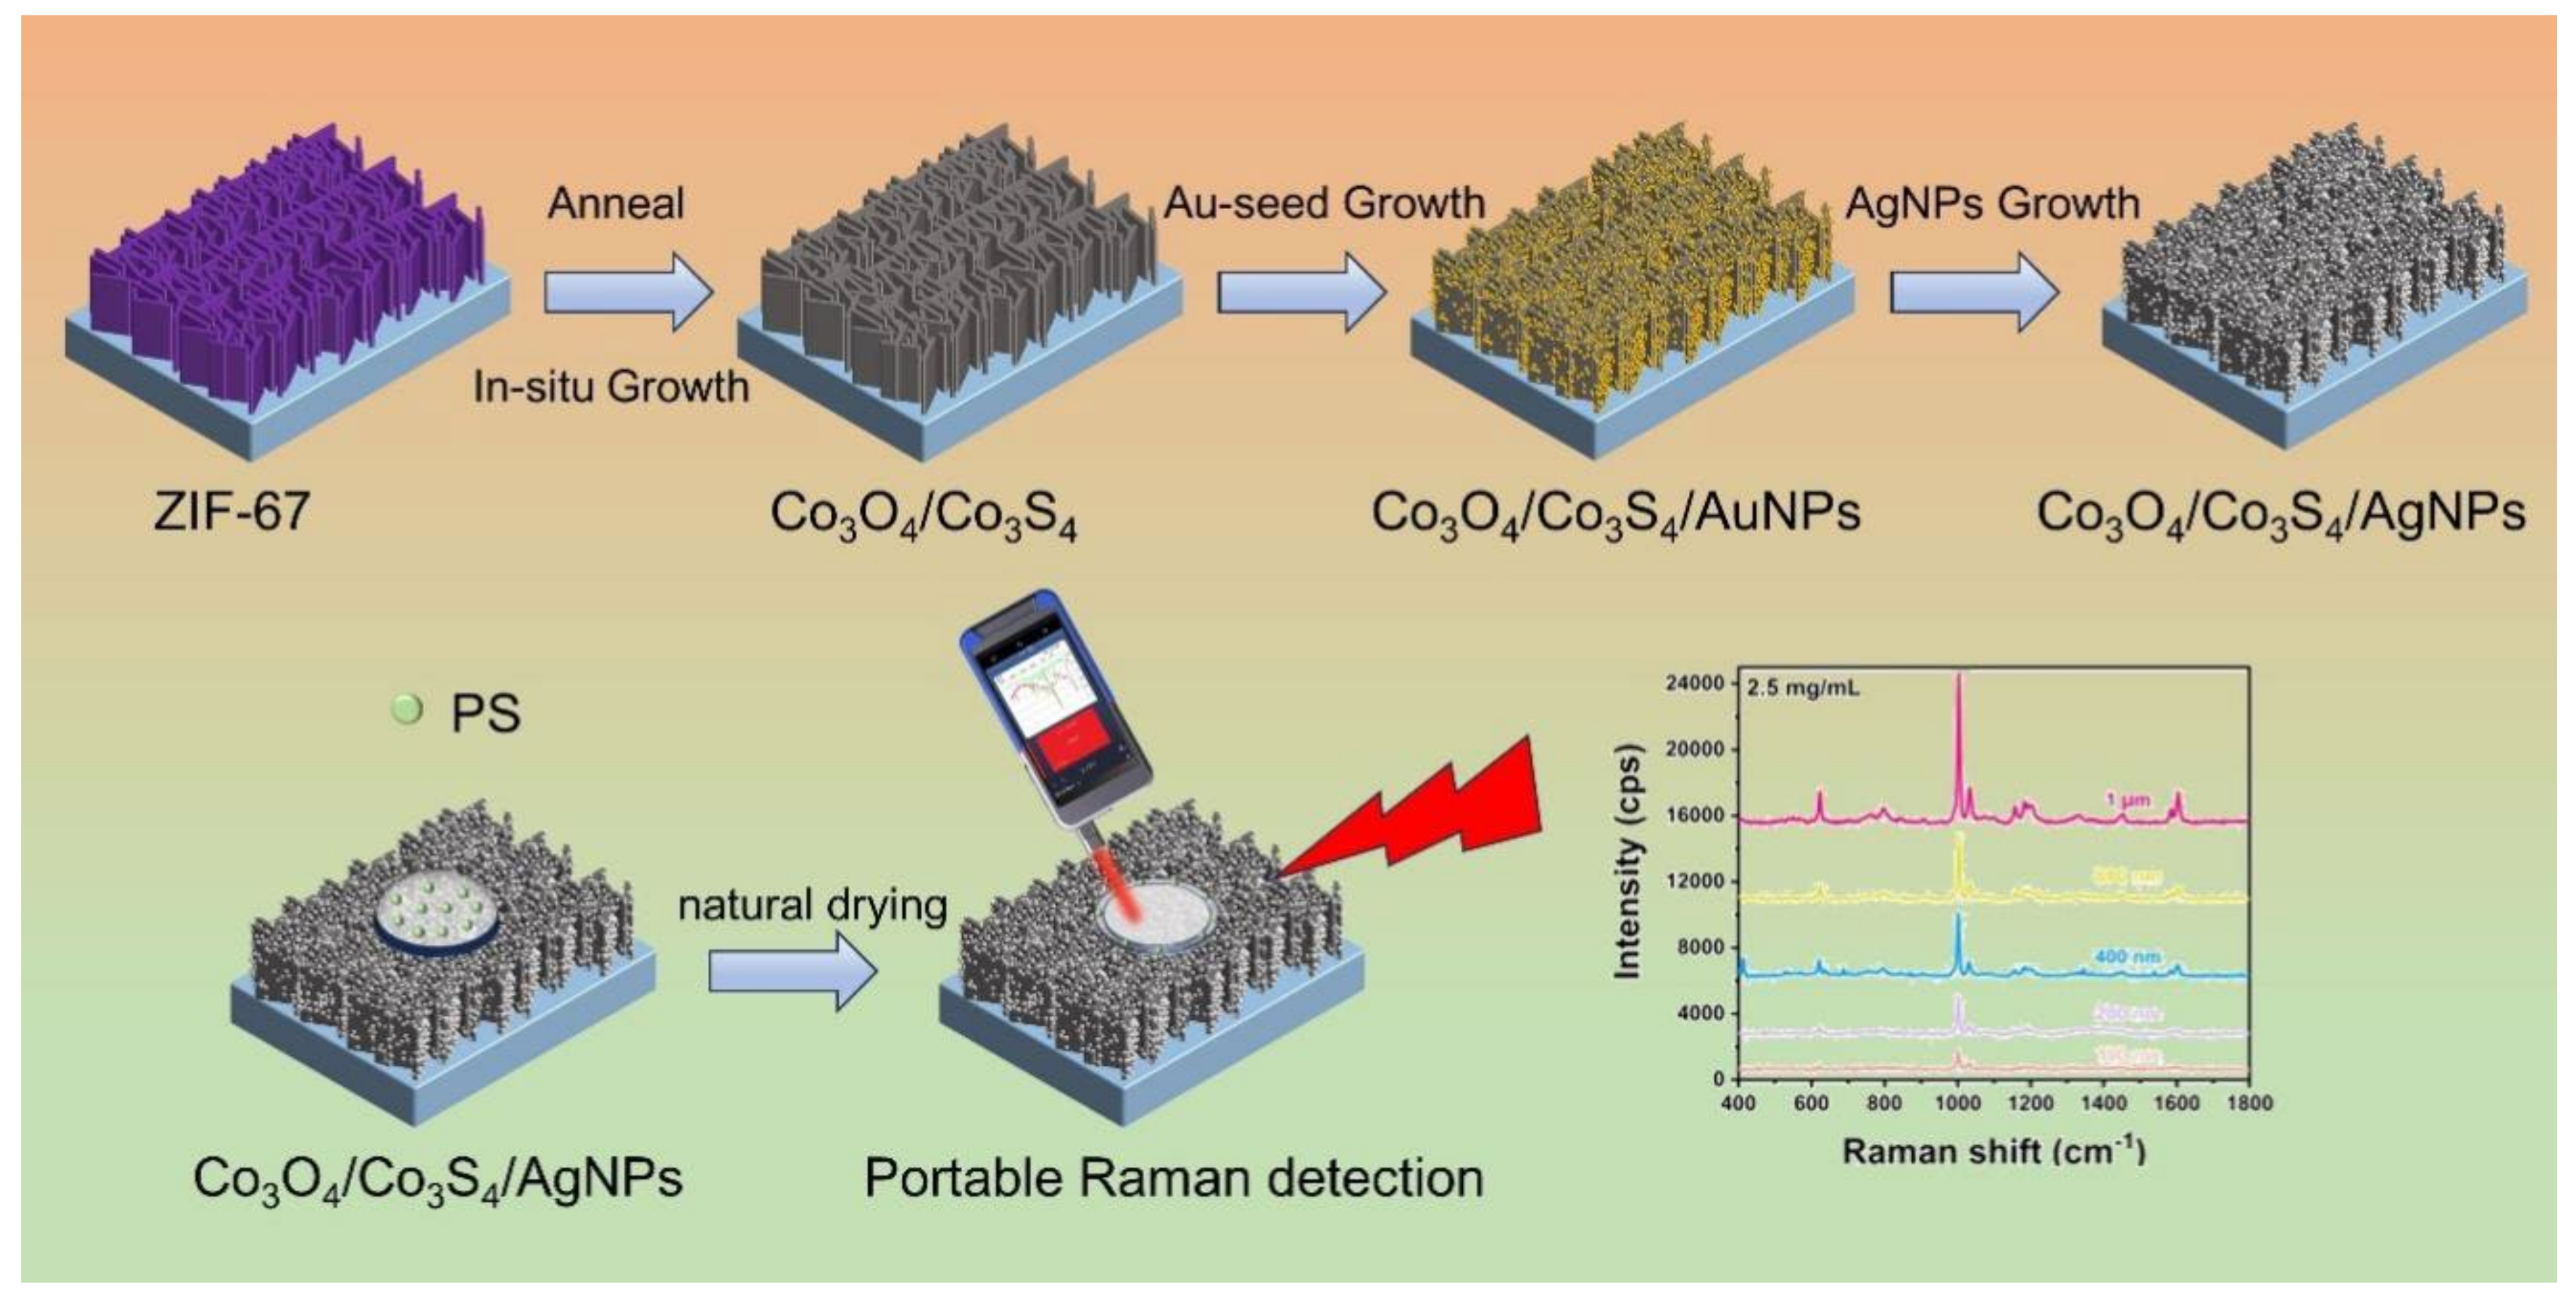
2.2. Preparation of ZIF-67 Nanosheet and Co3O4 Nanosheet

The ZIF-67 nanosheet array was first prepared using a simple hydrothermal method. [22]. Simply put, FTO glass (20 mm × 30 mm × 2 mm, light transmittance ≥ 80%, flake resistivity ≤ 7Ω/□) is continuously washed in toluene, acetone, ethanol, and deionized water using ultrasonic methods for 15 min. Subsequently, 40 mL of deionized water was added to 0.582 g Co(NO3)2·6H2O and 1.313 g 2-Methylimidazole, respectively. The cleaned FTO glass was vertically arranged in the above mixtures and maintained for 1 h. After that, ZIF-67 was grown on the FTO glass and was cleaned with deionized water, drying in the air as a further process. Then, the sample was annealed in a tubular furnace at 350 °C for 2 h (2 °C·min−1). Resultantly, the ZIF-67 nanosheet was transformed into its corresponding metal oxide Co3O4 nanosheet.

2.3. Preparation of Co3O4/Co3S4 Heterojunction Nanosheet

In a 50 mL stainless steel autoclave, 0.1 g of Na2S·9H2O was added to 30 mL deionized water. The mixture was stirred for 5 min with a magnetic stirrer, and then Co3O4 on the FTO was placed on the surface of the Teflon liner with the conducting side facing downward. It was kept at 120 °C for 24 h and then naturally cooled to room temperature. Then, Co3O4/Co3S4 heterojunction nanosheets were obtained on the FTO and then thoroughly washed with deionized water and air-dried.

2.4. Synthesis of Co3O4/Co3S4/AgNPs Substrate

Because Ag was not easy to deposit directly on Co3O4/Co3S4, gold seeds were first attached to Co3O4/Co3S4 as the core for AgNPs epitaxial growth to prepare a uniform Co3O4/Co3S4/AgNPs substrate. The gold seed predecessor method [23] was used to grow AgNPs on the Co3O4/Co3S4 heterojunction. First, the heterojunction surface was aminated at 25 °C for 6 h by dipping it into ethanediamine ethanol solution (25 vol%) to modify the amino groups, followed by washing with ethanol. By immersing the aminated sample into dilute AuHCl4 (0.1 wt%) for 4 h, AuNPs seeds were attached to the Co3O4/Co3S4 surface. Then, the above-mentioned sample was submerged for 120 s in NaBH4 water (0.05 M) to form an AuNPs-functionalized Co3O4/Co3S4 heterojunction. The product was washed with deionized water and ethanol and then dried under air. The coating of AgNPs on the Co3O4/Co3S4 heterojunction was performed at room temperature. In 10 mL of deionized water, AgNO3 (5 mL 100 mM) and ethylenediaminetetraacetic acid (EDTA, 5 mL 100 mM) were dispensed and magnetically stirred for 15 min. Then, AuNPs with Co3O4/Co3S4 were immersed in these mixtures, followed by the addition of L-ascorbic acid (AA) and stirring for 10 min. After washing the samples with distilled water and ethanol, the samples were dried under air.

2.5. Characterization and SERS Measurements

2.5.1. Characterization of SERS-Active Substrates and Their Components

The morphology of Co3O4/Co3S4/AgNPs was characterized using a transmission electron microscope (TEM, JEM1200 F, Japan Electronics, Tokyo, Japan) and a scanning electron microscope (SEM, Gemini 500, Japan Electronics, Tokyo, Japan). The specific element composition of the product was measured using an energy-dispersive spectroscopy (EDS, Japan Electronics, Tokyo, Japan). A rotating anode X-ray diffractometer (Rigaku D/Max-γA, Japan Electronics, Tokyo, Japan) equipped with Cu-Kα radiation (λ = 1.54187 Å) was used to characterize the phase and composition of the products.

2.5.2. Testing SERS Activity Using 4-ATP Model Molecule

The SERS enhancement capability of the Co3O4/Co3S4/AgNPs substrate was measured using a 4-ATP model molecule. The Raman mapping was determined via a confocal Raman spectrometer (InVia Reflex, B&W Tek Inc., Newark, NJ, USA). At the sample sites with high SERS intensity, additional SERS spectra were collected for the range of 400–3000 cm−1 with one accumulation at a 3 s acquisition time under the same laser wavelength (785 nm), laser power (70 mW) and objective lens (20 X) (i-Raman plus, B&W Tek Inc., Newark, NJ, USA). To analyze the data, a baseline correction was performed on all SERS spectra to eliminate interference from stray light in the environment. During Raman measurements, the probe molecule solution was dropped on the Co3O4/Co3S4/AgNPs solid substrate and dried naturally.

3. Results and Discussion

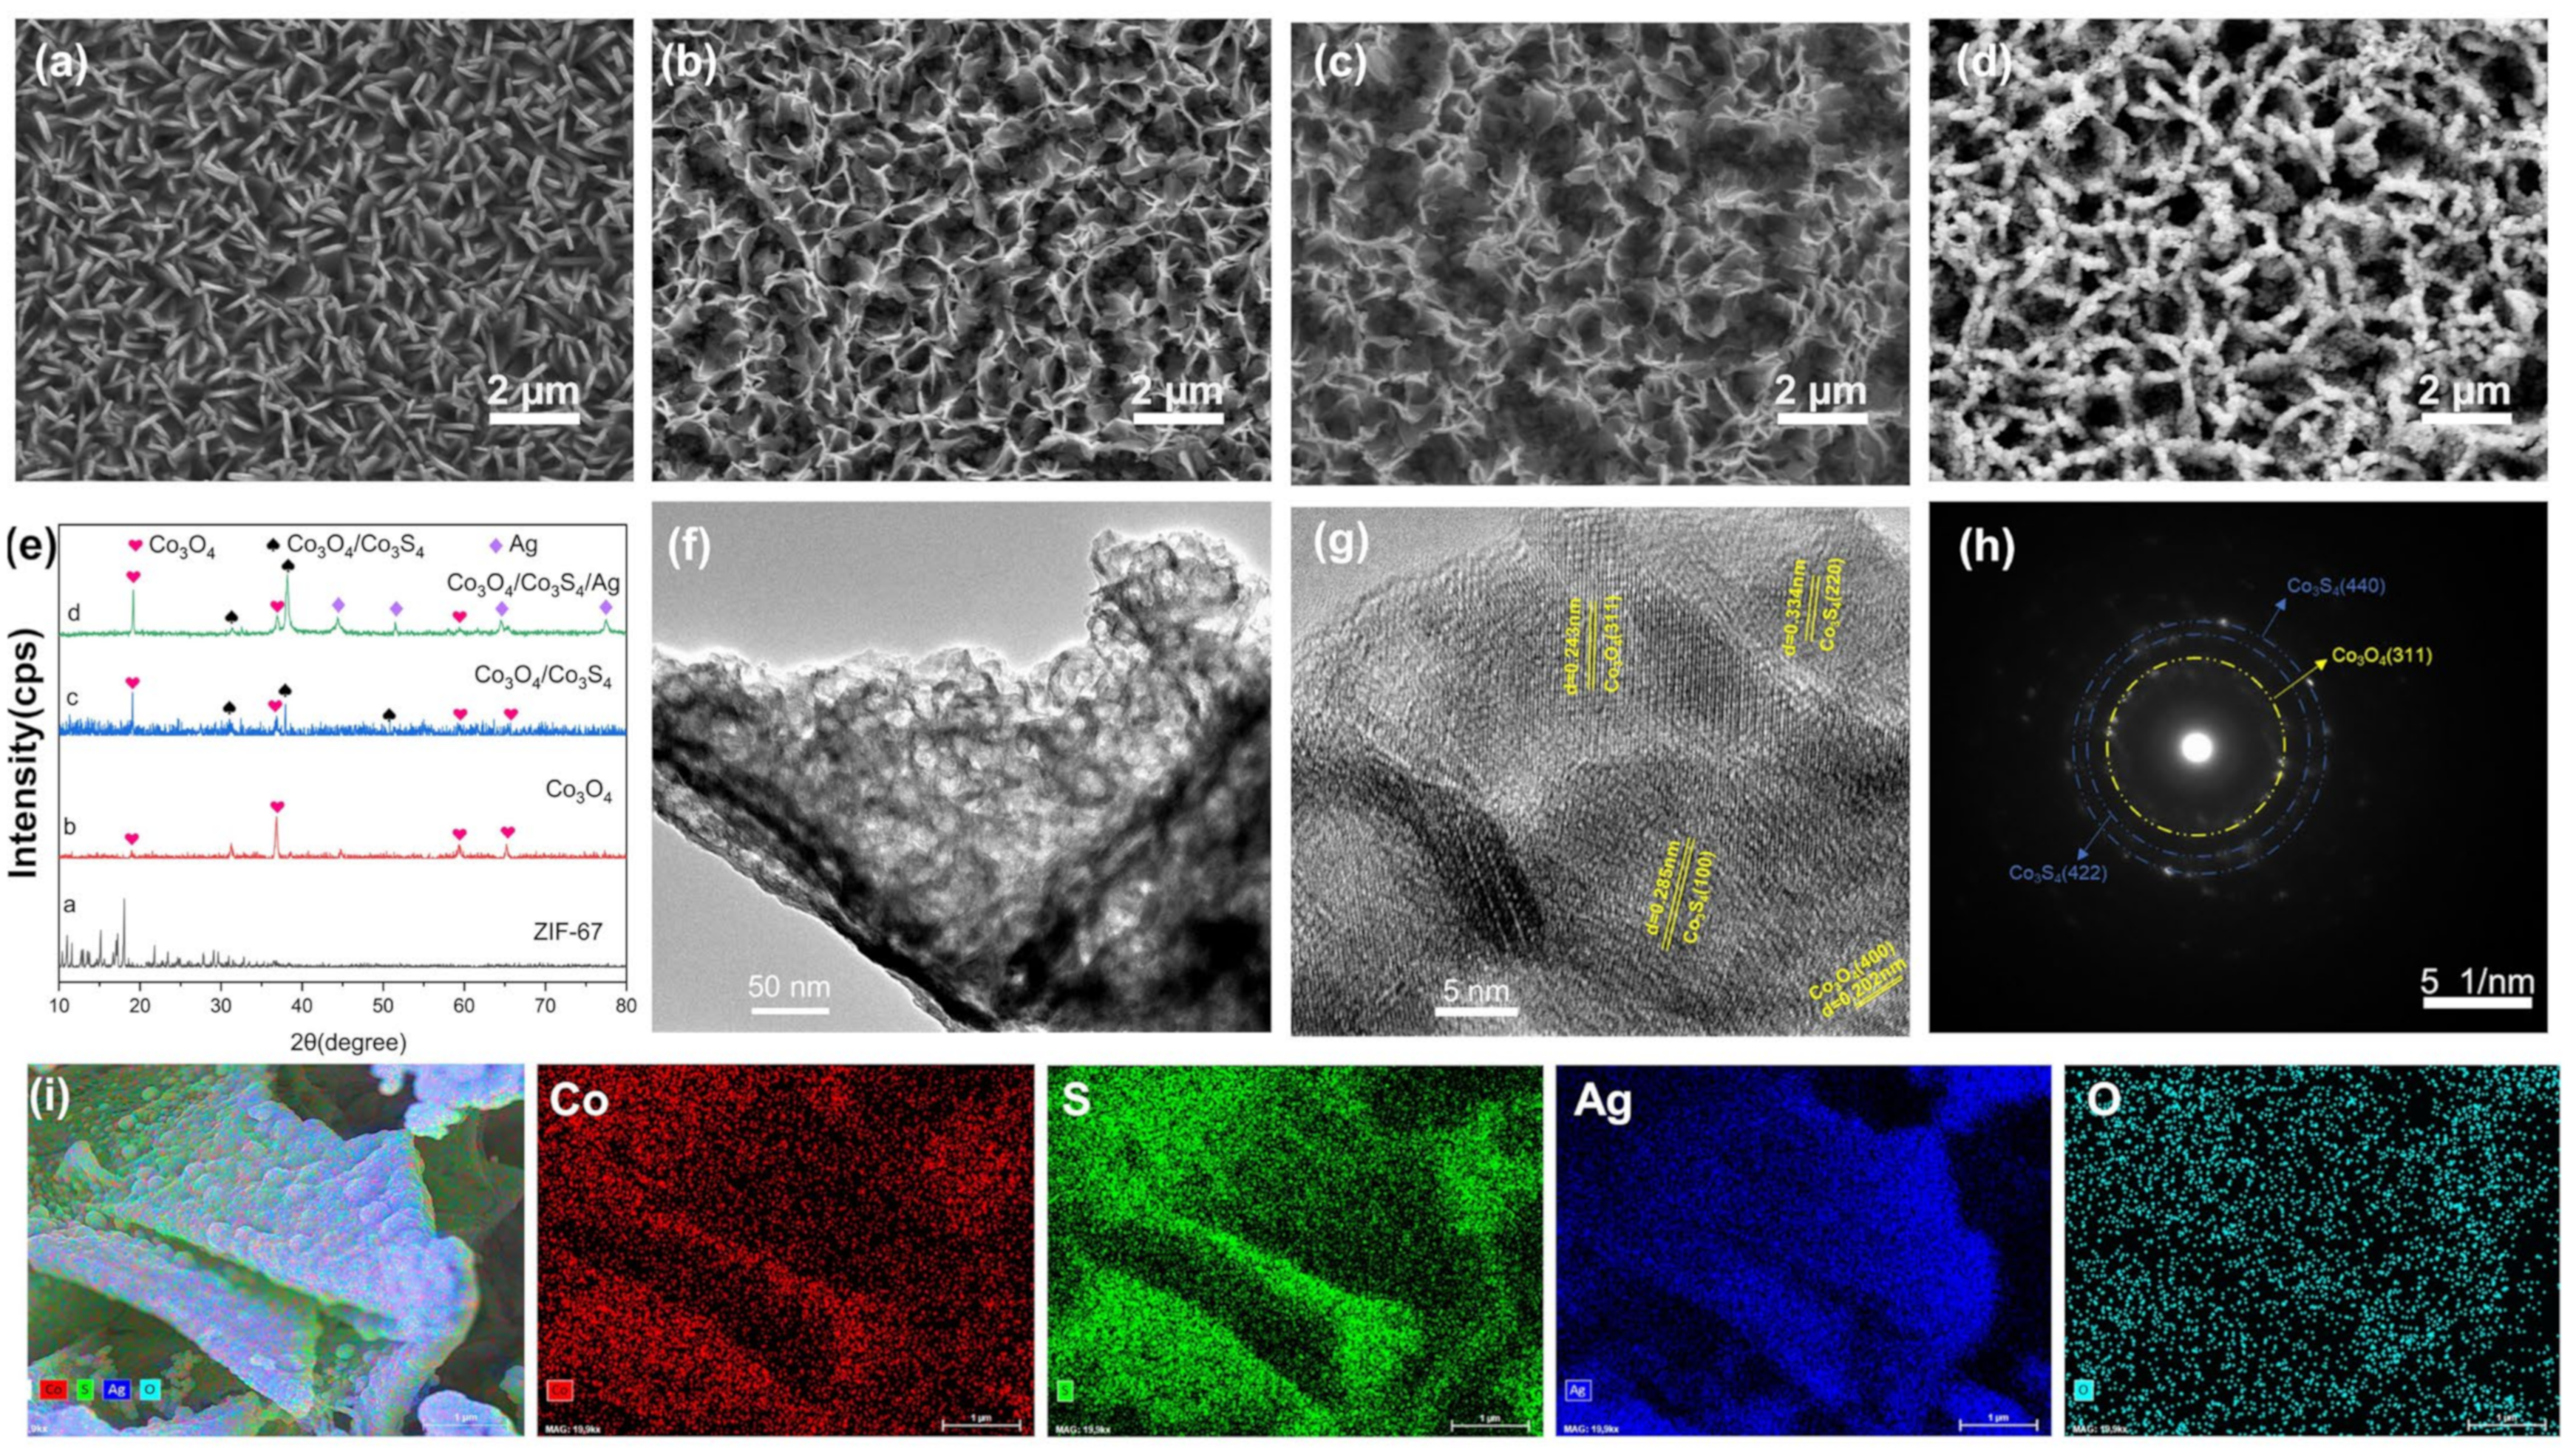
3.1. The Morphological Analysis and Structural Characterizations

The MOF material and derived semiconductor heterostructure synthesized on FTO possess excellent morphology uniformity. Figure 2a shows that the Co-MOF nanosheet arrays were successfully grown on the FTO glass through a simple hydrothermal reaction. After annealing at 350 °C for 120 min, the regular MOF nanosheet array transformed into a curved metal oxide (Co3O4) array (Figure 2b). A thin layer of Co3S4 was grown in situ on the surface of the Co3O4 nanosheet array after a solvothermal reaction, as displayed in Figure 2c. Through the Au-seed growth method, uniform and dense Ag nanoparticles were decorated on the Co3O4/Co3S4 heterostructures surface, as shown in Figure 2d. Aside from the SEM analysis, we also characterized the phase and the compositions of the products through the use of XRD (Figure 2e). In addition to SEM analysis, XRD was used to characterize the phase and composition of the product (Figure 2e). Prior to XRD measurements, the sample was scraped off the FTO glass to avoid the interference of SnO2 diffraction in the FTO. Curve a in Figure 2e is the diffraction pattern generated by ZIF-67. After annealing, ZIF-67 was transformed into Co3O4, as demonstrated in curve b. The peaks at 19.0°, 31.2°, 36.8°, 59.3°, and 65.2° can be indexed to the (111), (220), (311), (511), and (440) crystal planes of Co3O4 (JCPDS 42-1467) [24], respectively. Whereas diffraction peaks in curve c at 31.3°, 38.0°, and 55.0° can be indexed to the (311), (400), and (440) crystal planes of Co3S4 (JCPDF42-1448) [25]. The co-presence of diffraction patterns from Co3O4 and Co3S4 indicates the formation of Co3O4/Co3S4 heterojunction. In addition, TEM and HRTEM were used to characterize the microstructure of the Co3O4/Co3S4 heterojunction, as shown in Figure 2f,g. From the HRTEM image in Figure 2g, it is possible to easily assign the clear interplanar distances of 0.243 nm and 0.202 nm to the (311) and (400) planes of Co3O4, whereas the distance between the planes of 0.285 and 0.334 nm may be indexed to the (100) and (220) planes of Co3S4. And the selected area of the electron diffraction (SAED) image (Figure 2h) shows lattice planes of Co3O4 (311) and anatase Co3S4 (422) and (440), which are consistent with the HRTEM image. Further, the EDS mapping of the Co3O4/Co3S4/AgNPs nanosheet further confirmed the presence of the elements of Co, S, Ag and O (Figure 2i). The above results collectively confirm the formation of the Co3O4/Co3S4 heterostructure and the subsequent modification of plasmonic AgNPs on the surface.

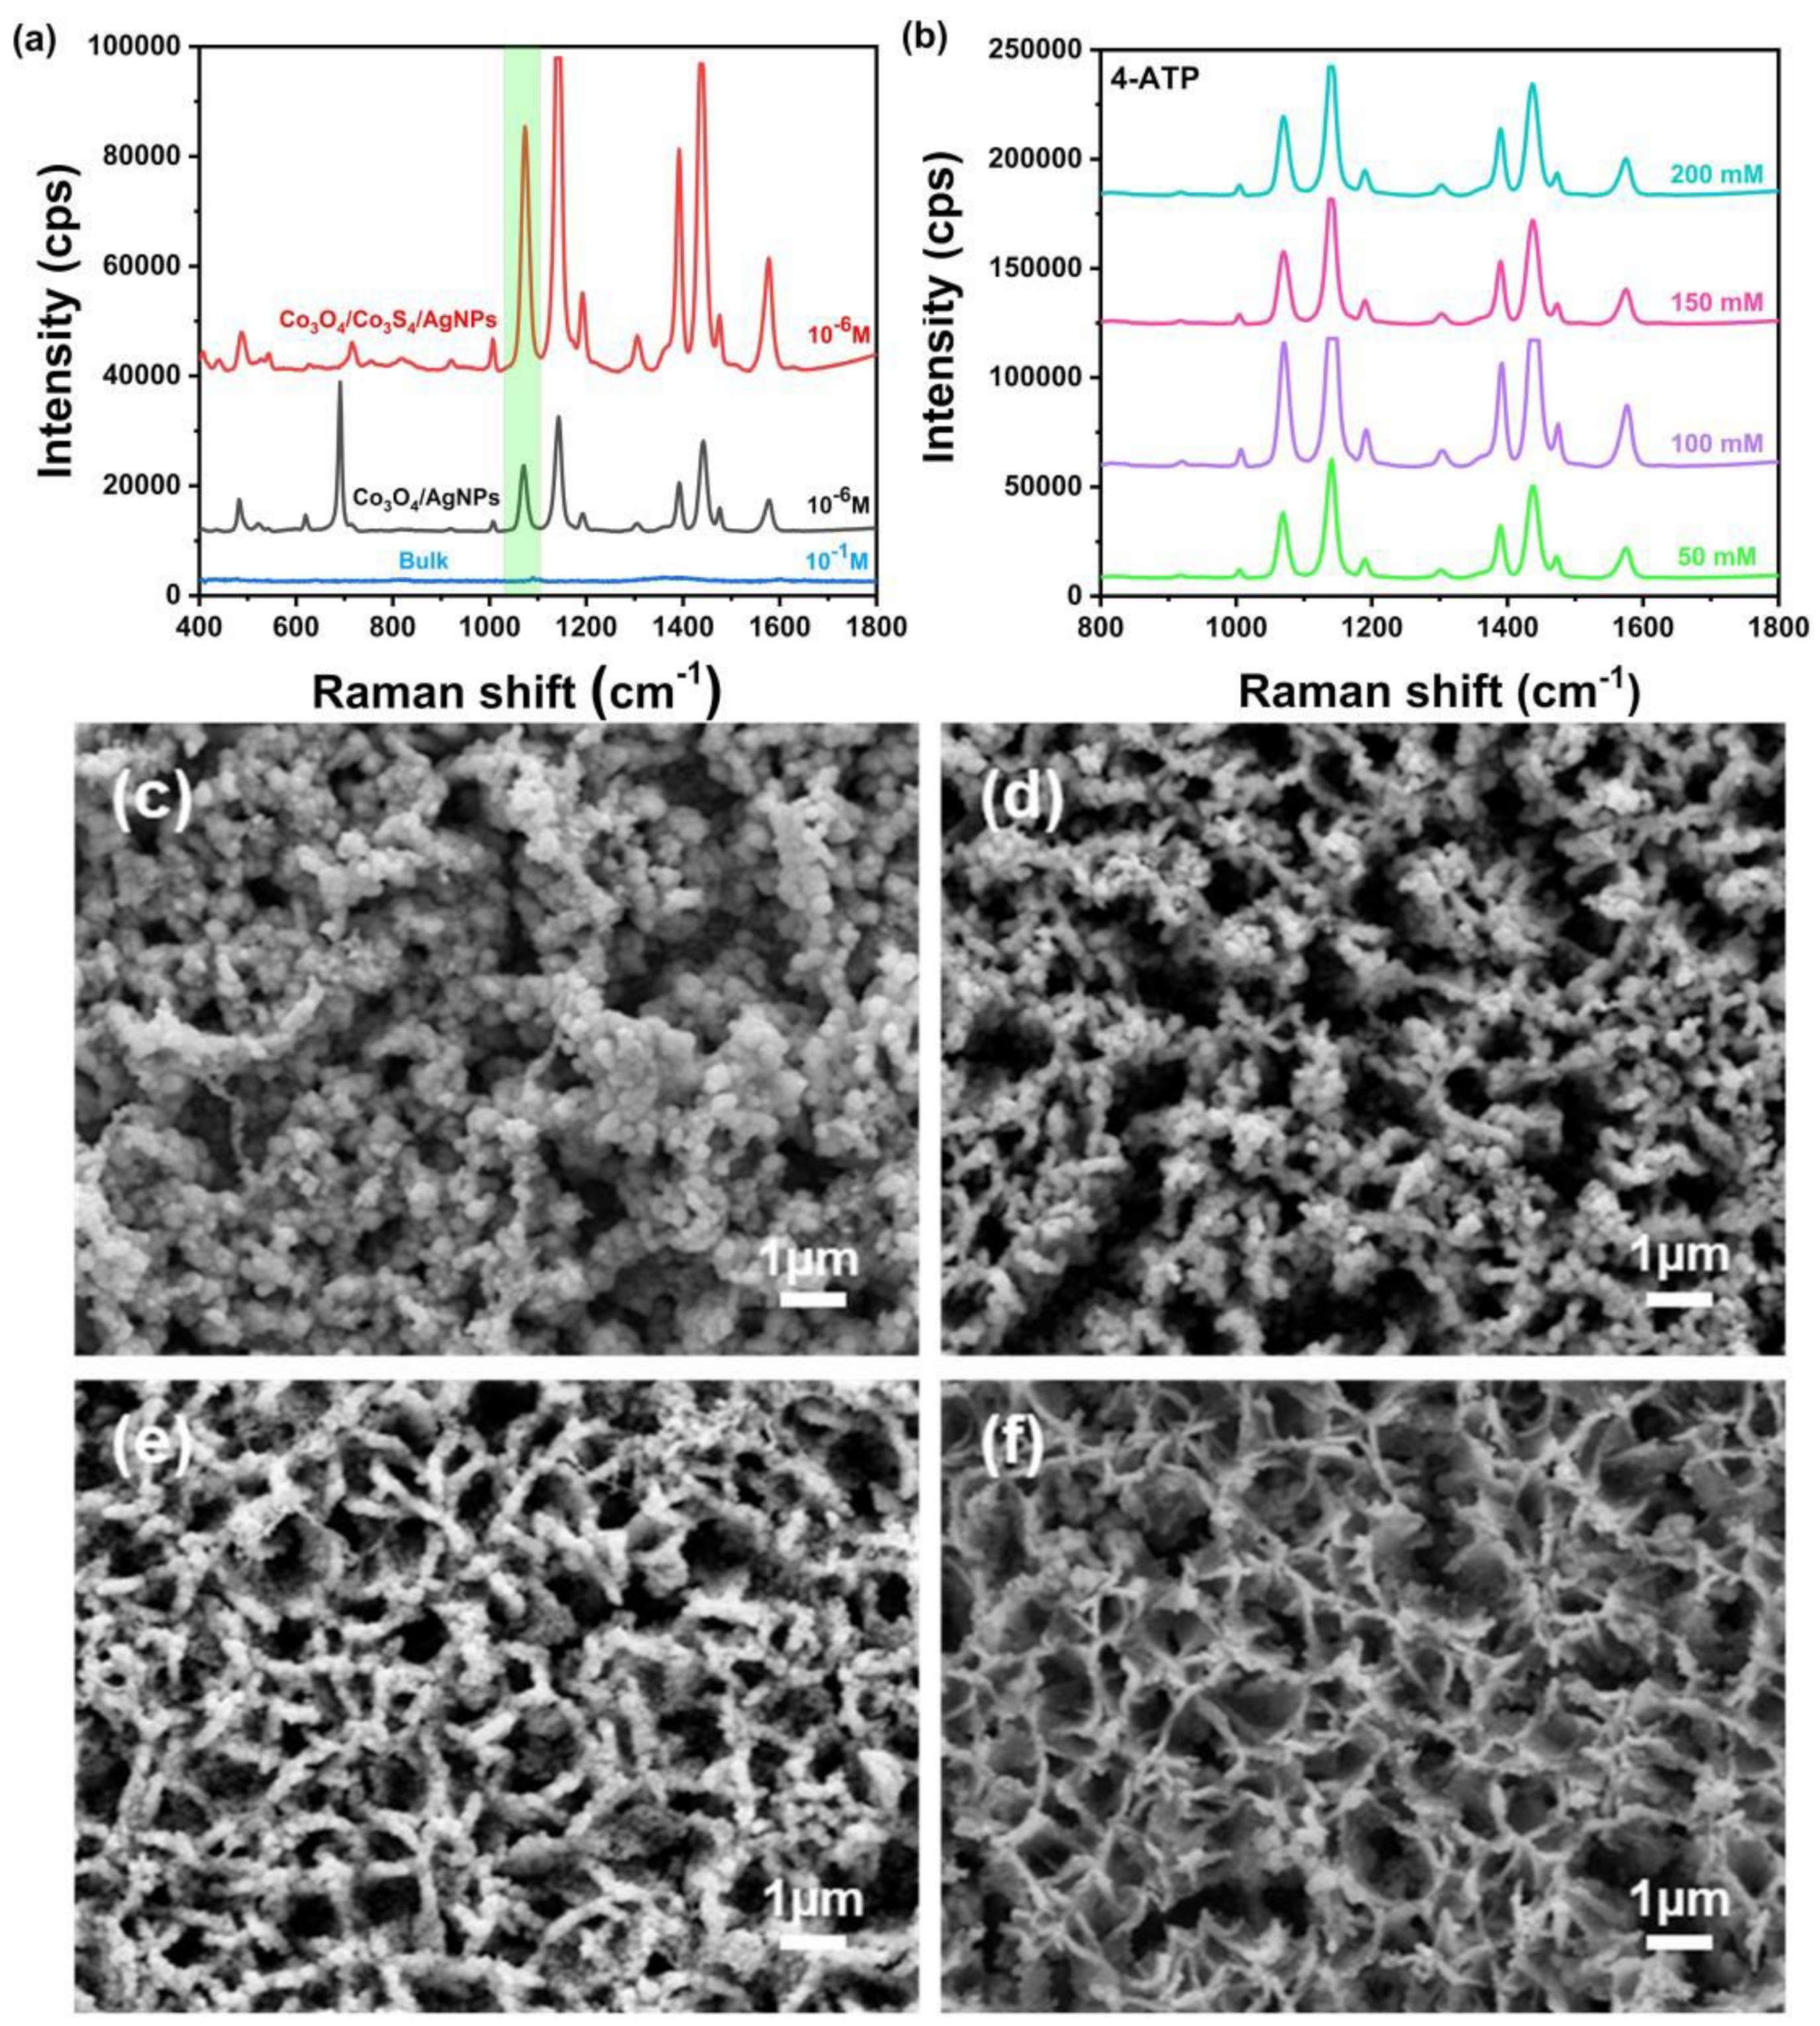
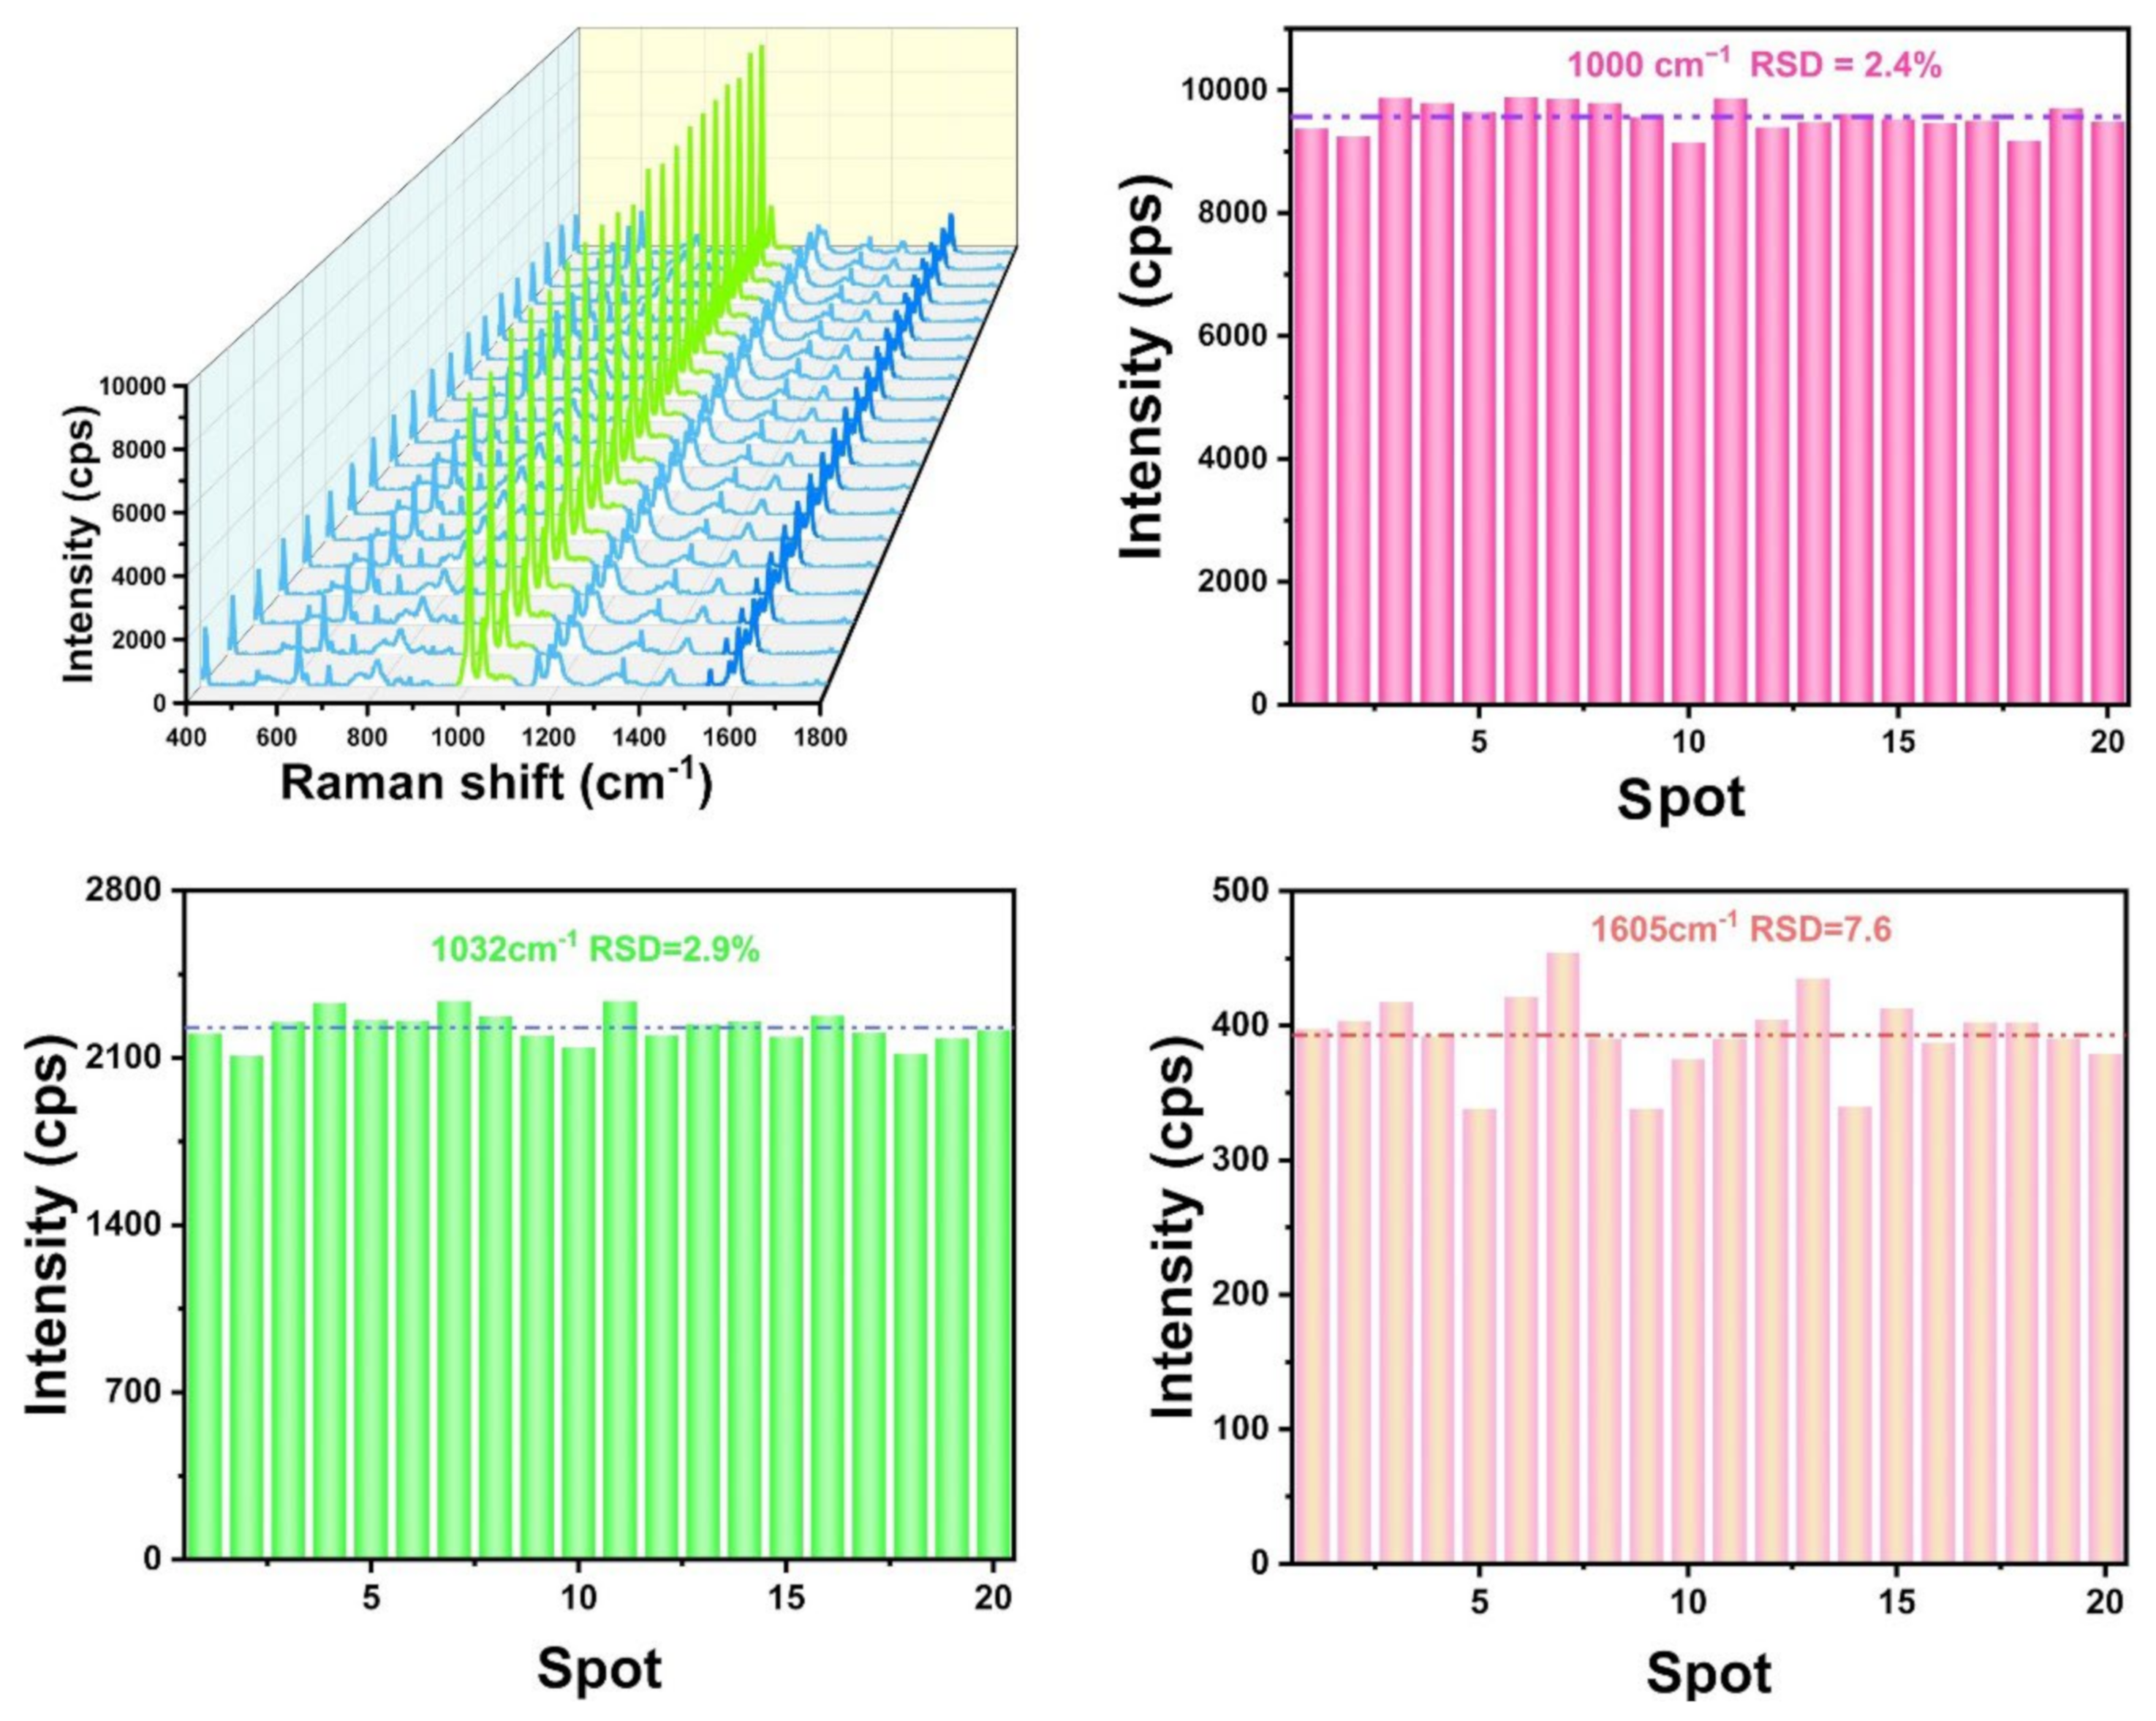
3.2. The SERS Performances of the Co3O4/Co3S4/AgNPs

We first investigated the Co3O4/Co3S4 heterojunction-induced SERS enhancement using a 4-ATP model molecule. Figure 3a displays the SERS spectra of the 4-ATP absorbed on the Co3O4/AgNPs and Co3O4/Co3S4/AgNPs substrates. The vibration bands at 1077 cm−1 and 1582 cm−1 can be attributed to C-S stretching and C-C stretching, respectively [26,27,28]. Clearly, the SERS intensity of the 4-ATP absorbed on the Co3O4/Co3S4/AgNPs substrate is much stronger than that of Co3O4/AgNPs, which is due to semiconductor heterojunction-induced charge transfer enhancement. It is known that the conduction band (CB) of Co3O4 is higher than that of Co3S4 [29], and the conduction band of Co3S4 is higher than the Fermi level of Ag [30]. The construction of the Co3O4/Co3S4 heterojunction promotes charge transfer efficiency and inhibits the healing of electron holes. Under laser irradiation, the electrons on the conduction band of Co3O4 would be transferred to the conduction band of Co3S4 and further transferred to the AgNPs surface, thus improving SERS activity through chemical enhancement [29,31,32]. Through comparison with the SERS spectrum of ZIF-67 (Supplementary Materials) and analyzing the ultraviolet absorption spectra of Co3O4/AgNPs and Co3O4/Co3S4/AgNPs (Supplementary Materials), it was proven that the Co3O4/Co3S4 heterojunction played a certain role in improving SERS performance.
To quantify the enhancement contribution from Co3O4/AgNPs and Co3O4/Co3S4/AgNPs substrates, we calculated their enhancement factor (EF) based on the following formula:
EF = (ISERS/IBULK) × (NBULK/NSERS)
where ISERS and IBULK represent the intensities of SERS and normal Raman scattering, whereas NSERS and NBULK, respectively, denote the numbers of corresponding 4-ATP molecules effectively excited via a laser beam. According to the above formula and Figure 3a, the EF for the Co3O4/AgNPs substrate is calculated to be 9.29 × 10⁶. The EF is calculated to be 3.77 × 10⁷ for the Co3O4/Co3S4/AgNPs substrate. As a result, the EF for the Co3O4/Co3S4/AgNPs substrate shows a 4.06-fold enhancement compared to the Co3O4/AgNPs substrate.

3.3. The SERS Performance Optimization of Co3O4/Co3S4/AgNPs

Subsequently, we explored the EM enhancement of plasmonic AgNPs on the surface of the heterojunction. The content of decorated AgNPs was controlled by changing the concentration of AgNO3. Figure 3b shows the SERS responses of the Co3O4/Co3S4/AgNPs prepared at varying doses of AgNO3. By comparison, it is found that Co3O4/Co3S4/AgNPs prepared at 100 mM of AgNO3 generate the highest SERS activity. This result can be explained through the fact that that nanogaps between plasmonic AgNPs and the amount of the SERS hotspots significantly influence SERS performance and that optimal plasmonic AgNPs would produce the highest enhancement. To clarify the real cause, SEM observations were carried out for the Co3O4/Co3S4 heterojunction decorated with different amounts of AgNPs, as presented in Figure 3c–f. As can be seen in Figure 3c, a high AgNO3 concentration of 200 mM results in the complete coverage of AgNPs on the Co3O4/Co3S4 surface, and the gaps between AgNPs were extremely approached, leading to the merger of the SERS hotspots, and thus reducing the SERS performance. When the concentration decreased to 150 mM (Figure 3d), most of the AgNPs were successfully modified on the surface of Co3O4/Co3S4 nanosheets, and excessive AgNPs were gathered on the surface to form nanoclusters. At the concentration of 100 mM (Figure 3e), AgNPs were uniformly attached to the surface of Co3O4/Co3S4 nanosheets, and the AgNPs were evenly distributed without the appearance of clustered silver. Figure 3f shows the SEM image obtained at the concentration of 50 mM. At this concentration level, AgNPs are sparsely deposited on the Co3O4/Co3S4 surface, leading to decreased SERS hotspots. The SEM observations are consistent with the above experimental results.
The homogeneity of the SERS substrate is a prominent basis for practical quantitative applications. Therefore, we evaluated the signal homogeneity of the substrate by randomly measuring 20 points on the Co3O4/Co3S4/Ag substrate. The SERS spectra were collected using polystyrene microspheres (particle size of 1 µm, 2.5 mg/mL) dispersed on the SERS substrate, as displayed in Figure 4. The characteristic peaks of PS appeared at 1000 cm−1, 1032 cm−1 and 1605 cm−1. The peak at 1000 cm−1 is mainly assigned to the circular respiratory vibration; the peak at 1032 cm−1 can be attributed to the deformation of the C-H plane; the peak at 1605 cm−1 is mainly caused by the stretching of the ring skeleton [33,34]. The relative standard deviation (RSD) values for peak intensities at 1000 cm−1, 1032 cm−1, and 1605 cm−1 were calculated to be 2.4%, 2.9%, and 7.6%, respectively, indicating superior signal homogeneity. The regular arrangement of the nanosheet array and the uniform distributed AgNPs on the heterojunction are believed to be responsible for the homogeneity of the substrate.
In addition to homogeneity, SERS sensitivity is another key factor determining SERS performance. Thus, the sensitivity of the Co3O4/Co3S4/AgNPs substrate was evaluated by using different sizes of PS microspheres at the same concentrations. First, we measured the SERS performance of different sizes of PS microspheres on the SERS substrate (Figure 5a). Obviously, the peak intensity at 1000 cm−1 increases with particle sizes, indicating that larger particle sizes of PS generate the higher SERS signals and the 1 µm size produces the strongest signal. This may be due to the fact that small PS take up more space at the same weight due to there being more gaps between the nanosheets. After that, the small-size PS nanoplastic particles are located further away from the hotspots, which will generate weak SERS intensity. The results are consistent with the previous observations reported by Zhang’s group [35]. Figure 5b–f display the SERS spectra of different concentrations of 1 µm, 800 nm, 400nm, 200 nm, and 100 nm of PS on the substrates. It is found that the detection limit of PS with sizes of 1 µm and 800 nm can be as low as 25 µg/mL. However, the detection limit of PS with a particle size of 400 nm and 200 nm can only reach 50 µg/mL, and the detection concentration for PS with a particle size of 100 nm can be as little as 100 µg/mL. In order to determine the limits of detection (LOD) and limits of quantitation (LOQ) of the Co3O4/Co3S4/Ag substrate, we calculated them according to the following formulas:
LOD = 3 × N × Q/I;
LOQ = 10 × N × Q/I
where N represents noise and Q and I represent sample size and signal response value. According to the above formula, the detection limit of PS on Co3O4/Co3S4/Ag substrate is calculated to be 14 µg/mL. The quantitation limit of PS on the Co3O4/Co3S4/Ag substrate is calculated to be 47 µg/mL. By comparison, the larger size of PS nanoplastics demonstrated a higher detection sensitivity. The coffee ring consisting of PS nanoplastics will become sparsely distributed if the concentration is too low, making detection difficult for smaller-sized nanoplastics. And thus, the detection limit for small-sized nanoplastics is not effective.

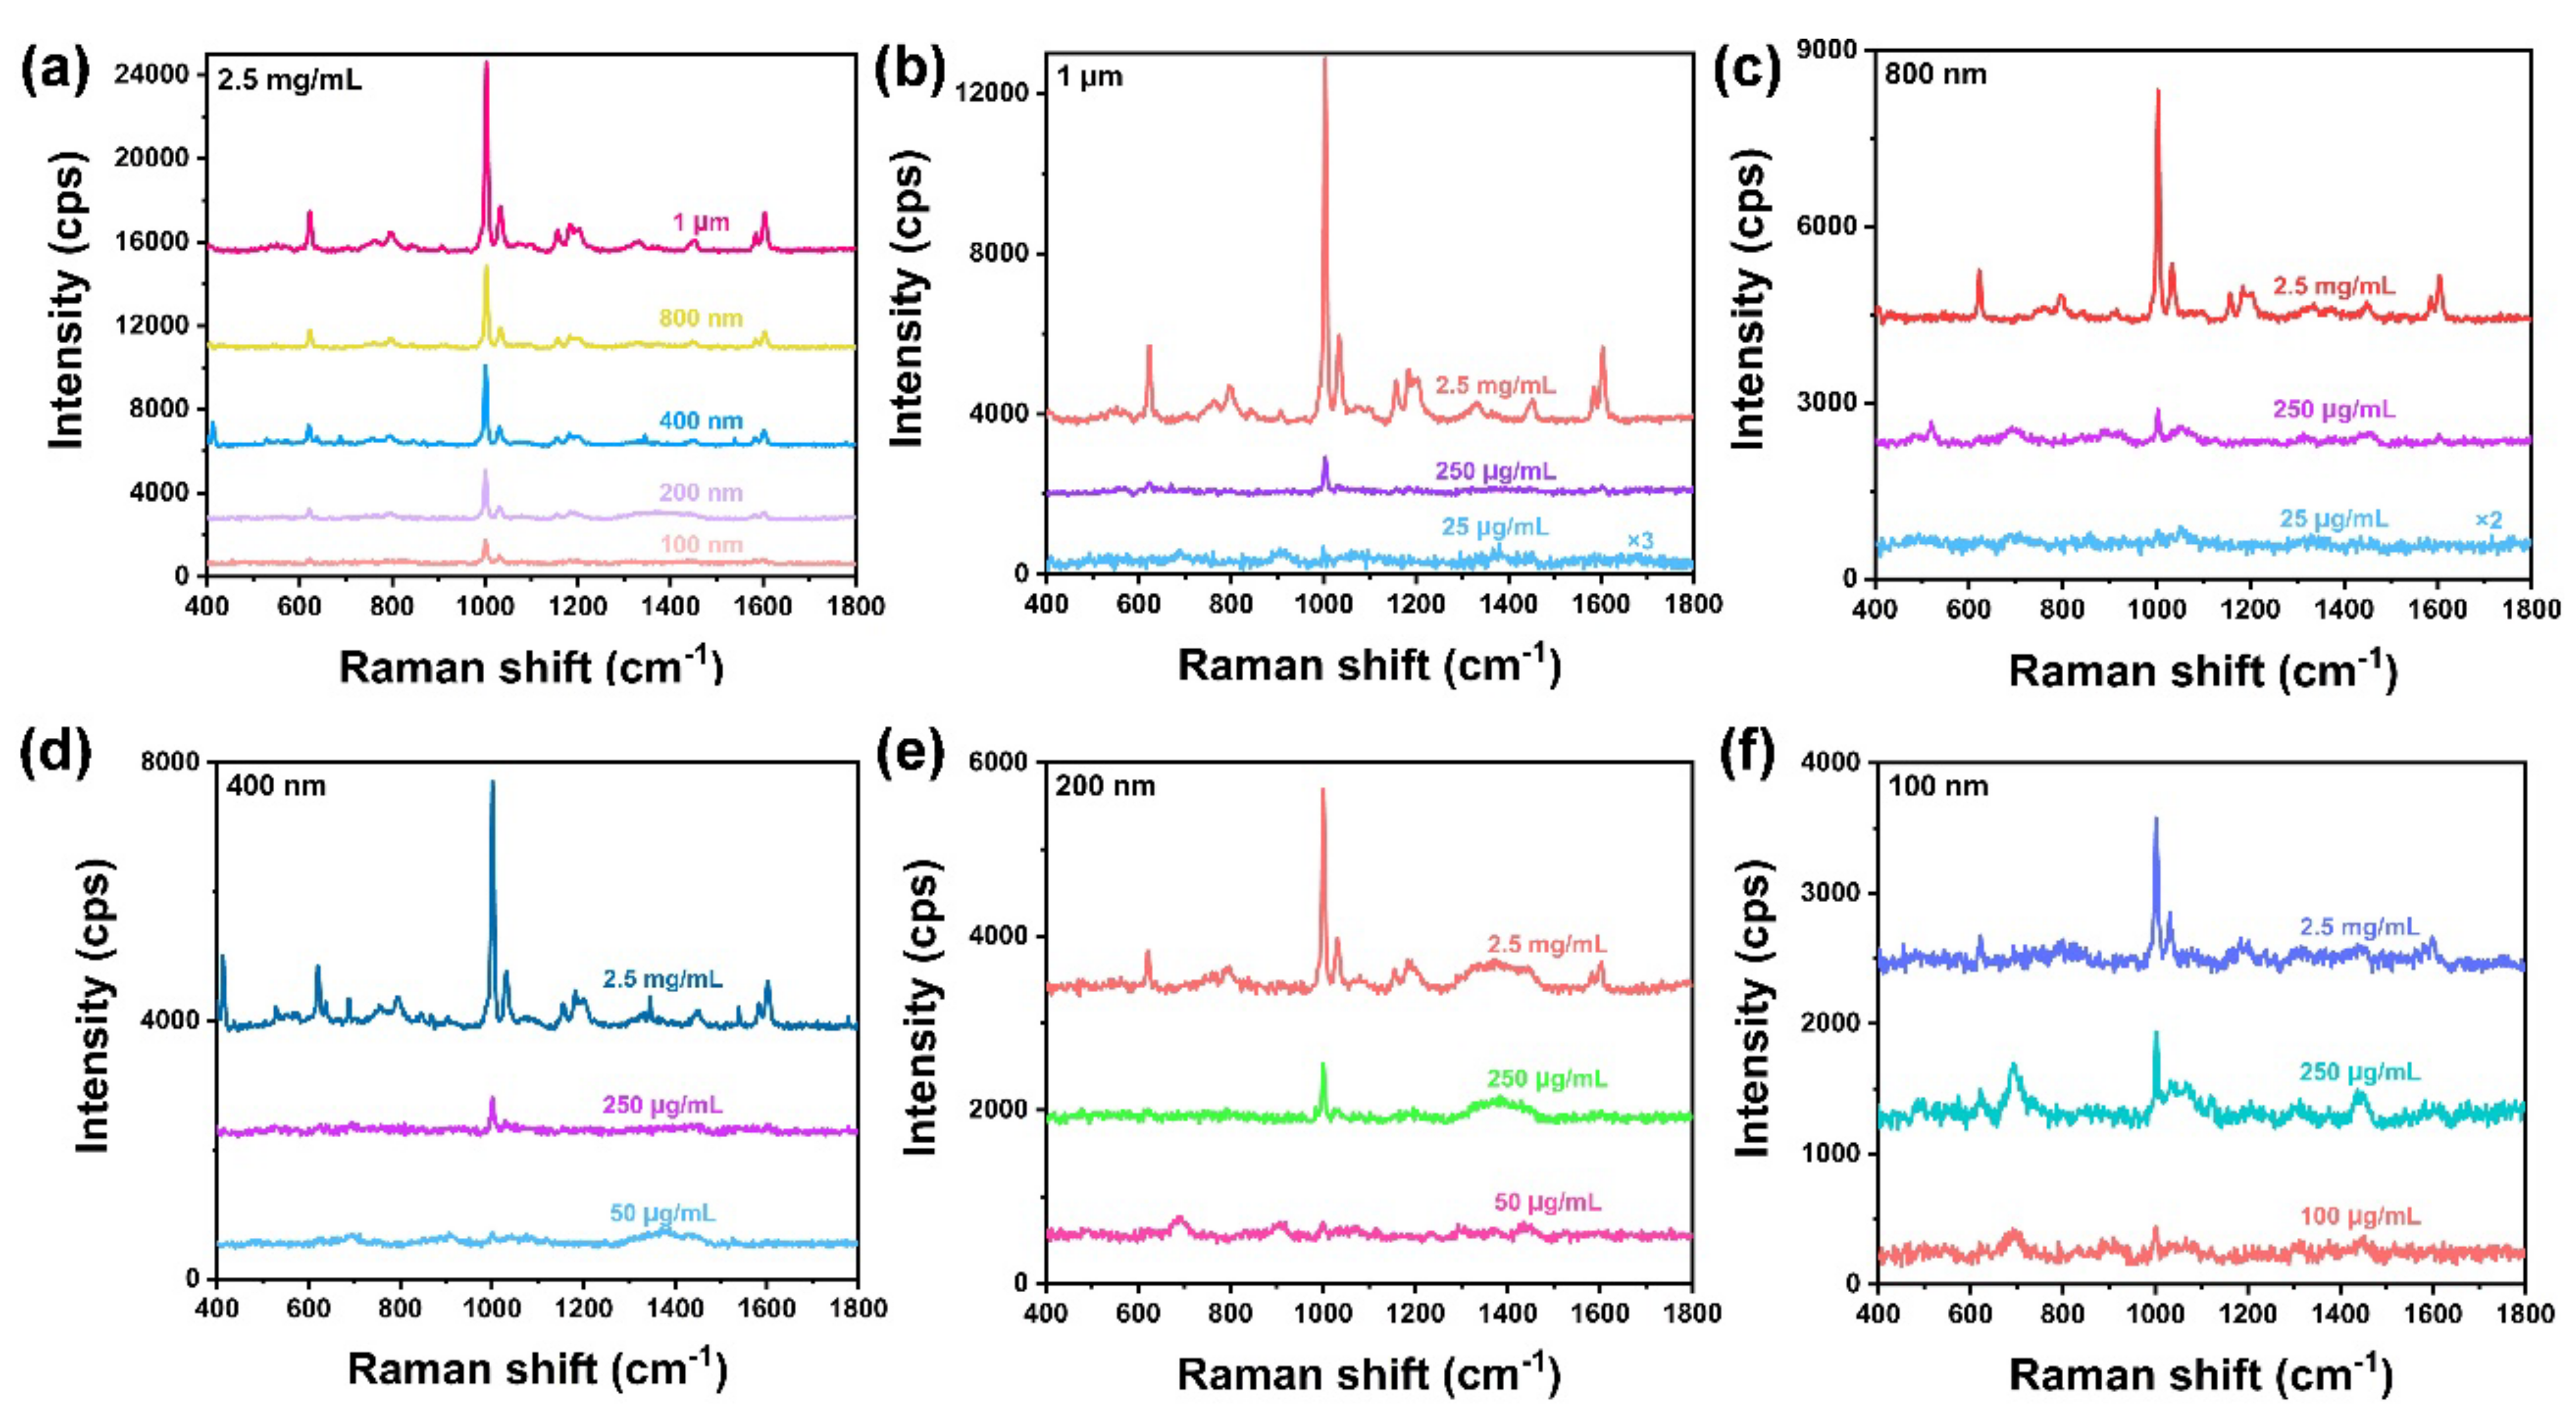
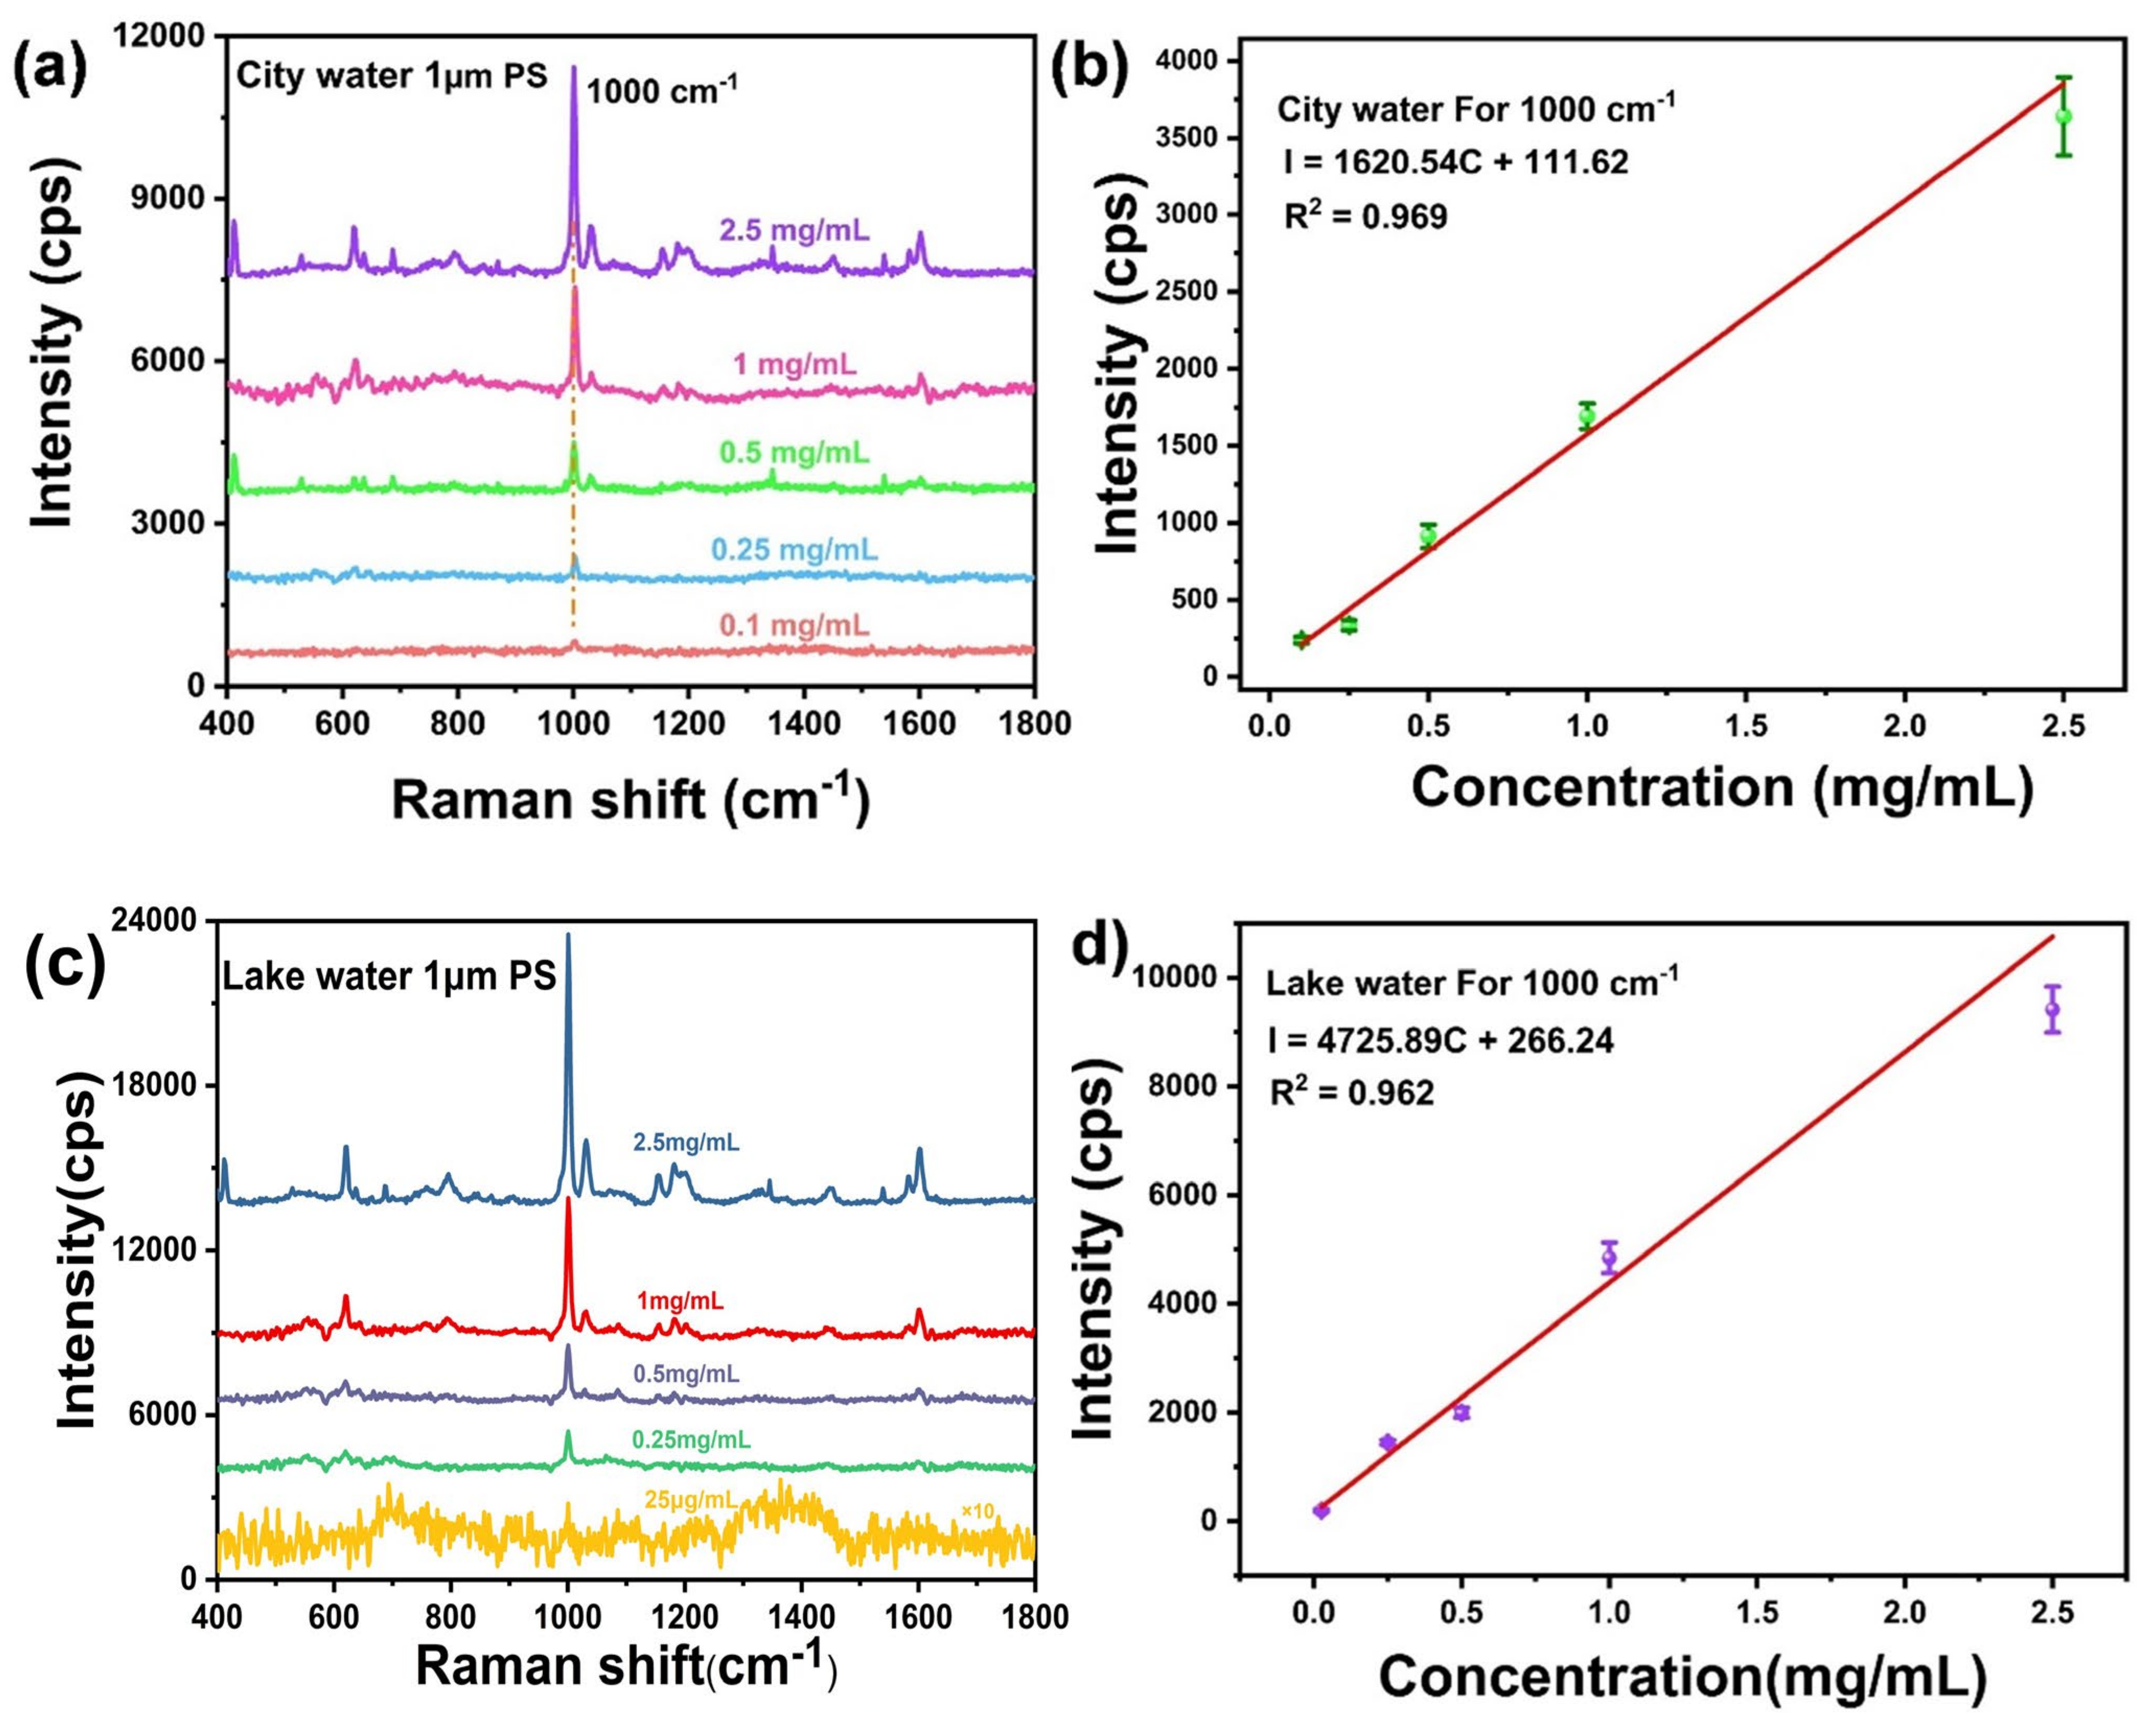
3.4. Practical SERS Detection of PS Nanospheres in Water Environment

Nowadays, plastic is widely used in various fields due to it being lightweight, versatile, durable, and of low cost. The widespread applications of plastics have led to increasingly frequent environmental pollution, with a large amount of plastic being diluted into soil and water environments. The degradation methods that exist are difficult to completely dislodge, and thus, the detection of residual plastics is an urgent need. The conventional methods for detecting microplastics include infrared and mass spectrometry, but due to the limited diffraction resolution of the instrument, the resolution is not as high. SERS is an efficient and sensitive detection method with low requirements for an aqueous phase. We have achieved qualitative detection of PS and PE in a mixture of PS and PE, as shown in Supplementary Materials. In this work, as proof of the concept, 1 µm of PS nanospheres was dispersed in city water and lake water to simulate practical detections. The pH of city water is 7.4, the mineral content is 0.1%, and the zinc and iron content is less than 0.2 µg/mL; the pH of the lake water is 7.5, and the mineral content is in the range of 1–35 g/L. Different concentrations of PS nanospheres were dropped onto the Co3O4/Co3S4/Ag substrate, and a coffee ring formed on the surface during the solution air-drying stage. Then, Raman measurements were carried out on the coffee ring using a portable Raman instrument. Figure 6a illustrates the SERS spectra of 1 µm PS nanosphere in city water, which shows that PS can be detected as low as 100 µg/mL. A nearly linear relation between the intensity of Raman and the concentration of the PS nanosphere was obtained when R2 was 0.969 (Figure 6b). In addition, when this SERS analytical method was used to detect PS nanospheres in the lake water, an even lower concentration of 25 µg/mL can be successfully detected (Figure 6c) and a linear concentration range (Figure 6d) with R2 of 0.962 can be obtained. It is suggested that the Co3O4/Co3S4/Ag substrate can be used to identify and quantify micro/nanoplastics quickly.

4. Conclusions

In conclusion, the Co3O4/Co3S4 heterojunction decorated with AgNPs was synthesized as the SERS substrate, and the real-world sample was detected quickly. The combination of plasmonic metal AgNPs and the semiconductor heterojunctions simultaneously increases SERS activity and amplifies SERS signals through electromagnetic and chemical enhancement. The SERS substrate has excellent SERS performance and is capable of detecting PS nanospheres from 1 µm to 100 nm, and it was found that large particle sizes generated higher SERS signals. Furthermore, the SERS sensor can be applied to analyze the PS nanospheres in actual lake water and city water samples at trace concentration levels with a good linear relationship. This SERS sensor with high sensitivity and homogeneity may provide a new detection platform for rapid qualitative and quantitative detection of micro/nanoplastics in water environments.

Supplementary Materials

The following supporting information can be downloaded at: https://www.mdpi.com/article/10.3390/chemosensors11090490/s1, Figure S1: SERS spectra of Co3O4/Co3S4/Ag and ZIF-67; Figure S2: Ultraviolet absorption spectra of Co3O4/AgNPs and Co3O4/Co3S4/AgNPs; Figure S3: SEM images of Co3O4/Co3S4/AgNPs; Figure S4: Raman spectrum for Co3O4/AgNPs and Co3O4/Co3S4/AgNPs substrates without analyte; Figure S5: SERS spectra of PS and PE mixture; Figure S6: SEM images of plastic particles with diameters of (a) 1 μm, 2.5 mg/mL, (b) 1 μm, 2 mg/mL and (c) 800 μm, 2.5 mg/mL; Figure S7: SEM image and SERS spectrum of 1 μm, 2.5 mg/mL PS on the substrate; Table S1: Size distribution histogram of AgNPs.

Author Contributions

Formal analysis, Y.S. and Y.W.; Investigation, Y.S.; Funding acquisition, M.Z.; Methodology, Z.B.; Project administration, Y.W.; Resources, Y.S. and Z.B.; Conceptualization, M.Z. and Y.W.; Validation, Y.S.; Writing, original draft, C.W.; Writing, review and editing, X.S., Z.B. and M.Z. All authors have read and agreed to the published version of the manuscript.

Funding

This work was financially supported by the National Natural Science Foundation of China (62275072), Key Research and Development Projects of Anhui Province (202104g01020009, 2022i01020024), and the Natural Science Foundation of Anhui Province (2208085MB35).

Acknowledgments

We thank the National Natural Science Foundation of China (62275072), Key Research and Development Projects of Anhui Province (202104g01020009, 2022i01020024), and the Natural Science Foundation of Anhui Province (2208085MB35).

Conflicts of Interest

The authors declare no conflict of interest.

References

  1. Sharma, S.; Basu, S.; Shetti, N.P.; Nadagouda, M.N.; Aminabhavi, T.M. Microplastics in the Environment: Occurrence, Perils, and Eradication. Chem. Eng. J. 2020, 408, 127317. [Google Scholar] [CrossRef]
  2. Kim, T.; Park, K.; Hong, J. Understanding the Hazards Induced by Microplastics in Different Environmental Conditions. J. Hazard. Mater. 2021, 424, 127630. [Google Scholar] [CrossRef]
  3. Dong, X.; Liu, X.; Hou, Q.; Wang, Z. From Natural Environment to Animal Tissues: A Review of Microplastics (Nanoplastics) Translocation and Hazards Studies. Sci. Total Environ. 2022, 855, 158686. [Google Scholar] [CrossRef]
  4. Lv, L.; He, L.; Jiang, S.; Chen, J.; Zhou, C.; Qu, J.; Lu, Y.; Hong, P.; Sun, S.; Li, C. In Situ Surface-Enhanced Raman Spectroscopy for Detecting Microplastics and Nanoplastics in Aquatic Environments. Sci. Total Environ. 2020, 728, 138449. [Google Scholar] [CrossRef]
  5. Mikac, L.; Rigó, I.; Himics, L.; Tolić, A.; Ivanda, M.; Veres, M. Surface-Enhanced Raman Spectroscopy for the Detection of Microplastics. Appl. Surf. Sci. 2022, 608, 155239. [Google Scholar] [CrossRef]
  6. Nayak, D.R.; Bhat, N.; Venkatapathi, M.; Umapathy, S. Signal Enhancement from Tunable SERS Substrates: Design and Demonstration of Multiple Regimes of Enhancement. J. Phys. Chem. C 2018, 122, 9134–9140. [Google Scholar] [CrossRef]
  7. Yue, T.; Li, S.; Xu, Y.; Zhang, X.; Huang, F. Interplay between Nanoparticle Wrapping and Clustering of Inner Anchored Membrane Proteins. J. Phys. Chem. B 2016, 120, 11000–11009. [Google Scholar] [CrossRef]
  8. Zhang, X.; Si, S.; Zhang, X.; Wu, W.; Xiao, X.; Jiang, C. Improved Thermal Stability of Graphene-Veiled Noble Metal Nanoarrays as Recyclable SERS Substrates. ACS Appl. Mater. Interfaces 2017, 9, 40726–40733. [Google Scholar] [CrossRef]
  9. Wang, Y.; Qiu, C.; Shen, C.; Li, L.; Yang, K.; Wei, Z.; Deng, H.-X.; Xia, C. Band Offset Trends in IV-VI Layered Semiconductor Heterojunctions. J. Phys. Condens. Matter 2022, 34, 195003. [Google Scholar] [CrossRef]
  10. Ma, L.; Zhang, Q.; Li, J.; Lu, X.; Gao, C.; Song, P.; Xia, L. Ag–ZnO Nanocomposites Are Used for SERS Substrates and Promote the Coupling Reaction of PATP. Materials 2021, 14, 922. [Google Scholar] [CrossRef]
  11. Kim, J.; Jang, Y.; Kim, N.-J.; Kim, H.; Yi, G.-C.; Shin, Y.; Kim, M.H.; Yoon, S. Study of Chemical Enhancement Mechanism in Non-Plasmonic Surface Enhanced Raman Spectroscopy (SERS). Front. Chem. 2019, 7, 582. [Google Scholar] [CrossRef] [PubMed]
  12. Lin, Y.; Liao, Y.; Chen, Z.; Connell, J.W. Holey Graphene: A Unique Structural Derivative of Graphene. Mater. Res. Lett. 2017, 5, 209–234. [Google Scholar] [CrossRef]
  13. Malaki, M.; Maleki, A.; Varma, R.S. MXenes and Ultrasonication. J. Mater. Chem. A 2019, 7, 10843–10857. [Google Scholar] [CrossRef]
  14. Jiang, Q.; Zhou, C.; Meng, H.; Han, Y.; Shi, X.; Zhan, C.; Zhang, R. Two-Dimensional Metal—Organic Framework Nanosheets: Synthetic Methodologies and Electrocatalytic Applications. J. Mater. Chem. A 2020, 8, 15271–15301. [Google Scholar] [CrossRef]
  15. Li, B.; Liu, Y.; Cheng, J. Facile Regulation of Shell Thickness of the Au@MOF Core-Shell Composites for Highly Sensitive Surface-Enhanced Raman Scattering Sensing. Sensors 2022, 22, 7039. [Google Scholar] [CrossRef] [PubMed]
  16. Sun, H.; Yu, B.; Pan, X.; Zhu, X.; Liu, Z. Recent Progress in Metal–Organic Frameworks-Based Materials toward Surface-Enhanced Raman Spectroscopy. Appl. Spectrosc. Rev. 2022, 57, 513–528. [Google Scholar] [CrossRef]
  17. Chen, Y.; Zhu, L.; Yang, Y.; Wu, D.; Zhang, Y.; Cheng, W.; Tang, X. Fabrication of a Metal Organic Framework (MOF)—Modified Au Nanoparticle Array for Sensitive and Stable SERS Sensing of Paraquat in Cereals. J. Food Sci. 2023, 88, 1769–1780. [Google Scholar] [CrossRef]
  18. Sun, Y.; Yu, X.; Hu, J.; Zhuang, X.; Wang, J.; Qiu, H.; Ren, H.; Zhang, S.; Zhang, Y.; Hu, Y. Constructing a Highly Sensitivity SERS Sensor Based on a Magnetic Metal—Organic Framework (MOF) to Detect the Trace of Thiabendazole in Fruit Juice. ACS Sustain. Chem. Eng. 2022, 10, 8400–8410. [Google Scholar] [CrossRef]
  19. Li, D.; Cao, X.; Zhang, Q.; Ren, X.; Jiang, L.; Li, D.; Deng, W.; Liu, H. Facile in Situ Synthesis of Core—Shell MOF@Ag Nanoparticle Composites on Screen-Printed Electrodes for Ultrasensitive SERS Detection of Polycyclic Aromatic Hydrocarbons. J. Mater. Chem. A 2019, 7, 14108–14117. [Google Scholar] [CrossRef]
  20. Zheng, G.; de Marchi, S.; López-Puente, V.; Sentosun, K.; Polavarapu, L.; Pérez-Juste, I.; Hill, E.H.; Bals, S.; Liz-Marzán, L.M.; Pastoriza-Santos, I.; et al. Encapsulation of Single Plasmonic Nanoparticles within ZIF-8 and SERS Analysis of the MOF Flexibility. Small 2016, 12, 3935–3943. [Google Scholar] [CrossRef]
  21. Huang, C.; Li, A.; Chen, X.; Wang, T. Understanding the Role of Metal—Organic Frameworks in Surface-Enhanced Raman Scattering Application. Small 2020, 16, 2004802. [Google Scholar] [CrossRef] [PubMed]
  22. Shu, T.; Wang, H.; Li, Q.; Feng, Z.; Wei, F.; Yao, K.; Sun, Z.; Qi, J.; Sui, Y. Highly stable Co3O4 nanoparticles/carbon nanosheets array derived from flake-like ZIF-67 asan advanced electrode for supercapacacitor. Chem. Eng. J. 2021, 419, 129631. [Google Scholar] [CrossRef]
  23. Zhang, M.; Meng, J.; Wang, D.; Tang, Q.; Chen, T.; Rong, S.; Liu, J.; Wu, Y. Biomimetic Synthesis of Hierarchical 3D Ag Butterfly Wing Scale Arrays/Graphene Composites as Ultrasensitive SERS Substrates for Efficient Trace Chemical Detection. J. Mater. Chem. C 2018, 6, 1933–1943. [Google Scholar] [CrossRef]
  24. Zhao, Q.; Zheng, Y.; Song, C.; Liu, Q.; Ji, N.; Ma, D.; Lu, X. Novel Monolithic Catalysts Derived from In-Situ Decoration of Co3O4 and Hierarchical Co3O4@MnOx on Ni Foam for VOC Oxidation. Appl. Catal. B Environ. 2019, 265, 118552. [Google Scholar] [CrossRef]
  25. Tang, S.; Wang, X.; Zhang, Y.; Courté, M.; Fan, H.J.; Fichou, D. Combining Co3S4 and Ni:Co3S4 Nanowires as Efficient Catalysts for Overall Water Splitting: An Experimental and Theoretical Study. Nanoscale 2018, 11, 2202–2210. [Google Scholar] [CrossRef] [PubMed]
  26. Zhang, L.; Weng, Y.-J.; Liu, X.; Gu, W.; Zhang, X.; Han, L. Fe(III) Mixed IP6@Au NPs with Enhanced SERS Activity for Detection of 4-ATP. Sci. Rep. 2020, 10, 5752. [Google Scholar] [CrossRef] [PubMed]
  27. Chen, Q.; Qin, L.; Shi, C.; Kang, S.-Z.; Li, X. A Stable and Plug-and-Play Aluminium/Titanium Dioxide/Metal-Organic Framework/Silver Composite Sheet for Sensitive Raman Detection and Photocatalytic Removal of 4-Aminothiophenol. Chemosphere 2021, 282, 131000. [Google Scholar] [CrossRef]
  28. Cao, J.; Zhao, D.; Mao, Q. A Highly Reproducible and Sensitive Fiber SERS Probe Fabricated by Direct Synthesis of Closely Packed AgNPs on the Silanized Fiber Taper†. Analyst 2017, 142, 596–602. [Google Scholar] [CrossRef]
  29. Wang, Q.; Xu, H.; Qian, X.; He, G.; Chen, H. Oxygen and Sulfur Dual Vacancy Engineering on a 3D Co3O4/Co3S4 Heterostructure to Improve Overall Water Splitting Activity. Green Chem. 2022, 24, 9220–9232. [Google Scholar] [CrossRef]
  30. Lin, P.-Y.; Wu, I.-H.; Tsai, C.-Y.; Kirankumar, R.; Hsieh, S. Detecting the release of plastic particles in packaged drinking water under simulated light irradiation using surface-enhanced Raman spectroscopy. Anal. Chim. Acta 2022, 1198, 339516. [Google Scholar] [CrossRef]
  31. Yan, Y.; Li, K.; Chen, X.; Yang, Y.; Lee, J.-M. Heterojunction-Assisted Co3S4@Co3O4 Core—Shell Octahedrons for Supercapacitors and Both Oxygen and Carbon Dioxide Reduction Reactions. Small 2017, 13, 1701724. [Google Scholar] [CrossRef] [PubMed]
  32. Wang, X.; Liu, C.; Li, Q.; Li, H.; Xu, J.; Chu, X.; Zhang, L.; Zhao, G.; Li, H.; Guo, P.; et al. 3D Heterogeneous Co3O4@Co3S4 Nanoarrays Grown on Ni Foam as a Binder-Free Electrode for Lithium-Ion Batteries. ChemElectroChem 2017, 5, 309–315. [Google Scholar] [CrossRef]
  33. Qin, Y.; Qiu, J.; Tang, N.; Wu, Y.; Yao, W.; He, Y. Controllable Preparation of Mesoporous Spike Gold Nanocrystals for Surface-Enhanced Raman Spectroscopy Detection of Micro/Nanoplastics in Water. Environ. Res. 2023, 228, 115926. [Google Scholar] [CrossRef] [PubMed]
  34. Jeon, Y.; Kim, D.; Kwon, G.; Lee, K.; Oh, C.-S.; Kim, U.-J.; You, J. Detection of Nanoplastics Based on Surface-Enhanced Raman Scattering with Silver Nanowire Arrays on Regenerated Cellulose Films. Carbohydr. Polym. 2021, 272, 118470. [Google Scholar] [CrossRef]
  35. Chang, L.; Jiang, S.; Luo, J.; Zhang, J.F.; Liu, X.H.; Lee, C.-Y.; Zhang, W. Nanowell-Enhanced Raman Spectroscopy Enables the Visualization and Quantification of Nanoplastics in the Environment. Environ. Sci. Nano 2022, 9, 54. [Google Scholar] [CrossRef]
Figure 1. Illustration of the preparation of Co3O4/Co3S4/Ag substrate and schematic diagram of SERS sensor for micro/nanoplastic detections.
Chemosensors 11 00490 g001
Figure 2. (a) SEM images of ZIF-67; (b) Co3O4 derived from the Co-MOF; (c) Co3O4/Co3S4 heterojunction, (d) Co3O4/Co3S4/AgNPs; (e) XRD patterns of the as-synthesized samples; (f) TEM image of Co3O4/Co3S4; (g) HRTEM image of Co3O4/Co3S4, (h) the SAED pattern of the Co3O4/Co3S4; (i) elemental mapping of Co3O4/Co3S4/AgNPs nanosheet.
Chemosensors 11 00490 g002
Figure 3. (a) SERS spectra of 4-ATP (10−6 M) on Co3O4/AgNPs and Co3O4/Co3S4/AgNPs; (b) SERS responses of 4-ATP absorbed on the Co3O4/Co3S4/AgNPs substrate prepared at different AgNO3 concentrations; SEM images of Co3O4/Co3S4 decorated with AgNPs at different AgNO3 concentrations of (c) 200 mM, (d) 150 mM, (e) 100 mM and (f) 50 mM.
Chemosensors 11 00490 g003
Figure 4. SERS spectra of PS dispersed on the Co3O4/Co3S4/Ag substrate from 20 diverse points and the RSD values of peaks at 1000 cm−1, 1302 cm−1, and 1605 cm−1.
Chemosensors 11 00490 g004
Figure 5. (a) SERS intensity of PS with different particle sizes under the same concentration; SERS intensity of PS with different concentration gradients on Co3O4/Co3S4/Ag substrate: (b) 1 µm, (c) 800 nm, (d) 400 nm, (e) 200 nm, and (f) 100 nm.
Chemosensors 11 00490 g005
Figure 6. SERS spectra of PS nanospheres from city water (a) and lake water (c) on the Co3O4/Co3S4/Ag substrate; (b,d) corresponding linear relationship between Raman intensity and PS concentrations.
Chemosensors 11 00490 g006
Disclaimer/Publisher’s Note: The statements, opinions and data contained in all publications are solely those of the individual author(s) and contributor(s) and not of MDPI and/or the editor(s). MDPI and/or the editor(s) disclaim responsibility for any injury to people or property resulting from any ideas, methods, instructions or products referred to in the content.

