Article

Improved Recognition Accuracy of Myrrh Decoction Pieces by Electronic Nose Technology Using GC-MS Analysis and Sensor Selection

1
Faculty of Pharmacy, Guangxi University of Chinese Medicine, Nanning 530200, China
2
Guangxi Key Laboratory of Efficacy Study on Chinese Materia Medica, Guangxi University of Chinese Medicine, Nanning 530200, China
3
Guangxi Collaborative Innovation Center of Research on Functional Ingredients of Agricultural Residues, Guangxi University of Chinese Medicine, Nanning 530200, China
4
Guangxi Key Laboratory of TCM Formulas Theory and Transformation for Damp Diseases, Guangxi University of Chinese Medicine, Nanning 530200, China
5
College of Electrical Engineering, Henan University of Technology, Zhengzhou 450001, China
*
Author to whom correspondence should be addressed.
Chemosensors 2023, 11(7), 396; https://doi.org/10.3390/chemosensors11070396
Submission received: 16 June 2023 / Revised: 9 July 2023 / Accepted: 10 July 2023 / Published: 14 July 2023
(This article belongs to the Section Applied Chemical Sensors)

Abstract

:
The quality of myrrh decoction pieces can be influenced by factors such as origin, source, and processing methods. The quality of myrrh in the market varies greatly, and adulteration is a serious issue, highlighting the urgent need for improved quality control measures. This study explores the integration of GC–MS analysis and sensor selection in electronic nose technology for the improved classification of myrrh decoction pieces. GC–MS analysis revealed the presence of 130 volatile compounds in the six myrrh samples, primarily composed of alkene compounds, and each sample exhibited variations in composition. An electronic nose system was designed using a sensor array consisting of six sensors selected from twelve sensors capable of detecting volatile compounds consistent with myrrh composition, including WO3 quantum dots, Fe2O3 hollow nanorods, ZnFe2O4 nanorods, SnO2 nanowires, and two commercially available sensors. The sensors exhibited distinct response patterns to the myrrh samples, indicating their suitability for myrrh analysis. Various sensor parameters, including response, response and recovery time, integral area, and slope, were computed to characterize the sensors’ performance. These parameters provided valuable insight into the sensor–gas interactions and the unique chemical profiles of the myrrh samples. The LDA model demonstrated high accuracy in differentiating between the myrrh types, utilizing the discriminative features captured by the sensor array, with a classification accuracy of 90% on the testing set. This research provides a comprehensive evaluation method for the quality control of myrrh pieces and a scientific basis for the development and utilization of myrrh.

Graphical Abstract

1. Introduction

Myrrh is the dry resin from Commiphora myrrha Engl. or Commiphora molmol Engl, which grows in arid regions of the Middle East, Africa, and Asia [1]. Myrrh has been widely used in traditional medicine for thousands of years for its anti-inflammatory, analgesic, antimicrobial, and antioxidant properties [2,3]. In traditional Chinese medicine, myrrh has been used to treat various conditions, including abdominal pain, dysmenorrhea, and traumatic injuries [4]. In China, the annual demand for myrrh exceeds 3000 tons, as it is primarily used as a raw material for traditional Chinese medicine in the field of orthopedics [5]. Vinegar Myrrh is commonly included in prescriptions at outpatient pharmacies. In the herbal market, myrrh is sold in different grades based on criteria, such as impurities, total ash content, and levels of volatile oil, with significant price differences [6,7].
However, many factors affect the intrinsic quality of myrrh. These include the inorganic and trace elements present in the plant’s growth soil, the harvesting time, processing methods at the origin, and storage techniques, all of which have a significant impact on the volatile components [8]. The quality of myrrh in the circulating market varies greatly, and the prevalence of adulteration contributes to serious counterfeit issues, highlighting the urgent need to improve its quality control indicators [9]. Therefore, it is necessary to identify and standardize the different types of myrrh.
Myrrh is a complex mixture of volatile and non-volatile compounds, and different types of myrrh often possess distinct volatile gases. Therefore, the differentiation of myrrh can be achieved by detecting these volatile gases [10,11,12]. Sensory evaluation is subjective and experience-based, which limits its reliability. Currently, several analytical methods, including high-performance liquid chromatography (HPLC), gas chromatography (GC), and mass spectrometry (MS), have been used to identify and quantify the chemical components of myrrh [13,14,15]. However, these methods require complex sample preparation and can be time-consuming and expensive.
Recently, electronic nose (e-nose) technology has emerged as a promising alternative for identifying and characterizing complex mixtures of volatile compounds [16,17]. E-nose technology is based on an array of sensors that detect and discriminate between different volatile compounds based on their unique odor profiles. E-nose technology has been successfully applied in various fields, including food, environmental monitoring, and medical diagnosis [18,19,20]. However, due to the unclear composition of the volatile gas in myrrh, it is necessary to try various gas sensors and ultimately choose sensors that have a high response to myrrh. This inevitably leads to the blind selection of electronic nose sensors [21,22,23]. Therefore, determining the volatile components of myrrh through techniques like gas chromatography-mass spectrometry (GC–MS) analysis and selectively choosing sensors for the electronic nose based on the results will contribute to improving the accuracy of electronic nose recognition [24,25].
This paper aims to utilize e-nose technology in conjunction with GC–MS analysis to identify and classify different types of myrrh samples. A sensor array consisting of six sensor types, including WO3 quantum dots, Fe2O3 hollow nanorods, ZnFe2O4 nanorods, SnO2 nanowires, and two commercially available sensors, was constructed to develop the e-nose system. By analyzing four characteristic parameters of the sensor response curve, namely sensitivity, response and recovery time, integral area, and slope, this study seeks to achieve effective discrimination among the six myrrh samples. The Linear Discriminant Analysis (LDA) algorithm was employed to enhance the differentiation capabilities of the e-nose system. This investigation demonstrates the feasibility of e-nose technology in identifying and standardizing different myrrh types, offering a novel approach for the quality evaluation and standardization of myrrh. The findings have the potential to revolutionize the quality assessment and standardization of myrrh, providing a valuable contribution to the field of traditional Chinese medicine.

2. Experimental Section

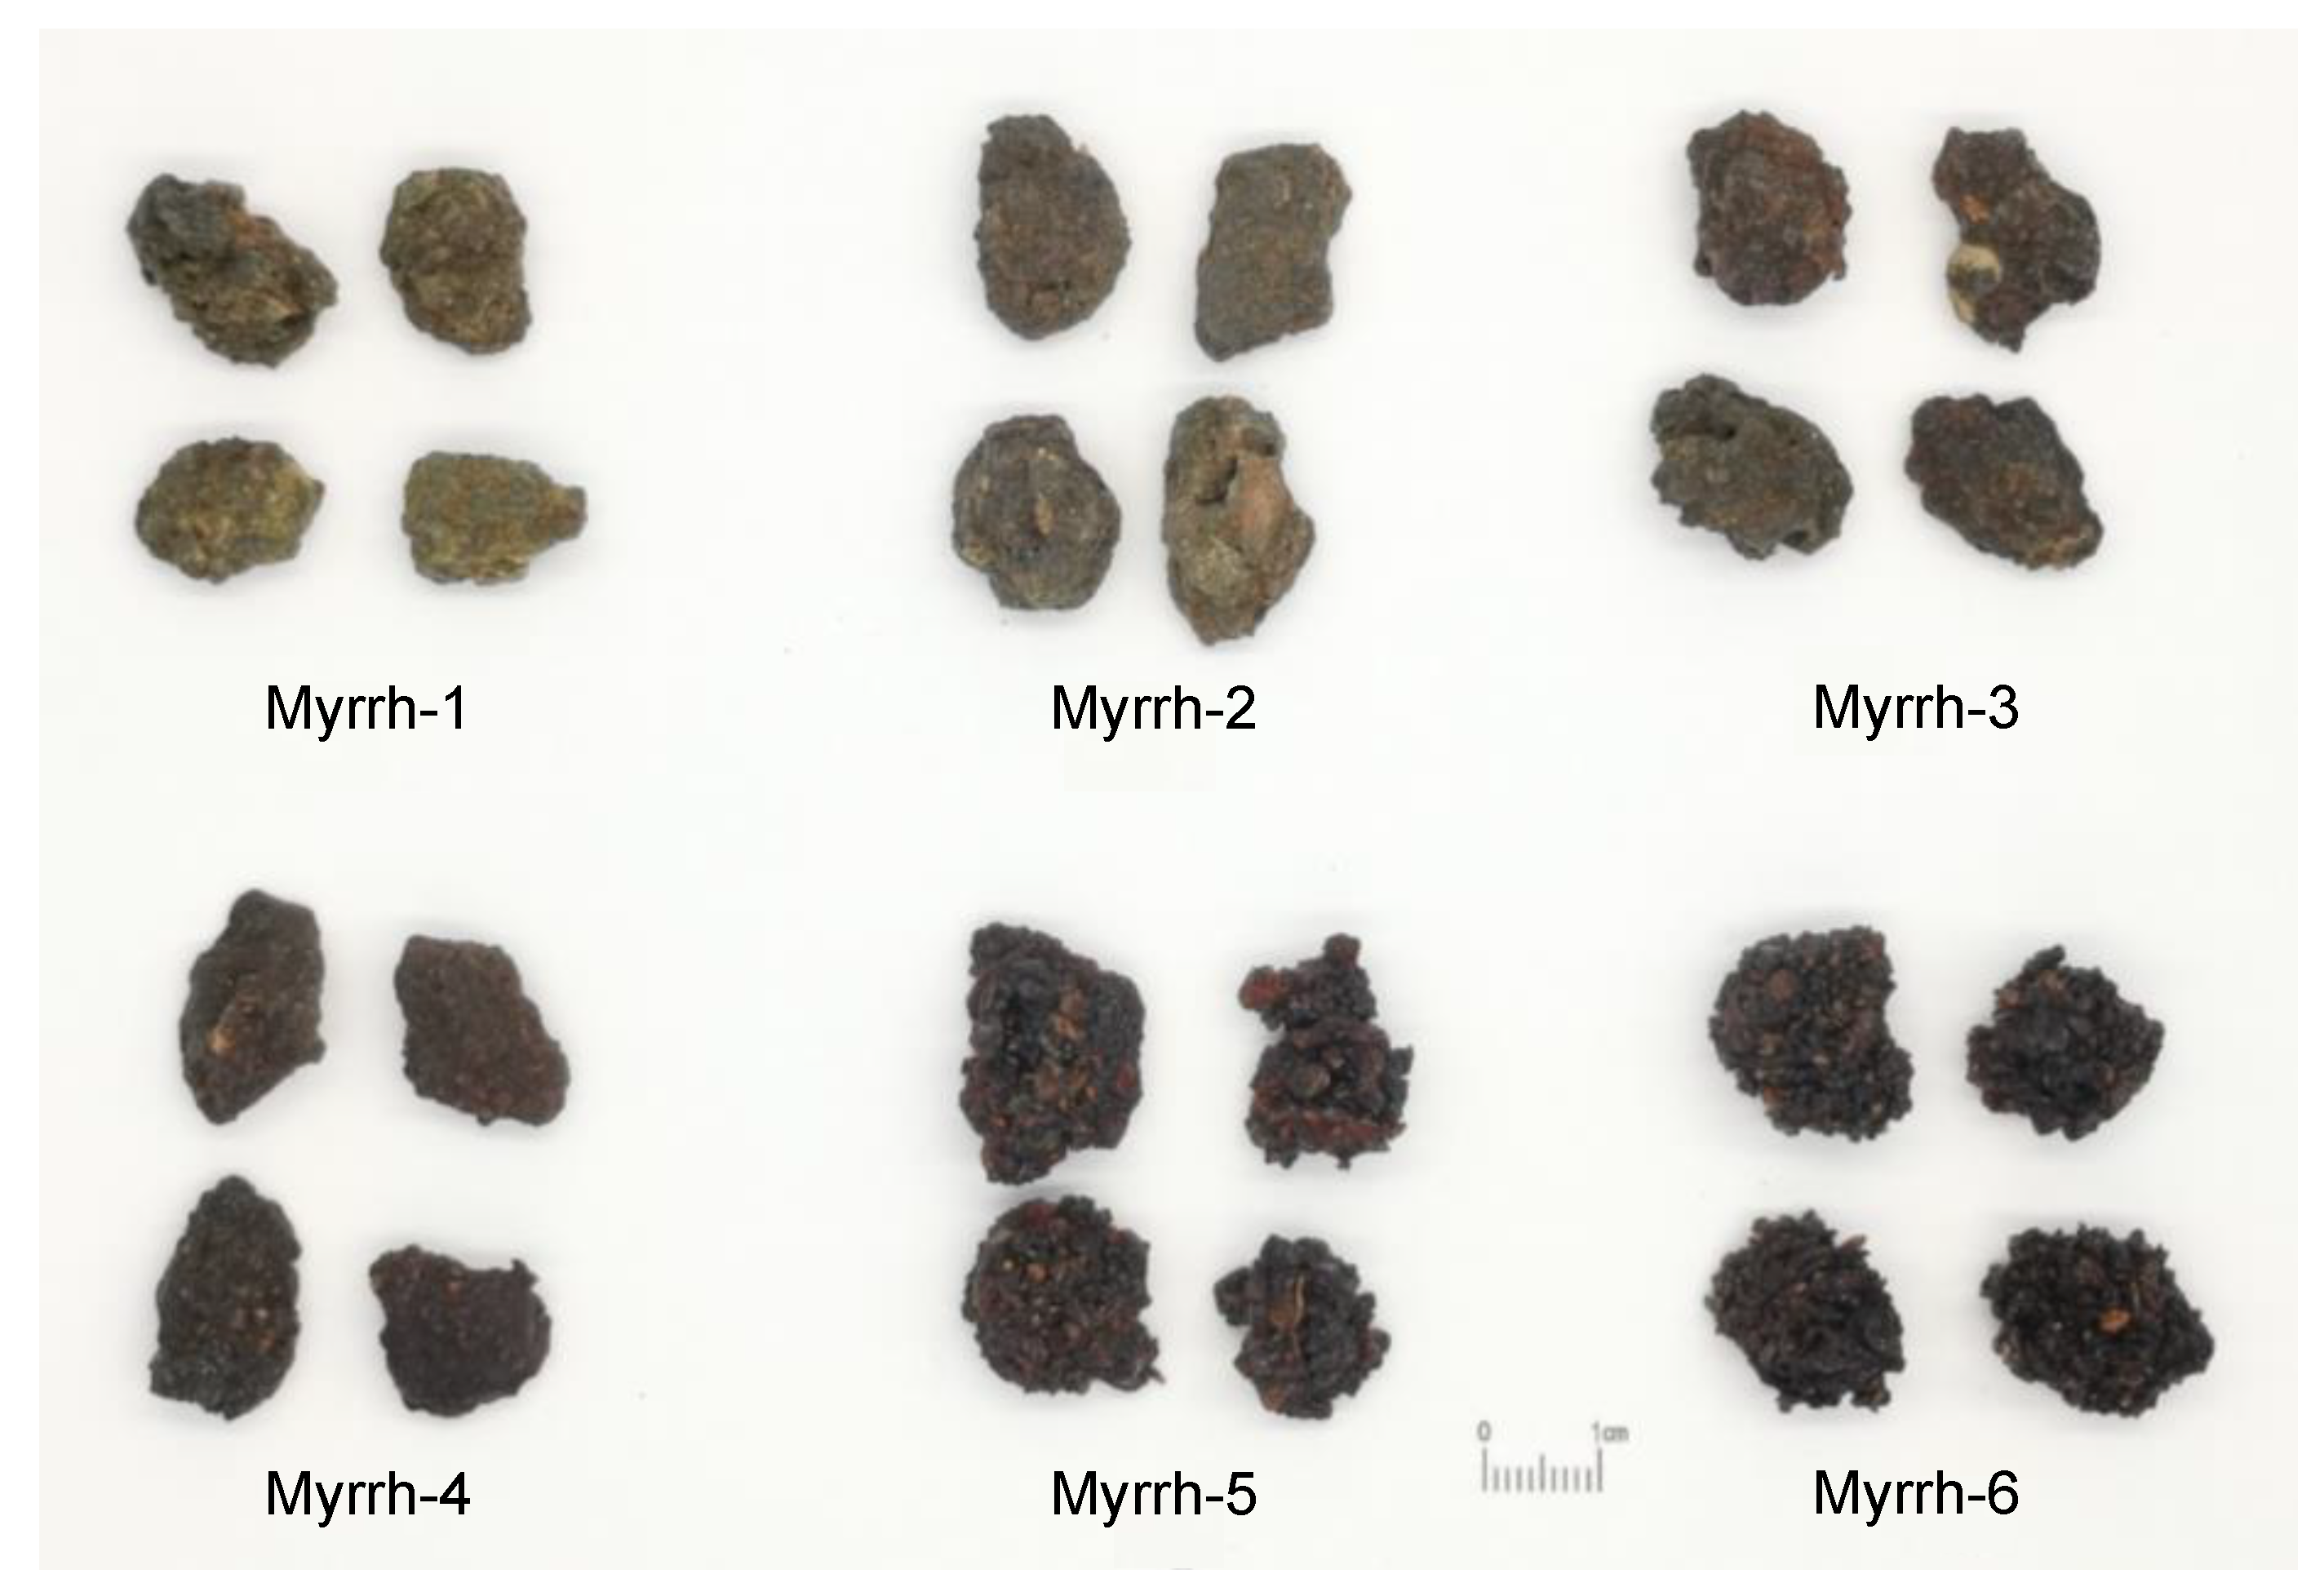
2.1. Preparation of Myrrh

The myrrh was purchased from Jiangxi Guhan Refined Traditional Chinese Medicine Pieces Co., Ltd. (Nanchang, China). It includes Somali gum myrrh, Somali natural myrrh, grade A Kenyan natural myrrh, and grade B Kenyan natural myrrh. Purified raw myrrh was taken, and the drugs were poured into a frying container, which was then used to fry them with mild fire until the drugs smoked and became slightly melted. Then, a certain amount of rice vinegar was evenly sprinkled on the drugs’ surface, and they were fried with mild fire until a greasy luster was shown. After that, they were quickly taken out and spread out to air in order to become dry. By following this process, vinegar-treated myrrh could be obtained. By vinegar-treating the myrrh from both Kenyan grades, a total of six types of myrrh pieces were obtained: Somali gum myrrh, Somali natural myrrh, grade A Kenyan natural myrrh, grade B Kenyan natural myrrh, grade A Kenyan vinegar-treated myrrh, and grade B Kenyan vinegar-treated myrrh. They were respectively named as Myrrh-1, Myrrh-2, Myrrh-3, Myrrh-4, Myrrh-5, and Myrrh-6. The pictures of six types of myrrh are shown in Figure 1. Although different types of myrrh have different colors, it is difficult to accurately identify each type of myrrh based solely on its color. The variation in color can be influenced by factors such as the origin, age, and processing methods of the myrrh samples. Therefore, a comprehensive analysis of the volatile compounds present in the myrrh samples is necessary to understand the differences in their volatile gases and potential medicinal properties.

2.2. GC-MS Analysis Procedure

The six types of myrrh samples were analyzed using a gas chromatography–mass spectrometry (GC–MS) system to determine the volatile gas components of each sample. Firstly, dry block-shaped myrrh was crushed into powder, and then 50 g of each type of myrrh was weighed and sealed in a glass bottle and stored at room temperature for further GC–MS testing. Myrrh volatile gases were extracted using solid-phase microextraction (SPME). The SPME fiber was exposed to the headspace of myrrh samples for 30 min and then desorbed in the GC injector for analysis. The GC–MS analysis was performed on an Agilent 7890A GC system coupled with a 5975C mass selective detector. Helium was used as the carrier gas with a flow rate of 1.0 mL/min. The GC temperature was initially held at 50 °C for 2 min, then increased to 300 °C at a rate of 10 °C/min and held for 10 min. The injection temperature was 250 °C, and the injection volume was 1 μL. The mass spectrometer was operated in electron ionization (EI) mode with an ionization energy of 70 eV. The scanning range was from 30 amu to 350 amu. The identification of the volatile compounds was performed using the National Institute of Standards and Technology (NIST) Mass Spectral Library and verified by comparing the retention times and mass spectra with authentic standards.

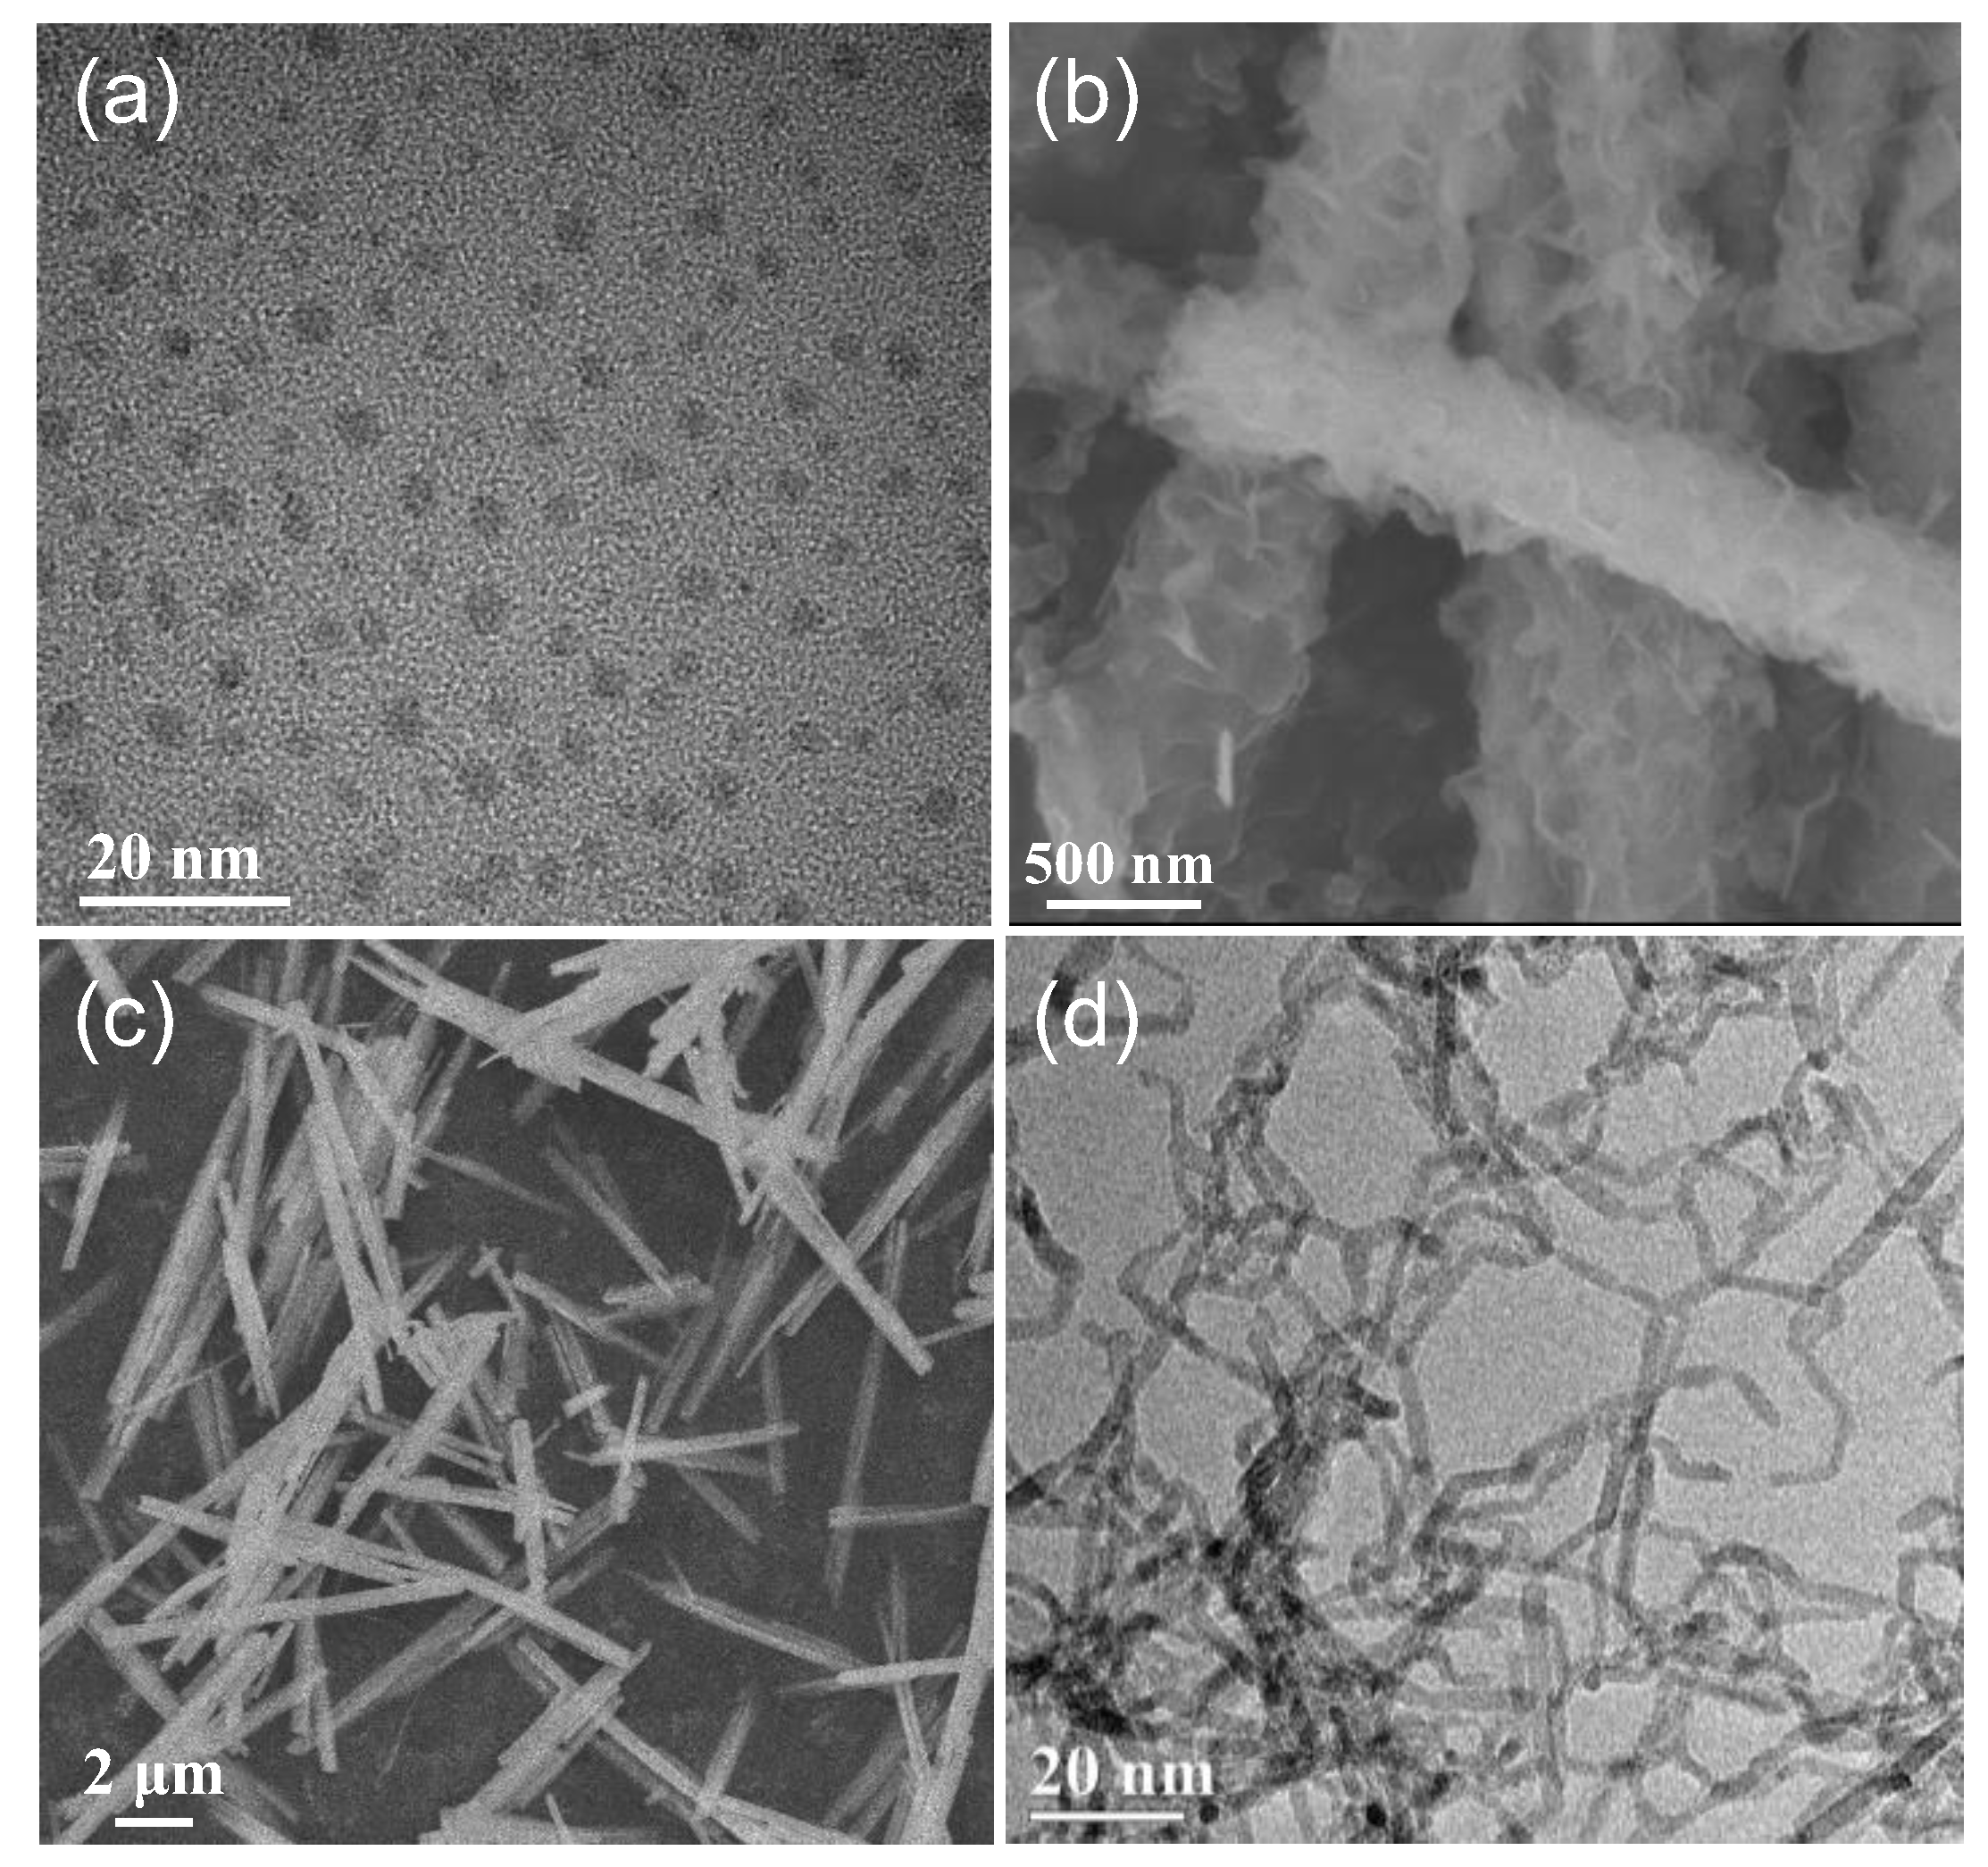
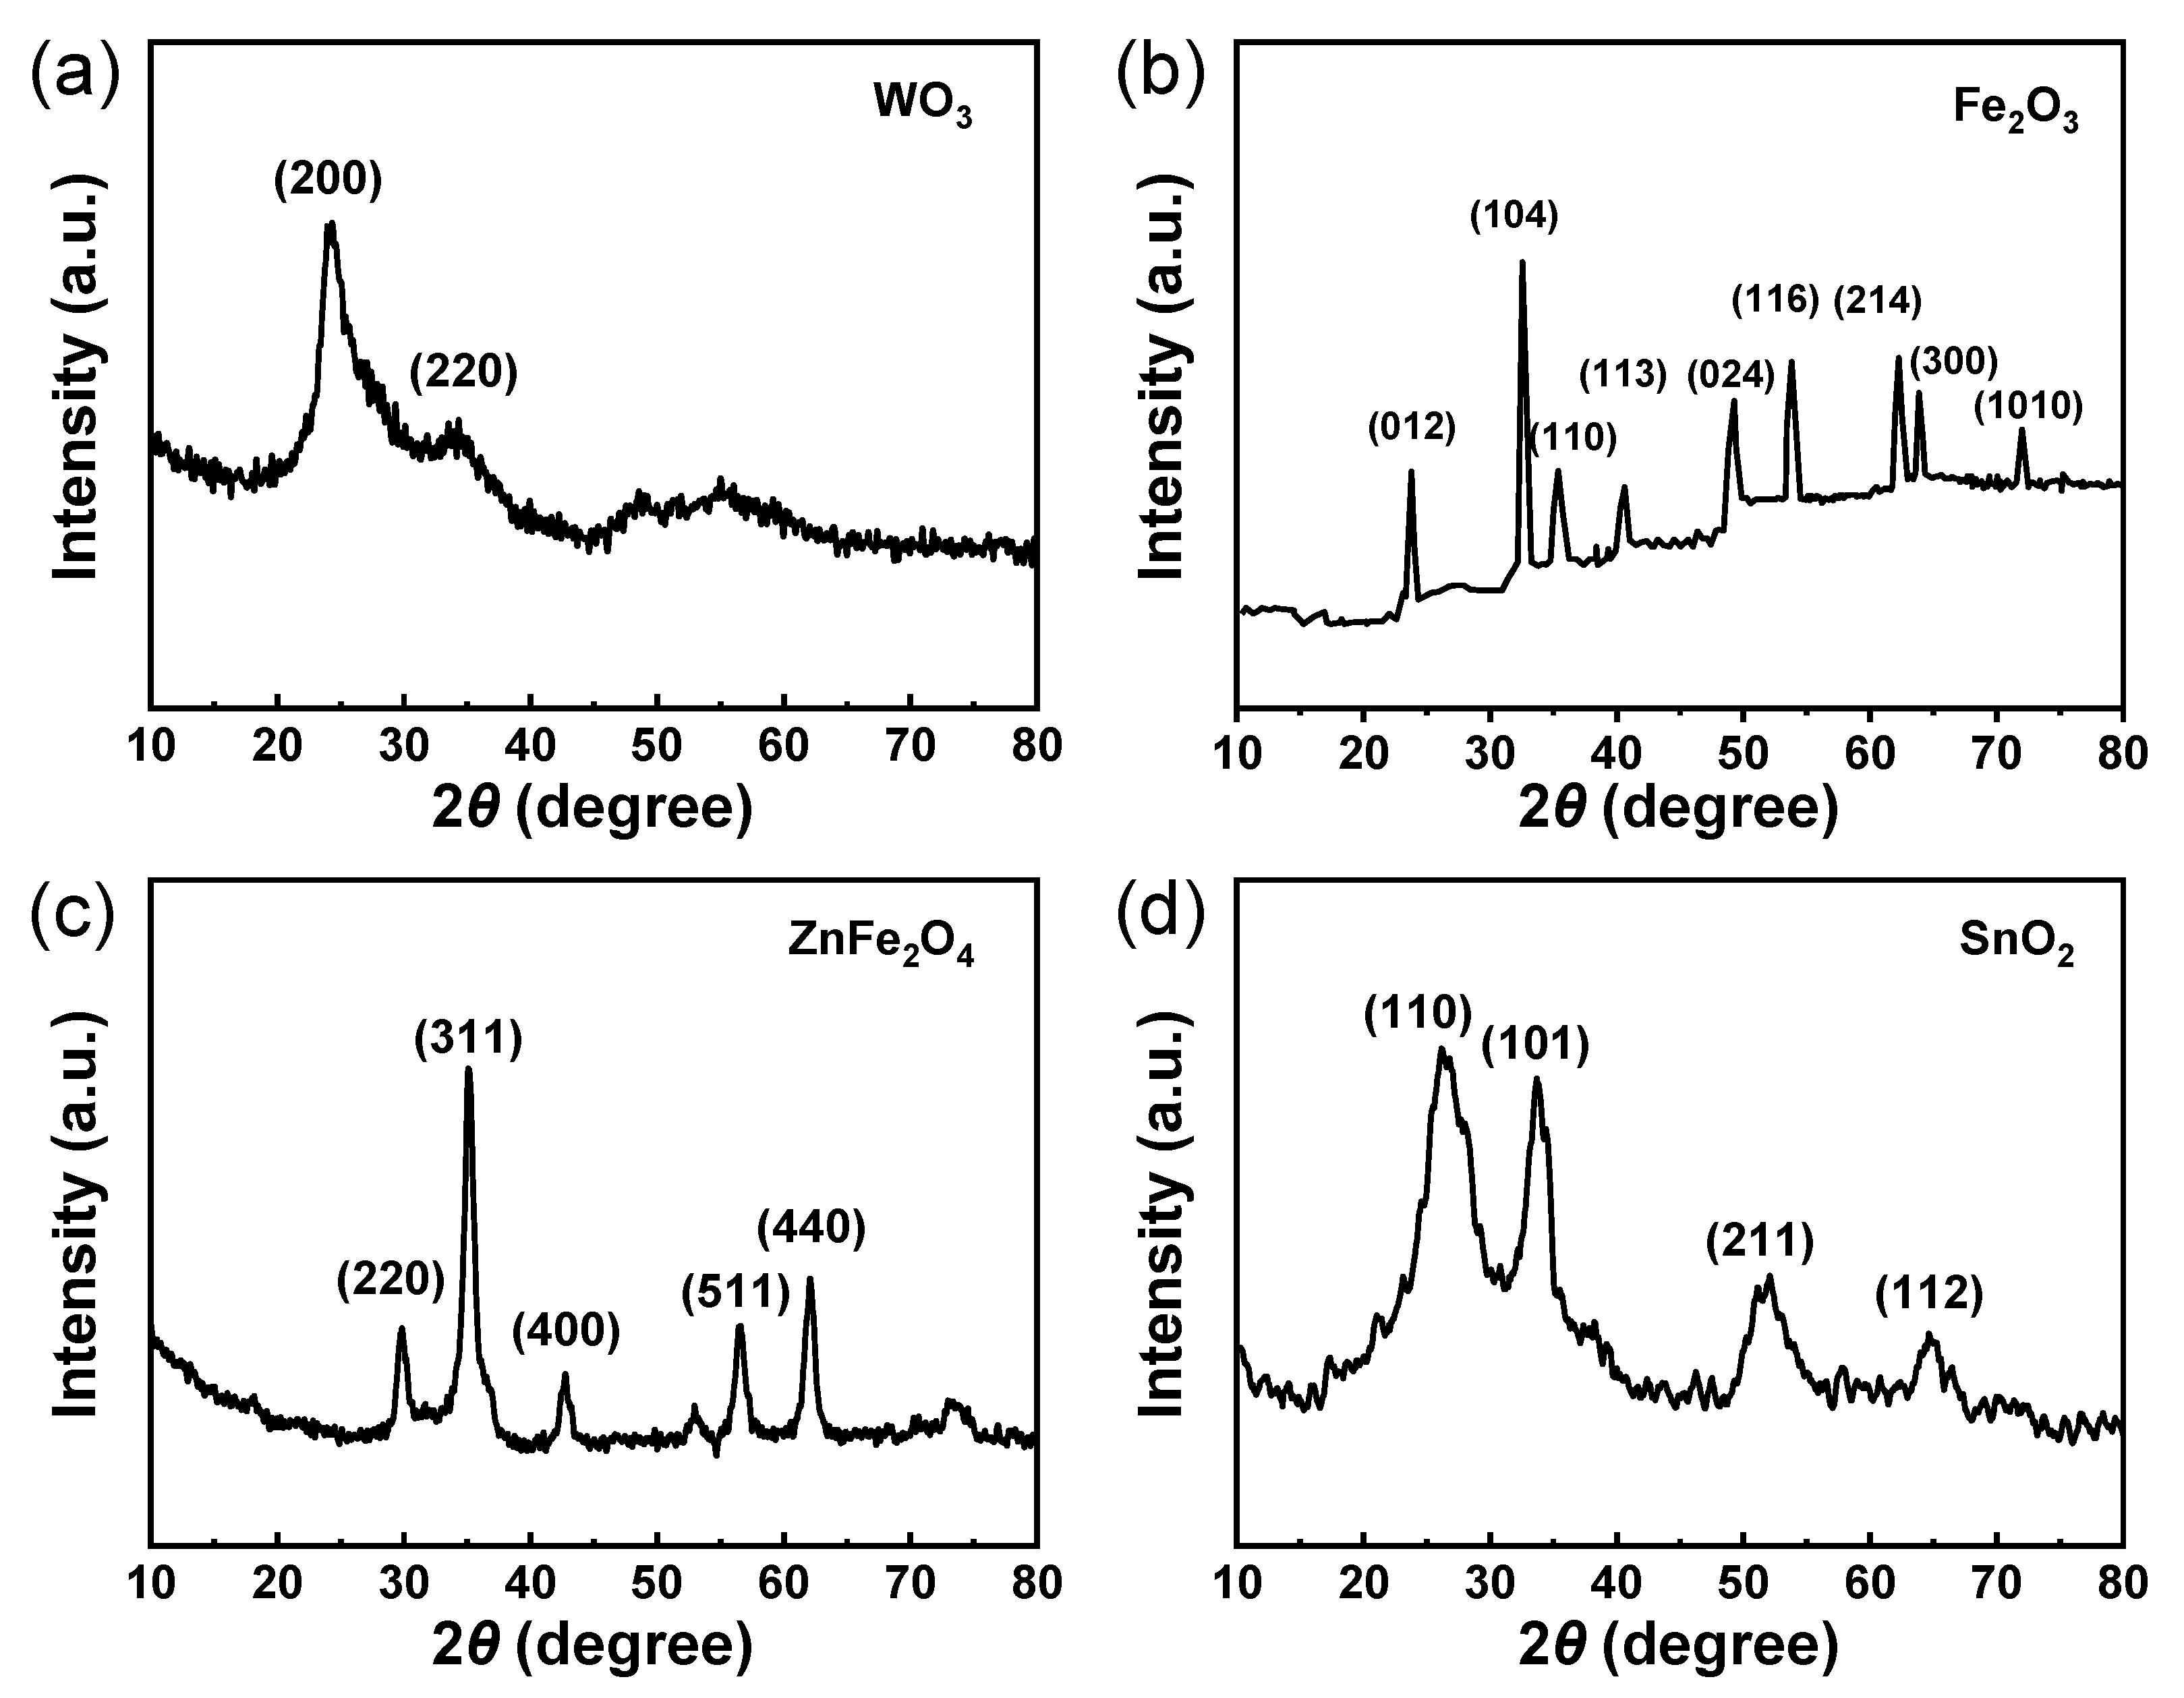
2.3. Sensor Array Fabrication

Substrate Preparation: The sensor substrate was purchased from Winson (Zhengzhou, China). The substrate was first cleaned with a mixture of acetone and isopropyl alcohol, followed by rinsing with deionized water and drying with nitrogen gas.
Sensor Deposition: The detailed preparation methods for these materials can be found in the Supplementary Information. The sensor materials, including WO3 quantum dots, Fe2O3 hollow nanorods, ZnFe2O4 nanorods, and SnO2 nanowires, were deposited on the prepared substrates by the spin-coating method. TGS2610 and TGS2620 sensors were purchased from Figaro (Tokyo, Japan).
Sensor Configuration: The six sensors were arranged in a regular pattern on the substrate to form the sensor array. The spacing between the sensors was optimized to ensure proper sensing performance.

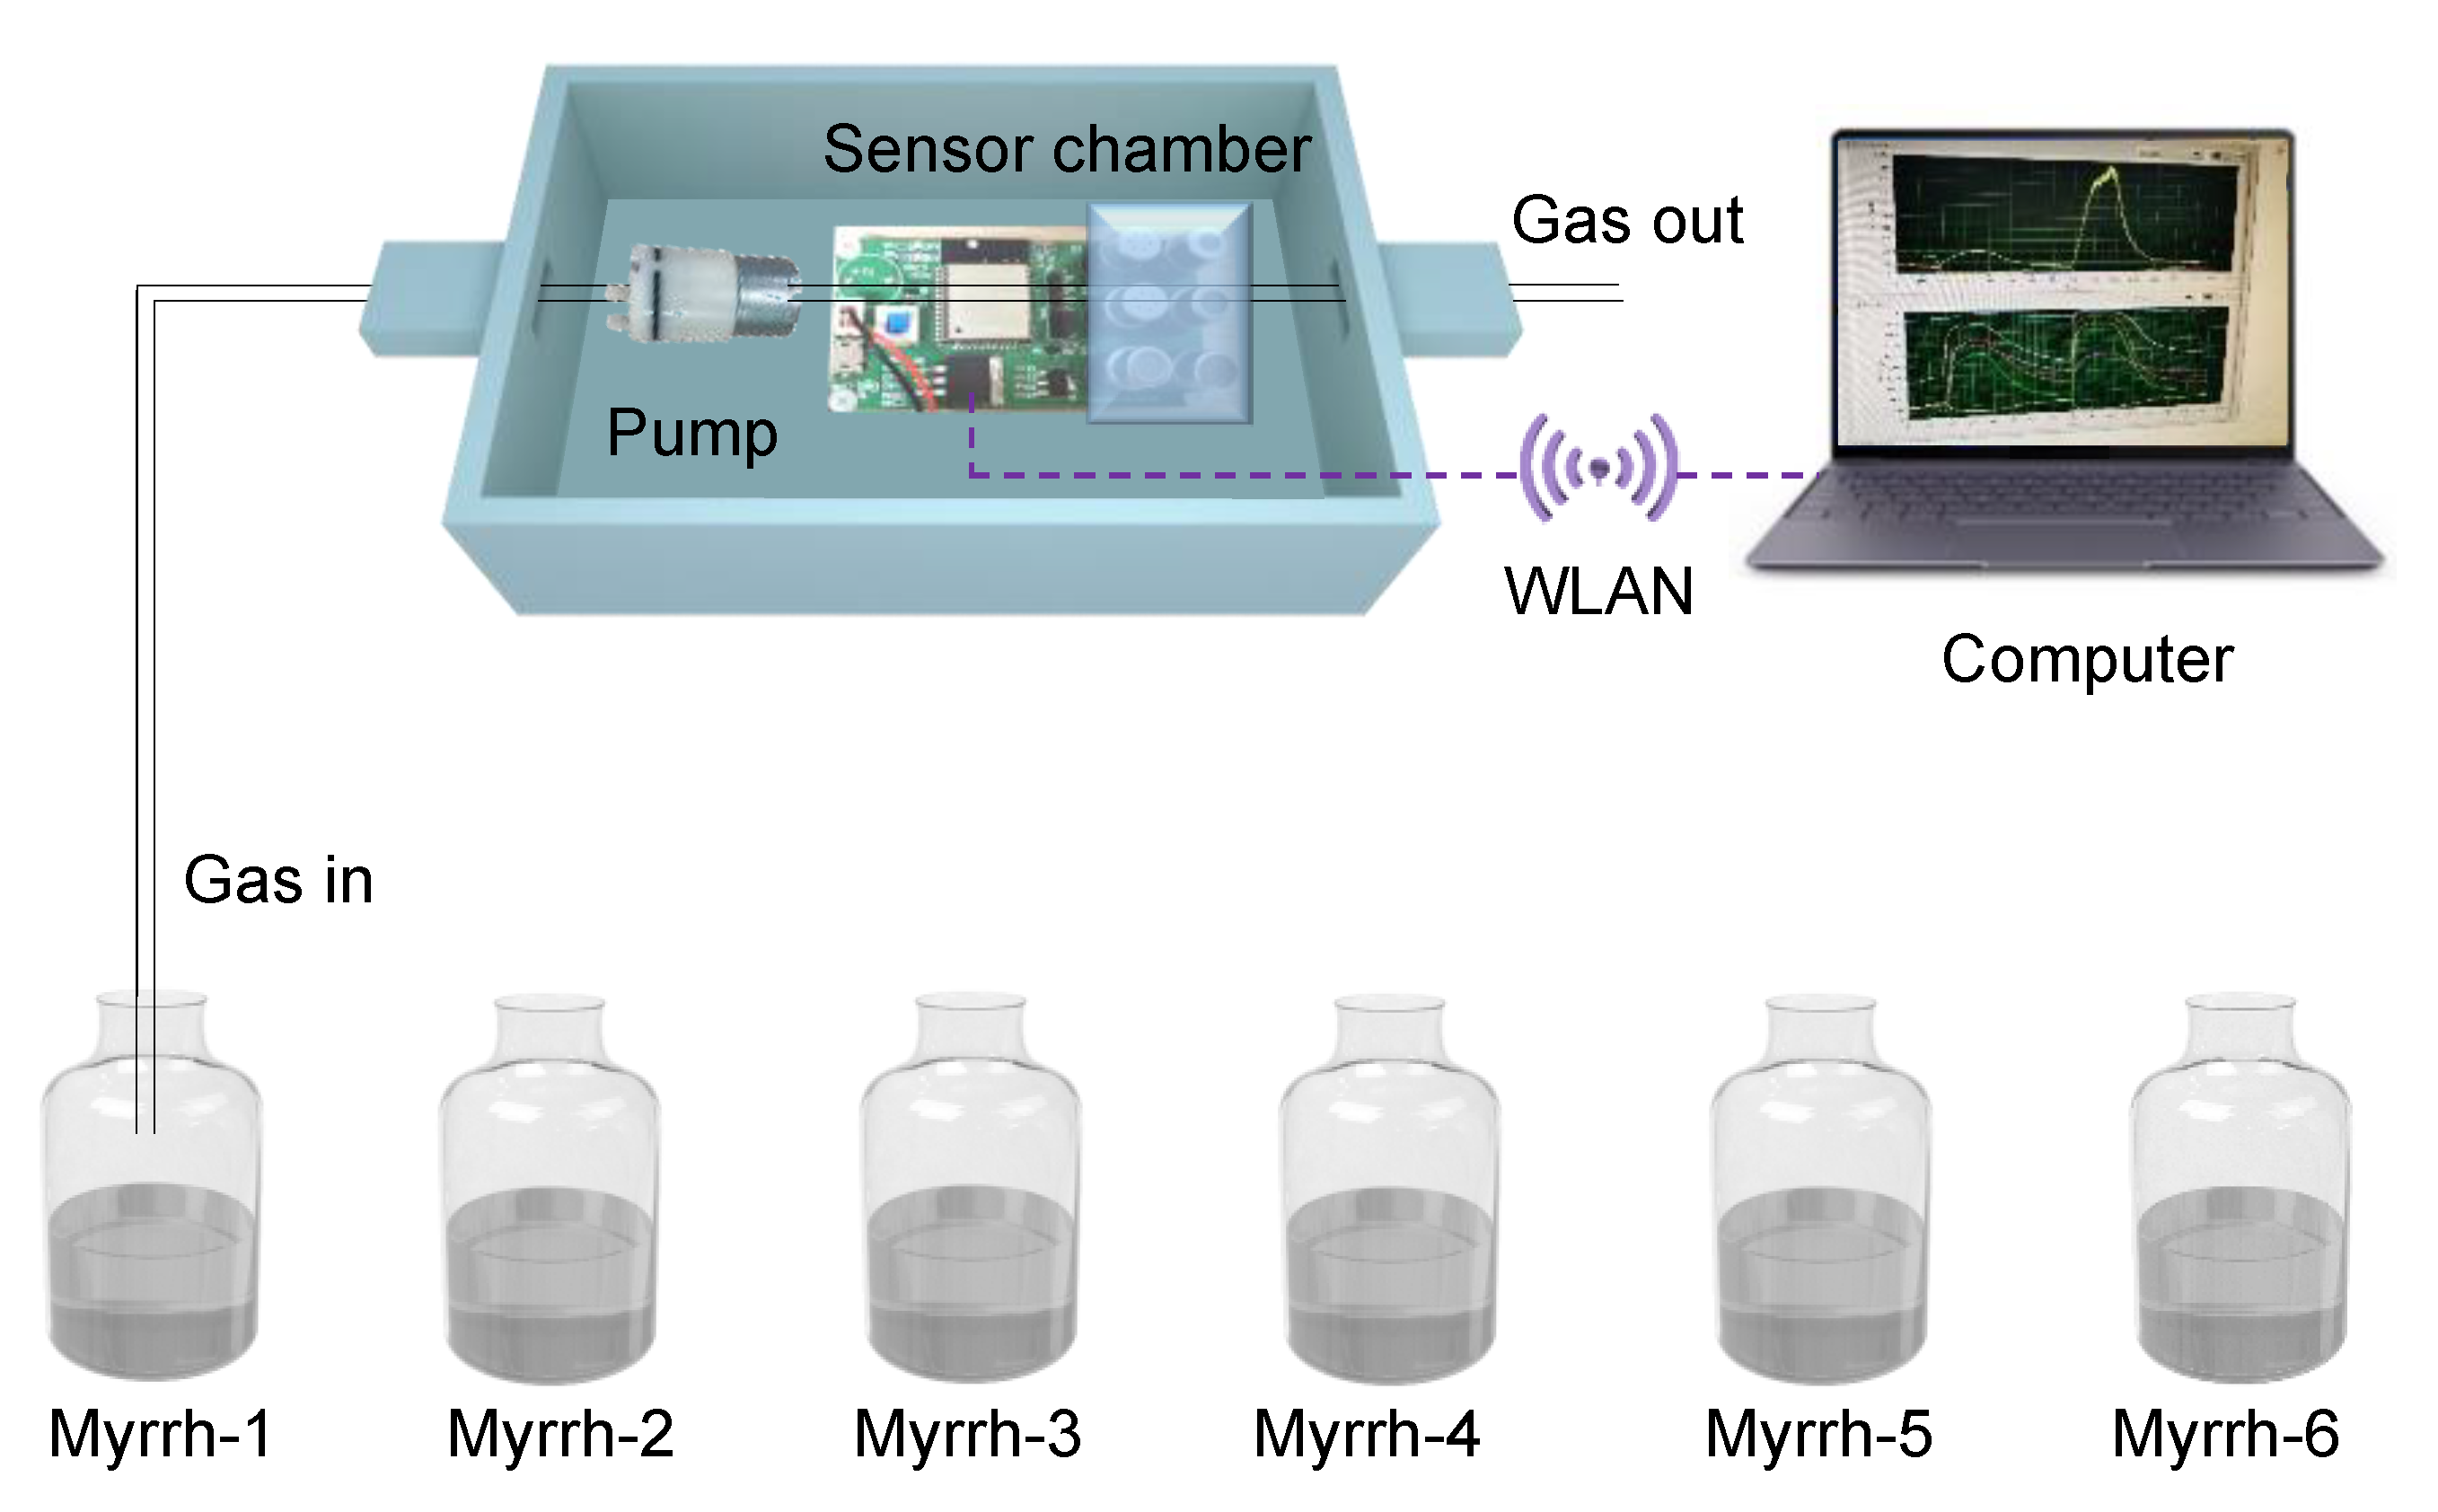
2.4. Electronic Nose Measurement

The electronic nose system used in this experiment was a self-made portable electronic nose. The schematic diagram of the electronic-nose-testing myrrh system is shown in Figure 2. It consists of a suction pump, a sensor chamber, a circuit board, and a computer. The electronic nose and the computer are connected via a wireless local area network (WLAN) signal, and software is used to obtain the resistance values of each sensor. The sensor chamber contains six semiconductor sensors, including four self-made metal oxide sensors and two commercially available sensors. The sensor array was placed in a sensor chamber, and a fixed volume of myrrh volatile gas was pumped into the chamber using a pump. The schematic of the sensor array consisting of six sensors is shown in Figure S1. The resistance value changes of the six sensors were recorded and analyzed using the dedicated software provided by the manufacturer.

2.5. Characterizations

Film morphologies and structures of WO3 quantum dots, Fe2O3 hollow nanorods, ZnFe2O4 nanorods, and SnO2 nanowires were characterized using various analytical techniques. Scanning electron microscopy (SEM) was performed using an FEI Model Sirion 200 microscope, while high-resolution transmission electron microscopy (HRTEM) was conducted using a JEOL-2100 microscope operating at 200 kV. The crystallographic information and phase identification of the four samples were obtained through X-ray diffraction (XRD) analysis. XRD patterns were collected using a diffractometer (MAXima_XXRD-7000, Shimadzu, Japan) with Cu Kα radiation. The analysis of the diffraction patterns allowed for the determination of the crystal structure and the presence of any preferred crystallographic orientations in the samples. X-ray photoelectron spectroscopy (XPS) measurements were conducted using an AXIS ULTRA instrument.

3. Results and Discussion

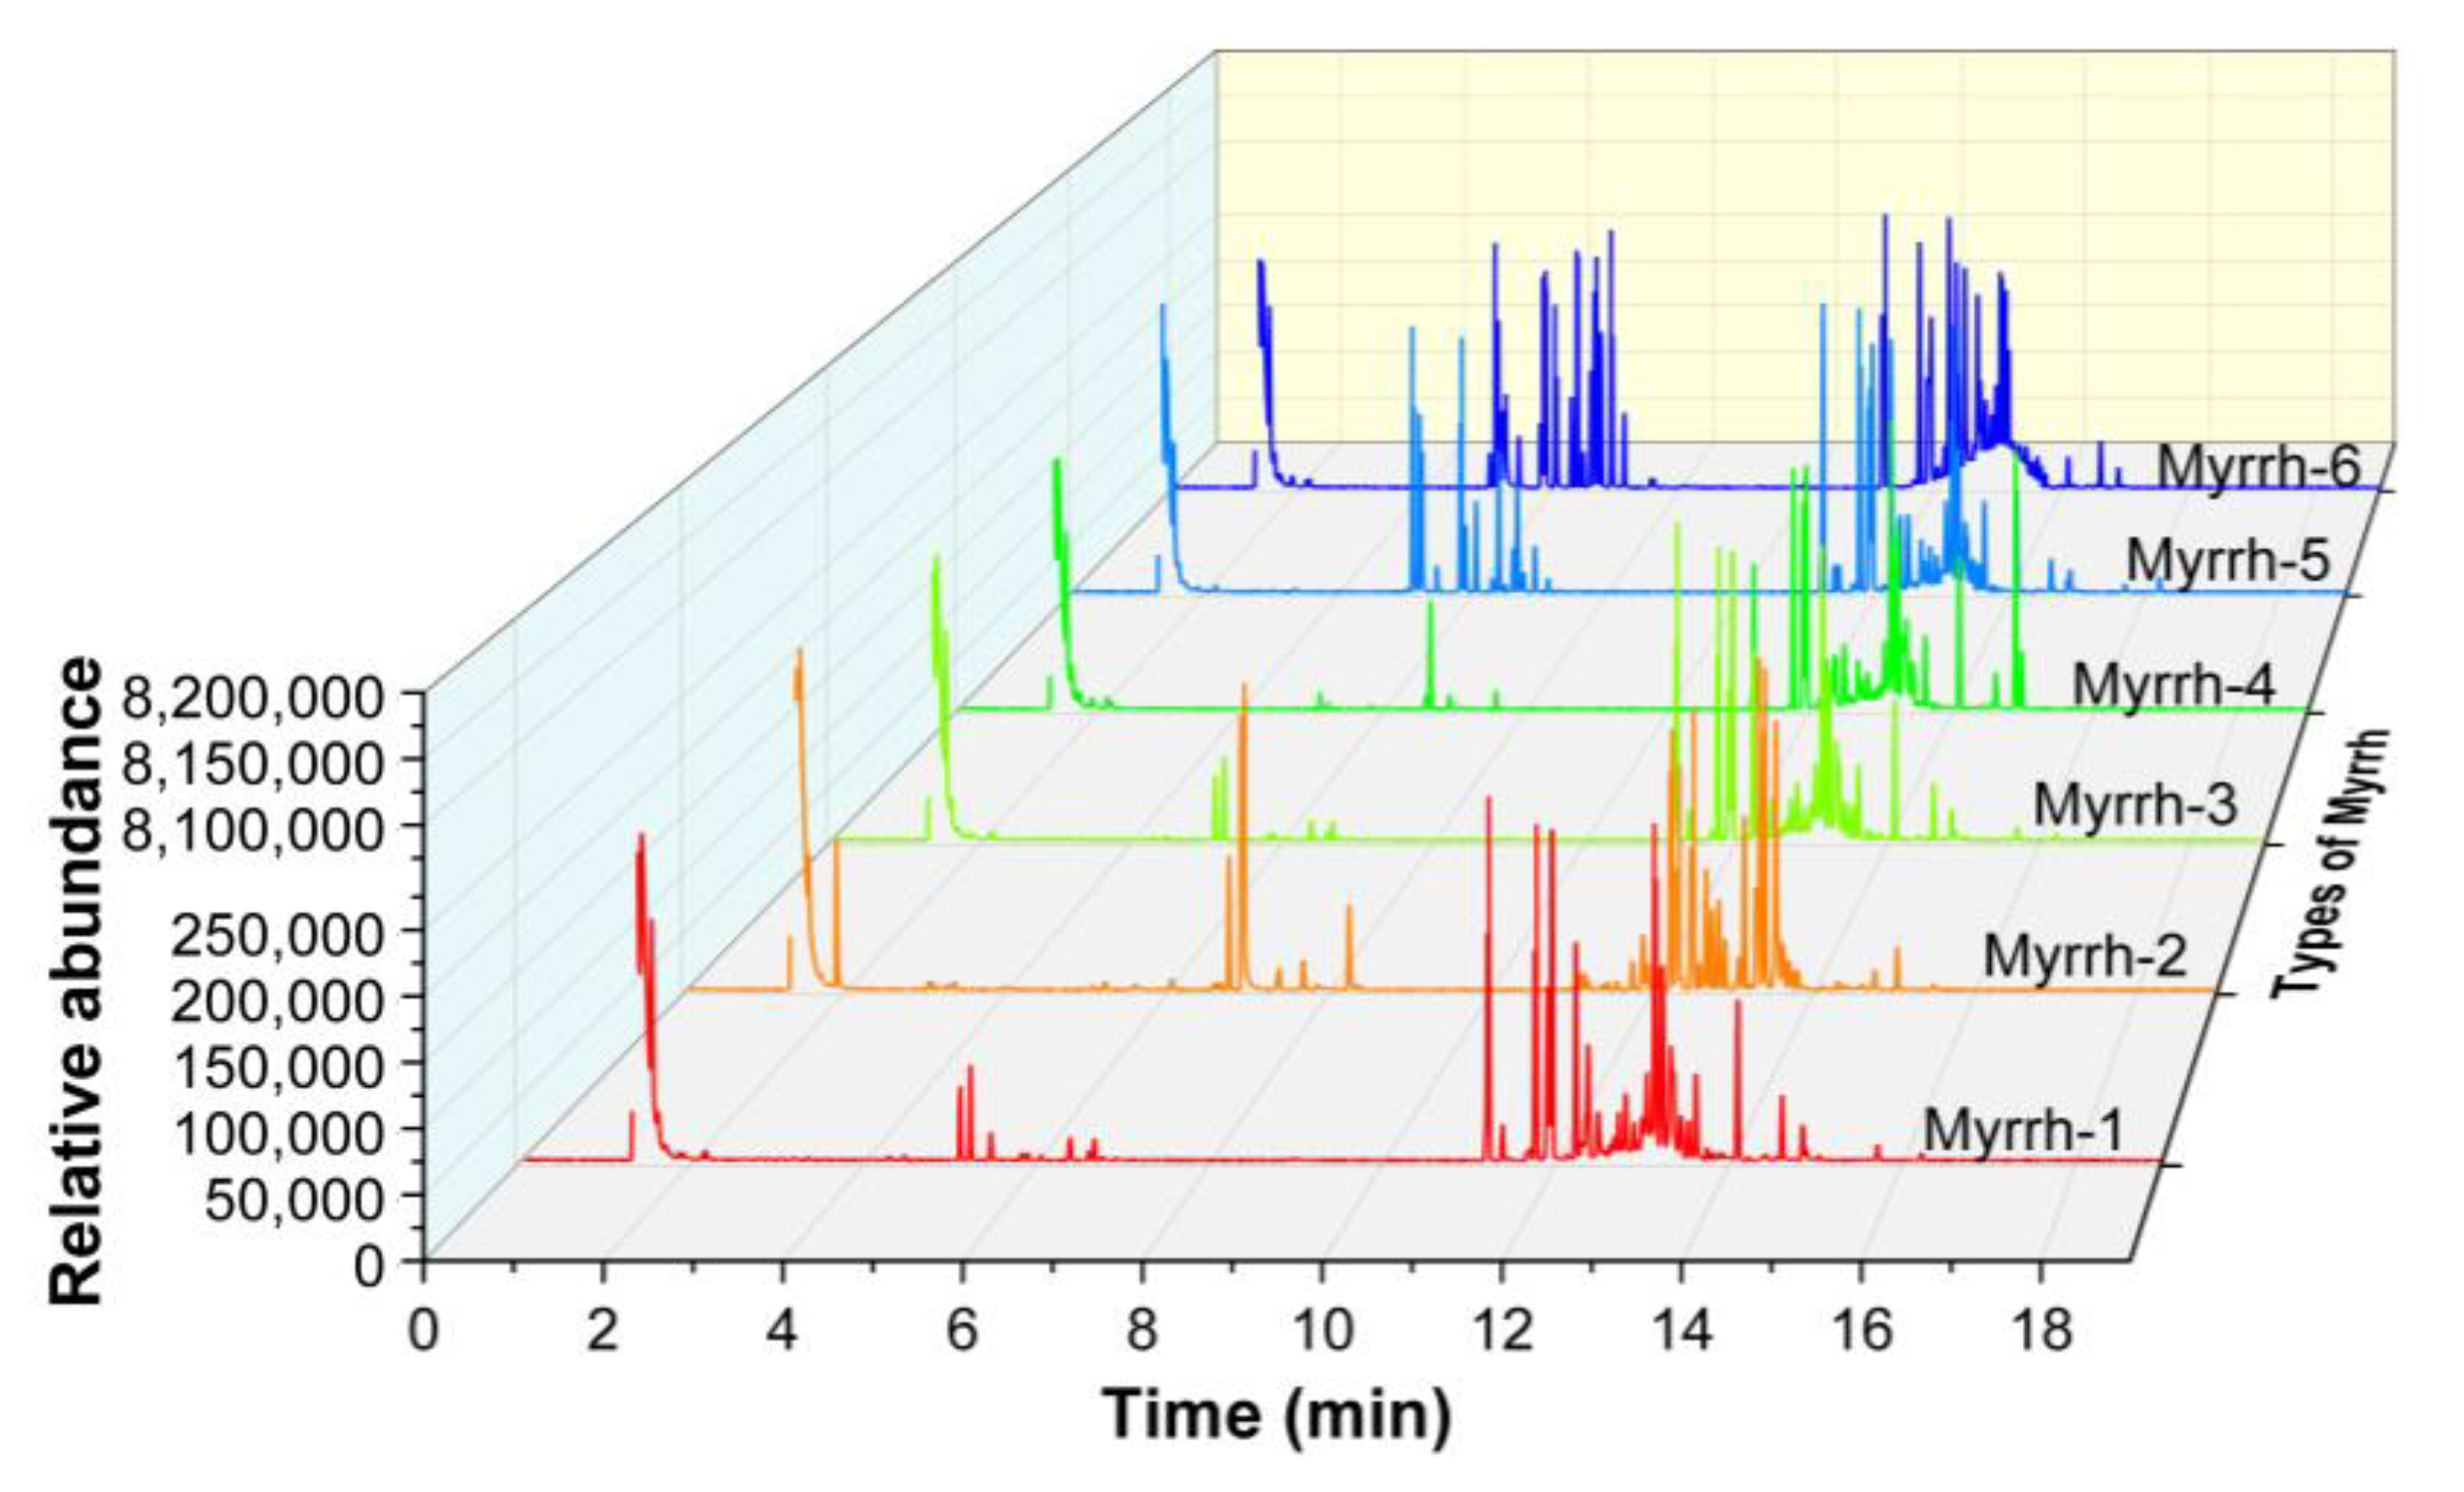
3.1. GC–MS Analysis Results of Myrrh Volatile Gases

The GC–MS analysis of the six myrrh samples provided valuable insights into the composition of volatile compounds present in each sample. As shown in Table S1, a total of 130 compounds were detected, including alkenes, alkanes, alcohols, aldehydes, ketones, esters, and ethers. Among them, the volatile compounds of six myrrh samples are mainly composed of alkene compounds, accounting for over 85% of the total volatile compounds. Alkene compounds mainly include beta-Bourbonene, Germacrene D, beta-copaene, alfa-Copaene, and gamma-Muurolene, among other compounds. Alkanes, alcohols, aldehydes, ketones, esters, and ethers account for less than 15% of the total volatile compounds, and their composition and content vary among the six myrrh samples. Interestingly, the composition and content of volatile compounds varied among the six myrrh samples. This indicates the presence of significant differences in the specific compounds detected in each type of myrrh. For instance, the main components of Somali gum myrrh are trans-alpha-Bergamotene, beta-Bourbonene, Cyclohexane, and Germacrene D, while the main components of Somali natural myrrh are Naphthalene, 1,2,3,4,4a,5,6,8a-octahydro-4a,8-dimethyl-2-(1-methylethenyl)-, Cyclohexene and Germacrene D. The main components of grade A Kenyan natural myrrh are Cyclohexene and alfa-Copaene, while the main components of grade B Kenyan natural myrrh are Ethylene oxide and Cyclopenta[1,3]cyclopropa[1,2]benzene. The main components of grade A Kenyan vinegar-treated myrrh are Ethylene oxide and 1H-Cyclopenta[1,3]cyclopropa[1,2]benzene, while the main components of grade B Kenyan vinegar-treated myrrh are (1R)-2,6,6-Trimethylbicyclo[3.1.1]hept-2-ene and 2-methyl-5-(1-methylethyl)-. The total ion chromatograms (TIC) of six myrrh samples are displayed in Figure 3. The comprehensive GC–MS analysis highlights the complexity and diversity of volatile compounds in myrrh samples from different origins and qualities. These variations in composition provide a basis for distinguishing between different types of myrrh and emphasize the importance of quality assessment in traditional Chinese medicine. It can be observed that the TIC of Myrrh-5 and Myrrh-6 within the time range of 4–8 min are noticeably different from other types of myrrh. This is attributed to the utilization of distinct processing techniques for Myrrh-5 and Myrrh-6, resulting in the generation of a higher amount of volatile gases. This characteristic also facilitates further differentiation through the use of an electronic nose [26,27].

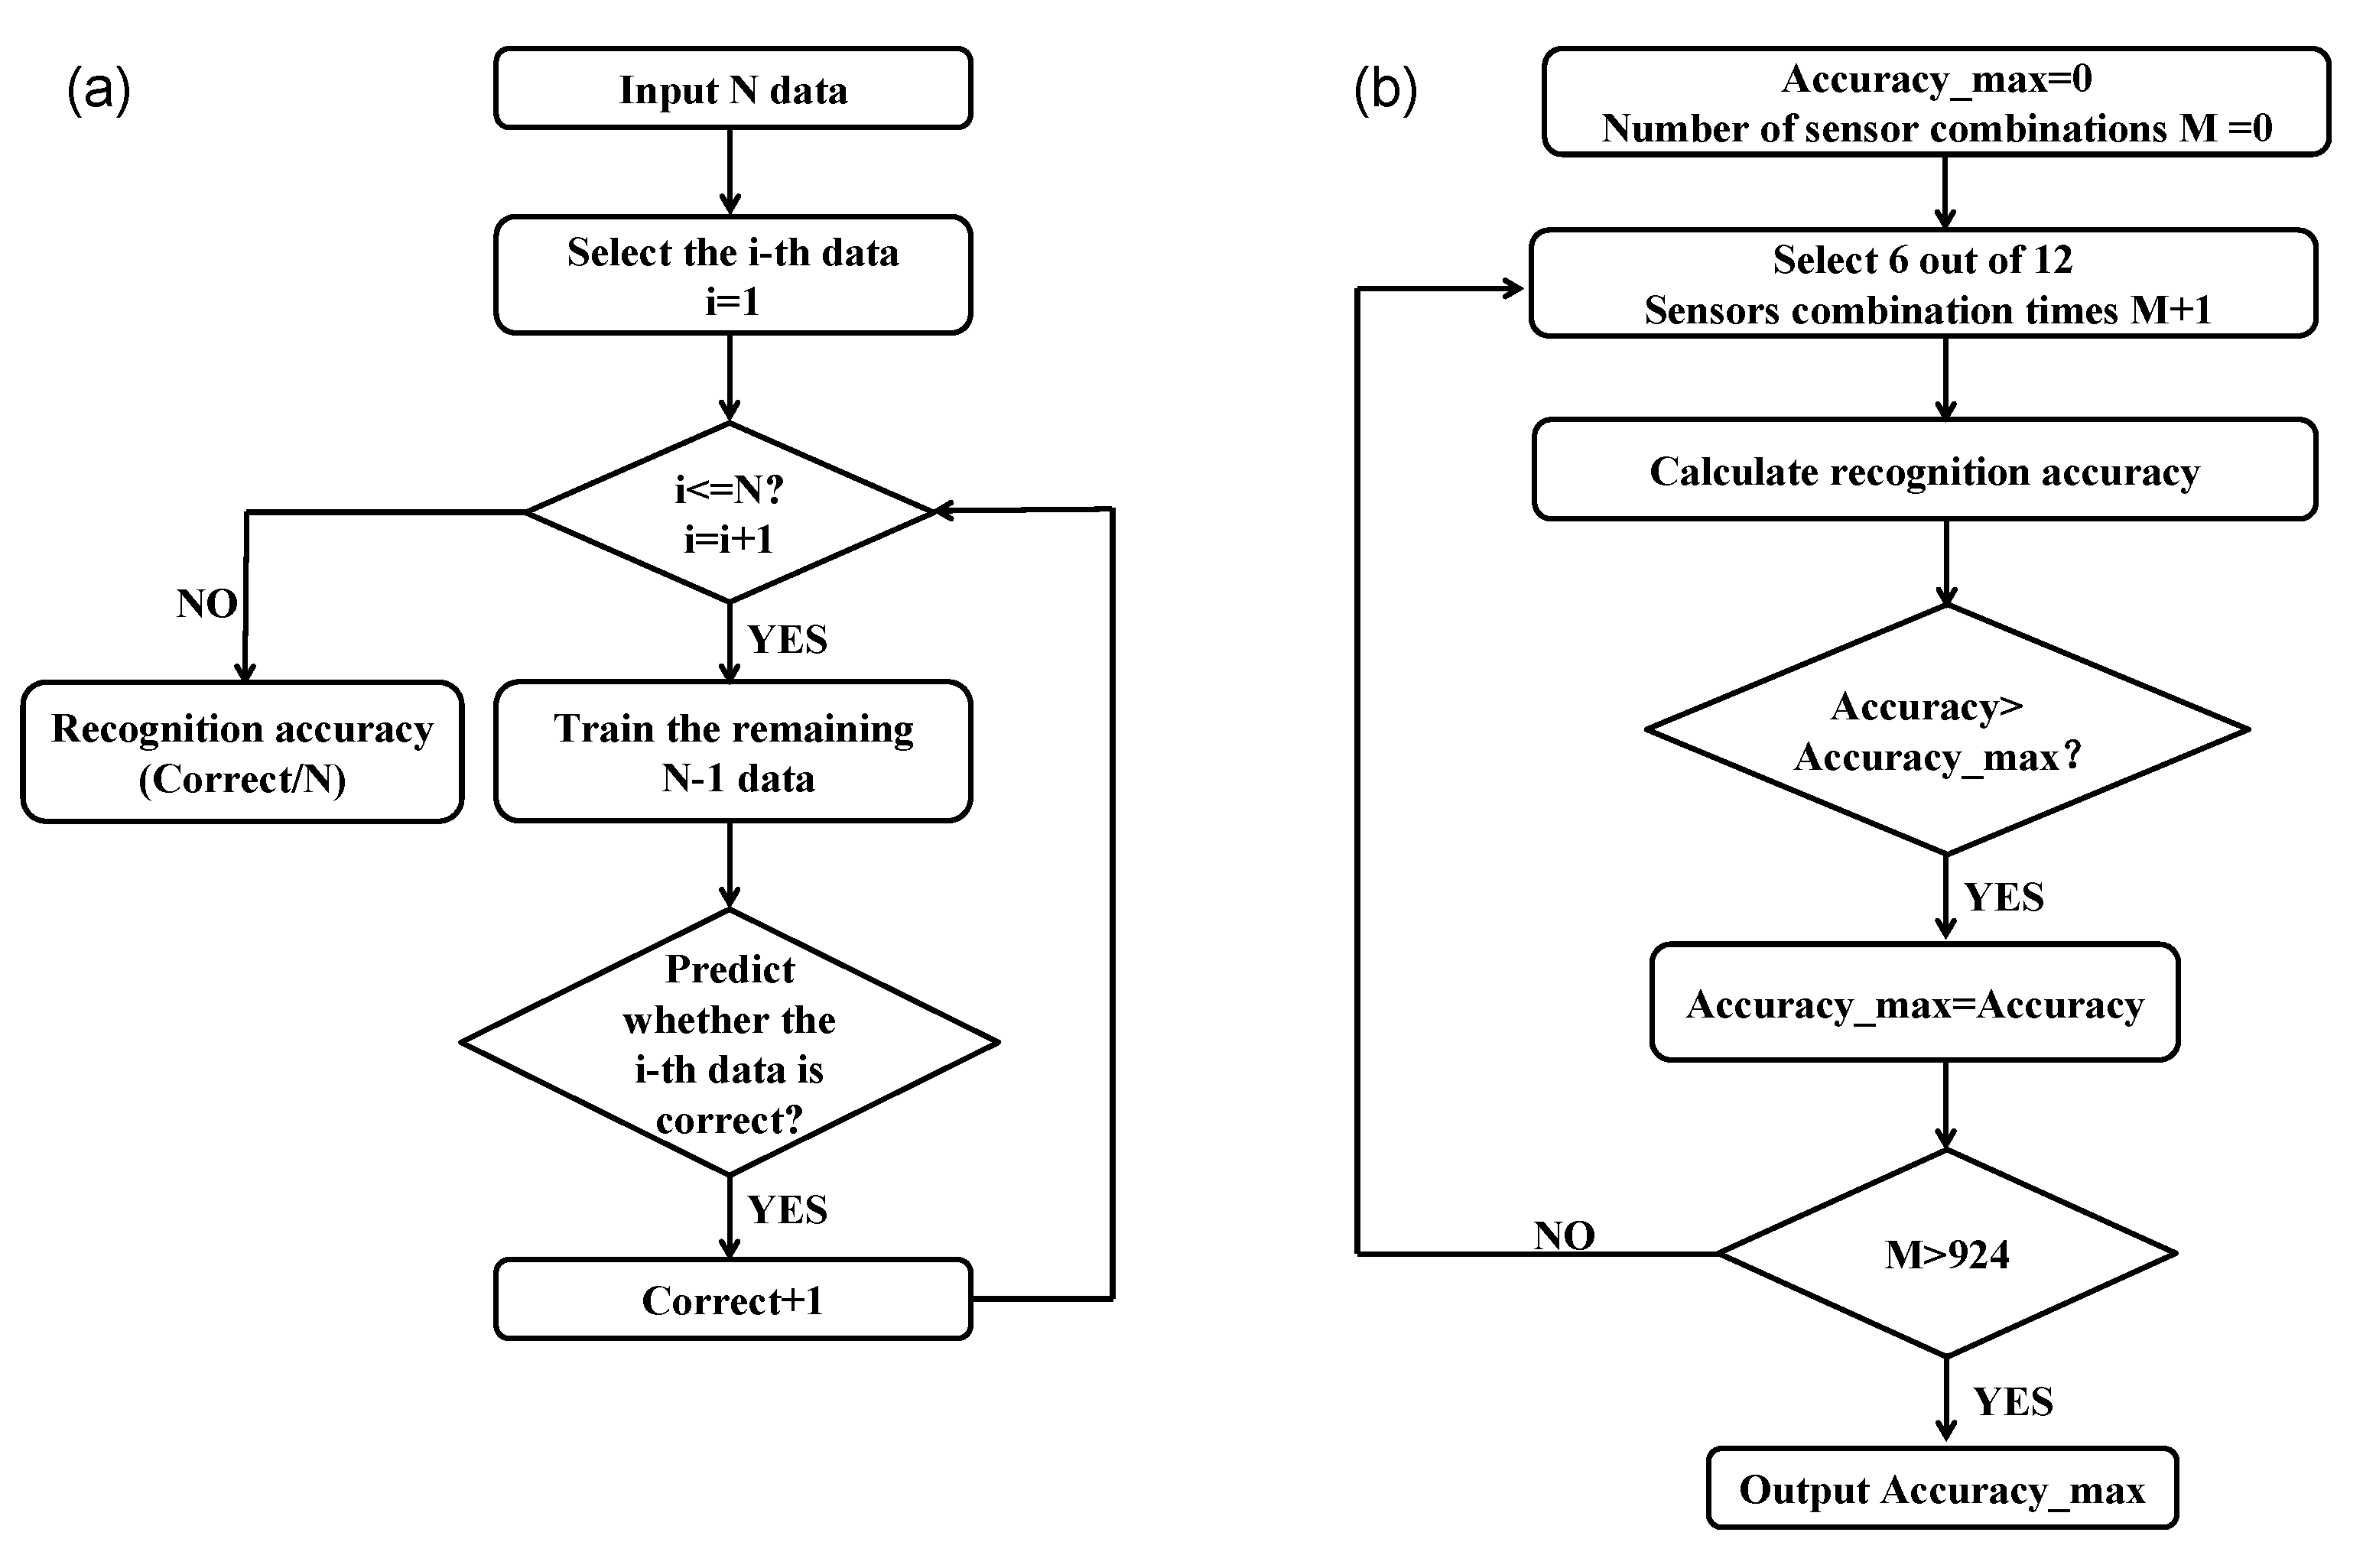
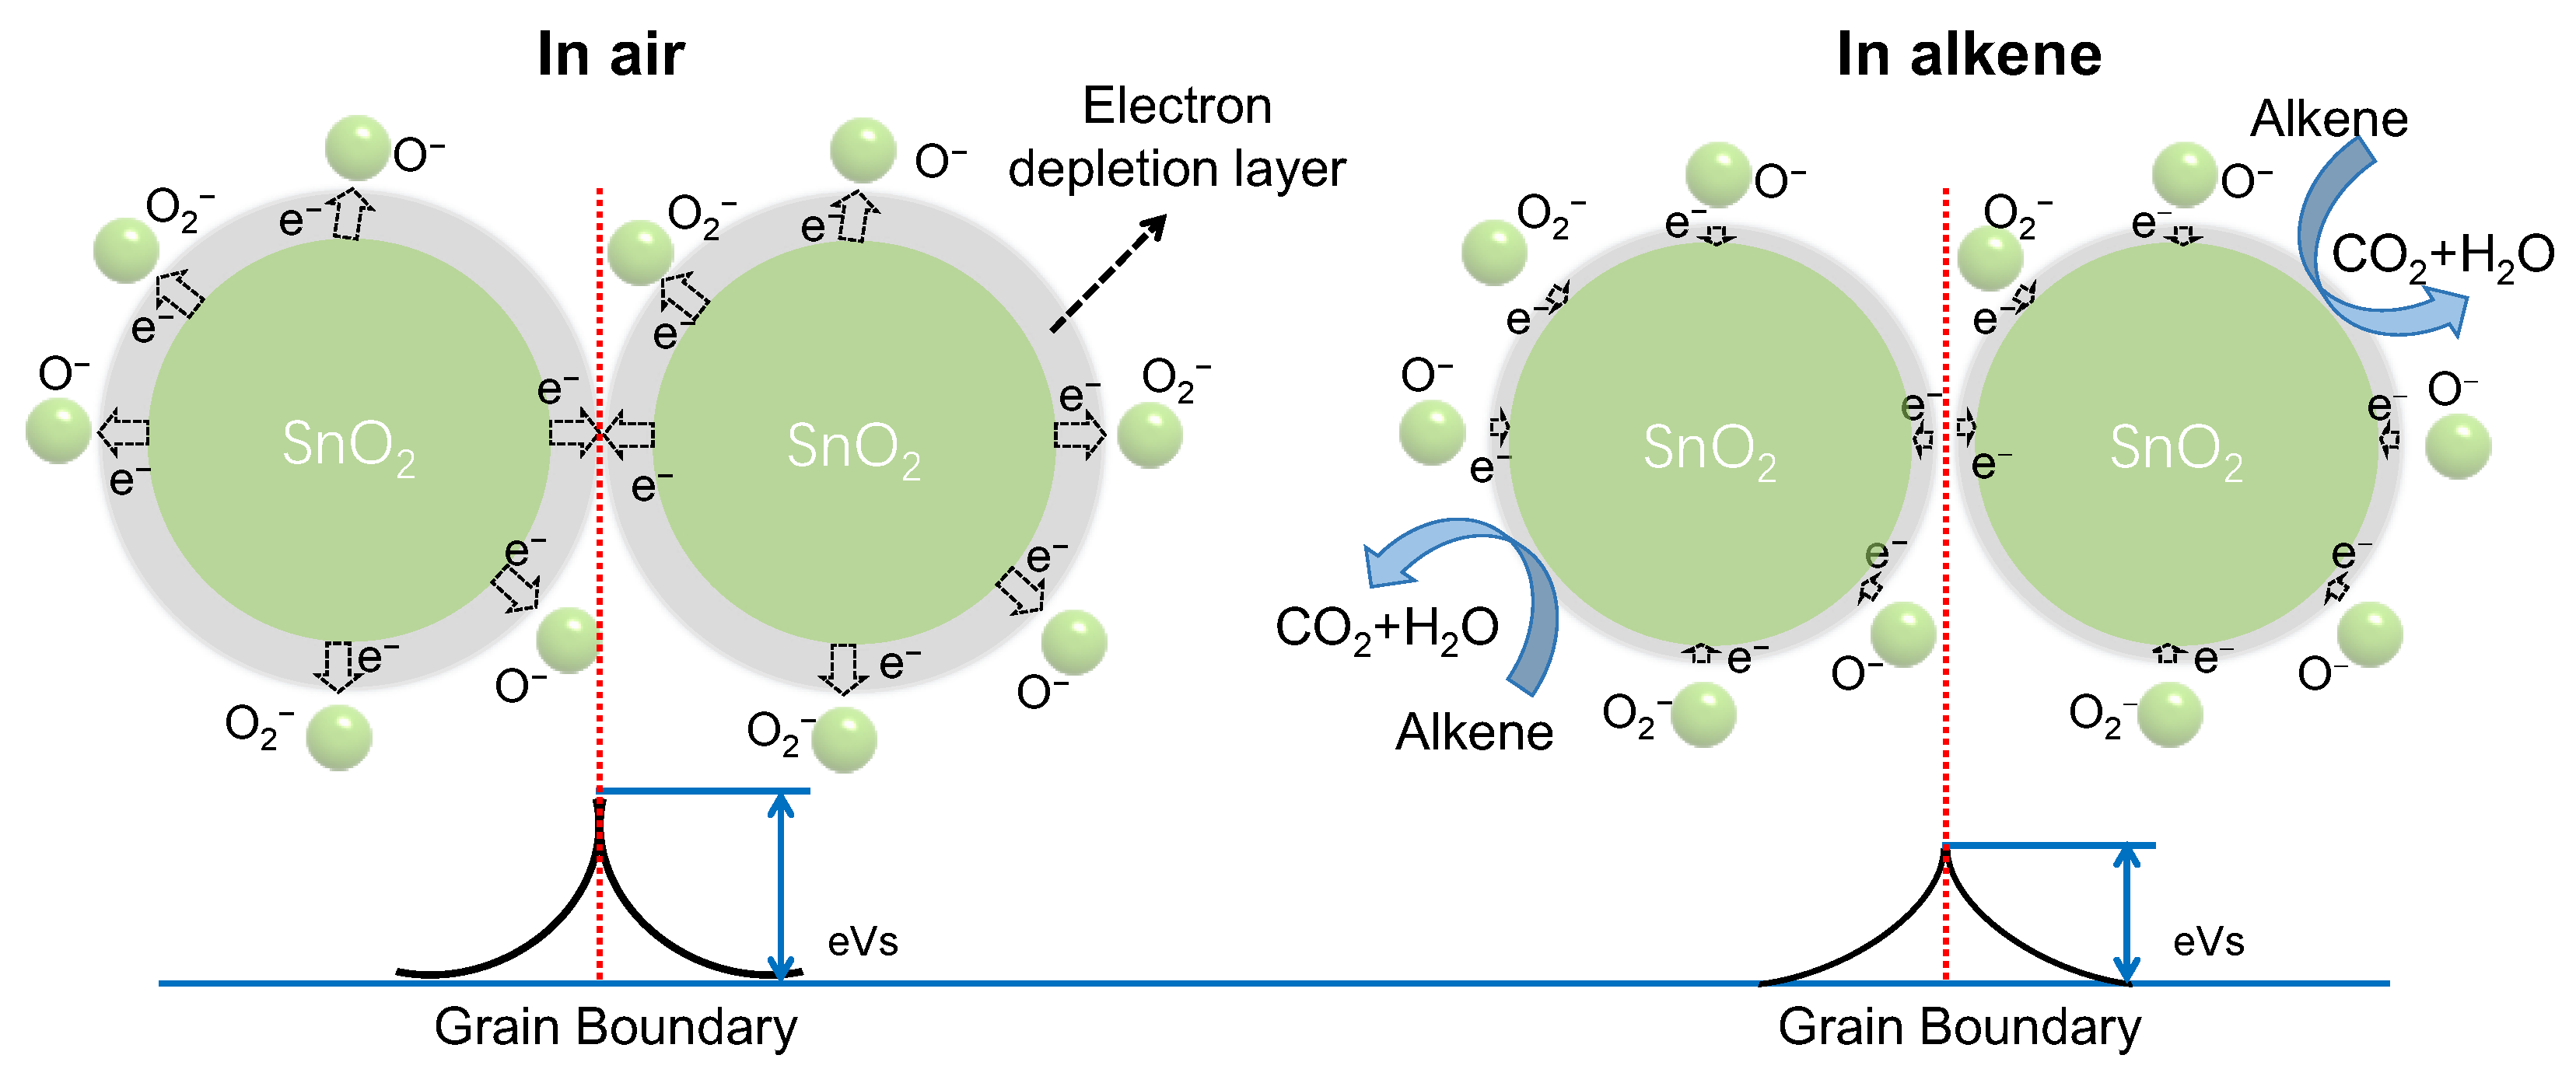
3.2. Sensor Selectionof Gases for Electronic Nose

According to the GC–MS results, the volatile components of myrrh consist of alkenes, alkanes, alcohols, aldehydes, ketones, esters, and ethers. In order to identify and classify myrrh effectively, we conducted a study using twelve sensors to analyze the gas-sensing response characteristics to ethanol, acetone, formaldehyde, ethylene, and their mixed gas samples. Table 1 summarizes the main components and applications of each sensor. However, it is important to note that the data presented in Table 1 do not represent the actual measured responses of the twelve sensors (S1–S12) to the target gases. The purpose of Table 1 was to demonstrate the potential capabilities of the sensors in detecting a range of volatile compounds, including alkenes, alkanes, alcohols, aldehydes, ketones, esters, and ethers. These compounds are relevant to the volatile components found in myrrh and are indicative of their potential use for myrrh detection. This initial investigation aimed to determine the preliminary response characteristics of the sensors toward the volatile components of myrrh. The results are presented in Figure S2 and Figure S3. The sensors exhibited a decrease in resistance when exposed to reducing gases. This behavior is characteristic of n-type semiconductors, where exposure to reducing gases leads to the release of trapped electrons and an increase in the number of free charge carriers, resulting in a decrease in resistance. It is evident that all twelve sensors exhibited noticeable gas-sensing responses to the four standard gases, as well as the mixtures of ethylene and ethanol, ethylene and acetone, and ethylene and formaldehyde. Moreover, these responses varied in sensitivity, with the sensors showing higher sensitivity towards the mixed gas samples.
Subsequently, we explored the calculation of sensor array accuracy using the LDA algorithm. As depicted in Figure 4a, the process for determining the detection accuracy of the sensor array using the LDA algorithm was established. Each sample was cyclically selected as the validation set, while the remaining samples served as the training set. By predicting the results for each sample, the recognition accuracy of the sample group was obtained. Based on the calculated accuracy, a method for selecting the optimal sensor array was devised, as shown in Figure 4b. This process involved randomly selecting six sensors from the initial pool of twelve sensors and obtaining their response data to ethanol, acetone, formaldehyde, ethylene, and their mixed gas samples. The recognition accuracy was then computed for this specific sensor combination. The process was repeated with another set of six sensors, ensuring it differed from the previous combination. The recognition accuracy of this new combination was calculated and compared with the previous combination. If the recognition accuracy of the new combination was higher, the data of the new combination were retained for further comparison. Conversely, if the recognition accuracy was lower, the data of the previous combination were retained for comparison with the next set of six sensors. This iterative process covered all 924 combinations of the six sensors, systematically evaluating their recognition accuracies. The objective was to identify the combination with the highest recognition accuracy among all the tested combinations. At the conclusion of the process, the recognition accuracies of all combinations were compared to determine the combination with the highest accuracy. This particular combination represents the optimal sensor array for myrrh classification using an electronic nose system. Based on our analysis, the optimal sensor array consists of WO3 quantum dots, Fe2O3 hollow nanorods, ZnFe2O4 nanorods, SnO2 nanowires, TGS2610 and TGS2620 sensors, with a recognition accuracy of 94%. While LDA was chosen for the current study, it is important to note that other methods, such as principal component analysis (PCA), can also be employed for dimensionality reduction and feature extraction. PCA is another popular technique used to transform the original feature space into a lower-dimensional space while retaining most of the variance in the data. However, in this study, LDA was deemed sufficient for achieving the desired classification accuracy.
To investigate their theoretical mechanisms for detecting volatile gases in myrrh from a microscopic perspective, we conducted characterization analysis on four types of nanomaterials. Figure 5 shows the microstructure characterization of these sensing materials using SEM and TEM. The results demonstrate that these materials exhibit well-defined nanostructures such as quantum dots, hollow nanorods, nanorods, and nanowires. Their grain sizes are all within the nanoscale range. These unique nanostructures play a vital role in enhancing the response of the gas sensors. The enhanced response can be attributed to two key factors: the large specific surface area of the nanomaterials, which provides an increased number of active sites for gas interactions, and the nanoscale dimensions, which facilitate efficient carrier transport properties [28,29].
To assess the crystallinity of the four nanomaterials, we performed X-ray diffraction (XRD) tests, as shown in Figure 6. The characteristic diffraction peaks of all the samples were consistent with that of the cubic WO3 (JCPDS no. 46-1096), α-Fe2O3 (JCPDS No. 33-0664), ZnFe2O4 (JCPDS No. 22-1012), and SnO2 rutile structure (JCPDS 88-0287). The positions and intensities of the diffraction peaks were compared with standard reference cards, confirming the materials’ well-defined crystalline structure. The characteristic peak positions were found to be consistent with the known crystallographic planes of the respective materials. The XRD results indicated high crystallinity, as evidenced by the sharp and well-defined diffraction peaks. The high crystallinity of the nanomaterials is crucial for their stability and suitability as gas-sensing materials. The well-defined crystal structure provides a stable framework for the adsorption and interaction of gas molecules, leading to enhanced sensing performance. Moreover, the presence of specific crystallographic planes contributes to the materials’ selectivity and sensitivity toward target gases. Additionally, an XPS analysis was conducted on the SnO2 nanomaterial as an example (Figure S4). Due to the similarity in the XPS results of these four materials in terms of oxygen species, we chose to focus on the XPS analysis of SnO2 as a representative example of this study in order to avoid redundancy and unnecessary duplication. The XPS spectrum exhibited a significant peak at 532.1 eV, indicating the presence of a considerable number of oxygen vacancies. This observation aligns with previous research suggesting that the formation of oxygen-vacancy defects in metal oxides increases their selectivity towards alkenes, resulting in a higher response to alkenes [30,31,32]. Therefore, in this study, WO3 quantum dots [33], Fe2O3 hollow nanorods [34], ZnFe2O4 nanorods [35], SnO2 nanowires [36], as well as TGS2610 and TGS2620 sensors were selected as the sensors for the electronic nose system, and they were respectively renamed as Sensor-1, Sensor-2, Sensor-3, Sensor-4, Sensor-5, and Sensor-6.
Furthermore, we also investigated the sensing mechanisms of selected sensors towards myrrh volatile atmospheres, primarily comprising alkenes. We focus on SnO2 as an example, considering that WO3, Fe2O, ZnFe2O4 and SnO2 are all n-type metal oxide semiconductors. As depicted in Figure 7, when metal oxides are exposed to ambient air, O2 molecules adsorb onto the material’s surface and capture electrons from SnO2, resulting in the formation of depletion layers and an increase in resistance. This process can be described by the following adsorption reactions [37,38]:
O2 (ads) + e → O2 (ads)
O2 (ads) + 2e → 2O (ads)
However, when SnO2 was exposed to alkenes, which serve as reducing gases, electrons transferred from the adsorbed oxygen species to SnO2, leading to a reduction in the depletion layer’s size and, subsequently, decreasing the resistance. The specific reactions between the reducing gases and oxygen species can vary depending on the type of alkene but are generally expressed as follows:
Alkene (ads) + O2 → H2O + CO2 + e
Alkene (ads) + 2O → H2O + CO2 + 2e
In these reactions, alkenes act as reducing agents, facilitating the transfer of electrons from adsorbed oxygen ions (O2 and O) back to the SnO2 lattice. As a result, the quantity of oxygen ions in the depletion layer decreases, reducing its thickness and allowing higher current flow through the material [39]. This reduction in the depletion layer size leads to lower resistance values. These phenomena play a crucial role in the gas-sensing mechanism of metal oxide materials, enabling their application in the detection of myrrh volatile gases.

3.3. Results of Electronic Nose Analysis of Myrrh Volatile Gases

This paper aimed to investigate the response of six sensors when exposed to different myrrh samples and to evaluate the classification performance of the LDA model based on sensor parameters [40]. The analysis focused on the changes in sensor resistance values, the computation of various sensor parameters, and the effectiveness of the LDA model in classifying the myrrh samples [41,42,43]. The experimental results demonstrated a significant decrease in sensor resistance values when exposed to myrrh volatile gases, indicating a responsive behavior of the sensors toward the volatile components released by the myrrh samples. This response can be attributed to the interaction between the sensing materials of the sensors and the volatile compounds present in the myrrh samples. The response curves of the six sensors to the six myrrh samples are shown in Figure 8. The initial resistance values of the six sensors (WO3 quantum dots, Fe2O3 hollow nanorods, ZnFe2O4 nanorods, SnO2 nanowires, and TGS2610 and TGS2620 sensors) are as follows: 420 kΩ, 222 kΩ, 316 kΩ, 541 kΩ, 107 kΩ, and 161 kΩ, respectively. They revealed distinct patterns of response for each sensor–sample combination.
Among the six sensors, Sensor-4 exhibited the highest response to myrrh samples 1, 3, 4, 5, and 6, while Sensor-1 showed the highest response to myrrh sample 2. Furthermore, it was observed that each sensor exhibited different response values to different myrrh samples, highlighting the feasibility of using these six sensors as components of an electronic nose system for myrrh analysis. This sensor specificity can be attributed to variations in sensor composition, surface properties, and other factors that influence the interaction between the sensors and the volatile gases.
To further analyze the sensor responses, several parameters were computed for each sensor–sample combination, including response, response and recovery time, integral area, and slope. As shown in Figure S5, the response was defined as the ratio of sensor-resistance change to the concentration of myrrh volatile gases. Response time was defined as the time taken by the sensor to reach 90% of the maximum resistance change, while recovery time was defined as the time taken to recover to 10% of the maximum resistance change. The integral area was calculated by integrating the area under the response curve of the sensor to the myrrh volatile gases. The slope refers to the slope of the response curve during the response process when the resistance changes rapidly to a steady state. The analysis of the response curves and parameters provided valuable insights into the characteristics of the myrrh samples and the performance of the sensor array.
As shown in Figure 9, we conducted statistics on four parameters. The results indicated significant variations in the sensitivity and integral area among the six sensors for the six myrrh samples. These variations suggest differences in the detection capabilities of the sensors and the extent of interaction between the sensors and the volatile gases emitted by the myrrh samples. Among them, the observed differences in the response values of the sensors to different myrrh samples indicate the presence of distinct volatile components in each sample. This suggests that the sensor array is capable of capturing and distinguishing the unique chemical profiles of the myrrh samples. The computed response values reflected the sensors’ ability to detect changes in the concentration of volatile gases released by the myrrh samples. The significant variations in response among the sensors for the different myrrh samples imply that certain sensors may be more sensitive to specific volatile components present in the samples. This highlights the importance of utilizing a sensor array to obtain a comprehensive and selective response to the complex mixture of volatile compounds emitted by myrrh. The response and recovery times provide information about the dynamic behavior of the sensors. The shorter response and recovery times indicate faster detection and restoration of the baseline resistance values, respectively. The variations in these time parameters among the sensors may be attributed to differences in the interaction mechanisms between the sensor materials and the volatile components of the myrrh samples. The integral area, which represents the cumulative response of the sensors over time, was found to exhibit significant changes among the sensors for the different myrrh samples. This suggests that the integration of the response curves provides valuable information regarding the overall magnitude and duration of the sensor’s response to the volatile components. The variations in the integral area indicate differences in the release and persistence of the volatile compounds in the myrrh samples. Additionally, the slope of the response curve offers insight into the rate of change of the sensor’s resistance over time. Variations in the slope among the sensors for the different myrrh samples may indicate differences in the kinetics of the chemical reactions occurring at the sensor surface.
Based on the comprehensive analysis of these parameters, it can be concluded that the sensor array demonstrated excellent discriminative capabilities for the six myrrh samples. The variations in sensitivity, integral area, and other parameters indicate the distinct chemical compositions of the myrrh samples and the ability of the sensor array to capture these differences.

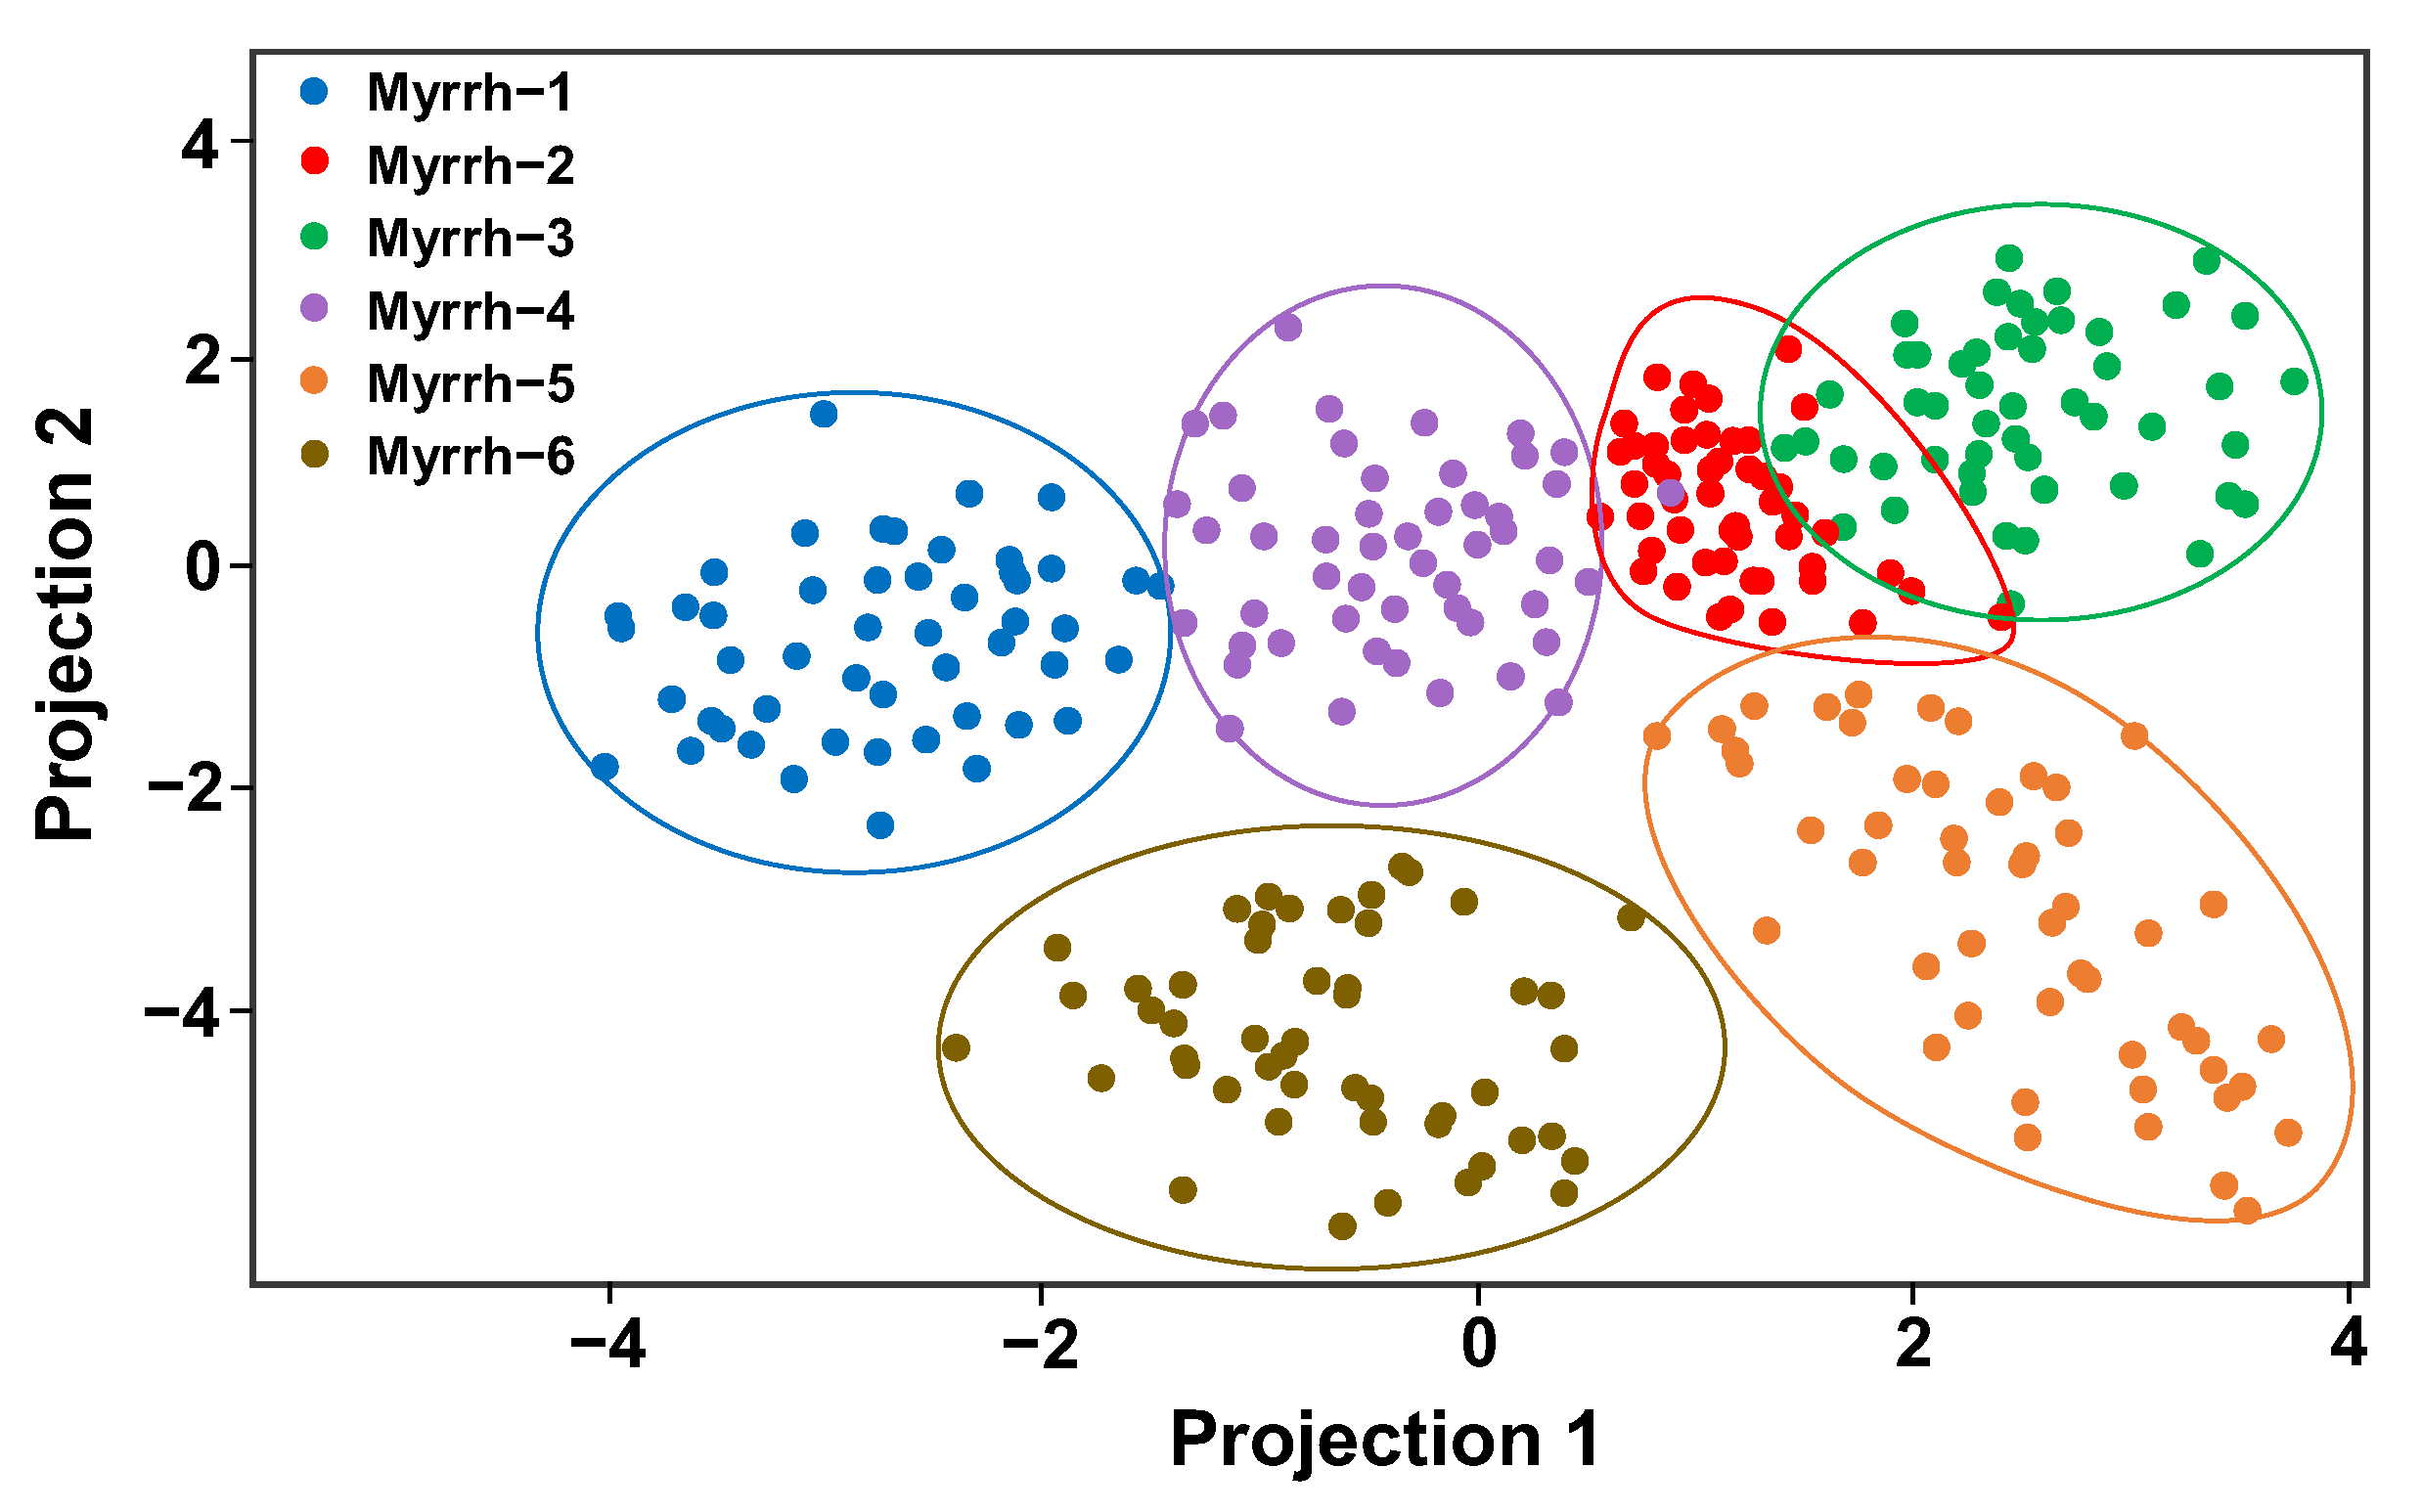
3.4. Classification of Myrrh Samples Using LDA

To achieve the classification of the six myrrh samples, we employed LDA using the two parameters extracted from the response curves of the six sensors: sensitivity and integral area. The LDA technique is a powerful statistical method commonly used for pattern recognition and classification tasks. Before applying LDA, we preprocessed the data by normalizing the sensitivity and integral area values to ensure that each parameter contributes equally to the classification process. This normalization step eliminates any biases that may arise due to differences in the measurement scales of the parameters.
The myrrh dataset was randomly divided into training and testing sets. The training set was used to construct the LDA model, while the testing set was employed to evaluate the model’s classification accuracy. During the LDA model construction, the algorithm aimed to find a linear combination of the sensitivity and integral area parameters that maximized the separation between the different myrrh classes [44,45]. This linear combination, known as the discriminant function, was derived by calculating the covariance matrix of the training set and the means of the parameters for each myrrh class.
After obtaining the discriminant function, it was applied to the testing set to classify the myrrh samples. The LDA model assigned a class label to each sample based on its position relative to the decision boundaries defined by the discriminant function. The classification accuracy was determined by comparing the assigned labels with the true labels of the testing set [46]. As shown in Figure 10, a scatter plot in a plane rectangular coordinate system was drawn by the LDA algorithm. The results indicate that data points of the same type of myrrh exhibit compact distribution, while the interfaces between different types of myrrh are distinct. The LDA model demonstrated precise classification of the six myrrh samples, achieving a classification accuracy of 90% on the testing set. This indicates that the LDA algorithm effectively discriminates myrrh samples of different origins and qualities, demonstrating its capability for the accurate classification of myrrh. Our analytical method offers portability, cost-effectiveness, and rapid analysis for evaluating myrrh decoction pieces. In comparison to the electronic nose (e-nose) and GC–MS, our method provides accurate and reliable results without sacrificing efficiency. It eliminates the need for complex sample preparation and reduces analysis time, making it more cost-effective. Overall, our method addresses industry demands by providing a practical solution for on-site myrrh quality evaluation.
The success of the LDA model can be attributed to the distinct response patterns exhibited by the sensor array in the electronic nose system towards the volatile gases emitted by the myrrh samples. The sensors’ sensitivities and integral areas captured the unique characteristics of each myrrh type, enabling the LDA model to effectively separate and classify them. It is important to note that the classification performance of the LDA model depends on the quality and representativeness of the training data. In this study, we ensured the inclusion of a diverse range of myrrh samples in the training set, encompassing variations in origin and quality. This approach helped the LDA model learn the discriminative features of each myrrh type and generalize well to classify unseen samples in the testing set. The successful classification of myrrh samples using the LDA model underscores the potential of electronic nose technology for the quality assessment and differentiation of traditional Chinese medicines. By leveraging the distinctive response patterns of the sensor array, combined with advanced statistical techniques like LDA, we can establish reliable and accurate methods for the identification and quality control of myrrh and other herbal products.
Further research can explore the optimization of the LDA model by incorporating additional parameters or employing more advanced machine-learning algorithms. Additionally, the expansion of the dataset to include a broader range of myrrh samples from different sources and qualities would enhance the robustness and generalizability of the classification model. In brief, our research introduces a novel approach by combining an electronic nose system, sensor array optimization, and LDA algorithms for myrrh analysis. The optimization of the sensor array and the utilization of the Linear Discriminant Analysis algorithm contribute to the originality of our approach. This study addresses the need for objective and rapid methods in myrrh quality assessment, offering valuable insights for the field.

4. Conclusions

In conclusion, this study successfully integrated GC–MS analysis and sensor selection in electronic nose technology for improved quality analysis of myrrh decoction pieces. The GC–MS analysis revealed the presence of various volatile compounds in myrrh, with alkene compounds comprising the majority. By calculating the recognition accuracy, six out of twelve sensors were selected as the sensor array for the electronic nose system. By analyzing sensor parameters such as response, response and recovery time, integral area, and slope, valuable insights were obtained regarding the characteristics of the myrrh samples and the sensor–gas interactions. The LDA model successfully classified the myrrh samples based on the sensor parameters, with a classification accuracy of 90% on the testing set, highlighting its effectiveness in differentiating between different types of myrrh. The results indicate the potential of electronic nose technology in the quality assessment and differentiation of traditional Chinese medicines, including myrrh. Overall, this study contributes to advancing electronic nose technology in traditional Chinese medicine analysis and quality control.

Supplementary Materials

The following supporting information can be downloaded at: https://www.mdpi.com/article/10.3390/chemosensors11070396/s1, This supplementary provides further details regarding the preparation method of WO3 quantum dots, Fe2O3 hollow nanorods, ZnFe2O4 nanorods, and SnO2 nanowires. The schematic of the sensor array consisting of six sensors (Figure S1). Dynamic response curves of twelve sensors to ethanol, acetone formaldehyde, and ethylene (Figure S2). Dynamic response curves of twelve sensors to three types of mixed gases (Figure S3). XPS spectra of O 1s are also provided in Figure S4. Schematic diagram of sensor parameters is shown in Figure S5. Six myrrh components tested by GC–MS are summarized in Table S1.

Author Contributions

Conceptualization, G.Z., Y.Z. and E.H.; methodology, E.H.; software, X.X. and Y.Z.; formal analysis, G.Z.; investigation, G.Z., T.H., X.X., J.Q., W.W., Y.Z. and E.H.; resources, G.Z. and E.H.; data curation, G.Z.; writing—original draft preparation, G.Z.; writing—review and editing, T.H. and E.H.; supervision, X.X., J.Q., W.W. and E.H.; funding acquisition, G.Z. and E.H. All authors have read and agreed to the published version of the manuscript.

Funding

The authors are grateful for the support of the Guangxi Science and Technology Base and Talent Project (No.20-065-38), and the National Administration of Traditional Chinese Medicine Youth Qihuang Scholars Support Project. This work was also supported by Traditional Chinese Medicine Processing Technology Inheritance Base of the State Administration of Traditional Chinese Medicine.

Institutional Review Board Statement

Not applicable.

Informed Consent Statement

Not applicable.

Data Availability Statement

The data presented in this study are available upon request from the corresponding author.

Acknowledgments

We thank the School of Optical and Electronic Information of Huazhong University of Science and Technology for the technical support. The authors would like to thank Suzhou Deyo Bot Advanced Materials Co., Ltd. (Suzhou, China) (www.dy-test.com, accessed on 1 September 2021) for providing support on material characterization.

Conflicts of Interest

The authors declare no conflict of interest.

References

  1. Wu, Y.; Zhou, T.; Qian, D.; Liu, X.; Xu, Y.; Hong, W.; Meng, X.; Tang, H. Z-Guggulsterone Induces Cell Cycle Arrest and Apoptosis by Targeting the p53/CCNB1/PLK1 Pathway in Triple-Negative Breast Cancer. ACS Omega 2023, 8, 2780–2792. [Google Scholar] [CrossRef]
  2. Soliman, W.E.; Shehata, T.M.; Mohamed, M.E.; Younis, N.S.; Elsewedy, H.S. Enhancement of Curcumin Anti-Inflammatory Effect via Formulation into Myrrh Oil-Based Nanoemulgel. Polymers 2021, 13, 577. [Google Scholar] [CrossRef]
  3. Abdul-Ghani, R.A.; Loutfy, N.; Hassan, A. Myrrh and trematodoses in Egypt: An overview of safety, efficacy and effectiveness profiles. Parasitol. Int. 2009, 58, 210–214. [Google Scholar] [CrossRef] [PubMed]
  4. De Leo, V.; Cagnacci, A.; Cappelli, V.; Biasioli, A.; Leonardi, D.; Seracchioli, R. Role of a natural integrator based on lipoic acid, palmitoiletanolamide and myrrh in the treatment of chronic pelvic pain and endometriosis. Minerva Ginecol. 2019, 71, 191–195. [Google Scholar] [CrossRef] [PubMed]
  5. Lemenih, M.; Abebe, T.; Olsson, M. Gum and resin resources from some Acacia, Boswellia and Commiphora species and their economic contributions in Liban, south-east Ethiopia. J. Arid Environ. 2003, 55, 465–482. [Google Scholar] [CrossRef]
  6. Ahamad, S.R.; Al-Ghadeer, A.R.; Ali, R.; Qamar, W.; Aljarboa, S. Analysis of inorganic and organic constituents of myrrh resin by GC-MS and ICP-MS: An emphasis on medicinal assets. Saudi Pharm. J. 2017, 25, 788–794. [Google Scholar] [CrossRef]
  7. Han, K.; Wang, M.; Zhang, L.; Wang, C. Application of Molecular Methods in the Identification of Ingredients in Chinese Herbal Medicines. Molecules 2018, 23, 2728. [Google Scholar] [CrossRef] [Green Version]
  8. Zhou, H.; Luo, D.; Gholamhosseini, H.; Li, Z.; He, J. Identification of Chinese Herbal Medicines with Electronic Nose Technology: Applications and Challenges. Sensors 2017, 17, 1073. [Google Scholar] [CrossRef] [Green Version]
  9. Wijaya, D.R.; Sarno, R.; Zulaika, E. DWTLSTM for electronic nose signal processing in beef quality monitoring. Sens. Actuators B Chem. 2021, 326, 128931. [Google Scholar] [CrossRef]
  10. Li, D.; Lei, T.; Zhang, S.; Shao, X.; Xie, C. A novel headspace integrated E-nose and its application in discrimination of Chinese medical herbs. Sens. Actuators B Chem. 2015, 221, 556–563. [Google Scholar] [CrossRef]
  11. Gao, A.; Wang, Y.; Zhang, D.; He, Y.; Zhang, L.; Liu, Y.; Wang, Y.; Song, H.; Li, T. Highly sensitive and selective detection of human-derived volatile organic compounds based on odorant binding proteins functionalized silicon nanowire array. Sens. Actuators B Chem. 2020, 309, 127762. [Google Scholar] [CrossRef]
  12. Guo, F.; Huang, L.; Zhou, S.; Zhang, T.; Liang, Y. Comparison of the volatile compounds of Atractylodes medicinal plants by headspace solid-phase microextraction-gas chromatography–mass spectrometry. Anal. Chim. Acta 2006, 570, 73–78. [Google Scholar] [CrossRef]
  13. Xiong, J.; Zheng, T.; Shi, Y.; Wei, F.; Ma, S.; He, L.; Wang, S.; Liu, X. Analysis of the fingerprint profile of bioactive constituents of traditional Chinese medicinal materials derived from animal bile using the HPLC-ELSD and chemometric methods: An application of a reference scaleplate. J. Pharmaceut. Biomed. 2019, 174, 50–56. [Google Scholar] [CrossRef] [PubMed]
  14. Yin, J.; Wu, M.; Lin, R.; Li, X.; Ding, H.; Han, L.; Yang, W.; Song, X.; Li, W.; Qu, H.; et al. Application and development trends of gas chromatography-ion mobility spectrometry for traditional Chinese medicine, clinical, food and environmental analysis. Microchem. J. 2021, 168, 106527. [Google Scholar] [CrossRef]
  15. Lin, P.; Wang, Q.; Liu, Y.; Qin, Z.; Gao, H.; Ye, M.; Shang, H.; Yao, X.; Yao, Z. Characterization of chemical profile and quantification of representative components of DanLou tablet, a traditional Chinese medicine prescription, by UHPLC-Q/TOF-MS combined with UHPLC-TQ-MS. J. Pharmaceut. Biomed. 2020, 180, 113070. [Google Scholar] [CrossRef]
  16. Manzoli, A.; Steffens, C.; Paschoalin, R.T.; Graboski, A.M.; De Mello Brandão, H.; de Carvalho, B.C.; Bellini, J.L.; de Paula Herrmann, P.S. Volatile compounds monitoring as indicative of female cattle fertile period using electronic nose. Sens. Actuators B Chem. 2019, 282, 609–616. [Google Scholar] [CrossRef]
  17. Kuchmenko, T.; Umarkhanov, R.; Lvova, L. E-nose for the monitoring of plastics catalytic degradation through the released Volatile Organic Compounds (VOCs) detection. Sens. Actuators B Chem. 2020, 322, 128585. [Google Scholar] [CrossRef]
  18. Andre, R.S.; Facure, M.H.M.; Mercante, L.A.; Correa, D.S. Electronic nose based on hybrid free-standing nanofibrous mats for meat spoilage monitoring. Sens. Actuators B Chem. 2022, 353, 131114. [Google Scholar] [CrossRef]
  19. Zhang, J.; Xue, Y.; Sun, Q.; Zhang, T.; Chen, Y.; Yu, W.; Xiong, Y.; Wei, X.; Yu, G.; Wan, H.; et al. A miniaturized electronic nose with artificial neural network for anti-interference detection of mixed indoor hazardous gases. Sens. Actuators B Chem. 2021, 326, 128822. [Google Scholar] [CrossRef]
  20. Le Maout, P.; Wojkiewicz, J.; Redon, N.; Lahuec, C.; Seguin, F.; Dupont, L.; Mikhaylov, S.; Noskov, Y.; Ogurtsov, N.; Pud, A. Polyaniline nanocomposites based sensor array for breath ammonia analysis. Portable e-nose approach to non-invasive diagnosis of chronic kidney disease. Sens. Actuators B Chem. 2018, 274, 616–626. [Google Scholar] [CrossRef]
  21. Wei, H.; Zhang, H.; Song, B.; Yuan, K.; Xiao, H.; Cao, Y.; Cao, Q. Metal-Organic Framework (MOF) Derivatives as Promising Chemiresistive Gas Sensing Materials: A Review. Int. J. Environ. Res. Public Health 2023, 20, 4388. [Google Scholar] [CrossRef] [PubMed]
  22. Yuan, K.; Wang, C.; Zhu, L.; Cao, Q.; Yang, J.; Li, X.; Huang, W.; Wang, Y.; Lu, H.; Zhang, D.W. Fabrication of a Micro-Electromechanical System-Based Acetone Gas Sensor Using CeO2 Nanodot-Decorated WO3 Nanowires. ACS Appl. Mater. Inter. 2020, 12, 14095–14104. [Google Scholar] [CrossRef]
  23. Ou, L.; Liu, M.; Zhu, L.; Zhang, D.W.; Lu, H. Recent progress on flexible room-temperature gas sensors based on metal oxide semiconductor. Nano-Micro Lett. 2022, 14, 206. [Google Scholar] [CrossRef]
  24. Fu, L.; Yang, G.; Liu, L.; Ma, Y.; Zhang, X.; Zhang, X.; Li, C.; Sun, Y. Analysis of Volatile Components of Auricularia auricula from Different Origins by GC-MS Combined with Electronic Nose. J. Food Qual. 2020, 2020, 8858093. [Google Scholar] [CrossRef]
  25. Park, S.Y.; Kim, Y.; Kim, T.; Eom, T.H.; Kim, S.Y.; Jang, H.W. Chemoresistive materials for electronic nose: Progress, perspectives, and challenges. InfoMat 2019, 1, 289–316. [Google Scholar] [CrossRef] [Green Version]
  26. Zhu, J.; Ren, Z.; Lee, C. Toward Healthcare Diagnoses by Machine-Learning-Enabled Volatile Organic Compound Identification. ACS Nano 2021, 15, 894–903. [Google Scholar] [CrossRef]
  27. Zhu, J.; Cho, M.; Li, Y.; He, T.; Ahn, J.; Park, J.; Ren, T.; Lee, C.; Park, I. Machine learning-enabled textile-based graphene gas sensing with energy harvesting-assisted IoT application. Nano Energy 2021, 86, 106035. [Google Scholar] [CrossRef]
  28. Gao, X.; Zhang, T. An overview: Facet-dependent metal oxide semiconductor gas sensors. Sens. Actuators B Chem. 2018, 277, 604–633. [Google Scholar] [CrossRef]
  29. Miller, D.R.; Akbar, S.A.; Morris, P.A. Nanoscale metal oxide-based heterojunctions for gas sensing: A review. Sens. Actuators B Chem. 2014, 204, 250–272. [Google Scholar] [CrossRef]
  30. Choi, P.G.; Izu, N.; Shirahata, N.; Masuda, Y. SnO2 Nanosheets for Selective Alkene Gas Sensing. ACS Appl. Nano Mater. 2019, 2, 1820–1827. [Google Scholar] [CrossRef]
  31. Liu, J.; Zhang, T.; Liu, T.; Liu, K.; Tan, X.; Yu, X.; Zhao, Q. Oxygen vacancy-rich WO3-x/rGO composite supported Pd catalyst for efficient selective hydrogenation of nitroaromatics. J. Alloys Compd. 2023, 932, 167577. [Google Scholar] [CrossRef]
  32. Liang, X.; Wang, L.; Wen, T.; Liu, H.; Zhang, J.; Liu, Z.; Zhu, C.; Long, C. Mesoporous poorly crystalline α-Fe2O3 with abundant oxygen vacancies and acid sites for ozone decomposition. Sci. Total Environ. 2022, 804, 150161. [Google Scholar] [CrossRef]
  33. Li, Z.; Teng, M.; Yang, R.; Lin, F.; Fu, Y.; Lin, W.; Zheng, J.; Zhong, X.; Chen, X.; Yang, B.; et al. Sb-doped WO3 based QCM humidity sensor with self-recovery ability for real-time monitoring of respiration and wound. Sens. Actuators B Chem. 2022, 361, 131691. [Google Scholar] [CrossRef]
  34. Tan, J.; Huang, X. Ultra-thin nanosheets-assembled hollowed-out hierarchical α-Fe2O3 nanorods: Synthesis via an interface reaction route and its superior gas sensing properties. Sens. Actuators B Chem. 2016, 237, 159–166. [Google Scholar] [CrossRef]
  35. Li, L.; Tan, J.; Dun, M.; Huang, X. Porous ZnFe2O4 nanorods with net-worked nanostructure for highly sensor response and fast response acetone gas sensor. Sens. Actuators B Chem. 2017, 248, 85–91. [Google Scholar] [CrossRef]
  36. Xu, X.; Zhuang, J.; Wang, X. SnO2 Quantum Dots and Quantum Wires: Controllable Synthesis, Self-Assembled 2D Architectures, and Gas-Sensing Properties. J. Am. Chem. Soc. 2008, 130, 12527–12535. [Google Scholar] [CrossRef]
  37. Ji, H.; Zeng, W.; Li, Y. Gas sensing mechanisms of metal oxide semiconductors: A focus review. Nanoscale 2019, 11, 22664–22684. [Google Scholar] [CrossRef]
  38. Yamazoe, N.; Shimanoe, K. New perspectives of gas sensor technology. Sens. Actuators B Chem. 2009, 138, 100–107. [Google Scholar] [CrossRef]
  39. Staerz, A.; Weimar, U.; Barsan, N. Current state of knowledge on the metal oxide based gas sensing mechanism. Sens. Actuators B Chem. 2022, 358, 131531. [Google Scholar] [CrossRef]
  40. Roy, M.; Yadav, B.K. Electronic nose for detection of food adulteration: A review. J. Food Sci. Technol. 2022, 59, 846–858. [Google Scholar] [CrossRef]
  41. Khorramifar, A.; Karami, H.; Lvova, L.; Kolouri, A.; Łazuka, E.; Piłat-Rożek, M.; Łagód, G.; Ramos, J.; Lozano, J.; Kaveh, M.; et al. Environmental Engineering Applications of Electronic Nose Systems Based on MOX Gas Sensors. Sensors 2023, 23, 5716. [Google Scholar] [CrossRef] [PubMed]
  42. Di Natale, C.; Macagnano, A.; Martinelli, E.; Paolesse, R.; Proietti, E.; D’Amico, A. The evaluation of quality of post-harvest oranges and apples by means of an electronic nose. Sens. Actuators B Chem. 2001, 78, 26–31. [Google Scholar] [CrossRef]
  43. Di Natale, C.; Macagnano, A.; Paolesse, R.; Mantini, A.; Tarizzo, E.; D’Amico, A.; Sinesio, F.; Bucarelli, F.M.; Moneta, E.; Quaglia, G.B. Electronic nose and sensorial analysis: Comparison of performances in selected cases. Sens. Actuators B Chem. 1998, 50, 246–252. [Google Scholar] [CrossRef]
  44. Kiani, S.; Minaei, S.; Ghasemi-Varnamkhasti, M. Application of electronic nose systems for assessing quality of medicinal and aromatic plant products: A review. J. Appl. Res. Med. Aromat. Plants 2016, 3, 1–9. [Google Scholar] [CrossRef]
  45. Zhan, X.; Guan, X.; Wu, R.; Wang, Z.; Wang, Y.; Li, G. Discrimination between Alternative Herbal Medicines from Different Categories with the Electronic Nose. Sensors 2018, 18, 2936. [Google Scholar] [CrossRef] [Green Version]
  46. Al-Dayyeni, W.S.; Al-Yousif, S.; Taher, M.M.; Al-Faouri, A.W.; Tahir, N.M.; Jaber, M.M.; Ghabban, F.; Najm, I.A.; Alfadli, I.M.; Ameerbakhsh, O.Z.; et al. A Review on Electronic Nose: Coherent Taxonomy, Classification, Motivations, Challenges, Recommendations and Datasets. IEEE Access 2021, 9, 88535–88551. [Google Scholar] [CrossRef]
Figure 1. Pictures of six types of myrrh.
Chemosensors 11 00396 g001
Figure 2. Schematic diagram of the electronic-nose-testing myrrh system.
Chemosensors 11 00396 g002
Figure 3. Total ion chromatograms of volatile substances in six types of myrrh.
Chemosensors 11 00396 g003
Figure 4. (a) The process for determining the detection accuracy of the sensor array using the LDA algorithm. (b) The process for selecting the optimal sensor array.
Chemosensors 11 00396 g004
Figure 5. Microstructures of sensing materials: (a) WO3 quantum dots, (b) Fe2O3 hollow nanorods, (c) ZnFe2O4 nanorods, and (d) SnO2 nanowires.
Chemosensors 11 00396 g005
Figure 6. XRD spectra of (a) WO3 quantum dots, (b) Fe2O3 hollow nanorods, (c) ZnFe2O4 nanorods, and (d) SnO2 nanowires.
Chemosensors 11 00396 g006
Figure 7. Sensing mechanism of metal oxides to alkenes using SnO2 as an example.
Chemosensors 11 00396 g007
Figure 8. The response curves of the six sensors to the different myrrh samples. (a) myrrh-1, (b) myrrh-2, (c) myrrh-3, (d) myrrh-4, (e) myrrh-5, and (f) myrrh-6.
Chemosensors 11 00396 g008
Figure 9. Changes in (a) sensor response, (b) sum of response time and recovery time, (c) integration area, and (d) slope of the six sensors when exposed to different types of myrrh volatile gases.
Chemosensors 11 00396 g009
Figure 10. LDA classification diagram of six myrrh.
Chemosensors 11 00396 g010
Table 1. Application and sources of twelve sensors.
No.SensorTarget GasManufacturer
S1TGS2611MethaneFigaro
S2MP-4Methane, Natural gasWinson
S3MP-7COWinson
S4Fe2O3Ethanol, Ethylene, PropyleneSelf-made
S5TGS2610Propane, ButaneFigaro
S6TGS2620Ethanol, VOCFigaro
S7SnO2Ethylene, Propylene, Alkene, VOCSelf-made
S8MP-5Liquefied gas, Natural gasWinson
S9ZnFe2O4Ethanol, Formaldehyde, AcetoneSelf-made
S10WSP2110Toluene, Formaldehyde, benzeneWinson
S11TGS2618Propane, ButaneFigaro
S12WO3Ethanol, Ethylene, Propylene, FormaldehydeSelf-made
Disclaimer/Publisher’s Note: The statements, opinions and data contained in all publications are solely those of the individual author(s) and contributor(s) and not of MDPI and/or the editor(s). MDPI and/or the editor(s) disclaim responsibility for any injury to people or property resulting from any ideas, methods, instructions or products referred to in the content.

