Article

Au Nanoparticles on 4-Thiophenol-Electrodeposited Carbon Surfaces for the Simultaneous Detection of 8-Hydroxyguanine and Guanine

1
Department of Physical and Environmental Sciences, University of Toronto Scarborough, 1265 Military Trail, Toronto, ON M1C 1A4, Canada
2
Department of Chemistry, University of Toronto, 80 St. George Street, Toronto, ON M5S 3H6, Canada
*
Author to whom correspondence should be addressed.
Chemosensors 2023, 11(6), 326; https://doi.org/10.3390/chemosensors11060326
Submission received: 5 April 2023 / Revised: 12 May 2023 / Accepted: 24 May 2023 / Published: 2 June 2023
(This article belongs to the Collection Electrochemical Biosensors for Medical Diagnosis)

Abstract

:
In this proof-of-concept study, gold nanoparticles (AuNPs) were immobilized on glassy carbon electrode (GCE) surfaces using a surface-anchored diazonium salt of 4-aminothiophenol (GCE-Ph-S-AuNPs). X-ray photoelectron spectroscopy (XPS) studies confirmed the attachment of the AuNPs via 4-thiophenol onto the surface of the modified electrode. Differential pulse voltammetry (DPV) was performed for the simultaneous determination of guanine (G) and 8-hydroxyguanine (8-OH-G). The calibration curves were linear up to 140 µM and 60 µM with a limit of detection of 0.02 µM and 0.021 µM for G and 8-OH-G, respectively. Moreover, chronoamperometric studies were carried out for the determination of diffusion coefficients of 8-OH-G and G. The GCE-Ph-S-AuNPs were also applied in genomic DNA-spiked samples for the determination of G and 8-OH-G with recovery rates between 98.5% and 103.3%. The novel electrochemical surface provided a potential platform for the sensitive detection of 8-OH-G related to oxidative stress-induced DNA damage in clinical studies.

1. Introduction

Deoxyribonucleic acid (DNA) is transcribed to ultimately form proteins that serve both structural and functional purposes for our cells to survive [1,2]. DNA is composed of a sugar-phosphate backbone, as well as nitrogenous bases [3]. The information which pertains to the proper transcription of proteins is stored in the form of nitrogenous bases, the four most recognized being adenine, thymine, cytosine, and guanine (G). In addition to these nucleobases functioning as the genetic code of organisms, they also have several metabolic functions in extracellular signaling pathways [4,5]. Any changes made to the arrangement of the four nitrogenous bases or harm caused to them can potentially modify the sequence of the protein it transcribes, and hence, it may change the structure of the organism as well as trigger the emergence of specific illnesses [6].
One of the ways in which these nucleobases may be damaged is due to oxidative damage resulting from reactive oxygen species (ROS), such as hydrogen peroxide, superoxide anions, and hydroxyl radicals, which may be generated from cellular oxygen metabolism, environmental carcinogens, or ionizing radiation [7,8]. One way in which ROS may damage DNA is by oxidizing G to 8-hydroxyguanine (8-OH-G), which has been implicated in several neurodegenerative diseases including Alzheimer’s disease [9,10], Parkinson’s disease [11,12], as well as some cancers [13,14]. Furthermore, a recent study suggested that 8-OH-G detected in saliva was a biomarker for oxidative stress in workers [15]. The salivary 8-OH-G levels were significantly elevated in older persons, as well as those who smoked, had hypertension, or excess visceral fat [15]. Therefore, the detection of 8-OH-G in biological fluids is imperative since the accurate detection of this metabolite may prove useful for the early detection of oxidative stress-related diseases.
Several analytical methods have been used to detect and measure the concentration of G and 8-OH-G including gas chromatography-mass spectroscopy (GC-MS) [16,17,18]. high-performance liquid chromatography (HPLC) [18,19,20], and Raman spectroscopy [21,22]. GC-MS requires a complex sample preparation process, which involves extraction, derivatization, and purification steps. These steps can be time-consuming and increase the risk of sample contamination and affect the accuracy of the results. Other techniques such as HPLC rely on the use of expensive columns and solvents, which can be a significant cost for routine analysis. Raman spectroscopy is a non-destructive technique that provides real-time data without the need for sample preparation. However, it requires a high laser power, which can damage the sample and affect the accuracy of the results. Additionally, Raman spectroscopy can be limited by the sample matrix, and the presence of other compounds can interfere with the detection of G and 8-OH-G. These sophisticated techniques present shortcomings when considering the point-of-care needs of patients for early detection of diseases, including the high cost associated with the bench-top instruments, the need for highly trained technicians to run the instruments, long analysis times, low portability, and the need to pre-treat the samples.
The shortcomings related to the detection and measurement of G and 8-OH-G can be overcome using electrochemical sensors, which provide a cheap, portable platform with short turnaround times that may be adapted for an intuitive user experience [23,24]. Electrochemical techniques have their own limitations as well, such as nonspecific adsorption. Several researchers have developed electrochemical sensors for the detection of the four DNA bases (adenine, guanine, thymine, and cytosine) and 8-OH-G using different electrode modifications. Several researchers have developed electrochemical sensors for the detection of the four DNA bases (adenine, guanine, thymine, and cytosine) and 8-OH-G using different electrode modifications. Oliveira-Brett et al. [25], were the first to detect 8-OH-G as well as elucidate its mechanism of oxidation using a bare glassy carbon electrode (GCE). Jeličová et al. [26] were able to develop an electrochemical sensor by modifying screen-printed carbon electrodes with carboxy-functionalized multi-walled carbon nanotubes (MWCNT) to detect 8-OH-G. Several researchers have also developed electrochemical sensors for the detection of the four nucleobases [27,28,29,30], however, there are few reports in the literature that simultaneously detect both 8-OH-G and G. To the best of our knowledge, the only group that has reported an electrochemical sensor for the simultaneous detection of both nucleobases was Goyal and Bishnoi [31] who developed gold nanoparticle (AuNP)-modified single-walled carbon nanotubes on an edge-plane pyrolytic graphite electrode to detect 8-OH-G and G as biomarkers for oxidative DNA damage. Herein, we report an electrochemical sensor, which was developed by modifying a GCE with 4-aminothiophenol using diazonium chemistry, to deposit AuNPs onto the surface of GCE for the simultaneous detection of 8-OH-G and G. The electrode was inspired by the work of Liu et al. [32], who developed a similar electrode using diazonium modifications.
In this study, we aimed to provide a comprehensive analysis of the sensor’s performance, including its linear range of detection, limit of detection (LOD), and sensitivity. The results of our study showed that our sensor had an excellent linear range of detection, low LOD, and improved sensitivity. In summary, our study provided a novel electrochemical sensor for the simultaneous detection of 8-OH-G and G, with potential applications in the early detection of oxidative stress-related diseases. The simple and cost-effective modification process, along with the high sensitivity and accuracy of the sensor, made it an ideal candidate for point-of-care diagnostic applications.

2. Materials and Methods

2.1. Reagents

Guanine (G) (≥98.0%), sodium nitrite (NaNO2, ≥99.0%), tetrachloroauric(III) acid trihydrate (HAuCl4∙3H2O, ≥99.9%), sodium citrate tribasic dihydrate (Na3-citrate, ≥99.0%), 4-aminothiophenol (SH-Ph-NH2, ≥97.0%) and acetonitrile (CH3CN, ≥99.9%), double-stranded and lyophilized fish sperm DNA (FS-DNA) with low molecular-weight were all purchased from Sigma-Aldrich Company (Oakville, ON, Canada). Sodium hydroxide (NaOH, ≥97.0%), and methanol (CH3OH, ≥99.9%) were purchased from ACP Chemicals Inc. (Montreal, QC, Canada). Hydrochloric acid (HCl, 36.5–38.0%) was purchased from Caledon Laboratory Chemicals (Georgetown, ON, Canada). 8-OH-G (≥90.0%) was purchased from Cayman Chemical Company (Ann Arbor, MI, USA). All alumina powder (1.0, 0.3, 0.05 µm) were purchased from Allied High Tech Products Inc. (Rancho Dominguez, CA, USA). Phosphate electrolytes and buffer solutions (PBS) were prepared at a concentration of 0.2 M using phosphoric acid (H3PO4, 85.0%) purchased from Fischer Scientific (Mississauga, ON, Canada), and the pH was adjusted using 10 M NaOH. The stock solutions for both G and 8-OH-G (0.01 M) were made by dissolving each compound in deionized water in the presence of 100 µL of 10 M NaOH and sonicating the solution for approximately 5 min.

2.2. Instrumentation

Transmission Electron Microscopy (TEM) was performed using a Hitachi H7500 Transmission Electron Microscope (Hitachi Ltd., Tokyo, Japan) equipped with an Olympus SIS MegaView II 1.35 MB digital camera. TEM images were processed using iTEM version 5.2 software. X-ray photoelectron spectroscopy (XPS) was performed using a Thermo Scientific K-Alpha spectrometer (Mississauga, ON, Canada) equipped with a monochromated Al Kα X-ray source (1486.6 eV), using an acquisition angle of 90° with a 20-eV pass energy, and the acquisition chamber being at a pressure of 10−8 mbar. The sonication of the DNA base solutions (G and 8-OH-G) was performed using a VWR B2500A-DTH ultra-sonicator (Thermo Scientific, Mississauga, ON, Canada). The pH of the solutions was measured using a VWR SB70P pH meter (Thermo Scientific, Mississauga, ON, Canada). Glassy carbon electrodes (GCEs) (3.0 mm diameter) were purchased from CHInstruments Inc. (Austin, TX, USA). For XPS studies, glassy carbon plates (GCP) (10 mm × 10 mm) were purchased from London Scientific Limited (London, ON, Canada). Electrochemical studies were performed at room temperature using Autolab Potentiostat/Galvanostat (PGSTAT 302N, Metrohm AG, Herisau, Switzerland) and the results were processed using the NOVATM software (NOVA 2.1.2, Metrohm AG, Herisau, Switzerland). The three-electrode system was comprised of the modified GCE as a working electrode. The counter electrode was a Pt rod, and the reference electrode was a saturated Ag/AgCl electrode housed in a 3 M KCl solution. Differential pulse voltammetry (DPV) measurements were measured between −0.3–+1.0 V, at a step potential of 0.005 V, a modulation amplitude of 0.0025 V, and a modulation time of 0.05 s.

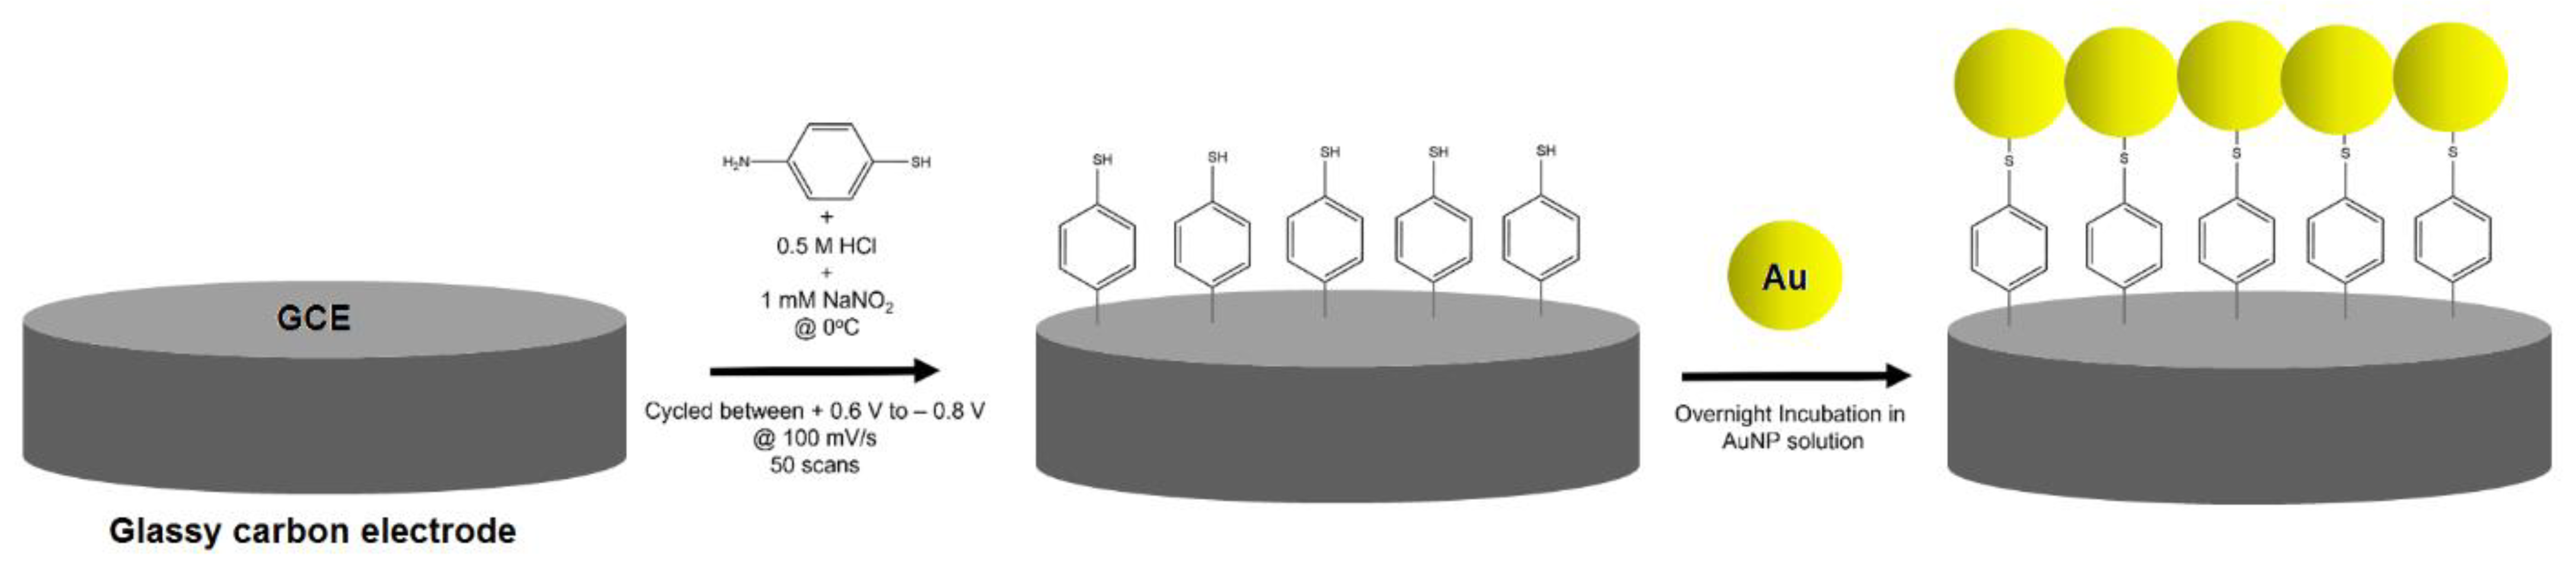
2.3. AuNP Synthesis and Electrode Modification

The synthesis of the AuNPs was adapted from the protocol reported by Liu and Lu [33]. Briefly, 100 mL of a 1 mM solution of HAuCl4 was dissolved in deionized (DI) water and heated on a hotplate. Once the solution reached boiling, 10 mL of a 38.8 mM solution of sodium citrate was added, resulting in a color change from pale yellow to dark blue to eventually wine red. The solution was allowed to stir overheat for another 15 min, after which it was allowed to cool down to room temperature. The AuNP solution was stored at 4 °C until use.
The protocol for the modification of GCE and GCP was adapted from Liu et al. [32]. The GCEs were polished using mixtures of 1.0, 0.3, and 0.05 μm alumina powder mixed with DI water in a sequence of 10 min with each. The electrodes were then rinsed with copious amounts of DI water, followed by sonication for 5 min in both DI water and ethanol, respectively.
The electrodeposition of the 4-aminothiophenol diazonium analogue was achieved by generating the aryl diazonium in situ. A 25 mL solution of 1 mM 4-aminothiophenol in 0.5 M HCl was mixed with NaNO2 (1 mM) under N2 gas (99.999%) at 0 °C. The reaction was allowed for 15 min. The electrodeposition of the in situ generated diazonium salt was carried out under N2 gas conditions by running cyclic voltammetry (CV) between the potentials of +0.6 V to −1.0 V at a scan rate of 100 mV/s for 2, 10, and 50 scans (Figure 1). The anodic peak current values remained the same for electrodeposition procedures beyond 50 cycles, thus, we determined the application of 50 cycles for the optimum condition for the diazonium electrodeposition. The modified GCE is denoted as GCE-Ph-S-AuNPs.
The electrodes were then rinsed with DI water, acetonitrile, and DI water in sequence, followed by drying the electrodes under a gentle stream of N2 gas. Once the electrodes were modified, they were incubated in the AuNPs solution overnight at room temperature. The electrodes were then rinsed with DI water and allowed to dry. The three-electrode system included the GCE-Ph-S-AuNPs as the working electrode, a platinum foil as the auxiliary electrode, and a saturated Ag/AgCl as the reference electrode. All potentials were reported versus the saturated Ag/AgCl reference electrode at room temperature.

2.4. Real Sample Preparation

To prepare the real DNA sample (salmon sperm), 1 mg of FS-DNA was dissolved in 25 mL of 0.2 M phosphate buffer at pH 7. This stock solution was used for the preparation of the spiked solutions of G and 8-OH-G. Artificial cerebrospinal fluid (ACSF) was prepared by a method described by Tamano et al. [34] This solution consisted of 119 mM NaCl, 36.2 mM NaHCO3, 2.5 mM KCl, 1.3 mM MgCl2, and 10 mM glucose (pH = 7.3). The reagents were added and stored at 4 °C until use.

3. Results and Discussion

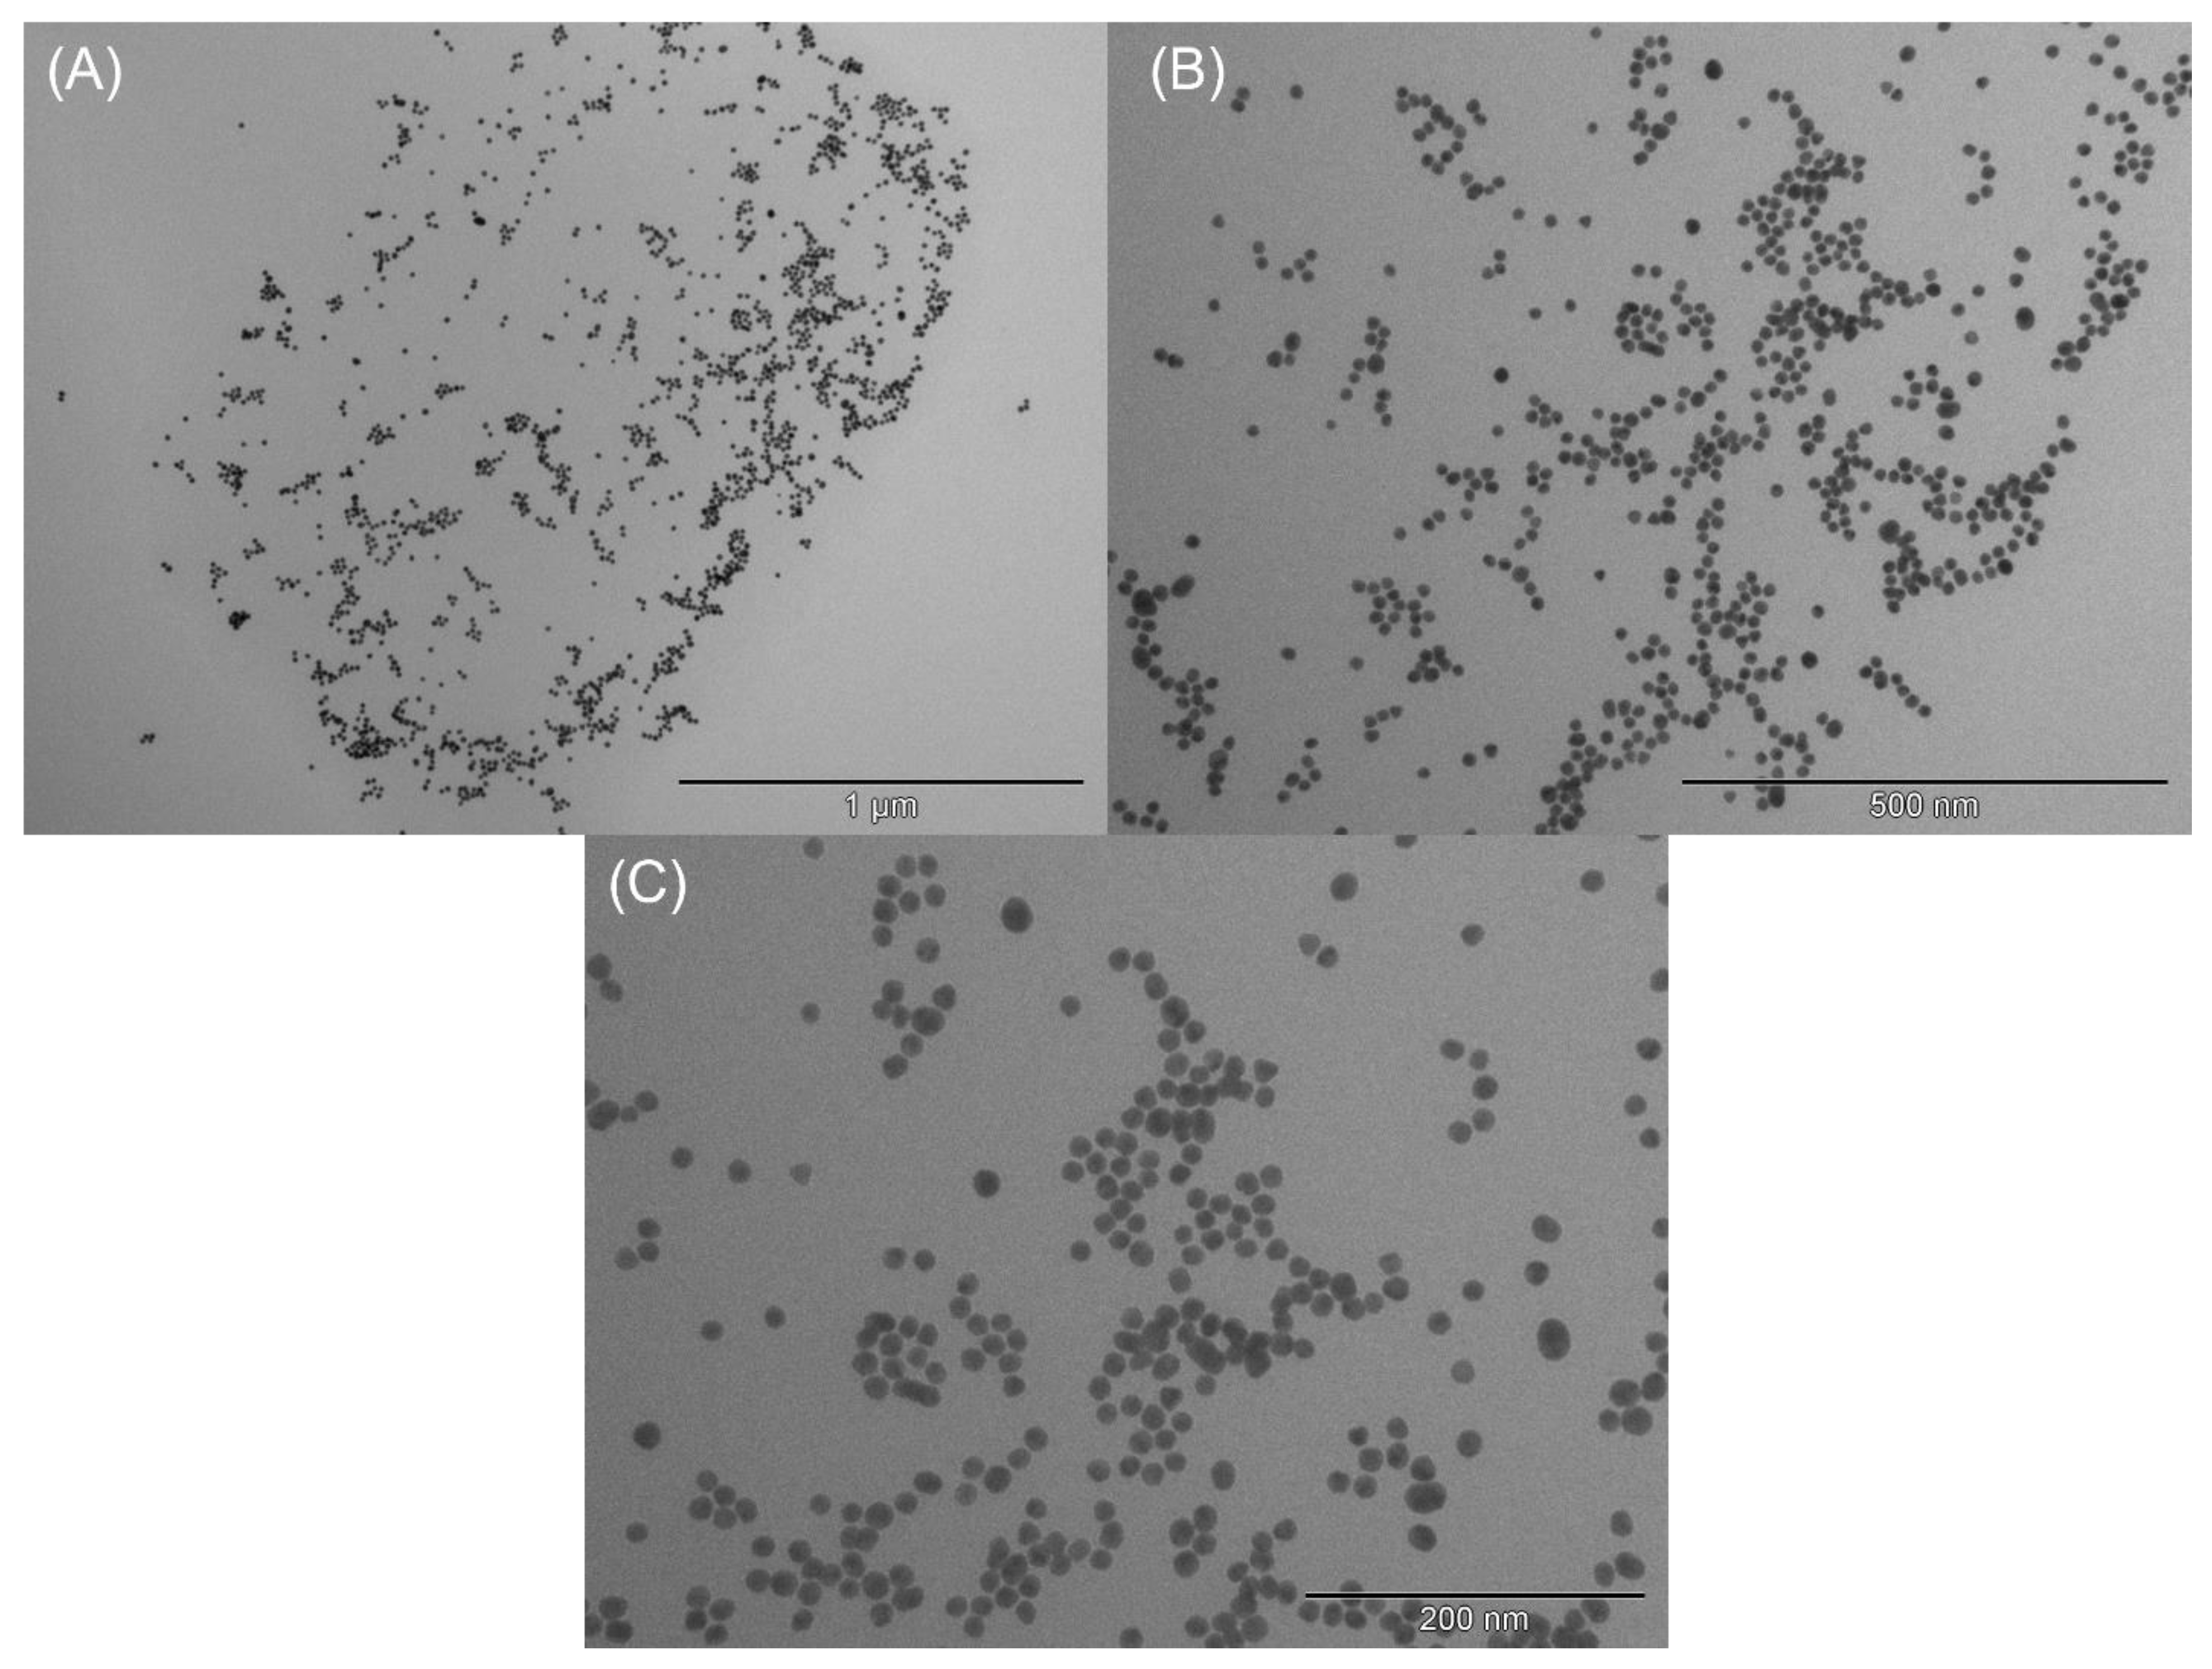
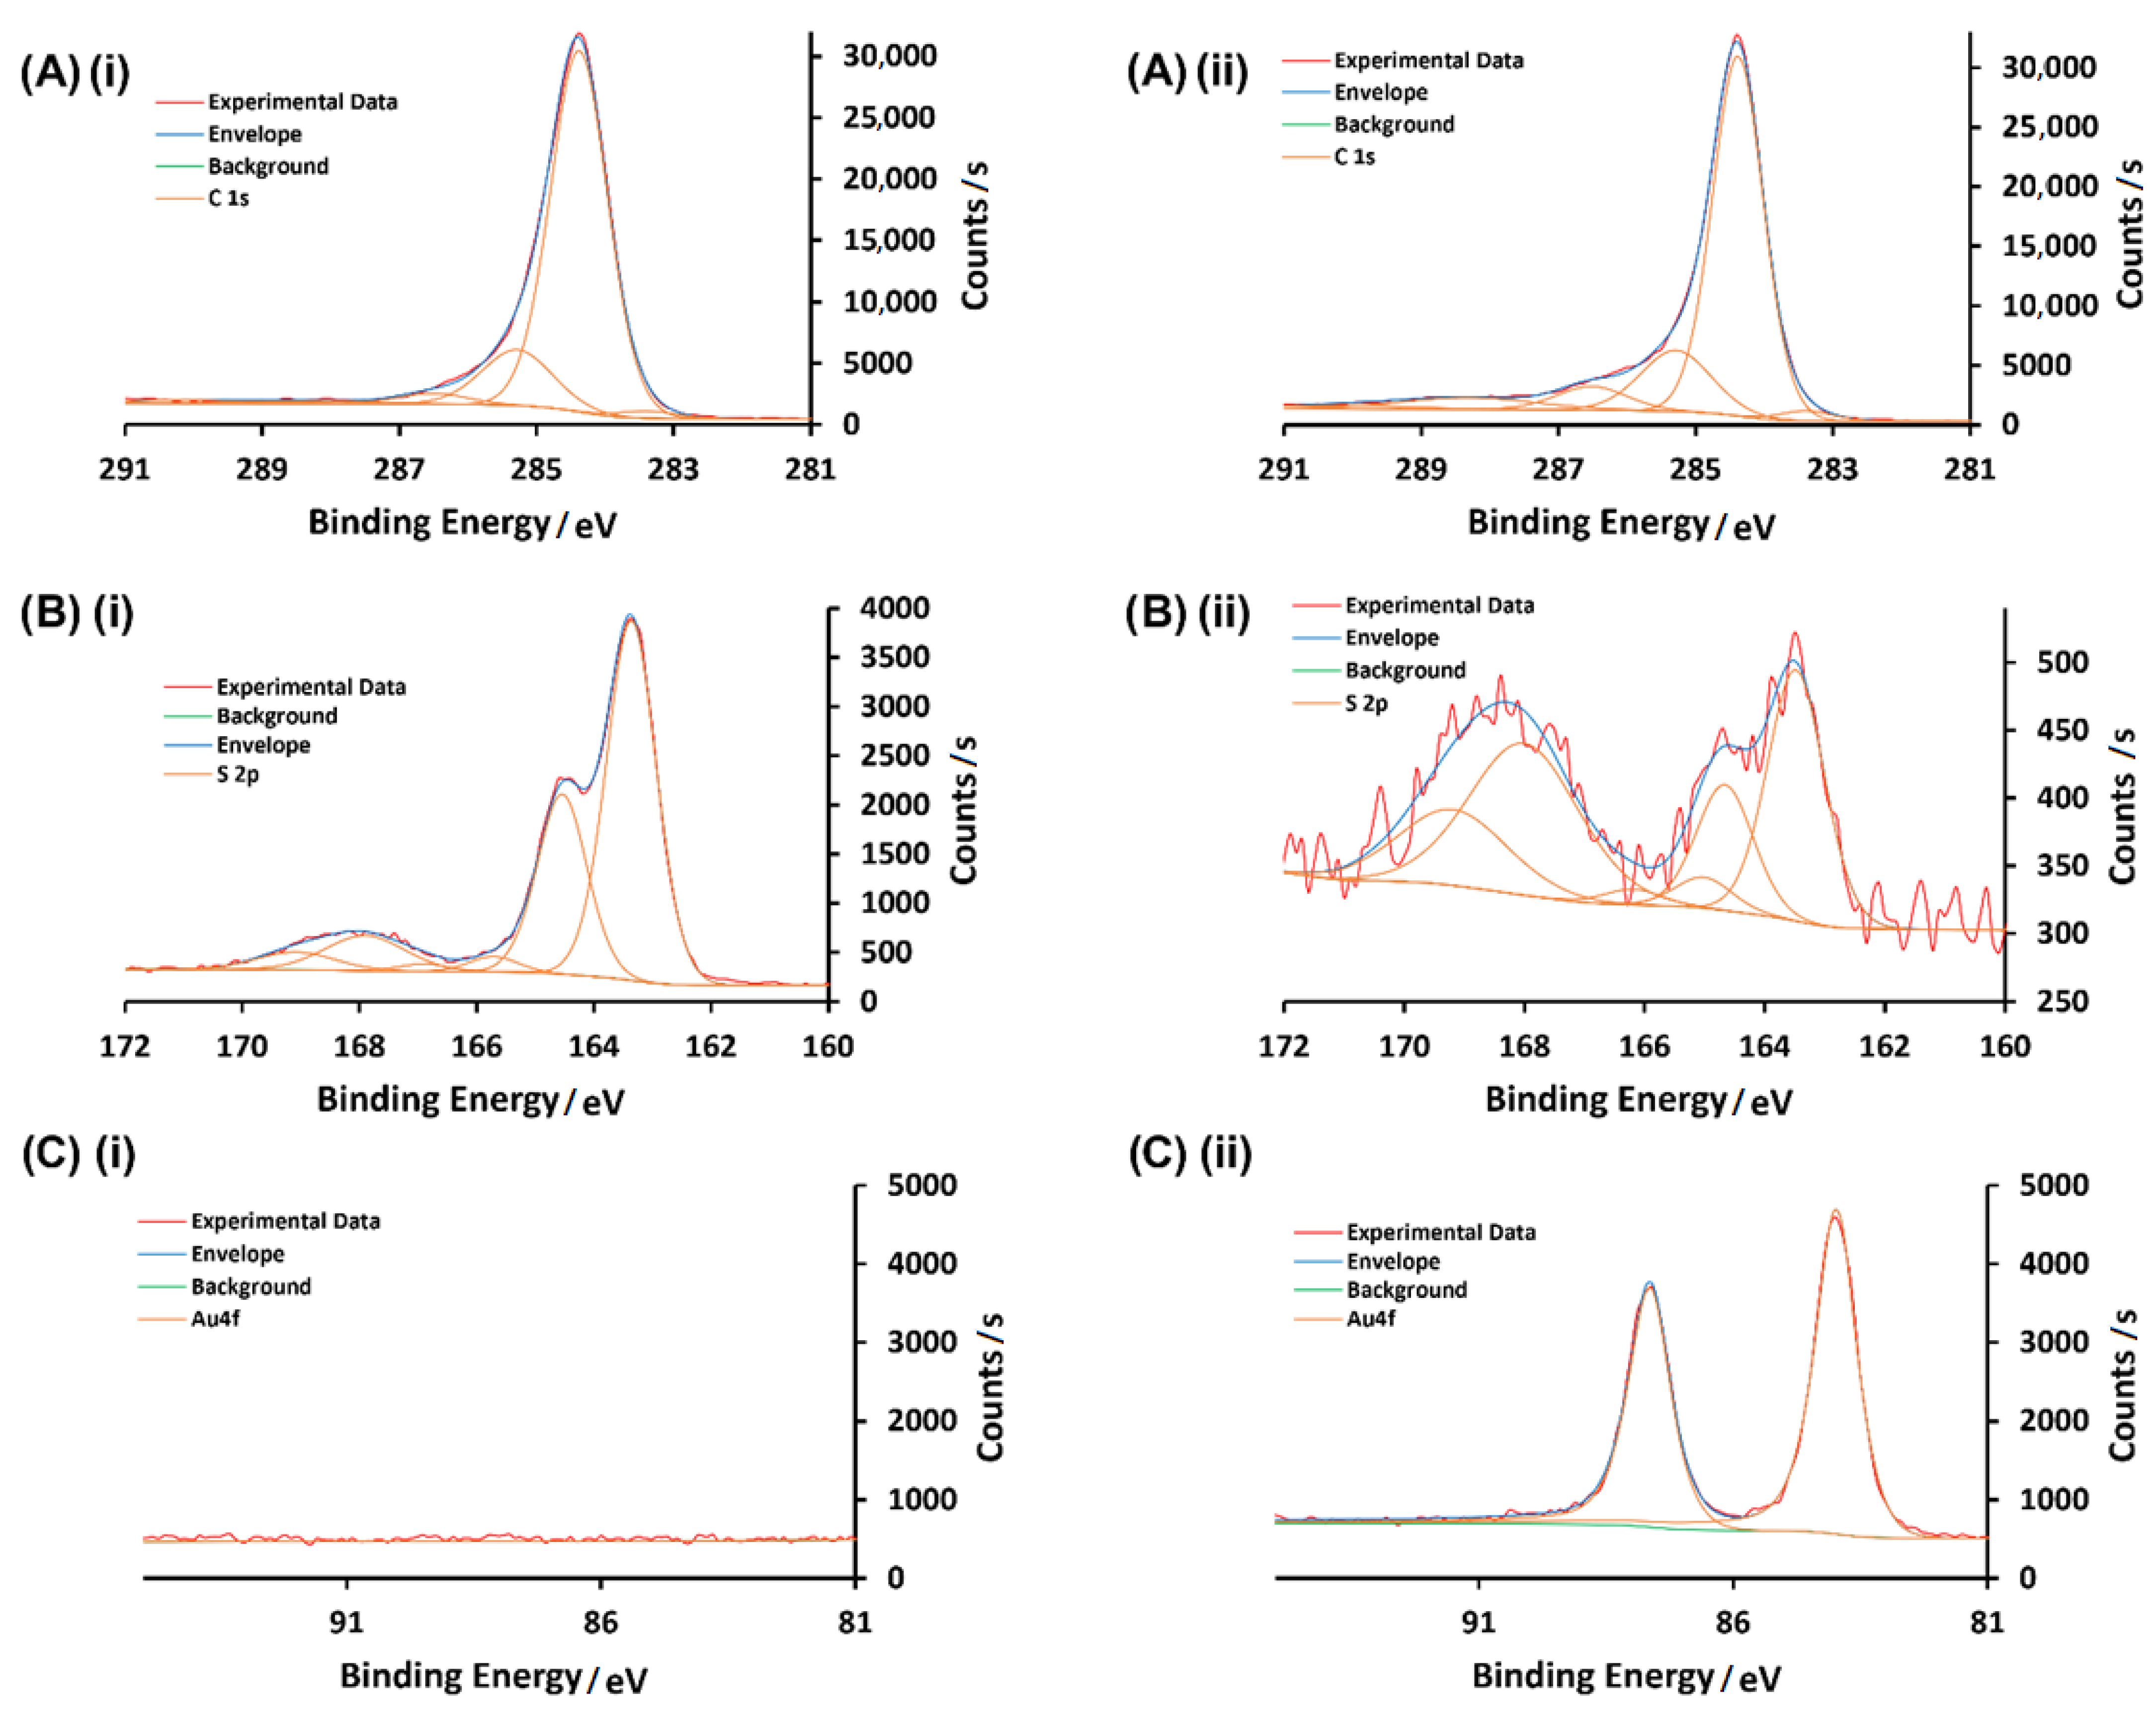
3.1. Characterization of AuNPs and Modified GCEs

Figure 2 shows the TEM images taken of the AuNPs synthesized. The TEM images show that the AuNPs had a near-uniform size, which was approximately 10 nm i.d., well in agreement with previous reports [35].
Figure 3 shows the XPS of the surfaces deposited with either the thiophenol moiety (i) or the thiophenol moiety along with the AuNPs (ii). As shown in Figure 2A, the C 1s spectra were deconvoluted using a five-peak model. The spectra for both GCE with and without the AuNPs are nearly identical indicating the glassy carbon surface and the electrodeposited thiophenol moiety remained intact following the incubation with the AuNPs. Specifically, the peaks deconvoluted at 284.4 and 288.3 eV corresponded to graphitic carbon and a carbonyl group, respectively, originating from the glassy carbon surface, while the peak at 286.5 eV corresponded to the phenolic groups found on both the glassy carbon surface as well as the electrodeposited thiophenol group [36]. The deconvoluted S 2p spectra (Figure 2B) for the sensor before incubation with the AuNPs and after incubation showed peaks at 164.5 and 164.7 eV which were both indicative of the thiophenol moiety as reported by Kwan et al. [36]. Lastly, the Au 4f spectra of the modified GCE before incubation with the AuNPs showed no deconvoluted peaks, however after incubation, two peaks were deconvoluted at 84.0 and 87.7 eV corresponding to the Au 4f7/2 and Au 4f5/2 spin orbit coupling characteristic of AuNPs with an oxidation state of 0 [37]. Table S1 shows the relative atomic percentage of each element before incubating with AuNPs and after incubation. According to this table, the modified GCE with thiophenol diazonium salt (GCE-Ph-SH) had C and S but no N. This confirmed that the diazonium group formed N2(g) after electrografting. Because AuNPs had a higher affinity for the sulfur group, the sulfur was covered by AuNPs and thus, the sulfur percentage dropped as the percentage of Au increased.

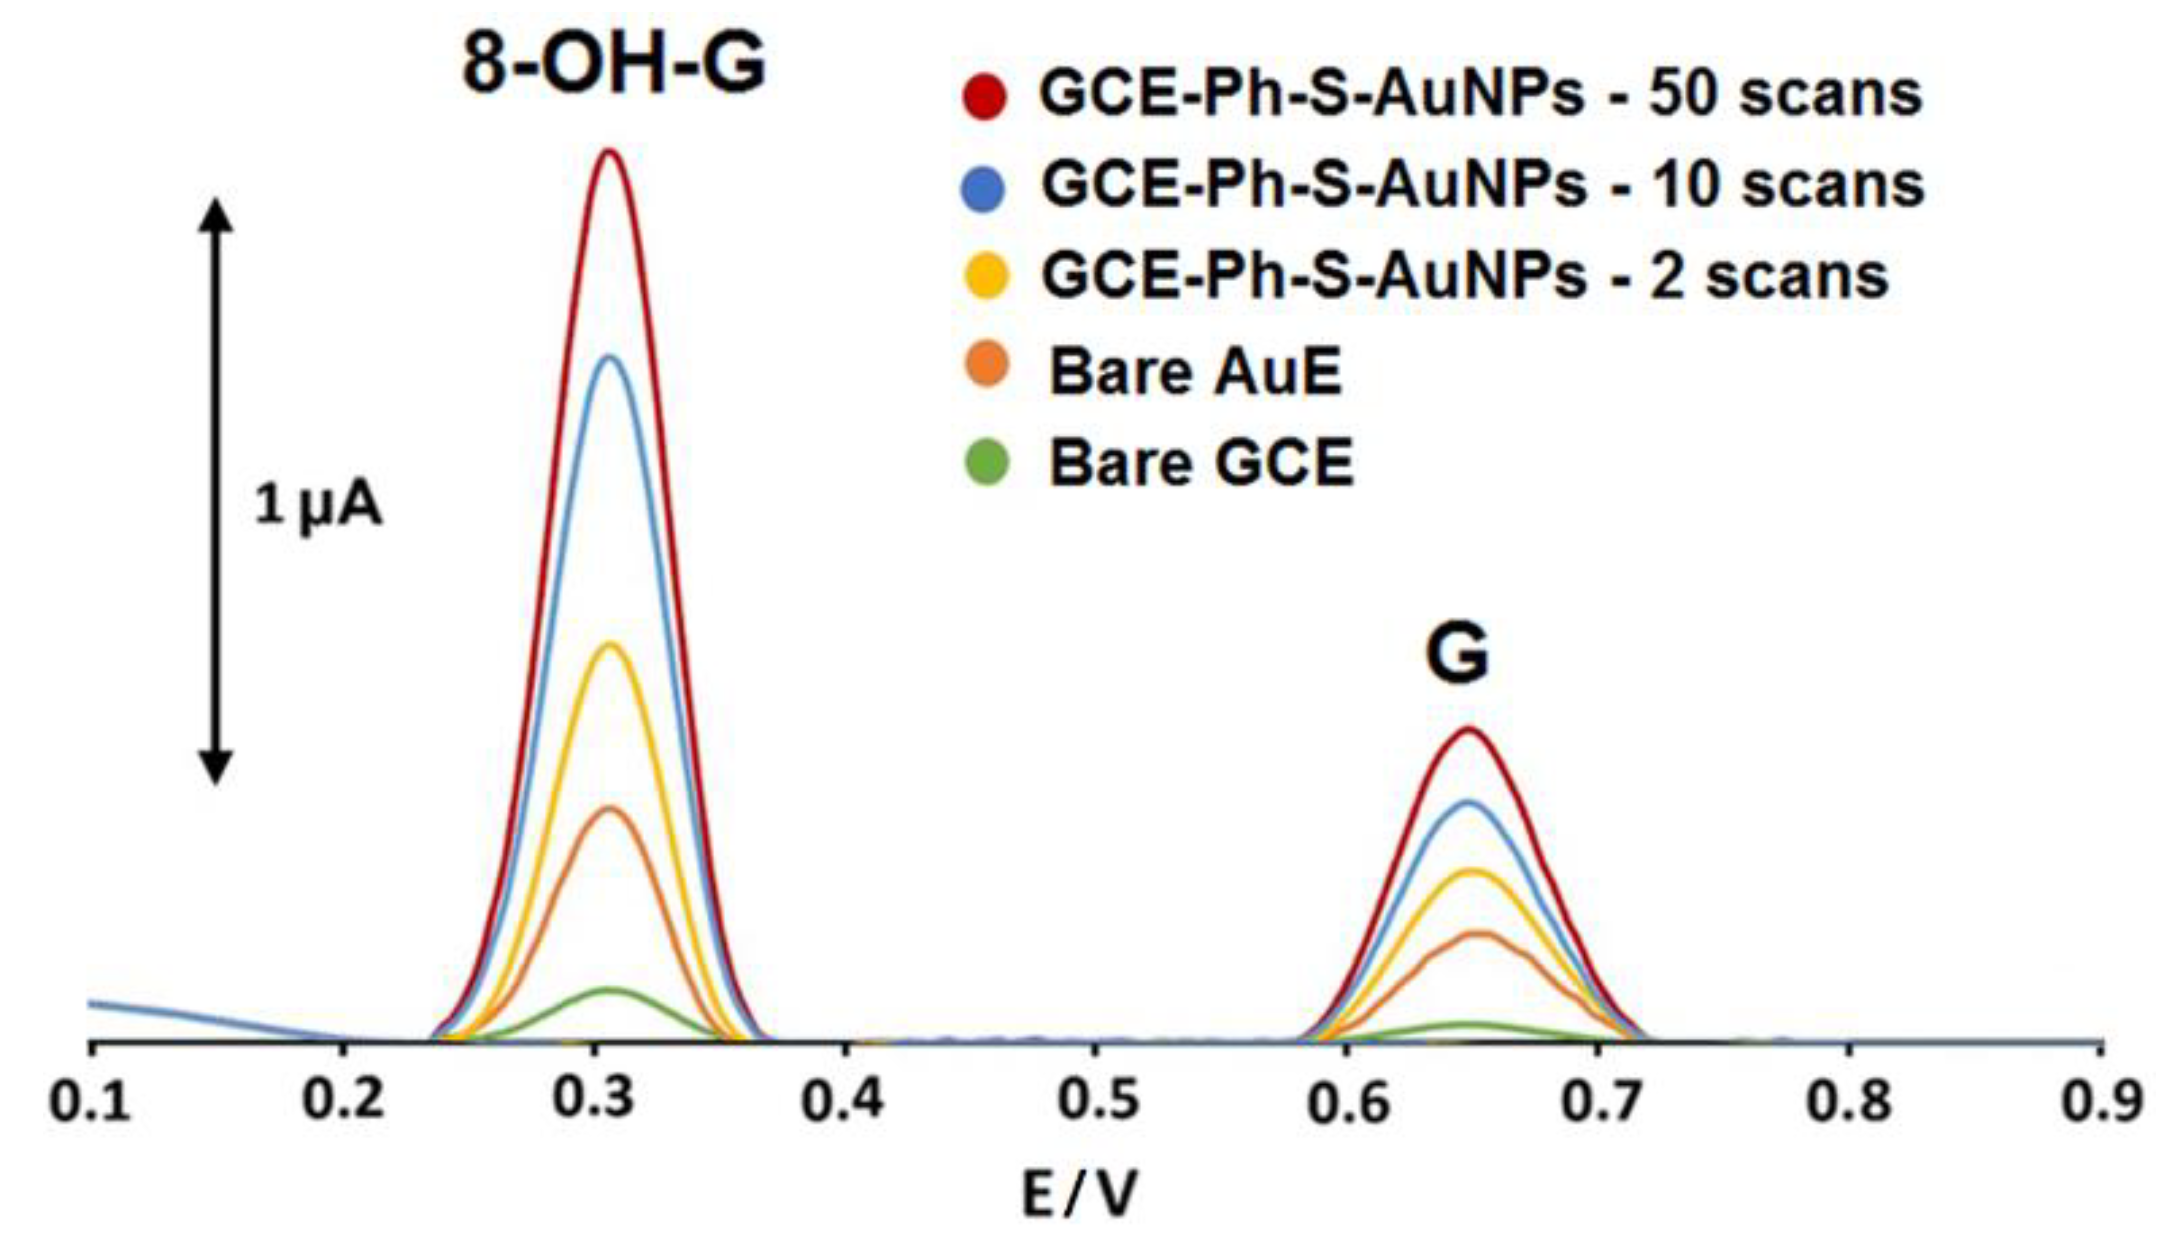
3.2. Comparison between the Modified Surfaces
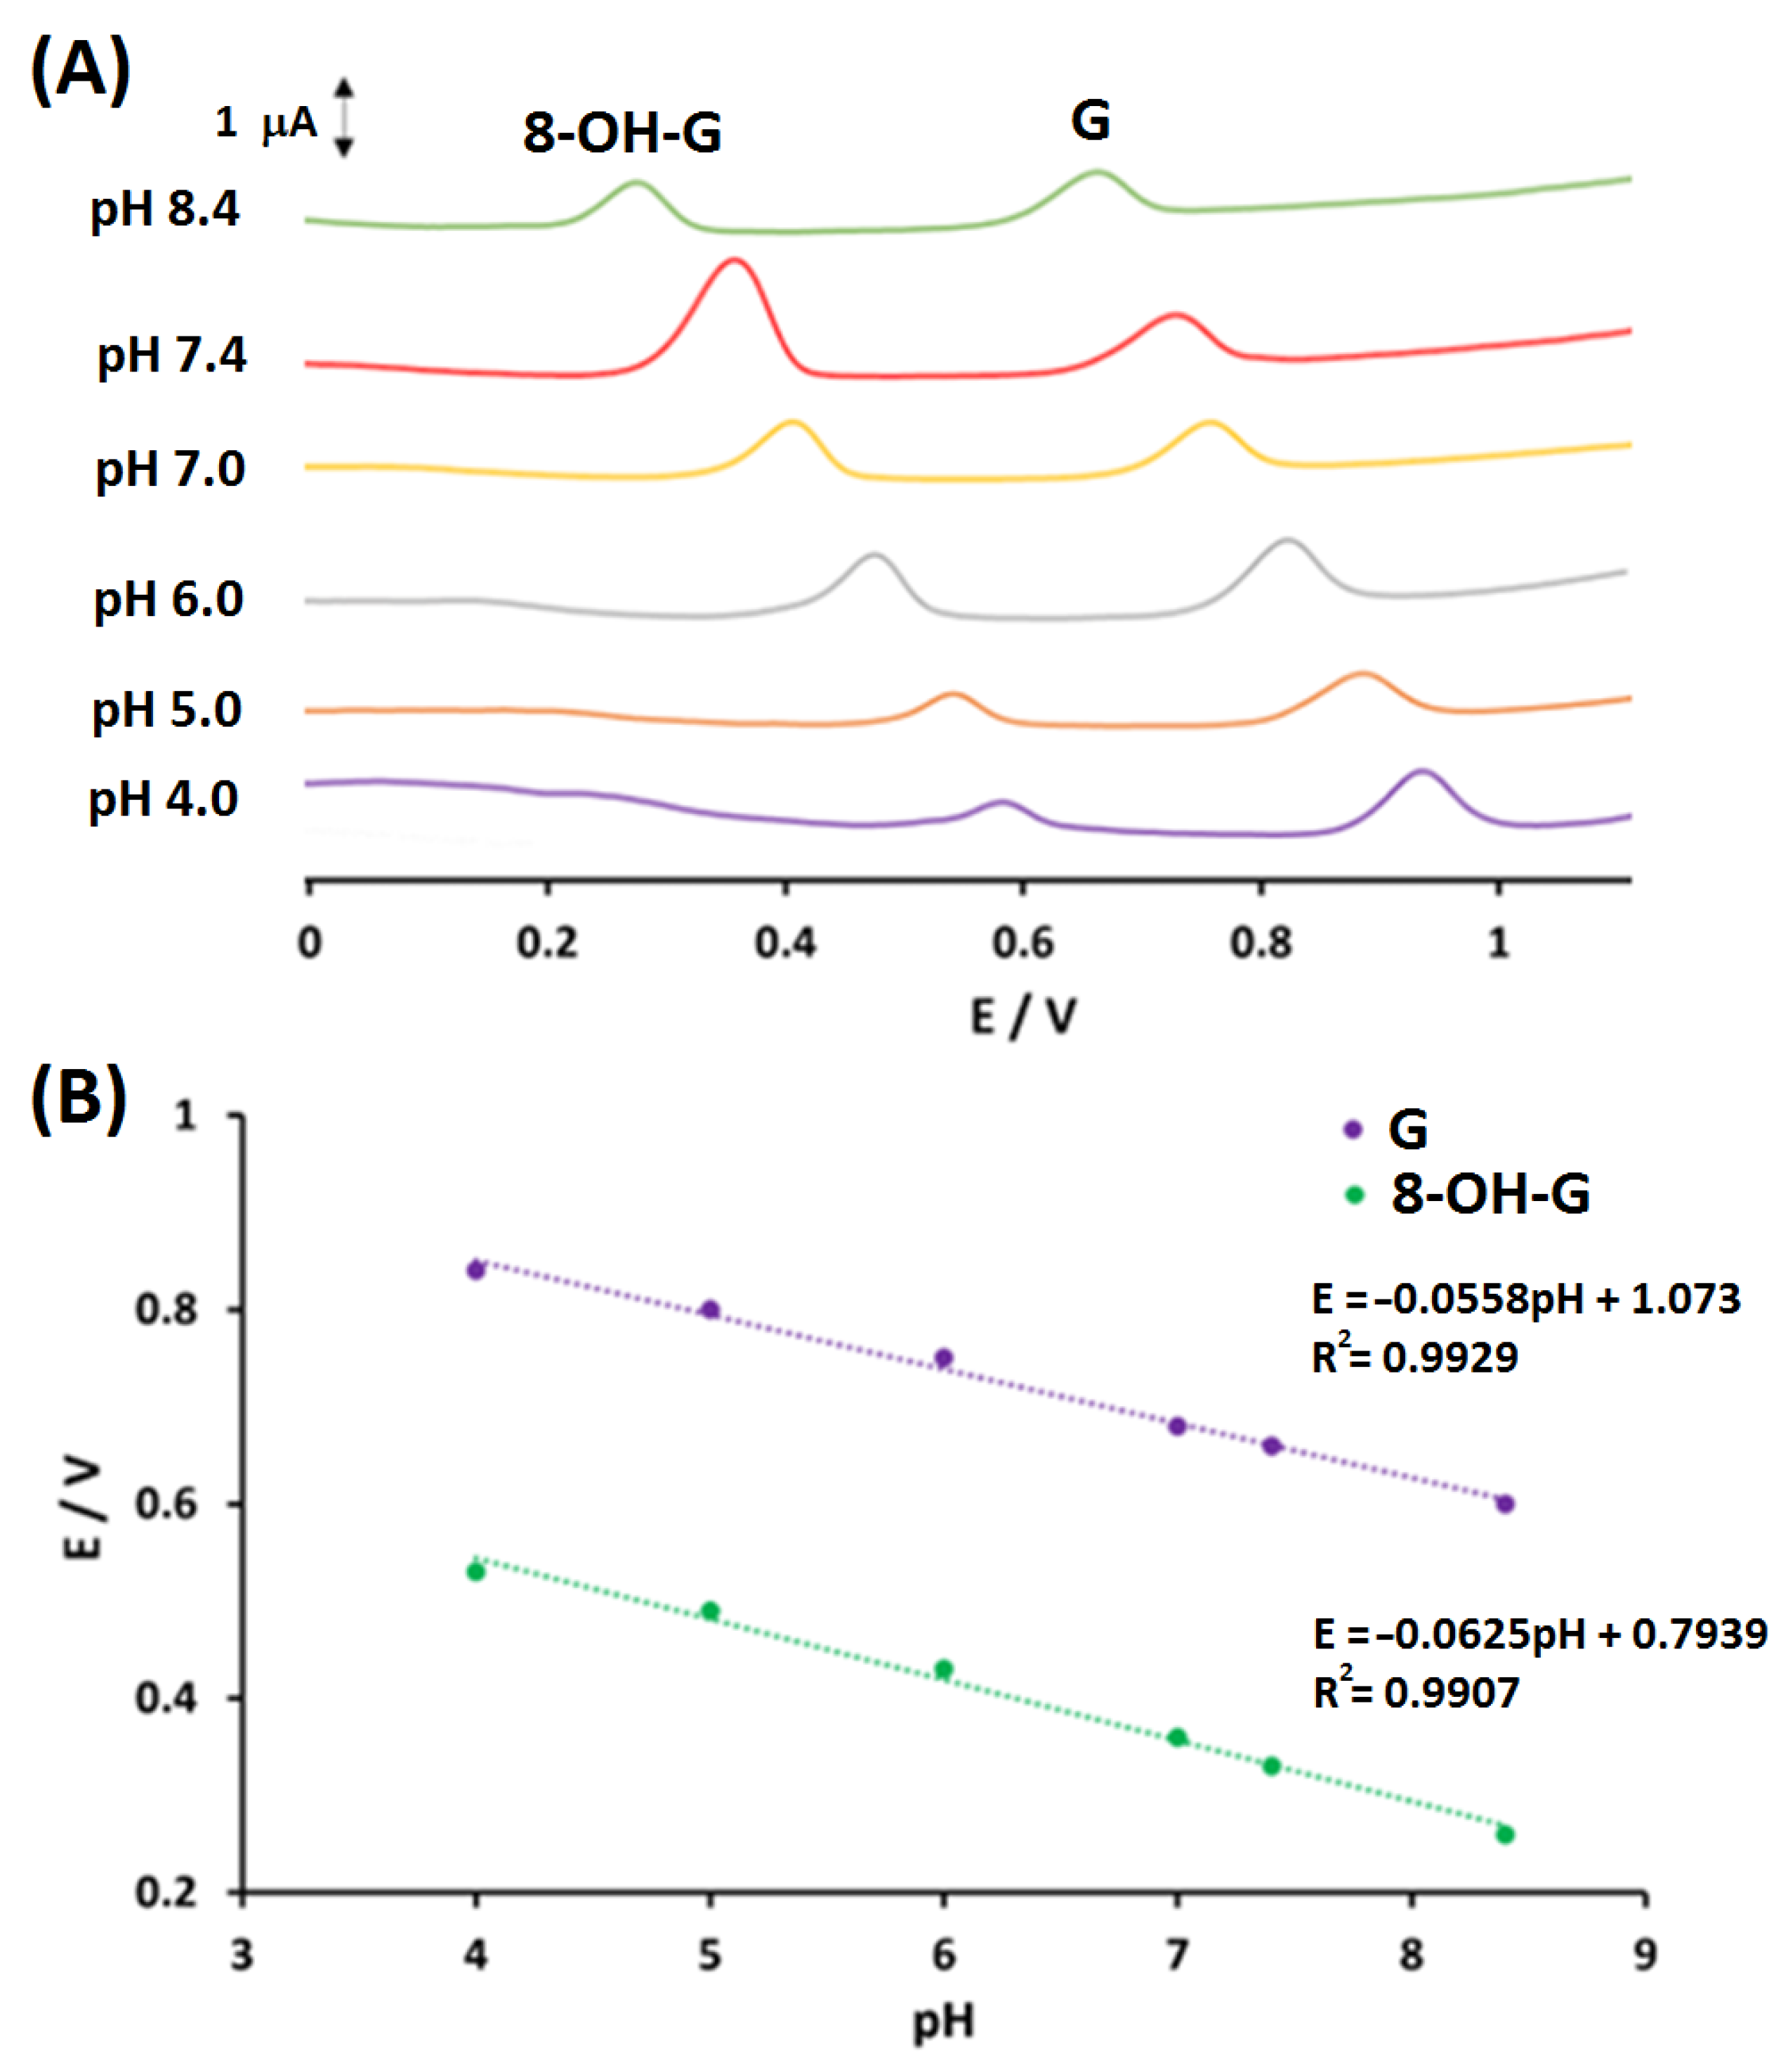
In an aim to ensure that the AuNPs-modified sensor performed better in terms of detecting 8-OH-G and G, a study was performed to compare the electrochemical activity of the AuNPs-modified sensor versus control electrodes. Figure 4 shows the DPV of the comparison study, which was performed in 0.2 M PBS (pH 7.4). The concentration of both nucleobases was kept constant at 2.0 µM for G, and 4.0 µM for 8-OH-G. As shown in Figure 3, there was a significant difference in terms of sensitivity between the modified sensor at different scan rates and the bare gold electrode (AuE) and the bare GCE. The average anodic peak current values (n = 3) for 8-OH-G were 0.17, 0.52 µA at the bare GCE and bare AuE, and 1.10, 1.23, and 1.56 µA at the GCE-Ph-S-AuNPs prepared with 2, 10 and 50 cycles of diazonium electrodeposition, respectively, which showed an approximately 50-fold increase in sensitivity in comparison with the bare electrode. The average anodic peak current values (n = 3) for G were 0.08, 0.21, 0.32, 0.54, 0.67 µA at the bare GCE, bare AuE, and the GCE-Ph-S-AuNPs prepared with 2, 10 and 50 cycles, respectively. The oxidation peaks of 8-OH-G and G were separated with a considerable enhancement by using the AuNPs-modified sensor. These results indicated that the well-defined voltammetric signals were promising for sensitive and simultaneous determination of 8-OH-G and G.

3.3. pH Study

The acidity of the electrolyte had a significant influence on the 8-OH-G and G electrooxidation because protons took part in the redox reaction at the electrode surface. To determine the optimum pH at which the GCE-Ph-S-AuNPs operated, as well as to determine the electrochemical oxidation mechanism of both G and 8-OH-G, the sensor was tested in solutions of PBS at varying pH (pH 4.0, 5.0, 6.0, 7.0, 7.4, 8.4). Figure 5A shows the DPV of the GCE-Ph-S-AuNPs detecting G and 8-OH-G in the different pH conditions. The peak potentials of the analytes shifted to more negative values when the pH increased, as shown in Figure 5A, because protons participated in the oxidation of these analytes [38,39]. The optimum pH was determined to be 7.4, since at this pH, the GCE-Ph-S-AuNPs exhibited excellent sensitivity for both G and 8-OH-G. Furthermore, Figure 5B shows a plot of the anodic peak potentials for G and 8-OH-G with respect to the pH, as well as the equations representing a linear relationship. The slopes of the linear relationship between the anodic peak potential and pH for both G and 8-OH-G were found to be 55.8 mV/pH and 62.5 mV/pH, respectively. Given that both slopes were near the Nernstian theoretical value of 59.1 mV/pH, it was concluded that the electrochemical oxidation mechanism for both analytes involved an equal number of protons and electrons transferred in a similar fashion to those reported in prior literature [40,41,42]. Figure 6 shows the proposed electrochemical oxidation mechanisms for both 8-OH-G (Figure 6a) and G (Figure 6b), based on the correlation of anodic peak potential as a function of pH. G was oxidized to 8-OH-G via the loss of two electrons and two protons, which could then undergo a ketone-enol tautomerization. The oxidation of 8-OH-G took place with the loss of two protons and two electrons. Once 8-OH-G was oxidized, the resulting compound was then broken down to 2,5-diamino-4-imidazolone and 5-guanidohydantoin, which was well documented in the literature [40,41,42].

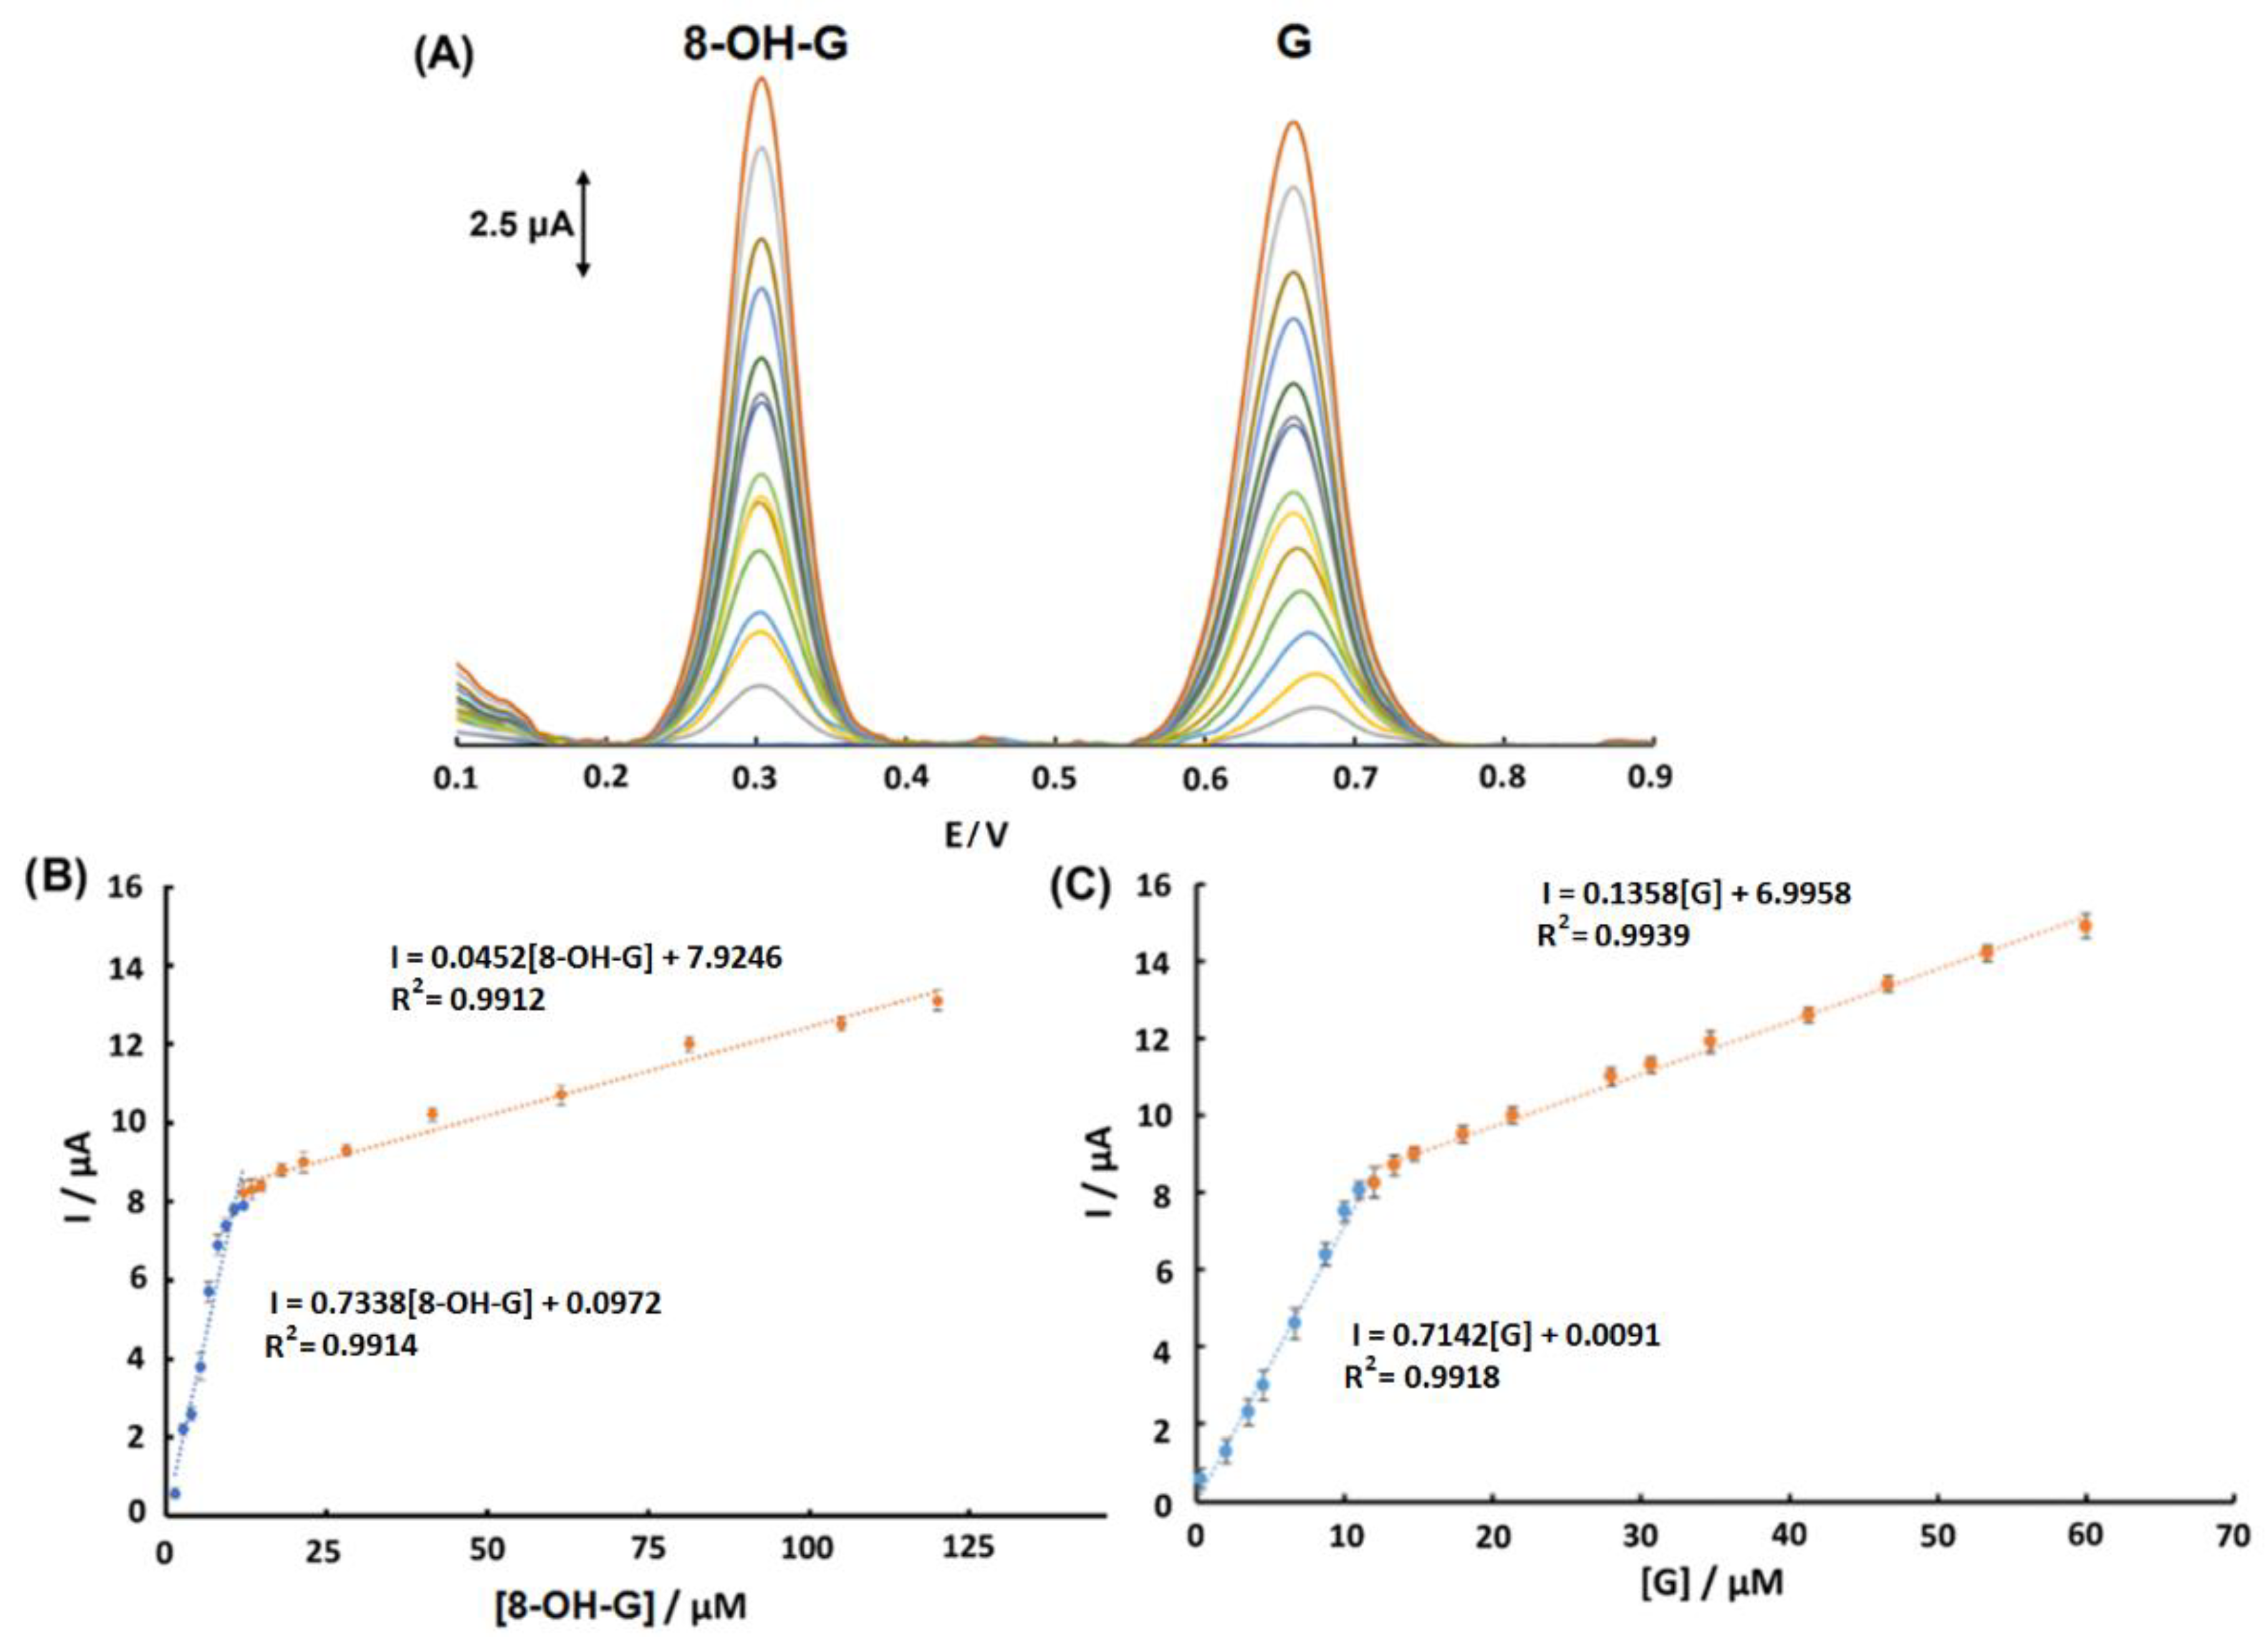
3.4. Calibration Study

In order to determine the limit of detection (LOD) for G and 8-OH-G, a calibration curve was constructed by simultaneously spiking G and 8-OH-G to 0.2 M PBS (pH 7.4), and the overlaid DPV curves are shown in Figure 7A. Calibration plots were constructed by plotting the respective current peaks of 8-OH-G and G with respect to the concentration of the nucleobases (Figure 7B,C). For both G and 8-OH-G, two linear ranges were observed. For 8-OH-G, the linear ranges were determined to be between 1.3–12.0 µM and 12.0–125.0 µM, while for G, the linear ranges were determined to be between 0.3–12.0 µM and 12.0–60.0 µM. This phenomenon of two linear ranges was also observed in the literature [43,44,45,46,47], in which it was hypothesized that calibration plots displayed variable slopes in a wide concentration range of biomolecules. The analytes diffused to the surface easily at lower concentrations, whereas at higher concentrations, the adsorption of the analytes at the surface of the electrode hindered the diffusion as well as slowed down the kinetics of the oxidation processes [48,49]. At low concentrations, the redox-active surface area was available to the biomolecules. However, once the concentration of the analyte increased, the biomolecules saturated the redox-active surface areas leading to a decrease in the sensitivity of the electrode. As a result, we observed a decrease in the slope at higher concentrations. The LOD was calculated using the equation LOD =  3 S b k m . In this equation, Sbk is the standard deviation of the blank signals (n = 10), and m is the slope of the linear calibration curve. Based on this equation, the LOD was found to be 0.020 and 0.021 µM for 8-OH-G and G, respectively.
Table 1 shows a comparison of sensors reported in the literature for the detection of either 8-OH-G, G, or both. GCE-Ph-S-AuNPs detected both a lower LOD and a wider linear range for 8-OH-G than those reported in the literature [40,41]. Our sensor displayed relatively similar performance with other sensors that detected G [46,47]. Furthermore, GCE-Ph-S-AuNPs was one of the few reported sensors that detected 8-OH-G and G simultaneously. The application of GCE-Ph-S-AuNPs led to an increase in sensitivity and potential window range, making it well-suited for studying the redox processes of 8-OH-G and G. The high surface area of GCE allowed for a wide potential window range that enabled a broader range of electrochemical reactions to be studied. Additionally, the incorporation of AuNPs enhanced the stability of this sensor, making it a highly favorable choice for this study. In addition, the repeatability of the GCE-Ph-S-AuNPs was studied using the DPV measurements for 10 consecutive measurements (n = 10) by simultaneously detecting 8-OH-G and G, and the results are shown in Figure S1A. The relative standard deviation (RSD) of the results were 1.72 and 1.75% for 8-OH-G and G, respectively. These results confirmed the excellent repeatability of the sensor. The stability of the GCE-Ph-S-AuNPs was explored after storing the sensor for 5 months in 0.2 M phosphate electrolyte solution (pH 7.4). The same concentrations of the analytes were used to record the DPV signals. The anodic peak current values of 8-OH-G and G were constant with negligible shifts in the anodic peak potentials (Figure S1B). The RSD for anodic peak current values for 8-OH-G and G were 1.32% and 2.45%, respectively, which indicated excellent long-term stability of the GCE-Ph-S-AuNPs.

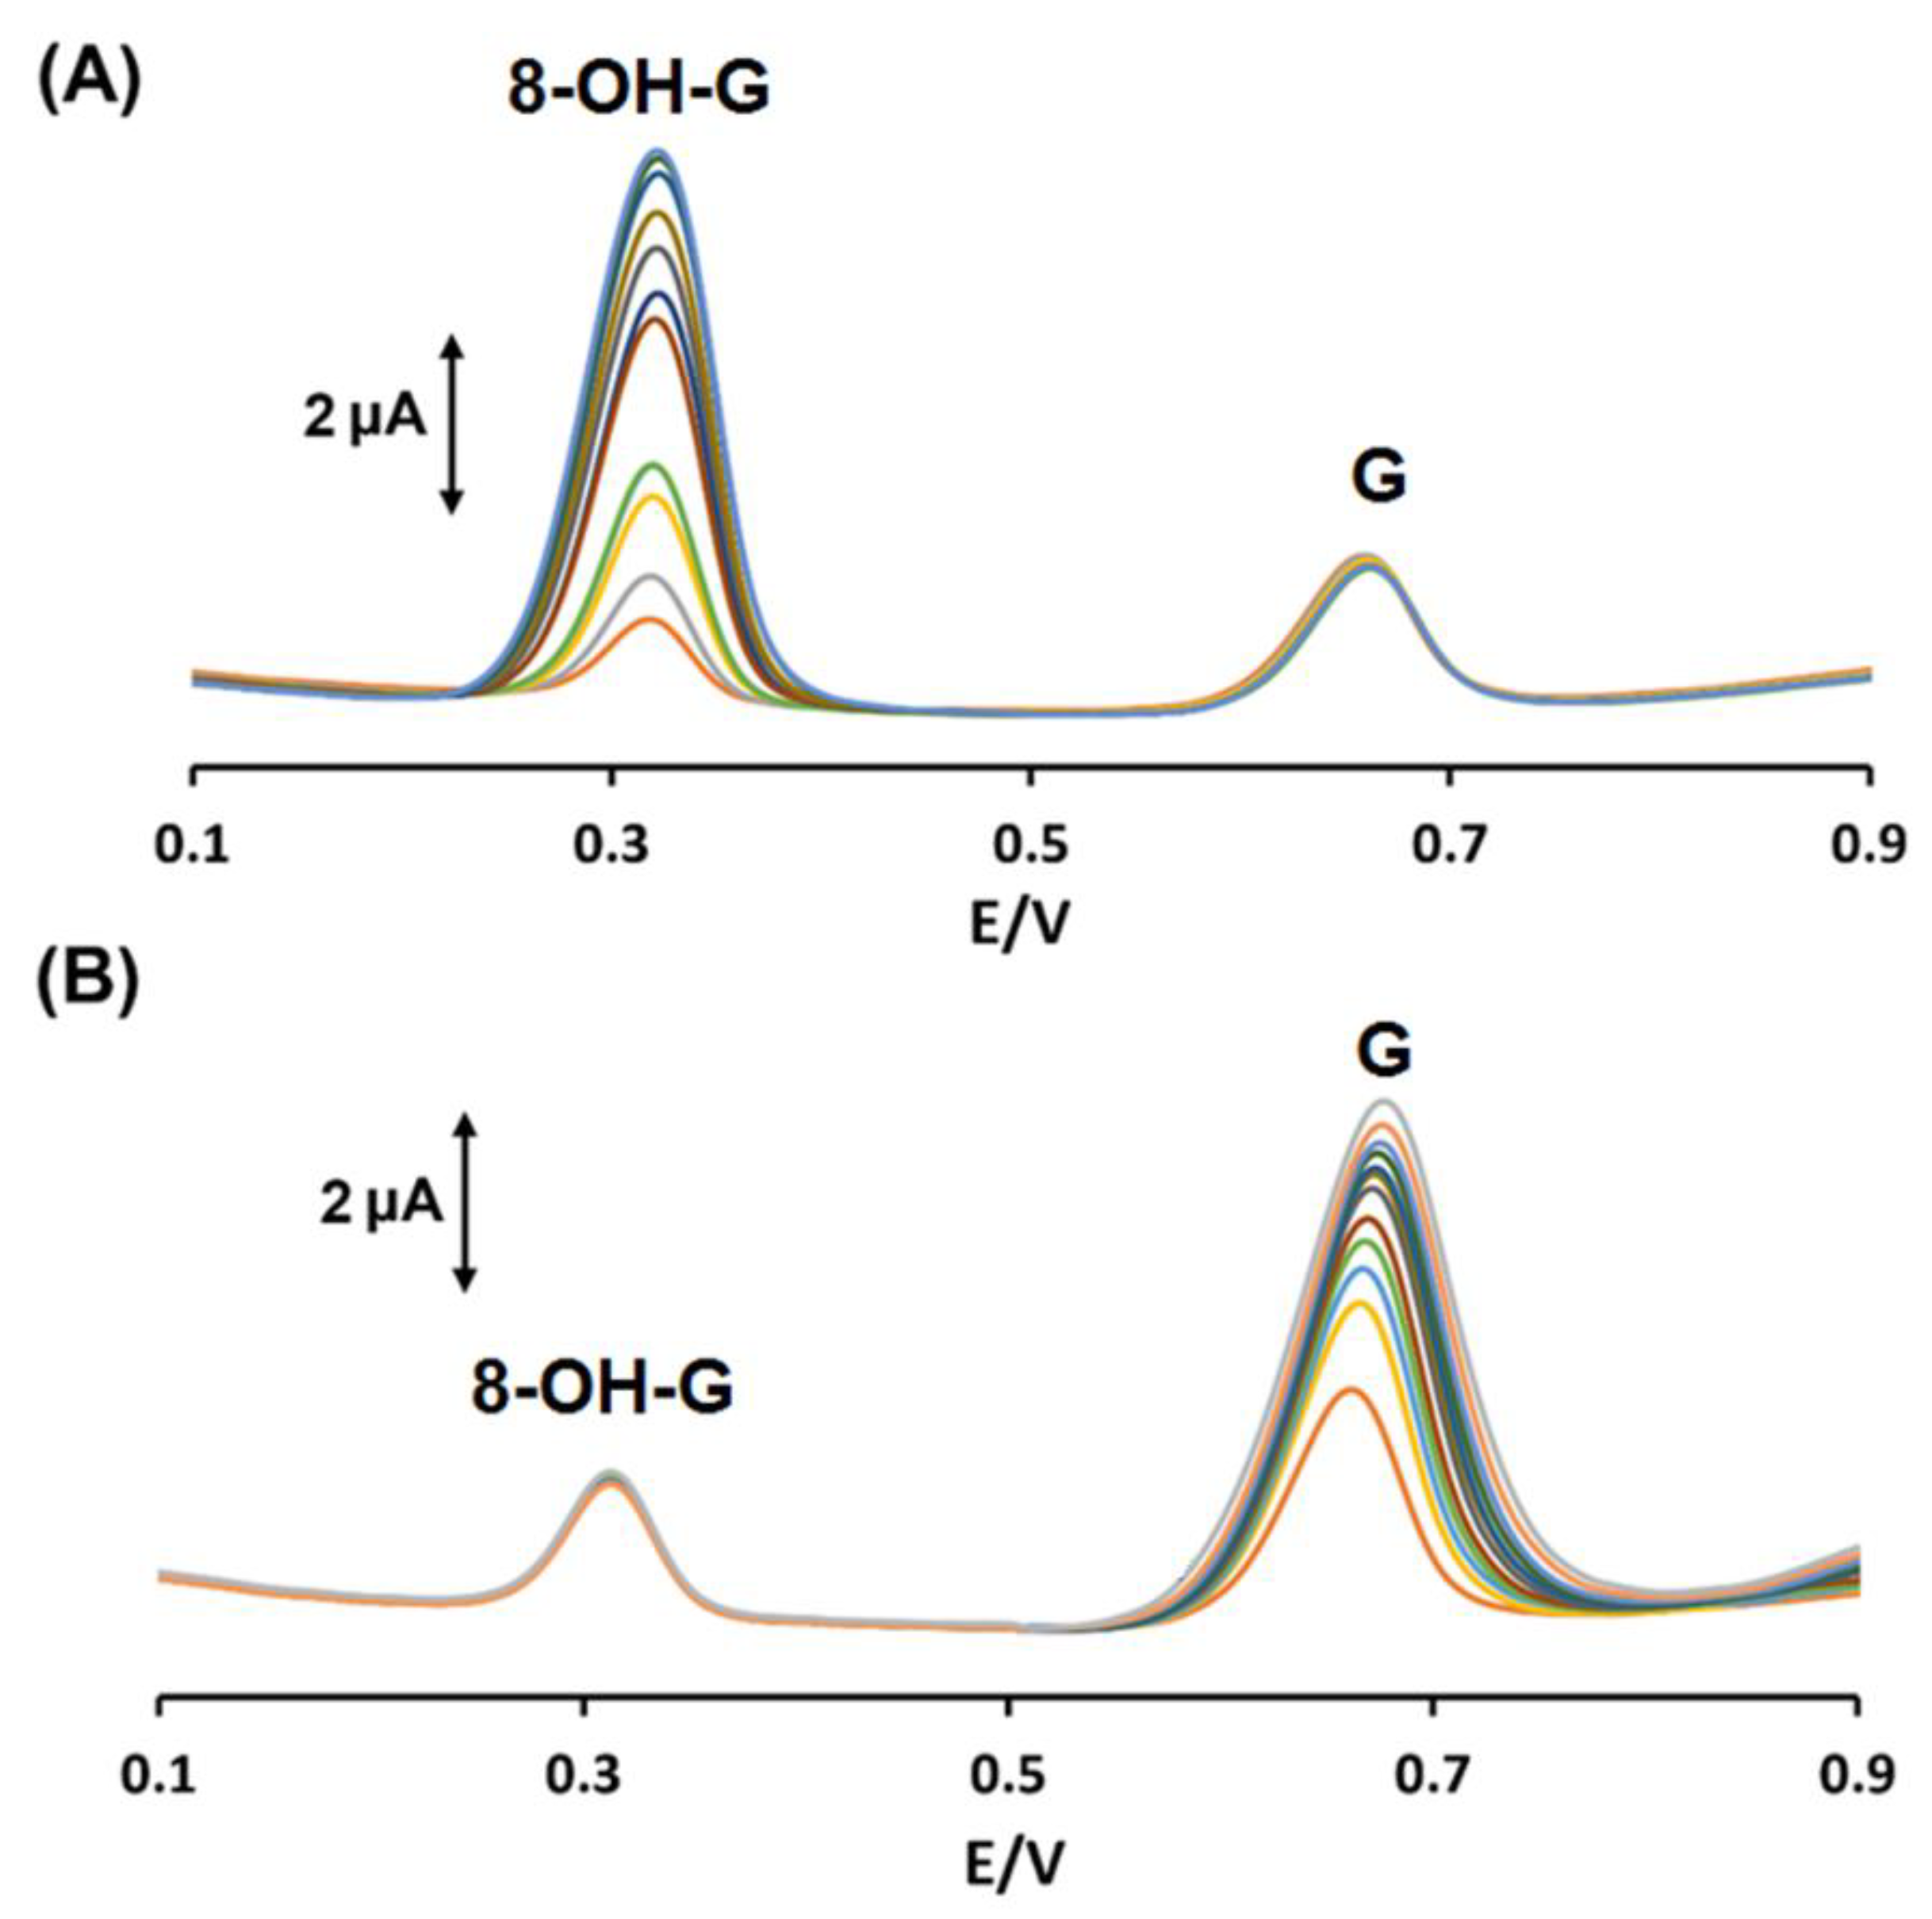
3.5. Interference Study

The oxidative stress biomarker, 8-OH-G can coexist with G in real samples, thus, it is of great interest to study the interferences between them for the selective detection of each species. In all control experiments, the concentration of one species was changed, while the concentration of the other species was kept constant. An interference study was performed to determine whether the detection of 8-OH-G interfered with G or vice-versa (Figure 8). This was conducted by gradually increasing the concentration of either 8-OH-G or G from 6.7–66.7, while keeping the concentration of the other nucleobase constant at 6.7 µM. As shown in both interference studies for 8-OH-G (Figure 8A) and G (Figure 8B), progressively increasing the concentration of one nucleobase did not interfere with the detection of the other nucleobase. Other DNA bases such as adenine, thymine, and cytosine showed oxidation peaks at higher anodic potentials beyond 1 V (vs. Ag/AgCl) under the same ionic strength and pH conditions [39,44], and thus, they did not show any interference on the simultaneous determination of 8-OH-G and G.

3.6. Electrochemical Impedance Spectroscopy (EIS) and Scan Rate Study

EIS is a powerful technique for analyzing interfacial properties and the shape of the impedance arc (depressed or distinct) is dependent on the contact impedance between the substrate and the active material on the surface of the electrodes. For fitting and simulation of EIS data, the NOVA™ software (NOVA 2.1.2, Metrohm AG, Herisau, Switzerland) was used, and the modified Randles equivalent circuit is shown in the inset of Figure S2. In this circuit, Rs, Rct, Cdl, and ZW represent solution resistance, charge-transfer resistance, double-layer capacitance, and Warburg element, respectively (inset in Figure S2). For bare GCE, the Nyquist plots revealed a semicircle with an average Rct of 1719.3 Ω (n = 3). The Rct decreased to 879.1, 478.4, and 425.7 Ω for the GCE-Ph-S-AuNPs that were prepared with 2, 10, and 50 scans of diazonium electrodeposition, respectively, resulting in a significantly lower Rct for GCE-Ph-S-AuNPs-50 scans in comparison to the rest of the electrodes. Surface modifications with AuNPs increased the conductivity of the electrode by lowering the Rct. The remarkable decrease in the Rct of GCE-Ph-S-AuNPs-50 scans was attributed to the presence of AuNPs with good electrical conductivity at the electrode interface.
A scan rate study was performed on both the GCE-Ph-S-AuNPs as well as a bare GCE to assess the electroactive surface area of both electrodes. This was conducted by performing successive CVs in a solution of 1.0 mM K3[Fe(CN)6] with 0.1 M KCl as the supporting electrolyte while varying the scan rates from 5 mV/s to 500 mV/s. Figure S3 shows an overlay of the cyclic voltammograms with the varying scan rates for bare GCE (Figure S3A) and GCE-Ph-S-AuNPs (Figure S3B), respectively. To calculate the electroactive surface area, the Randles-Sevcik Equation (1) [48] was used as follows:
i p = 2.69 × 10 5   n 3 2 A   C 0   D 1 2   v 1 2
where ip is the anodic peak current, n is the number of electrons (n = 1) transferred, A is the electroactive surface area. C0 and D are the concentration and diffusion coefficient of K3Fe(CN)6, respectively and v is the scan rate. The D of K3Fe(CN)6 is 7.6 × 10⁻⁶ cm2∙s−1 [48,49]. The electroactive surface area calculated for the bare GCE and the GCE-Ph-S-AuNPs were 0.0494 cm2 and 0.1170 cm2, respectively. This indicated that the GCE-Ph-S-AuNPs had an electroactive surface area 2.37 times larger compared to the bare GCE which facilitated an improved electrocatalytic performance due to the presence of AuNPs.

3.7. Chronoamperometry

The diffusion coefficient (D) is governed by the movement and reaction of analytes at the electrode surface. If the diffusion rate is too slow, the reaction may result in poor electrochemical performance. Controlling the diffusion rate and improving the electrochemical performance can be achieved by adjusting various experimental factors such as the electrode design and solution conditions. To calculate the D for 8-OH-G and G, chronoamperometry was performed using GCE-Ph-S-AuNPs. Figures S4A and S5A show the chronoamperograms for 8-OH-G and G, respectively. The Cottrell plots were drawn using the current values obtained from the chronoamperograms with respect to the inverse square root of time (Figures S4B and S5B). Lastly, the slopes extrapolated from the Cottrell plot were plotted with respect to the concentration of 8-OH-G and G (Figures S4C and S5C). Using these plots, the D values of 8-OH-G and G were determined using the Cottrell Equation (2) as shown below:
i = n F A C D ( π t )
where i is the current in Amperes, n is the number of electrons involved in the redox process, F is the Faraday constant, A is the electroactive surface area as determined by the Randles–Sevcik equation in the previous section, C is the concentration of the analyte, D is the diffusion coefficient, and t is the time in seconds. Using the Cottrell equation, the D for 8-OH-G and G were determined to be 1.47 × 10⁻⁴ and 4.64 × 10⁻⁵ cm2∙s−1, respectively.

3.8. Real Sample Study

To evaluate the performance of GCE-Ph-S-AuNPs in practical settings, the sensor was subjected to the simultaneous detection measurements of 8-OH-G and G in two challenging matrices, spiked FS-DNA and artificial cerebral spinal fluid (ACSF). The real samples were diluted in 0.2 M PBS (pH 7.4) and the background DPV signals were measured. Randomized concentrations of 8-OH-G and G were then added to the diluted samples using the standard addition method. The recovery signals were recorded in triplicates (n = 3) and displayed in Table 2. ‘Detected’ corresponds to any previous present analytes found in the diluted solutions prior to spiking, ‘Spiked’ refers to the analytes added via the standard addition method, and ‘Detected’ represents the concentration of analyte detected (n = 3) after spiking. The recovery percentage was within an acceptable range, and thus demonstrated that GCE-Ph-S-AuNPs provided a promising platform for real sample analyses in future diagnostic studies. The recovery values were between 96.0 and 106.7%, which were in the acceptable range reported in similar standard addition studies with biological samples.

4. Conclusions

A novel electrochemical sensor was developed with the electrodeposition of 4-thiophenol via diazonium chemistry for the immobilization of AuNPs using thiol-gold covalent bonding. This nanostructured surface of GCE-Ph-S-AuNPs was applied for the simultaneous detection of 8-OH-G and G. The optimal pH under which the sensor performed was pH 7.4, which was ideal for biological samples. The GCE-Ph-S-AuNPs showed a wide linear range of detection for both 8-OH-G and G using DPV. The sensor was also tested in a spiked DNA samples and the results showed a recovery between 98.5–103.3%. The GCE-Ph-S-AuNPs can potentially be a promising platform for the simultaneous detection of 8-OH-G and G for investigations of the oxidative stress-induced DNA damage in cancers.

Supplementary Materials

The following supporting information can be downloaded at: https://www.mdpi.com/article/10.3390/chemosensors11060326/s1, Table S1. The relative atomic percentages of Au 4f, S 2p, and C 1s, for the GCE-Ph-S-AuNPs after the immobilization of AuNPs and GCE-Ph-SH before the immobilization of AuNPs; Figure S1. (A) Differential pulse voltammograms of 8-OH-G (150.0 µM) and G (40.0 µM) using the GCE-Ph-S-AuNPs for ten consecutive measurements (n = 10) in 0.2 M PBS (pH 7.4), (Inset; the plot for the anodic peak currents of 8-OH-G and G detected for ten consecutive measurements. (B) The stability study of the GCE-Ph-S-AuNPs for the simultaneous determination of 8-OH-G (150.0 µM) and G (40.0 µM) performed on day-1 (blue) and after storage in 0.2 M PBS (pH 7.4) for 5 months (orange); Figure S2. Nyquist plots were obtained with the bare GCE (yellow) and the GCE-Ph-S-AuNPs surfaces that were prepared after 2 scans (grey), 10 scans (orange), 50 scans (blue) of diazonium electrodeposition in 5 mM K3Fe(CN)6 and 5 mM K4Fe(CN)6 with 100 mM KCl with the frequency ranging from 0.1 Hz to 100 kHz. Inset represents the modified Randles equivalent circuit model for fitted impedance data, in which Rs is the solution resistance; Rct is the charge-transfer resistance; Cdl is the double-layer capacitance; ZW is the Warburg element; Figure S3. Cyclic voltammograms of (A) GCE and (B) GCE-Ph-S-AuNPs (prepared with 50 scans of diazonium electrodeposition) in 1.0 mM K3[Fe(CN)6] with 0.1 M KCl as the supporting electrolyte at a scan rate ranging from 5 mV/s to 500 mV/s. (C) The plot of anodic peak current vs. the square root of scan rate; Figure S4. (A) Chronoamperograms obtained using the GCE-Ph-S-AuNPs (prepared with 50 scans of diazonium electrodeposition) for varying concentrations of 8-OH-G (6.7, 13.3, 20.0, and 26.7 μM). (B) The plot of I vs. t−1/2 generated using chronoamperograms. (C) The linear relationship of the slope obtained from the Cottrell plot vs. the concentration of 8-OH-G. All measurements were performed in 0.2 M PBS at pH 7.4.; Figure S5. (A) Chronoamperograms obtained using the GCE-Ph-S-AuNPs (prepared with 50 scans of diazonium electrodeposition) for varying concentrations of G (6.7, 13.3, 20.0, and 40.0 μM). (B) The plot of I vs. t−1/2 generated using chronoamperograms. (C) The linear relationship of the slope obtained from the Cottrell plot vs. the concentration of G. All measurements were performed in 0.2 M PBS at pH 7.4.

Author Contributions

N.S.: Conceptualization, Methodology, Validation, Writing—review and editing. Q.H.: Conceptualization, Investigation, Methodology, Validation, Writing—original draft, Writing—review and editing. M.N.: Conceptualization, Investigation, Methodology, Validation, Writing—original draft, Writing—review and editing. K.K.: Conceptualization, Funding acquisition, Project administration, Supervision, Writing—review and editing. All authors have read and agreed to the published version of the manuscript.

Funding

This work was supported by the Canada Research Chair Tier-2 award to K. Kerman for “Bioelectrochemistry of Proteins” (project no. 950-231116), the Ontario Ministry of Research and Innovation (Project no. 35272), Discovery Grant (project no. RGPIN-2020–07164) from the Natural Sciences and Engineering Research Council of Canada (NSERC), and the Canada Foundation for Innovation (project no. 35272).

Institutional Review Board Statement

Not applicable.

Informed Consent Statement

Not applicable.

Data Availability Statement

The data presented in this study are available on request from the corresponding author.

Acknowledgments

We thank Ilya Gourevich from the Centre for Nanostructure Imaging (Department of Chemistry) at the University of Toronto for his support on XPS analyses. We would also like to thank Durga Acharya at the Centre for the Neurobiology of Stress (CNS) for her support with the TEM analysis.

Conflicts of Interest

The authors declare no conflict of interest.

References

  1. Crick, F. Central Dogma of Molecular Biology. Nature 1970, 227, 561–562. [Google Scholar] [CrossRef]
  2. Cobb, M. 60 Years Ago, Francis Crick Changed the Logic of Biology. PLoS Biol. 2017, 15, e2003243. [Google Scholar] [CrossRef] [PubMed] [Green Version]
  3. Crick, F.; Watson, J. Molecular Structure of Nucleic Acids. Nature 1953, 171, 737–738. [Google Scholar]
  4. Idzko, M.; Ferrari, D.; Riegel, A.K.; Eltzschig, H.K. Extracellular Nucleobase and Nucleoside Signaling in Vascular and Blood Disease. Blood 2014, 124, 1029–1037. [Google Scholar] [CrossRef] [PubMed] [Green Version]
  5. Peplinska-Miaskowska, J.; Wichowicz, H.; Smolenski, R.T.; Jablonska, P.; Kaska, L. Comparison of Plasma Nucleobase Metabolites and Amino Acids Pattern in Patients with Binge Eating Disorder and Obesity. Nucleos. Nucleot. Nucl. 2020, 40, 32–42. [Google Scholar] [CrossRef] [PubMed]
  6. Suzuki, T.; Kamiya, H. Mutations Induced by 8-Hydroxyguanine (8-Oxo-7,8-Dihydroguanine), a Representative Oxidized Base, in Mammalian Cells. Genes Environ. 2017, 39, 4–9. [Google Scholar] [CrossRef] [PubMed] [Green Version]
  7. Cheng, K.C.; Cahill, D.S.; Kasai, H.; Nishimura, S.; Loeb, L.A. 8-Hydroxyguanine, an Abundant Form of Oxidative DNA Damage, Causes G → T and A → C Substitutions. J. Biol. Chem. 1992, 267, 166–172. [Google Scholar] [CrossRef]
  8. Lovell, M.A.; Markesbery, W.R. Ratio of 8-Hydroxyguanine in Intact DNA to Free 8-Hydroxyguanine Is Increased in Alzheimer Disease Ventricular Cerebrospinal Fluid. Arch. Neurol. 2001, 58, 392–396. [Google Scholar] [CrossRef] [Green Version]
  9. Lovell, M.A.; Markesbery, W.R. Oxidative DNA Damage in Mild Cognitive Impairment and Late-Stage Alzheimer’s Disease. Nucleic Acids Res. 2007, 35, 7497–7504. [Google Scholar] [CrossRef] [Green Version]
  10. Alam, Z.I.; Jenner, A.; Daniel, S.E.; Lees, A.J.; Cairns, N.; Marsden, C.D.; Jenner, P.; Halliwell, B. Oxidative DNA Damage in the Parkinsonian Brain: An Apparent Selective Increase in 8-Hydroxyguanine Levels in Substantia Nigra. J. Neurochem. 1997, 69, 1196–1203. [Google Scholar] [CrossRef] [PubMed]
  11. Wei, Z.; Li, X.; Li, X.; Liu, Q.; Cheng, Y. Oxidative Stress in Parkinson’s Disease: A Systematic Review and Meta-Analysis. Front. Mol. Neurosci. 2018, 11, 236. [Google Scholar] [CrossRef] [PubMed]
  12. Shinmura, K.; Kohno, T.; Kasai, H.; Koda, K.; Sugimura, H.; Yokota, J. Infrequent Mutations of the HOGG1 Gene, That Is Involved in the Excision of 8-Hydroxyguanine in Damaged DNA, in Human Gastric Cancer. Jpn. J. Cancer Res. 1998, 89, 825–828. [Google Scholar] [CrossRef] [PubMed]
  13. Rozalski, R.; Gackowski, D.; Roszkowski, K.; Foksinski, M.; Olinski, R. The Level of 8-Hydroxyguanine, a Possible Repair Product of Oxidative DNA Damage, Is Higher in Urine of Cancer Patients than in Control Subjects1. Cancer Epidemiol. Biomark. Prev. 2002, 11, 1072–1075. [Google Scholar]
  14. Arai, T.; Kelly, V.P.; Minowa, O.; Noda, T.; Nishimura, S. High Accumulation of Oxidative DNA Damage, 8-Hydroxyguanine, in Mmh/Ogg1 Deficient Mice by Chronic Oxidative Stress. Carcinogenesis 2002, 23, 2005–2010. [Google Scholar] [CrossRef] [PubMed] [Green Version]
  15. Watanabe, S.; Kawasaki, Y.; Kawai, K. Salivary 8-Hydroxyguanine as a Lifestyle-Related Oxidative Stress Biomarker in Workers. J. Clin. Biochem. Nutr. 2020, 66, 57–61. [Google Scholar] [CrossRef] [Green Version]
  16. Rodriguez, H.; Jurado, J.; Laval, J.; Dizdaroglu, M. Comparison of the Levels of 8-Hydroxyguanine in DNA as Measured by Gas Chromatography Mass Spectrometry Following Hydrolysis of DNA by Escherichia Coli Fpg Protein or Formic Acid. Nucleic Acids Res. 2000, 28, 75. [Google Scholar] [CrossRef] [Green Version]
  17. England, T.G.; Jenner, A.; Aruoma, O.I.; Halliwell, B. Determination of Oxidative DNA Base Damage by Gas Chromatography-Mass Spectrometry. Effect of Derivatization Conditions on Artifactual Formation of Certain Base Oxidation Products. Free Radic. Res. 1998, 29, 321–330. [Google Scholar] [CrossRef]
  18. Herbert, K.E.; Evans, M.D.; Finnegan, M.T.V.; Farooq, S.; Mistry, N.; Podmore, I.D.; Farmer, P.; Lunec, J. A Novel HPLC Procedure for the Analysis of 8-Oxoguanine in DNA. Free Radic. Biol. Med. 1996, 20, 467–473. [Google Scholar] [CrossRef]
  19. Kawai, K.; Kasai, H.; Li, Y.S.; Kawasaki, Y.; Watanabe, S.; Ohta, M.; Honda, T.; Yamato, H. Measurement of 8-Hydroxyguanine as an Oxidative Stress Biomarker in Saliva by HPLC-ECD. Genes Environ. 2018, 40, 2–5. [Google Scholar] [CrossRef]
  20. Helbock, H.J.; Beckman, K.B.; Ames, B.N. 8-Hydroxydeoxyguanosine and 8-Hydroxyguanine as Biomarkers of Oxidative DNA Damage. Methods Enzym. 1999, 300, 156–166. [Google Scholar] [CrossRef]
  21. Ripanti, F.; Fasolato, C.; Mazzarda, F.; Palleschi, S.; Ceccarini, M.; Li, C.; Bignami, M.; Bodo, E.; Bell, S.E.J.; Mazzei, F.; et al. Advanced Raman Spectroscopy Detection of Oxidative Damage in Nucleic Acid Bases: Probing Chemical Changes and Intermolecular Interactions in Guanosine at Ultralow Concentration. Anal. Chem. 2021, 93, 10825–10833. [Google Scholar] [CrossRef] [PubMed]
  22. D’Amico, F.; Cammisuli, F.; Addobbati, R.; Rizzardi, C.; Gessini, A.; Masciovecchio, C.; Rossi, B.; Pascolo, L. Oxidative Damage in DNA Bases Revealed by UV Resonant Raman Spectroscopy. Analyst 2015, 140, 1477–1485. [Google Scholar] [CrossRef] [PubMed]
  23. Beaver, K.; Dantanarayana, A.; Minteer, S.D. Materials Approaches for Improving Electrochemical Sensor Performance. J. Phys. Chem. B 2021, 125, 11820–11834. [Google Scholar] [CrossRef] [PubMed]
  24. Momenbeitollahi, N.; van der Zalm, J.; Chen, A.; Li, H. Entrapping Gold Nanoparticles in Membranes for Simple-to-Use Enhanced Fluorescence Detection of Proteins. Anal. Chim. Acta 2022, 1195, 339443. [Google Scholar] [CrossRef]
  25. Oliveira-Brett, A.M.O.; Piedade, J.A.P.; Serrano, S.H.P. Electrochemical Oxidation of 8-Oxoguanine. Electroanalysis 2000, 12, 969–973. [Google Scholar] [CrossRef]
  26. Jeličová, M.; Metelka, R.; Pejchal, J.; Lierová, A.; Šinkorová, Z. Electrochemical Detection of 8-Hydroxyguanine Using Screen-Printed Carbon Electrodes Modified with Carboxy-Functionalized Multi-Walled Carbon Nanotubes. Mon. Chem. 2019, 150, 1187–1193. [Google Scholar] [CrossRef]
  27. Lu, N.; Liu, H.; Huang, R.; Gu, Y.; Yan, X.; Zhang, T.; Xu, Z.; Xu, H.; Xing, Y.; Song, Y.; et al. Charge Transfer Platform and Catalytic Amplification of Phenanthroimidazole Derivative: A New Strategy for DNA Bases Recognition. Anal. Chem. 2019, 91, 11938–11945. [Google Scholar] [CrossRef] [PubMed]
  28. Emran, M.Y.; El-Safty, S.A.; Selim, M.M.; Shenashen, M.A. Selective Monitoring of Ultra-Trace Guanine and Adenine from Hydrolyzed DNA Using Boron-Doped Carbon Electrode Surfaces. Sens. Actuators B Chem. 2021, 329, 129192. [Google Scholar] [CrossRef]
  29. Wang, X.; Zhang, J.; Wei, Y.; Xing, T.; Cao, T.; Wu, S.; Zhu, F. A Copper-Based Metal-Organic Framework/Graphene Nanocomposite for the Sensitive and Stable Electrochemical Detection of DNA Bases. Analyst 2020, 145, 1933–1942. [Google Scholar] [CrossRef]
  30. Wang, M.; Guo, H.; Xue, R.; Guan, Q.; Zhang, J.; Zhang, T.; Sun, L.; Yang, F.; Yang, W. A Novel Electrochemical Sensor Based on MWCNTs-COOH/Metal-Covalent Organic Frameworks (MCOFs)/Co NPs for Highly Sensitive Determination of DNA Base. Microchem. J. 2021, 167, 106336. [Google Scholar] [CrossRef]
  31. Goyal, R.N.; Bishnoi, S. Sensitive Voltammetric Sensor for the Determination of Oxidative DNA Damage in Calf Thymus DNA. Biosens. Bioelectron. 2010, 26, 463–469. [Google Scholar] [CrossRef] [PubMed]
  32. Liu, G.; Luais, E.; Gooding, J.J. The Fabrication of Stable Gold Nanoparticle-Modified Interfaces for Electrochemistry. Langmuir 2011, 27, 4176–4183. [Google Scholar] [CrossRef] [PubMed]
  33. Liu, J.; Lu, Y. Preparation of Aptamer-Linked Gold Nanoparticle Purple Aggregates for Colorimetric Sensing of Analytes. Nat. Protoc. 2006, 1, 246–252. [Google Scholar] [CrossRef]
  34. Tamano, H.; Nishio, R.; Shakushi, Y.; Sasaki, M.; Koike, Y.; Osawa, M.; Takeda, A. In vitro and in vivo physiology of low nanomolar concentrations of Zn2+ in artificial cerebrospinal fluid. Sci. Rep. 2017, 7, 42897. [Google Scholar] [CrossRef] [PubMed] [Green Version]
  35. Dekanski, A.; Stevanović, J.; Stevanović, R.; Nikolić, B.Ž.; Jovanović, V.M. Glassy Carbon Electrodes I. Characterization and Electrochemical Activation. Carbon 2001, 39, 1195–1205. [Google Scholar] [CrossRef]
  36. Kwan, W.S.V.; Atanasoska, L.; Miller, L.L. Oligoimide Monolayers Covalently Attached to Gold. Langmuir 1991, 7, 1419–1425. [Google Scholar] [CrossRef]
  37. Sylvestre, J.P.; Poulin, S.; Kabashin, A.V.; Sacher, E.; Meunier, M.; Luong, J.H.T. Surface Chemistry of Gold Nanoparticles Produced by Laser Ablation in Aqueous Media. J. Phys. Chem. B 2004, 108, 16864–16869. [Google Scholar] [CrossRef]
  38. Li, S.P.; Kerman, K. Electrochemical Detection of Interaction between Copper(II) and Peptides Related to Pathological α-Synuclein Mutants. Anal. Chem. 2019, 91, 3810–3826. [Google Scholar] [CrossRef]
  39. Wang, S.; Ferrag, C.; Noroozifar, M.; Kerman, K. Simultaneous Determination of Four DNA Bases at Graphene Oxide/Multi-Walled Carbon Nanotube Nanocomposite-Modified Electrode. Micromachines 2020, 11, 294. [Google Scholar] [CrossRef] [Green Version]
  40. Bishnoi, S.; Goyal, R.N.; Shim, Y.B. A Novel Nanogold-Single Wall Carbon Nanotube Modified Sensor for the Electrochemical Determination of 8-Hydroxyguanine, a Diabetes Risk Biomarker. Bioelectrochemistry 2014, 99, 24–29. [Google Scholar] [CrossRef]
  41. Goyal, R.N.; Dryhurst, G. Redox Chemistry of Guanine and 8-Oxyguanine and a Comparison of the Peroxidase-Catalyzed and Electrochemical Oxidation of 8-Oxyguanine. J. Electroanal. Chem. 1982, 135, 75–91. [Google Scholar] [CrossRef]
  42. Goyal, R.N.; Puri, B.K.; Jain, N. Electrochemical Oxidation of Guanosine-5′-Monophosphate at the Pyrolytic Graphite Electrode. J. Chem. Soc. Perkin Trans. 2 2001, 5, 832–837. [Google Scholar] [CrossRef]
  43. Patel, B.R.; Imran, S.; Ye, W.; Weng, H.; Noroozifar, M.; Kerman, K. Simultaneous Voltammetric Detection of Six Biomolecules Using a Nanocomposite of Titanium Dioxide Nanorods with Multi-Walled Carbon Nanotubes. Electrochim. Acta 2020, 362, 137094. [Google Scholar] [CrossRef]
  44. Zhou, J.; Li, S.; Noroozifar, M.; Kerman, K. Graphene Oxide Nanoribbons in Chitosan for Simultaneous Electrochemical Detection of Guanine, Adenine, Thymine and Cytosine. Biosensors 2020, 10, 30. [Google Scholar] [CrossRef] [Green Version]
  45. Zhang, S.; Li, B.-Q.; Zheng, J.-B. An Electrochemical Sensor for the Sensitive Determination of Nitrites Based on Pt-PANI-Graphene Nanocomposites. Anal. Methods 2015, 7, 8366–8372. [Google Scholar] [CrossRef]
  46. Oliveira, S.C.B.; Oliveira-Brett, A.M. Boron Doped Diamond Electrode Pre-Treatments Effect on the Electrochemical Oxidation of dsDNA, DNA Bases, Nucleobases, Homopolynucleobases and Biomarker 8-Oxoguanine. J. Electroanal. Chem. 2010, 648, 60–66. [Google Scholar] [CrossRef]
  47. Yin, H.; Zhou, Y.; Ma, Q.; Ai, S.; Ju, P.; Zhu, L.; Lu, L. Electrochemical Oxidation Behavior of Guanine and Adenine on Graphene-Nafion Composite Film Modified Glassy Carbon Electrode and the Simultaneous Determination. Process. Biochem. 2010, 45, 1707–1712. [Google Scholar] [CrossRef]
  48. González-Meza, O.A.; Larios-Durán, E.R.; Gutiérrez-Becerra, A.; Casillas, N.; Escalante, J.I.; Bárcena-Soto, M. Development of a Randles-Ševčík-like Equation to Predict the Peak Current of Cyclic Voltammetry for Solid Metal Hexacyanoferrates. J. Solid State Electrochem. 2019, 23, 3123–3133. [Google Scholar] [CrossRef]
  49. Moldenhauer, J.; Meier, M.; Paul, D.W. Rapid and Direct Determination of Diffusion Coefficients Using Microelectrode Arrays. J. Electrochem. Soc. 2016, 163, H672–H678. [Google Scholar] [CrossRef]
Figure 1. Scheme illustrating the modification of GCEs by electrodepositing the thiophenol diazonium salt on the surface of the GCEs followed by the incubation of the modified GCEs in AuNPs solution, resulting in the formation of the AuNPs-modified surface (GCE-Ph-S-AuNPs).
Chemosensors 11 00326 g001
Figure 2. TEM images of the AuNPs. The images indicated that AuNPs were approximately 10 nm in diameter. The scale bars for (AC), are 1 μm, 500 nm, and 200 nm, respectively.
Chemosensors 11 00326 g002
Figure 3. X-ray photoelectron spectra of (A) C 1s, (B) S 2p, and (C) Au 4f s of the GCP either with surface deposition of (i) the thiophenol shown on the left or (ii) the thiophenol and AuNPs showed on the right.
Chemosensors 11 00326 g003
Figure 4. Comparison study for the simultaneous determination of 4.0 μM 8-OH-G and 2.0 μM G in 0.2 M PBS (pH 7.4) using DPV at bare GCE, bare Au electrode (AuE), and the GCE-Ph-S-AuNPs after 2, 10 and 50 CV scans of diazonium electrodeposition.
Chemosensors 11 00326 g004
Figure 5. (A) Differential pulse voltammograms of GCE-Ph-S-AuNPs showing the effect of pH on the peak separation and peak current for the oxidation of 8-OH-G and G, in 0.2 M PBS with pH values of 4.0, 5.0, 6.0, 7.0, 7.4, and 8.4. (B) Plot of anodic peak current vs. pH for 8-OH-G (green) and G (blue).
Chemosensors 11 00326 g005
Figure 6. The oxidation mechanism of (a) 8-OH-G and (b) G as deduced from the effect of varying the pH with respect to the oxidation potential peaks using DPV.
Chemosensors 11 00326 g006
Figure 7. (A) Differential pulse voltammograms of the GCE-Ph-S-AuNPs in 0.2 M PBS (pH 7.4) for the simultaneous detection of 8-OH-G and G at varying concentrations. (B) The calibration plot for 8-OH-G. (C) The calibration plot for G. Error bars indicate triplicate measurements (n = 3).
Chemosensors 11 00326 g007
Figure 8. (A) Interference study for 8-OH-G while keeping the concentration of G constant. (B) Interference study for G while keeping the concentration of 8-OH-G constant. All the DPV measurements were performed in 0.2 M PBS (pH 7.4).
Chemosensors 11 00326 g008
Table 1. A table showing the different sensors reported for the detection of G and 8-OH-G, outlining the electrochemical method used to detect the nucleobases, the limit of detection, and the linear range of detection.
PlatformMethodNucleobasesLOD (μM)Linear Range (μM)Ref.
Au nanoparticle-SWCNT-modified edge-plane pyrolytic graphite electrodeSWVG0.0050.1–2.0[40]
8-OH-G0.0012.5 × 10−4–6.25 × 10⁻³
Screen-printed carbon electrode modified with MWCNT-COOHDPV8-OH-G0.570.3–12.0[26]
Boron-doped diamond electrodeDPV8-OH-G1.00–11.4[46]
Bare GCEDPV8-OH-G0.86.0–28.0[25]
Graphene-Nafion-modified GCEDPVG0.582–120[47]
GO-MWCNT hybrid with chitosan-modified GCEDPVG0.111.0–78.0[39]
GO nanoribbons in chitosan-modified GCEDPVG0.00180.013–256[44]
Copper metal-organic framework with reduced graphene oxide-modified GCEDPVG0.0120.02–100[29]
MWCNT-COOH with a Cu -porphyrin metal covalent organic framework with Co nanoparticles on GCEDPVG0.00550.04–130[30]
GCE-Ph-S-AuNPsDPV8-OH-G0.0201.3–12.0 & 12.0–125.0This work
G0.0210.3–12.0 & 12.0–60.0
SWCNT = Single-walled carbon nanotube; MWCNT-COOH = Carboxyl-functionalized multi-walled carbon nanotube; GO = Graphene Oxide.
Table 2. Summary of simultaneous detection of 8-OH-G and G in the sample matrices of FS-DNA and ACSF using GCE-Ph-S-AuNPs (n = 3).
MatrixAnalyteDetected (µM)Spiked (µM)Found (µM) ± SDRelative Recovery (%) ± SD
FS-DNA8-OH-G-2.01.97 ± 0.0898.5 ± 0.08
G-2.02.04 ± 0.06102.0 ± 0.06
8-OH-G-15.015.5 ± 0.10103.3 ± 0.10
G-15.014.8 ± 0.1298.7 ± 0.12
ACSF8-OH-G-6.06.2 ± 0.18103.3 ± 0.18
G-10.09.6 ± 0.0796.0 ± 0.07
8-OH-G-40.042.7 ± 0.21106.7 ± 0.21
G-45.046.3 ± 0.16102.8 ± 0.16
Disclaimer/Publisher’s Note: The statements, opinions and data contained in all publications are solely those of the individual author(s) and contributor(s) and not of MDPI and/or the editor(s). MDPI and/or the editor(s) disclaim responsibility for any injury to people or property resulting from any ideas, methods, instructions or products referred to in the content.

