
Tunable Nanoplasmonic Transducers: Performance Analysis and Potential Application


CNR-IMM, Institute for Microelectronic and Microsystems, Campus Ecotekne, Via per Monteroni, 73100 Lecce, Italy
*
Author to whom correspondence should be addressed.
Chemosensors 2023, 11(2), 109; https://doi.org/10.3390/chemosensors11020109
Submission received: 26 December 2022
/
Revised: 30 January 2023
/
Accepted: 31 January 2023
/
Published: 3 February 2023
(This article belongs to the Special Issue Photonics and Plasmonics: New Challenges for Optical Nanostructured Materials in Sensing)
Abstract
:Plasmonic nanostructures with tunable optical properties can have many different applications, including high-sensitivity optical sensing for biological and chemical analyses in different field such as medical, environmental and food safety. The realization of an optimized sensing platform is closely related to the ability to finely control optical properties of nanostructures, which are, in turn, intimately linked to their geometrical and compositional characteristics. In this paper, an efficient and reproducible fabrication protocol, based on nanosphere lithography, for the realization of metal nanostructures with tunable plasmonic features is presented. In particular, the relationships between the geometric characteristics of different types of nanostructures with related optical phenomena such as enhanced absorption or extraordinary transmission are investigated in detail. These properties, together with electric field enhancement and confinement, are characterized and optimized in view of the employment of the fabricated nanostructures as optical transducers in nanoplasmonic chemosensor platforms working in the UV-VIS spectral range.
1. Introduction
Noble metal nanostructures, due to their unique optical properties arising from their interactions with incident light, are an exciting platform for a variety of fundamental studies and technological applications ranging from biomedical, to energy, and information technology. This fascinating field, known as nanoplasmonics, exploits the collective motion of conduction electrons in metals (plasmons), making possible the coupling of light with nano-objects and the generation of a range of new optical effects at the nanoscale [1]. The excitation of plasmons is accompanied by a dramatic localization and enhancement of the electric field associated with light at optical frequencies. Contemporary advances in the field of nanoplasmonics are closely linked with the evolution and developments in rational design and fabrication of plasmonic nanostructures to control and tailor optical properties including extraordinary absorption or transmission, and electromagnetic field enhancement. Although plasmonic nanostructures with tunable optical properties have been rapidly developed, their wide utilization is still limited mainly due to the need for a precise, fast, reproducible, large-scale and cost-effective fabrication [2]. In fact, plasmonic nanostructure fabrication must be well-controlled because of the strong dependency of their optical properties on their composition, size, and morphology. Many nanostructure fabrication techniques have recently been proposed to improve the performance and reproducibility of plasmonic transducers. So-called “top down” techniques, including advanced lithographic techniques such as electron beam lithography (EBL) [3,4] or focused ion beam (FIB) [5], permit us to obtain metal nanostructures on solid supports with accurate control of size, shape, and spatial distribution. However, these techniques are less attractive for scientists and industrial applications because they are expensive and time-consuming, which limits their application in commercial sensing devices. Alternatively, unconventional lithographic techniques, including nanoimprinting [6,7,8] soft-lithography [9,10,11], near-field optical lithography [12], proximity probe techniques [13] and template-assisted lithography [14,15] can be used as they are less expensive and large-scale fabrication methods. Among these, nanosphere lithography (NSL) [16] has aroused particular interest owing to its ability to obtain a variety of large-scale ordered nanostructures (>cm2) [17,18,19]. This method allows the fabrication of nanostructured materials on a variety of substrates evaporating a metal through the small apertures of a self-assembled, close-packed array (CPA) of monodisperse polystyrene spheres (PS), which acts as a sacrificial mask. After the removal of the nanoparticles, a hexagonal symmetrical array of nanoprisms remains on the substrate. The formation of the CPA, characterized by a two-dimensional crystal-like structure, depends on precise and appropriate conditions balancing different physical forces and the convective motion of solvents in which the nanospheres disperse. Many works in recent years have involved self-assembly methods allowing the realization of a low-defect CPA over a large area, including capillary deposition [20], spin-coating [21,22], electrostatic adsorption [23], convective assembly [24], vertical deposition [25] or self-assembly at the air–water interface [26,27,28,29]. The self-assembly of colloidal particles at the air–water interface is a technique based on a process analogous to the Langmuir–Blodgett deposition [30], which allows the formation of a close-packed monolayer at the liquid–air interface [31]. It is based on the electrostatic interaction between particles and solvent [32,33,34,35]. We used a method consisting of the self-assembly of ordered colloidal crystals at the air–water interface over an area up to several centimeters square [36]. After its formation, the CPA can be transferred onto any kind of planar surface and can be used as a mask for the subsequent realization, at first, of a highly ordered array of metal (e.g., gold) nanoprisms with particular optical properties [37,38,39,40] distributed in a hexagonal array on different kinds of substrates. Metal nano-prism arrays have been appreciated for many applications such as the realization of new transducers for sensing platforms [41,42], substrates for surface enhanced Raman spectroscopies (SERS) [43,44] or surface-enhanced fluorescence [45], or the generation of a new plasmonic solar cells [46], exploiting their electromagnetic field enhancement at their sharp tips upon excitation by a light beam. Furthermore, they demonstrate high performance as biosensing platforms due to their large “detection volume”, i.e., the penetration depth within which to detect refractive index variation [47,48].
Moreover, the ability to precisely modulate the spectral width and position on the VIS-IR range of the optical response brings several advantages that can be exploited in different fields of application such as SERS, in which it has been shown that the greatest amplification of the Raman signal is obtained when the plasmonic nanostructure is able to interact simultaneously with both incident and scattered light [49], or metal-enhanced fluorescence (MEF), where the fluorophore’s absorption and emission range with plasmon energy must be in resonance [50]. The proper control of the composition, morphology, and distribution of metal nanoparticle arrays allows the suitable coupling of their plasmonic and magneto-optical properties [51] and allows different optical resonance mode coupling. Another approach to obtain variations of the shape of the basic metal nanostructure consists of modifying the CPA of polystyrene (PS) particles deposited onto solid substrates by means of a post-treatment etching process, in which the diameter of the spheres can be reduced in a controllable way to a desired size. This process induces the formation of non-close-packed arrays of nano-spheres [33], which can be used as a mask for the fabrication of long-range ordered nanohole arrays (NHA) into thin metal films [52,53]. Since Ebbesen and co-workers discovered extraordinary optical transmission (EOT) through subwavelength noble metal nanohole arrays [54,55], there has been significant effort to fabricate nanohole arrays with well-controlled electromagnetic properties. For the most part, nanohole arrays have been fabricated using expensive and time-consuming techniques such as EBL and FIB [56]. Recently, a protocol to obtain masks and therefore arrays of metal nanoholes with a precise control of the diameter while keeping intact the periodicity and the high order of the original hexagonal lattice array has been optimized. The realized metal nanostructures can support both localized and propagating surface plasmon resonance, combining the advantages of high electric field enhancement generated by the first and the large decay length characterizing the second. These features make them very attractive for several applications such as SERS [57,58], MEF [59,60] and SPR-based chemical sensors and biosensors.
Within this context, we focused on low-cost template-mediated fabrication protocol for the realization of metal nanostructures arrays, which, starting from a nanosphere lithography technique, allow us to obtain highly ordered plasmonic metal nanostructures with finely modulated optical properties. By means of morphological and optical characterization, with the support of numerical simulation, we want to obtain in-depth insight into the relationship between optical response and morphological modulation. Furthermore, once the gold nanostructure was complete, we then subjected the obtained basic structure to a thermal treatment aimed at modifying the size and morphology with the purpose of having a controlled modulation of its optical properties. This approach offers the ability to modify nanostructure shape ranging from three- to almost zero-dimensional nanostructure profiles, while preserving the order of the array. In addition, it allows manufacturing plasmonic nanostructures that return the highest amplification and confinement of the electric field when interacting with light at a suitable frequency.
In this paper, the realization of nano-structured plasmonic transducers in the form of gold nanoprisms, nanodomes, and nanoholes is reported together with morphological and optical characterization. An interesting application in the agrifood sector is demonstrated as a proof of concept. In particular, the evaluation of the quality of olive oil in terms of dynamic oxidation state is established by monitoring red shifts of the plasmonic absorption peaks.
2. Materials and Methods
2.1. Preparation of the Colloidal Mask
The first step for highly ordered metal nanostructure array fabrication by NSL is represented by the realization of a CPA of PS nanospheres. The process begins with the self-assembly of colloids at the air–water interface using the home-made deposition setup shown in Figure 1. The self-assembly colloidal mask was carried out in standard glass Petri dishes with diameters ranging between 5 and 10 cm, filled with deionized water. A floating rubber ring was placed on the surface of the water to confine the area where self-assembly occurred. The colloidal solution was slid over the surface of the water by means of a tilted glass slide partially immersed in it. A mechanically driven roto-translation system allowed the fine control of the slide elevation and slope since these are crucial parameters for the formation and the crystal quality of the monolayer: we chose tilt angle values between 35° and 40° from the water surface. Polystyrene particles of 500 nm diameter were used in the experiments (Sigma-Aldrich) with a concentration of 10 wt% in water; the coefficient of variation (CV) and the density of the PS particles were specified from the manufacturer to be 2.4% and 1.05 g∙cm−3, respectively.
The glass substrate surface was made hydrophilic by a process based on oxygen plasma treatment. After the CPA formation at the air/water interface, the monolayer was transferred onto a solid support by two-step water removal to avoid monolayer damage—the first using a peristaltic pump, and the second consisting of self-vaporization at room temperature.
2.2. Nanoprisms Array Fabrication
The nanostructured arrays of metal nanoprisms were realized by depositing a layer of gold with a thickness of 40 nm by electron beam evaporation (EBE) through the apertures of the PS particles mask. A deposition angle of 0° between the direction of the metal flux deposition and the normal to the glass substrate was guaranteed. We obtained a final nanostructure with an almost constant size, thanks to the small polydispersity of the nanospheres and to their very regular CPA. To ensure a better adhesion of the gold structures on the substrate, a 2 nm thick titanium layer was first deposited. After the metal deposition, the colloidal mask was finally removed with a lift-off process: it consists of a mechanical stripping of the PS nano-spheres using a suitable adhesive tape. The obtained samples were rinsed with ethanol and Milli-Q water and dried in a nitrogen flow.
2.3. Morphology Modification Induced by Thermal Annealing
UV-VIS optical properties of the as-deposited nanostructured transducers were modified (blue-shift) by a suitably controlled thermal annealing ranging between 200 and 500 °C [36]. To this purpose, an annealing cycle of 1 h at a prefixed temperature in a tube furnace was performed, resulting in a systematic reproducible morphology modification of the nanostructures.
2.4. Metal Nanoholes Arrays Fabrication
For the realization of the nanohole arrays on glass substrates, a preliminary post-treatment process of the PS particle mask after its deposition on the substrate was required. To this purpose, a specific protocol of oxygen plasma etching was necessary. This treatment induces a reduction in PS particle size, maintaining the periodicity of the array and returning a non-close-packed array (NCPA) of nanospheres. To perform the treatment, a commercially available plasma-cleaning setup (Diener ATTO, Diener electronics) was used. Polystyrene spheres organized onto glass substrates were etched following a specific protocol: with 30 W power oxygen plasma at a pressure of 0.25 mbar., successive steps with exposure times of 120 s each were repeated until the desired size was reached. The obtained NCPAs of nano-spheres were used as lithographic masks to fabricate a planar distribution of highly ordered gold nano-holes. Long-range ordered (LRO) NHs in thin metal film were obtained by adopting a two-step metal evaporation process (EBE): 2 nm of Ti, followed by a 30 nm Au layer. After the metal deposition, the colloidal mask was mechanically removed (lift-off) by a suitable adhesive tape, and the samples were then rinsed several times with ethanol and Milli-Q water and dried under a nitrogen stream.
2.5. Optical and Morphological Characterization of the Masks and the Nanostructures
The CPA and NCPA of PS nano-sphere morphology deposited on glass were investigated by atomic force microscopy (AFM NT-MDT Spectralight, Moscow, Russia) to confirm the hexagonal geometry generated onto the substrate. Moreover, we also monitored the dynamic size variation induced by plasma etching. Morphological and optical characterizations were carried out on the Au nanoprisms. Similar measurements on LRO NHs to correlate sphere etching times with hole dimensions and consequent optical features were also taken. The optical absorption and transmission of all samples were measured in air at normal incidence by a Cary 500 UV-VIS-NIR Spectrometer (Varian, Palo Alto, CA, USA), in the 400–1000 nm spectral range spectral. Further details can be found in Colombelli et al., 2019 [36].
3. Results and Discussion
3.1. Colloidal Mask Characterization
At the base of the self-assembly colloidal particle formation process at the air/water interface, a fine balance between different forces, including inter-particle electrostatic forces and capillary flotation forces, takes place. The variation in the adjacent fluid dielectric constant gives rise to an asymmetry of the charge distribution, and then an electrostatic repulsion between adjacent PS particles. On the contrary, the dipolar electric field causes an air/liquid interface modulation with a consequent capillary attraction between spheres. (Figure 1a).
The formation of long-range ordered CPA of particles at the air/water interface depends on the equilibrium between these repulsive and attractive forces. In Figure 1b, a typical example of colloidal mask realized with 500 nm diameter particles on the surface of the water confined by a rubber ring with a diameter of 5 cm is reported. Typical iridescent colors are revealed illuminating the colloidal crystal with white light. In Figure 1c,d, images of examples of CP monolayers on glass and silicon, respectively, are reported.
As can be noticed in Figure 2a, the presence of crystal domains with hexagonal geometry (Figure 2b) characterized by different spatial orientation generates distinguishable color areas. As schematically reported in Figure 2c, when illuminated by a visible laser beam irradiating perpendicularly, the colloidal crystal generates bright light spots characterized by a hexagonal geometry (Figure 2d). The crystal quality and the lattice orientation can be easily and quickly determined from these diffraction patterns.
In Figure 3, typical AFM semi-contact-mode images (height signal) at three different magnifications of the realized colloidal masks consisting of PS particles with diameters of 500 nm deposited on glass are reported. As can be clearly seen, the developed deposition technique makes it possible to obtain uniform monolayers of close-packed PS nano-spheres, with long-range orders and few lattice defects.
3.2. Nano-Prism Fabrication and Characterization
After the metal deposition process described in Section 2.2, the PS colloidal mask was removed with a lift-off process: it consists of a mechanical stripping of the PS nano-spheres by using a suitable adhesive tape. Finally, the samples were rinsed several times with ethanol and Milli-Q water and dried under a nitrogen stream
A typical low-magnification SEM image of the realized nanostructures is reported in Figure 4. A single-domain highly periodic distribution of a typical metal nanoprism array is shown. The few existing defects represented by differences in size or separation between neighboring nanoprisms were quantified by the estimation of the average width (w) and the separation (s), obtaining: w = (319 ± 9) nm and s = (118 ± 29) nm.
The average size, regarded as the height of the base triangle of the prism, was estimated to be equal to (127 ± 11) nm. The high-resolution SEM image in Figure 4 shows the convexity of the structures derived from the shadow effects of the colloidal mask.
The absorbance spectra of a typical sample deposited on a glass substrate registered in the 400–1000 nm spectral range are shown in Figure 5e. Owing to the excitation of the localized SPR (LSPR), the absorbance signal of the realized nanostructures exhibits a pronounced peak in the near IR spectral range, around λ = 860 nm.
3.3. Morphology Modification Induced by Thermal Annealing on Colloidal Masks
As already described, to modify nanoprisms size and morphology and consequently tune its optical properties in the UV-VIS spectral range, a suitable thermal treatment was performed.
As can be seen in Figure 5b, gold nanostructures underwent a very small preliminary rounding of the nanotriangle tips. Further increases in temperature gave rise to a more rounded shape (Figure 5c) and finally, at higher temperatures, a hemispherical geometry was obtained (Figure 5d). Further thermal treatment at higher temperatures did not give rise to apparent changes in the optical transducer morphology. Nanostructure shape modulation is due to the well-known dewetting process of gold nanostructures with a consequent formation of a large-area ordered array of gold nanodots in a hexagonal periodic lattice. The annealing time chosen was long enough to ensure a good thermal stability and reproducibility of the gold nanostructures thus obtained.
In AFM morphology measurements, reported in Figure 5a–d, as the thermal treatment proceed, an increase from 35 to 63 nm of the nanostructures averages maximum height can be measured by a line section profile. These variations in the nanostructure’s morphology have a significant impact on their optical features, as can be easily detected by monitoring the color changes of the sample even just by naked eye. Monitoring the optical absorption spectra of the nanostructures subjected to subsequent thermal annealing treatments (Figure 5e), an evident blue-shift in the spectrum together with pronounced narrowing of the band is evidenced. As can be observed in Figure 5f, a close relationship between morphology and optical properties, with a blue shift in the position of the wavelength maximum absorption LSPR peak, is demonstrated.
3.4. Morphological and Optical Characterization of Nanoholes Arrays
The lift-off procedure finally uncovers the fabricated NHA reported in the AFM images of Figure 6d. As can be noticed in the picture of Figure 6e, a very large and homogeneous sample can be realized by exploiting this fabrication technique.
Gold NHA support both localized and propagating surface plasmon resonances (SPP and LSP modes). Both optical modes can be tuned across the VIS to near-IR spectral range by modify the periodicity, diameter of the hole, composition, or thickness of the selected metal layer.
For all the fabricated NHA, absorbance spectra, recorded in dry air, exhibit interesting optical features in the VIS-NIR spectral range.
In Figure 7, the zero-order absorbance spectra in the 400–1200 nm spectral range of long-range ordered distributions of NHA realized in a 30 nm thick Au layer are reported. Each spectrum has been marked with the final hole diameter achieved to easily associate it with the respective absorption curve.
The minimum at around 500 nm, which is present in all the spectra, albeit with different intensities, comes from the direct transmission of light through the gold film as expected from the free-electron (Drude) theory, due to intra-band transitions, and hence is not related to array properties. The subsequent increase is due instead to the onset of the interband transitions. As the PS spheres are etched, the metal is deposited more and more between the spheres, first increasing the size of the nanoprisms and then connecting the nanoprisms into nanoholes.
3.5. LSPR Absorption Peak as a Potential Application in Agri-Foods Quality
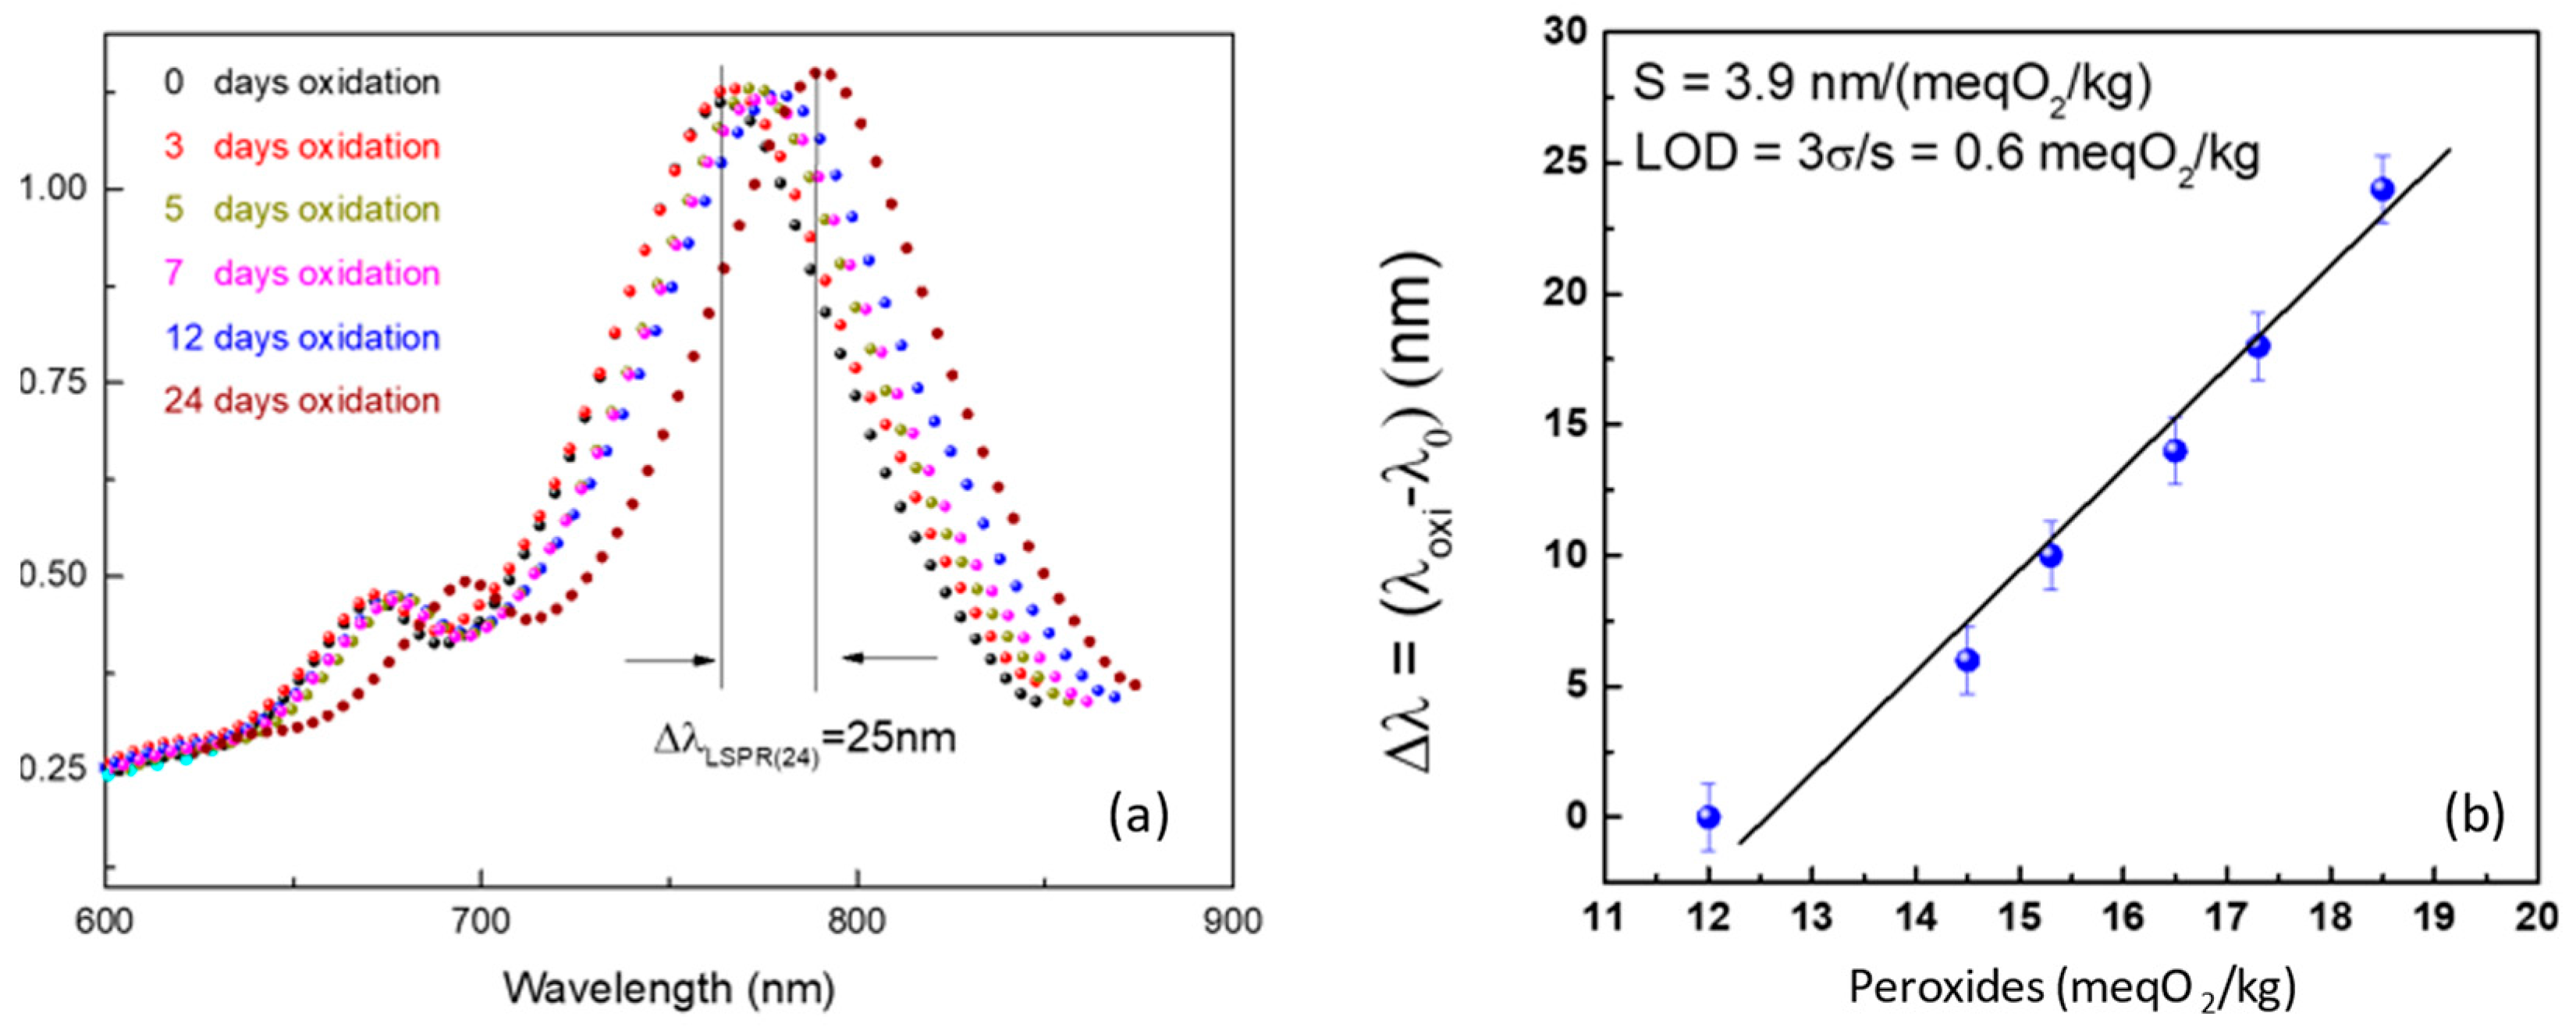
As a proof of concept, the exploitation of one of the realized NSL-based nanostructures as an opto-plasmonic transducer is described. A preliminary qualitative correlation between the oxidation state of extra virgin olive oil (EVOO) and the variation in the LSPR of a nanodomes (ND) is reported, by monitoring optical absorption measurements in the UV-VIS spectral range. Virgin olive oils, rich in monounsaturated fatty acids and in particular oleic acid, are subjected to an undesirable series of chemical reactions involving oxygen, which degrades their quality. To this purpose, ordered nanodome arrays obtained starting from nano-prisms (NP) by an NSL-based fabrication technique, combined with a thermal treatment protocol that induces a high-temperature de-wetting process, were used as optical sensing transducers. In Figure 8a, the adopted experimental configuration is reported. The transducer is integrated into a microfluidic channel (Figure 8b) to perform optical measurement in a liquid environment, allowing a small quantity of olive oil to be examined in the transmission configuration. Optical absorption is registered using a microscope objective to focus the incident light on the sample and a collimator to collect the transmitted signal. In Figure 9a, typical absorption spectra are reported. A red shift in the typical LSPR peak as a function of oxidation days of the analyzed sample is monitored using a portable spectrophotometer.
To compare the position of the LSPR peak detected in each state of oxidation with the number of peroxides artificially generated in the oil, standard laboratory analysis has been performed. To this purpose, peroxide number evaluation in a certified laboratory of analysis was performed using the titration methodology, following the rules CEE 2568/1991 11/07/1991 GU CEE L248 05/09/1991 All III Reg UE 1784/2016 30/09/2016 GU UE L273 08/10/2016.
A precise low-limit number of peroxides of 20 meq O2/kg (milliequivalents of active oxygen per kg of oil) in extra virgin olive oils is prescribed. Above this value (>20 meq O2/kg), the EVO oil is considered of very low quality. Good quality can be attributed to EVO oil containing a few peroxides below 12 meq O2/kg and excellent quality for values under 7 meq O2/kg.
To calibrate the plasmonic transducer and to calculate the relative calibration curve, EVO oil with increasing values of peroxides was artificially generated through carefully controlled thermal treatments (from 120 to 200 °C).
A red shift of the localized plasmon resonance peak in the nanostructured transducer can be evidenced from the different chemical environment around the nanostructures. In Figure 9b, the calibration curve is reported, obtaining a calculated sensitivity value of 3.9 nm/(meqO2/kg) and a FOM = 6 × 10⁻² meq O2/kg. Moreover, an LOD (limit of detection) of 0.6 meq O2/kg was calculated for our optical transducer [61]. The red shift in these optical envelopes is monitored by replacing the EVO oil sample in the microfluidic channel with another in a different state of oxidation, thus demonstrating the potentiality of this new sensing probe.
Similar experiments have been conducted with NHA transducers, as shown in Figure 6d. However, even though similar structures have been widely used in the literature for sensing and biosensing measurements in liquid environments, we experienced several issues working with fluid characterized by elevated viscosity, such as virgin olive oil. Similar liquids are very difficult to be removed from the inner wall of the nano holes, even after an intensive cleaning procedure of the surface. This phenomenon can be attributed to the intrinsic geometrical features of the nano-cavity, compromising the sequential monitoring of several olive oil solutions characterized by the increasing oxidation state. Similar issues were not encountered with nano-prism arrays, pushing us to choose these structures for the specific sensing application.
4. Conclusions
In conclusion, an interesting relationship has been obtained between the geometric characteristics of different types of nanostructures with related optical phenomena such as enhanced absorption or extraordinary transmission. These properties, together with electric field enhancement and confinement, are characterized and optimized in view of the employment of the fabricated nanostructures as optical transducers in nanoplasmonic chemosensors. As a proof of concept, a prototype of a microfluidic device containing large-area nanostructures, calibrated for agri-food application, to detect the dynamic oxidation state of EVOO working in UV-VIS spectral range has been realized.
Author Contributions
This manuscript was written through contributions of all authors. A.C. performed the NSL nanofabrication as well as spectral and sensing measurements with related statistical analysis and discussed optical properties of the long-range ordered systems, and wrote the original draft paper; D.L. performed morphological and chemical characterization with relative discussion; R.R. and M.G.M. designed and discussed all the experiments and heavily contributed to the revision of the paper. All authors have read and agreed to the published version of the manuscript.
Funding
This research was funded by Italian Research Ministry MIUR through Regione Puglia—AVVISO “INNONETWORK—Aiuti a sostegno alle Attività di R&S” in the project M3O3 “Microsistemi multifunzionali per il monitoraggio dei processi ossidativi di oli da olive” (Cod XMPYXR1).
Institutional Review Board Statement
Not applicable.
Informed Consent Statement
Not applicable.
Data Availability Statement
The data presented in this study are available on request to the corresponding authors.
Acknowledgments
Authors are grateful to Adriana Campa e Enrico Melissano who performed the metal deposition in the clean room facilities and to Giovanni Montagna for technical support and LSPR optical set-up preparation.
Conflicts of Interest
The authors declare no conflict of interest.
References
- Minopoli, A.; Acunzo, A.; della Ventura, B.; Velotta, R. Nanostructured Surfaces as Plasmonic Biosensors: A Review. Adv. Mater. Interfaces 2022, 9, 2101133. [Google Scholar] [CrossRef]
- Huang, J.; Xu, K.; Hu, J.; Yuan, D.; Li, J.; Qiao, J.; Xu, S. Self-Aligned Plasmonic Lithography for Maskless Fabrication of Large-Area Long-Range Ordered 2D Nanostructures. Nano Lett. 2022, 22, 6223–6228. [Google Scholar] [CrossRef] [PubMed]
- Gunnarsson, L.; Rindzevicius, T.; Prikulis, J.; Kasemo, B.; Käll, M.; Zou, S.; Schatz, G.C. Confined Plasmons in Nanofabricated Single Silver Particle Pairs: Experimental Observations of Strong Interparticle Interactions. J. Phys. Chem. B 2005, 109, 1079–1087. [Google Scholar] [CrossRef]
- Zhao, Y.; Li, X.; Liu, Y.; Zhang, L.; Wang, F.; Lu, Y. High performance surface-enhanced Raman scattering sensing based on Au nanoparticle-monolayer graphene-Ag nanostar array hybrid system. Sens. Actuators B Chem. 2017, 247, 850–857. [Google Scholar] [CrossRef]
- Chen, Y.; Bi, K.; Wang, Q.; Zheng, M.; Liu, Q.; Han, Y.; Yang, J.; Chang, S.; Zhang, G.; Duan, H. Rapid Focused Ion Beam Milling Based Fabrication of Plasmonic Nanoparticles and Assemblies via ‘Sketch and Peel’ Strategy. ACS Nano 2016, 10, 11228–11236. [Google Scholar] [CrossRef]
- Schift, H. Nanoimprint lithography: An old story in modern times? A review. J. Vac. Sci. Technol. B 2008, 26, 458–480. [Google Scholar] [CrossRef]
- Kooy, N.; Mohamed, K.; Pin, L.T.; Guan, O.S. A review of roll-to-roll nanoimprint lithography. Nanoscale Res. Lett. 2014, 9, 320. [Google Scholar] [CrossRef]
- Guo, L.J. Nanoimprint Lithography: Methods and Material Requirements. Adv. Mater. 2007, 19, 495–513. [Google Scholar] [CrossRef]
- Qin, D.; Xia, Y.; Whitesides, G.M. Soft lithography for micro- and nanoscale patterning. Nat. Protoc. 2010, 5, 491–502. [Google Scholar] [CrossRef]
- Farcau, C.; Astilean, S. Simple colloidal lithography approach to generate inexpensive stamps for polymer nano-patterning. Mater. Lett. 2011, 65, 2190–2192. [Google Scholar] [CrossRef]
- Wisser, F.M.; Schumm, B.; Mondin, G.; Grothe, J.; Kaskel, S. Precursor strategies for metallic nano- and micropatterns using soft lithography. J. Mater. Chem. C 2015, 3, 2717–2731. [Google Scholar] [CrossRef]
- Dryakhlushin, V.F.; Klimov, A.Y.; Rogov, V.V.; Vostokov, N.V. Near-field optical lithography method for fabrication of the nanodimensional objects. Appl. Surf. Sci. 2005, 248, 200–203. [Google Scholar] [CrossRef]
- Garcia, R.; Knoll, A.W.; Riedo, E. Advanced scanning probe lithography. Nat. Nanotechnol. 2014, 9, 577–587. [Google Scholar] [CrossRef] [PubMed]
- Tseng, A.A.; Notargiacomo, A.; Chen, T.P. Nanofabrication by scanning probe microscope lithography: A review. J. Vac. Sci. Technol. B 2005, 23, 877–894. [Google Scholar] [CrossRef]
- Xu, S.; Lei, Y. Template-Assisted Fabrication of Nanostructured Arrays for Sensing Applications. Chempluschem 2018, 83, 741–755. [Google Scholar] [CrossRef]
- Hulteen, J.C.; van Duyne, R.P. Nanosphere lithography: A materials general fabrication process for periodic particle array surfaces. J. Vac. Sci. Technol. A 1995, 13, 1553–1558. [Google Scholar] [CrossRef]
- Gang, Z.; Dayang, W. Colloidal Lithography—The Art of Nanochemical Patterning. Chem. Asian J. 2009, 4, 236–245. [Google Scholar] [CrossRef]
- Colson, P.; Henrist, C.; Cloots, R. Nanosphere Lithography: A Powerful Method for the Controlled Manufacturing of Nanomaterials. J. Nanomater. 2013, 2013, 21. [Google Scholar] [CrossRef]
- Ai, B.; Möhwald, H.; Wang, D.; Zhang, G. Advanced Colloidal Lithography Beyond Surface Patterning. Adv. Mater. Interfaces 2017, 4, 1600271. [Google Scholar] [CrossRef]
- Muldarisnur, M.; Marlow, F. Opal Films Made by the Capillary Deposition Method: Crystal Orientation and Defects. J. Phys. Chem. C 2011, 115, 414–418. [Google Scholar] [CrossRef]
- Jiang, P.; McFarland, M.J. Large-Scale Fabrication of Wafer-Size Colloidal Crystals, Macroporous Polymers and Nanocomposites by Spin-Coating. J. Am. Chem. Soc. 2004, 126, 13778–13786. [Google Scholar] [CrossRef] [PubMed]
- Mihi, A.; Ocaña, M.; Míguez, H. Oriented Colloidal-Crystal Thin Films by Spin-Coating Microspheres Dispersed in Volatile Media. Adv. Mater. 2006, 18, 2244–2249. [Google Scholar] [CrossRef]
- Rizzato, S.; Primiceri, E.; Monteduro, A.G.; Colombelli, A.; Leo, A.; Manera, M.G.; Rella, R.; Maruccio, G. Interaction-tailored organization of large-area colloidal assemblies. Beilstein J. Nanotechnol. 2018, 9, 1582–1593. [Google Scholar] [CrossRef] [PubMed]
- Pan, F.; Zhang, J.; Cai, C.; Wang, T. Rapid Fabrication of Large-Area Colloidal Crystal Monolayers by a Vortical Surface Method. Langmuir 2006, 22, 7101–7104. [Google Scholar] [CrossRef]
- Zhang, J.-T.; Wang, L.; Chao, X.; Velankar, S.S.; Asher, S.A. Vertical spreading of two-dimensional crystalline colloidal arrays. J Mater. Chem. C 2013, 1, 6099–6102. [Google Scholar] [CrossRef]
- Lu, Z.; Zhou, M. Fabrication of large scale two-dimensional colloidal crystal of polystyrene particles by an interfacial self-ordering process. J. Colloid Interface Sci. 2011, 361, 429–435. [Google Scholar] [CrossRef]
- Ho, C.-C.; Lin, W.-Y.; Tseng, F.-G. In situ monitoring of colloid packing at an air/water interface using visible laser diffraction. RSC Adv. 2016, 6, 80463–80467. [Google Scholar] [CrossRef]
- Yu, J.; Geng, C.; Zheng, L.; Ma, Z.; Tan, T.; Wang, X.; Yan, Q.; Shen, D. Preparation of High-Quality Colloidal Mask for Nanosphere Lithography by a Combination of Air/Water Interface Self-Assembly and Solvent Vapor Annealing. Langmuir 2012, 28, 12681–12689. [Google Scholar] [CrossRef] [PubMed]
- Lotito, V.; Zambelli, T. Self-Assembly of Single-Sized and Binary Colloidal Particles at Air/Water Interface by Surface Confinement and Water Discharge. Langmuir 2016, 32, 9582–9590. [Google Scholar] [CrossRef]
- Blodgett, K.B. Films Built by Depositing Successive Monomolecular Layers on a Solid Surface. J. Am. Chem. Soc. 1935, 57, 1007–1022. [Google Scholar] [CrossRef]
- Pieranski, P. Two-Dimensional Interfacial Colloidal Crystals. Phys. Rev. Lett. 1980, 45, 569–572. [Google Scholar] [CrossRef]
- van Dommelen, R.; Fanzio, P.; Sasso, L. Surface self-assembly of colloidal crystals for micro- and nano-patterning. Adv. Colloid Interface Sci. 2018, 251, 97–114. [Google Scholar] [CrossRef] [PubMed]
- Vogel, N.; Goerres, S.; Landfester, K.; Weiss, C.K. A convenient method to produce close- and non-close-packed monolayers using direct assembly at the air-water interface and subsequent plasma-induced size reduction. Macromol. Chem. Phys. 2011, 212, 1719–1734. [Google Scholar] [CrossRef]
- Dai, Z.; Li, Y.; Duan, G.; Jia, L.; Cai, W. Phase Diagram, Design of Monolayer Binary Colloidal Crystals, and Their Fabrication Based on Ethanol-Assisted Self-Assembly at the Air/Water Interface. ACS Nano 2012, 6, 6706–6716. [Google Scholar] [CrossRef]
- Moon, G.D.; Lee, T.I.; Kim, B.; Chae, G.; Kim, J.; Kim, S.; Myoung, J.M.; Jeong, U. Assembled monolayers of hydrophilic particles on water surfaces. ACS Nano 2011, 5, 8600–8612. [Google Scholar] [CrossRef]
- Colombelli, A.; Lospinoso, D.; Taurino, A.; Manera, M.G. Tailoring a periodic metal nanoantenna array using low cost template-assisted lithography. J. Mater. Chem. C 2019, 7, 13818–13828. [Google Scholar] [CrossRef]
- Chan, G.H.; Zhao, J.; Hicks, E.M.; Schatz, G.C.; van Duyne, R.P. Plasmonic Properties of Copper Nanoparticles Fabricated by Nanosphere Lithography. Nano Lett. 2007, 7, 1947–1952. [Google Scholar] [CrossRef]
- EHicks, M.; Lyandres, O.; Hall, W.P.; Zou, S.; Glucksberg, M.R.; van Duyne, R.P. Plasmonic Properties of Anchored Nanoparticles Fabricated by Reactive Ion Etching and Nanosphere Lithography. J. Phys. Chem. C 2007, 111, 4116–4124. [Google Scholar] [CrossRef]
- Zhang, X.; Whitney, A.V.; Zhao, J.; Hicks, E.M.; Van Duyne, R.P. Advances in contemporary nanosphere lithographic techniques. J. Nanosci. Nanotechnol. 2006, 6, 1920–1934. [Google Scholar] [CrossRef]
- Zhang, X.; Yonzon, C.R.; van Duyne, R.P. Nanosphere lithography fabricated plasmonic materials and their applications. J. Mater. Res. 2006, 21, 1083–1092. [Google Scholar] [CrossRef] [Green Version]
- Haes, A.J.; van Duyne, R.P. A Nanoscale Optical Biosensor: Sensitivity and Selectivity of an Approach Based on the Localized Surface Plasmon Resonance Spectroscopy of Triangular Silver Nanoparticles. J. Am. Chem. Soc. 2002, 124, 10596–10604. [Google Scholar] [CrossRef] [PubMed]
- Chen, K.; Dao, T.D.; Nagao, T. Tunable Nanoantennas for Surface Enhanced Infrared Absorption Spectroscopy by Colloidal Lithography and Post-Fabrication Etching. Sci. Rep. 2017, 7, 44069. [Google Scholar] [CrossRef]
- McFarland, A.D.; Young, M.A.; Dieringer, J.A.; van Duyne, R.P. Wavelength-Scanned Surface-Enhanced Raman Excitation Spectroscopy. J. Phys. Chem. B 2005, 109, 11279–11285. [Google Scholar] [CrossRef]
- Michieli, N.; Pilot, R.; Russo, V.; Scian, C.; Todescato, F.; Signorini, R.; Agnoli, S.; Cesca, T.; Bozio, R.; Mattei, G. Oxidation effects on the SERS response of silver nanoprism arrays. RSC Adv. 2017, 7, 369–378. [Google Scholar] [CrossRef]
- Li, J.-F.; Li, C.-Y.; Aroca, R.F. Plasmon-enhanced fluorescence spectroscopy. Chem. Soc. Rev. 2017, 46, 3962–3979. [Google Scholar] [CrossRef] [PubMed]
- Enrichi, F.; Quandt, A.; Righini, G.C. Plasmonic enhanced solar cells: Summary of possible strategies and recent results. Renew. Sustain. Energy Rev. 2018, 82, 2433–2439. [Google Scholar] [CrossRef]
- Yonzon, C.R.; Jeoung, E.; Zou, S.; Schatz, G.C.; Mrksich, M.; van Duyne, R.P. A Comparative Analysis of Localized and Propagating Surface Plasmon Resonance Sensors: The Binding of Concanavalin A to a Monosaccharide Functionalized Self-Assembled Monolayer. J. Am. Chem. Soc. 2004, 126, 12669–12676. [Google Scholar] [CrossRef]
- Haes, A.J.; Zou, S.; Schatz, G.C.; van Duyne, R.P. A Nanoscale Optical Biosensor: The Long Range Distance Dependence of the Localized Surface Plasmon Resonance of Noble Metal Nanoparticles. J. Phys. Chem. B 2004, 108, 109–116. [Google Scholar] [CrossRef]
- Song, C.; Ye, B.; Xu, J.; Chen, J.; Shi, W.; Yu, C.; An, C.; Zhu, J.; Zhang, W. Large-Area Nanosphere Self-Assembly Monolayers for Periodic Surface Nanostructures with Ultrasensitive and Spatially Uniform SERS Sensing. Small 2022, 18, 2104202. [Google Scholar] [CrossRef]
- Bharadwaj, P.; Novotny, L. Spectral dependence of single molecule fluorescence enhancement. Opt. Express 2007, 15, 14266–14274. [Google Scholar] [CrossRef] [Green Version]
- MManera, G.; Colombelli, A.; Taurino, A.; Martin, A.G.; Rella, R. Magneto-Optical properties of noble-metal nanostructures: Functional nanomaterials for bio sensing. Sci. Rep. 2018, 8, 12640. [Google Scholar] [CrossRef] [PubMed]
- Cesaria, M.; Taurino, A.; Manera, M.G.; Minunni, M.; Scarano, S.; Rella, R. Gold nanoholes fabricated by colloidal lithography: Novel insights into nanofabrication, short-range correlation and optical properties. Nanoscale 2019, 11, 8416–8432. [Google Scholar] [CrossRef] [PubMed]
- Lee, S.H.; Bantz, K.C.; Lindquist, N.C.; Oh, S.-H.; Haynes, C.L. Self-Assembled Plasmonic Nanohole Arrays. Langmuir 2009, 25, 13685–13693. [Google Scholar] [CrossRef] [PubMed]
- Ebbesen, T.W.; Lezec, H.J.; Ghaemi, H.F.; Thio, T.; Wolff, P.A. Extraordinary optical transmission through sub-wavelength hole arrays. Nature 1998, 391, 667–669. [Google Scholar] [CrossRef]
- Ghaemi, H.F.; Thio, T.; Grupp, D.E.; Ebbesen, T.W.; Lezec, H.J. Surface plasmons enhance optical transmission through subwavelength holes. Phys. Rev. B 1998, 58, 6779–6782. [Google Scholar] [CrossRef]
- Escobedo, C. On-chip nanohole array based sensing: A review. Lab Chip 2013, 13, 2445–2463. [Google Scholar] [CrossRef]
- Zheng, P.; Cushing, S.K.; Suri, S.; Wu, N. Tailoring plasmonic properties of gold nanohole arrays for surface-enhanced Raman scattering. Phys. Chem. Chem. Phys. 2015, 17, 21211–21219. [Google Scholar] [CrossRef]
- Candeloro, P.; Iuele, E.; Perozziello, G.; Coluccio, M.L.; Gentile, F.; Malara, N.; Mollace, V.; Di Fabrizio, E. Plasmonic nanoholes as SERS devices for biosensing applications: An easy route for nanostructures fabrication on glass substrates. Microelectron. Eng. 2017, 175, 30–33. [Google Scholar] [CrossRef]
- Wang, Y.; Wu, L.; Wong, T.I.; Bauch, M.; Zhang, Q.; Zhang, J.; Liu, X.; Zhou, X.; Bai, P.; Dostalek, J.; et al. Directional fluorescence emission co-enhanced by localized and propagating surface plasmons for biosensing. Nanoscale 2016, 8, 8008–8016. [Google Scholar] [CrossRef]
- Zhang, Q.; Wu, L.; Wong, T.I.; Zhang, J.; Liu, X.; Zhou, X.; Bai, P.; Liedberg, B.; Wang, Y. Surface plasmon-enhanced fluorescence on Au nanohole array for prostate-specific antigen detection. Int. J. Nanomed. 2017, 12, 2307–2314. [Google Scholar] [CrossRef] [Green Version]
- Sakar, S.; Ghosh, A.K.; Adnan, M.; Aftenieva, O.; Gupta, V.; Fery, A.; Joseph, J.; Konig, T.A. Enhanced Figure of Merit via Hybridized Guided-Mode Resonances in 2D-Metallic Photonic Crystal Slabs. Adv. Opt. Mater. 2022, 10, 2200954. [Google Scholar] [CrossRef]
Figure 1.
(a) Schematic illustration of the CPA monolayer formation on the water surface driven by a specific combination of electrostatic and capillary forces; (b) photograph of the close-packed self-assembled monolayer at air/water interface confined within the large area of the ring; photograph of a sample after the transfer of the colloidal mask onto glass (c) and silicon (d) substrates.
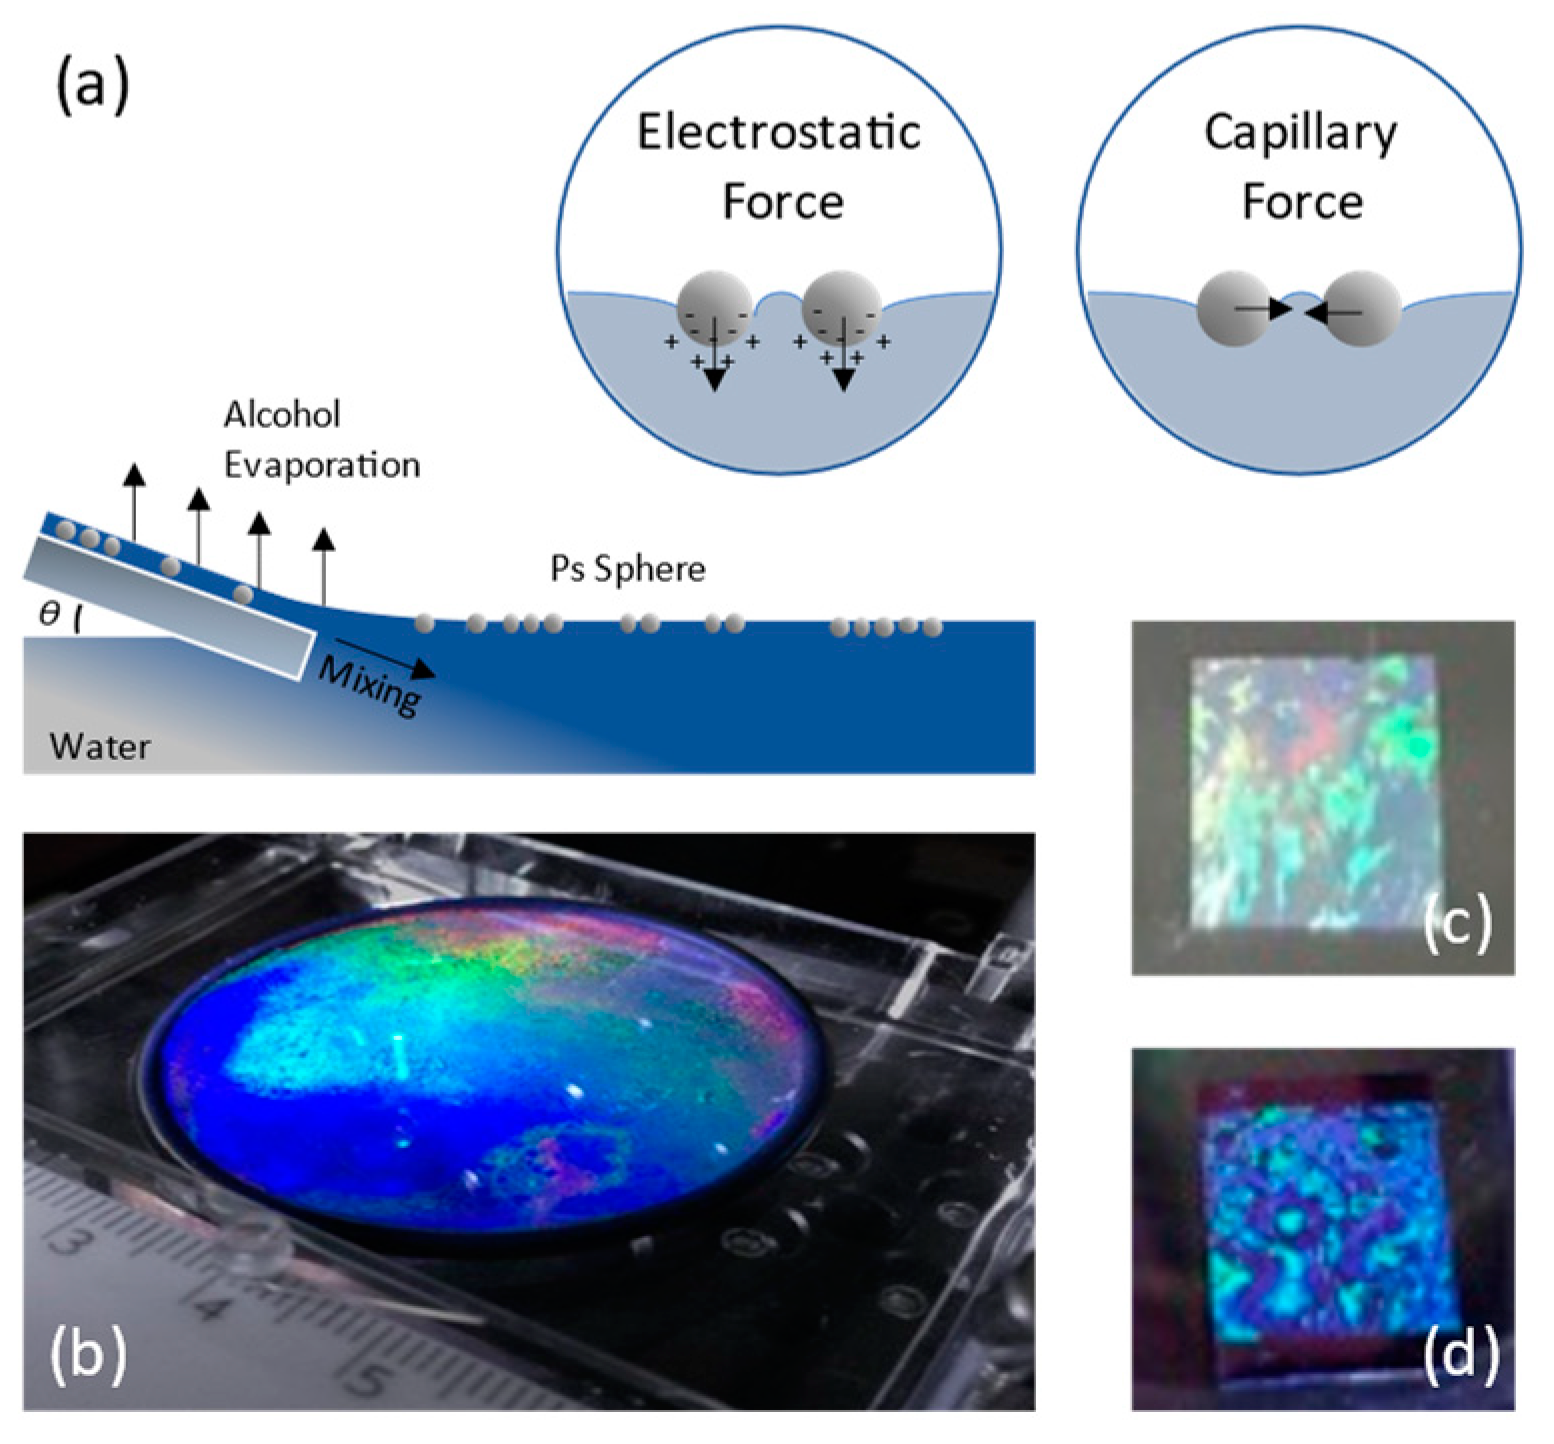
Figure 2.
(a) Photograph of a CPA investigated under white light illumination to detect the existence of structural colors and (b) hexagonal ordering in the monolayer. (c) Schematic representation of the diffraction tool used for the inspection of CPA crystal quality. (d) Typical hexagonal diffraction pattern of the investigated monolayer.

Figure 3.
Schematic illustration, low and high magnification AFM images of the CPA realized on glass substrate with Polystyrene NS of 500 nm in diameter.
Figure 3.
Schematic illustration, low and high magnification AFM images of the CPA realized on glass substrate with Polystyrene NS of 500 nm in diameter.
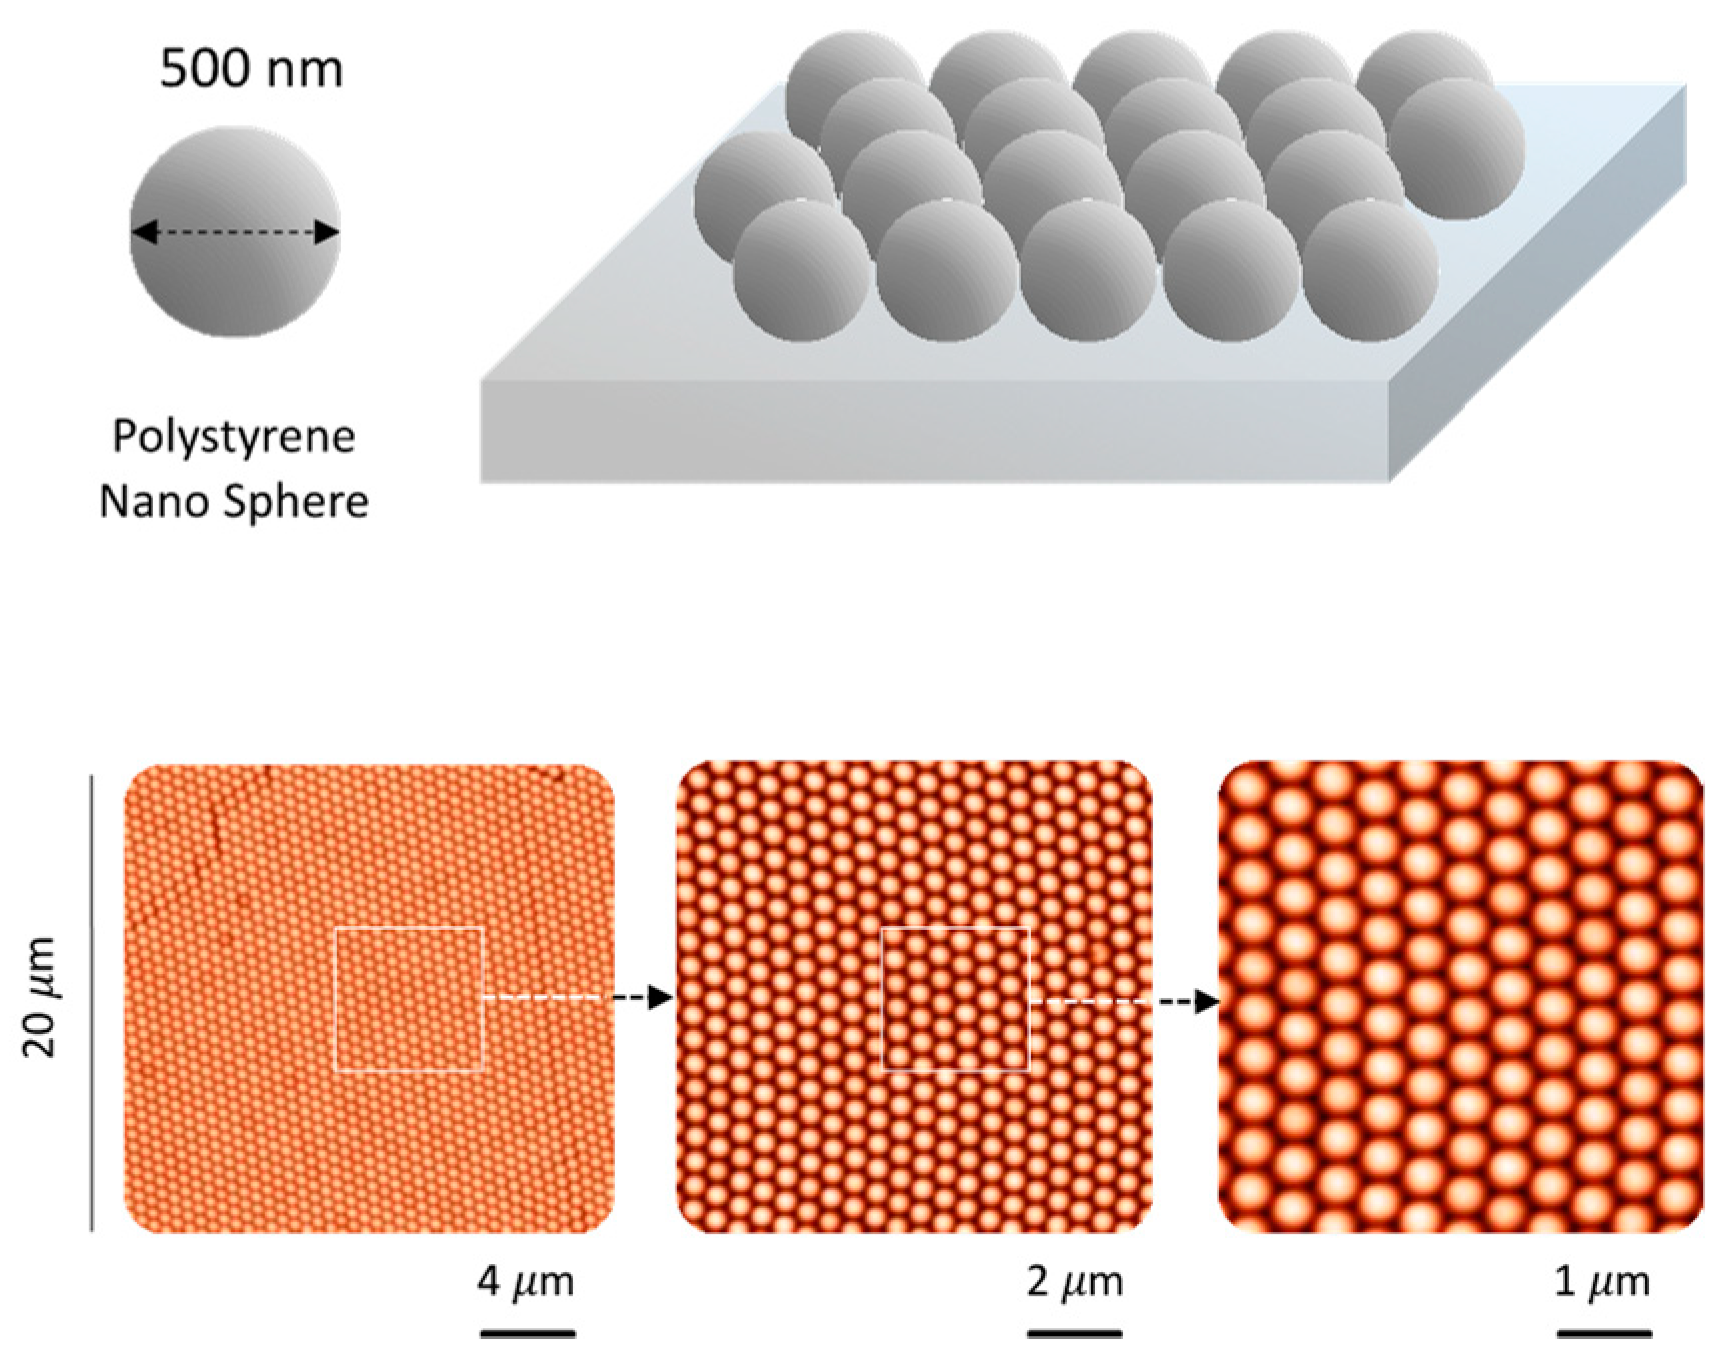
Figure 4.
Schematic illustration, low and high magnification SEM images of the gold nano prism realized by NSL on glass substrate with PS NS of 500 nm in diameter.
Figure 4.
Schematic illustration, low and high magnification SEM images of the gold nano prism realized by NSL on glass substrate with PS NS of 500 nm in diameter.
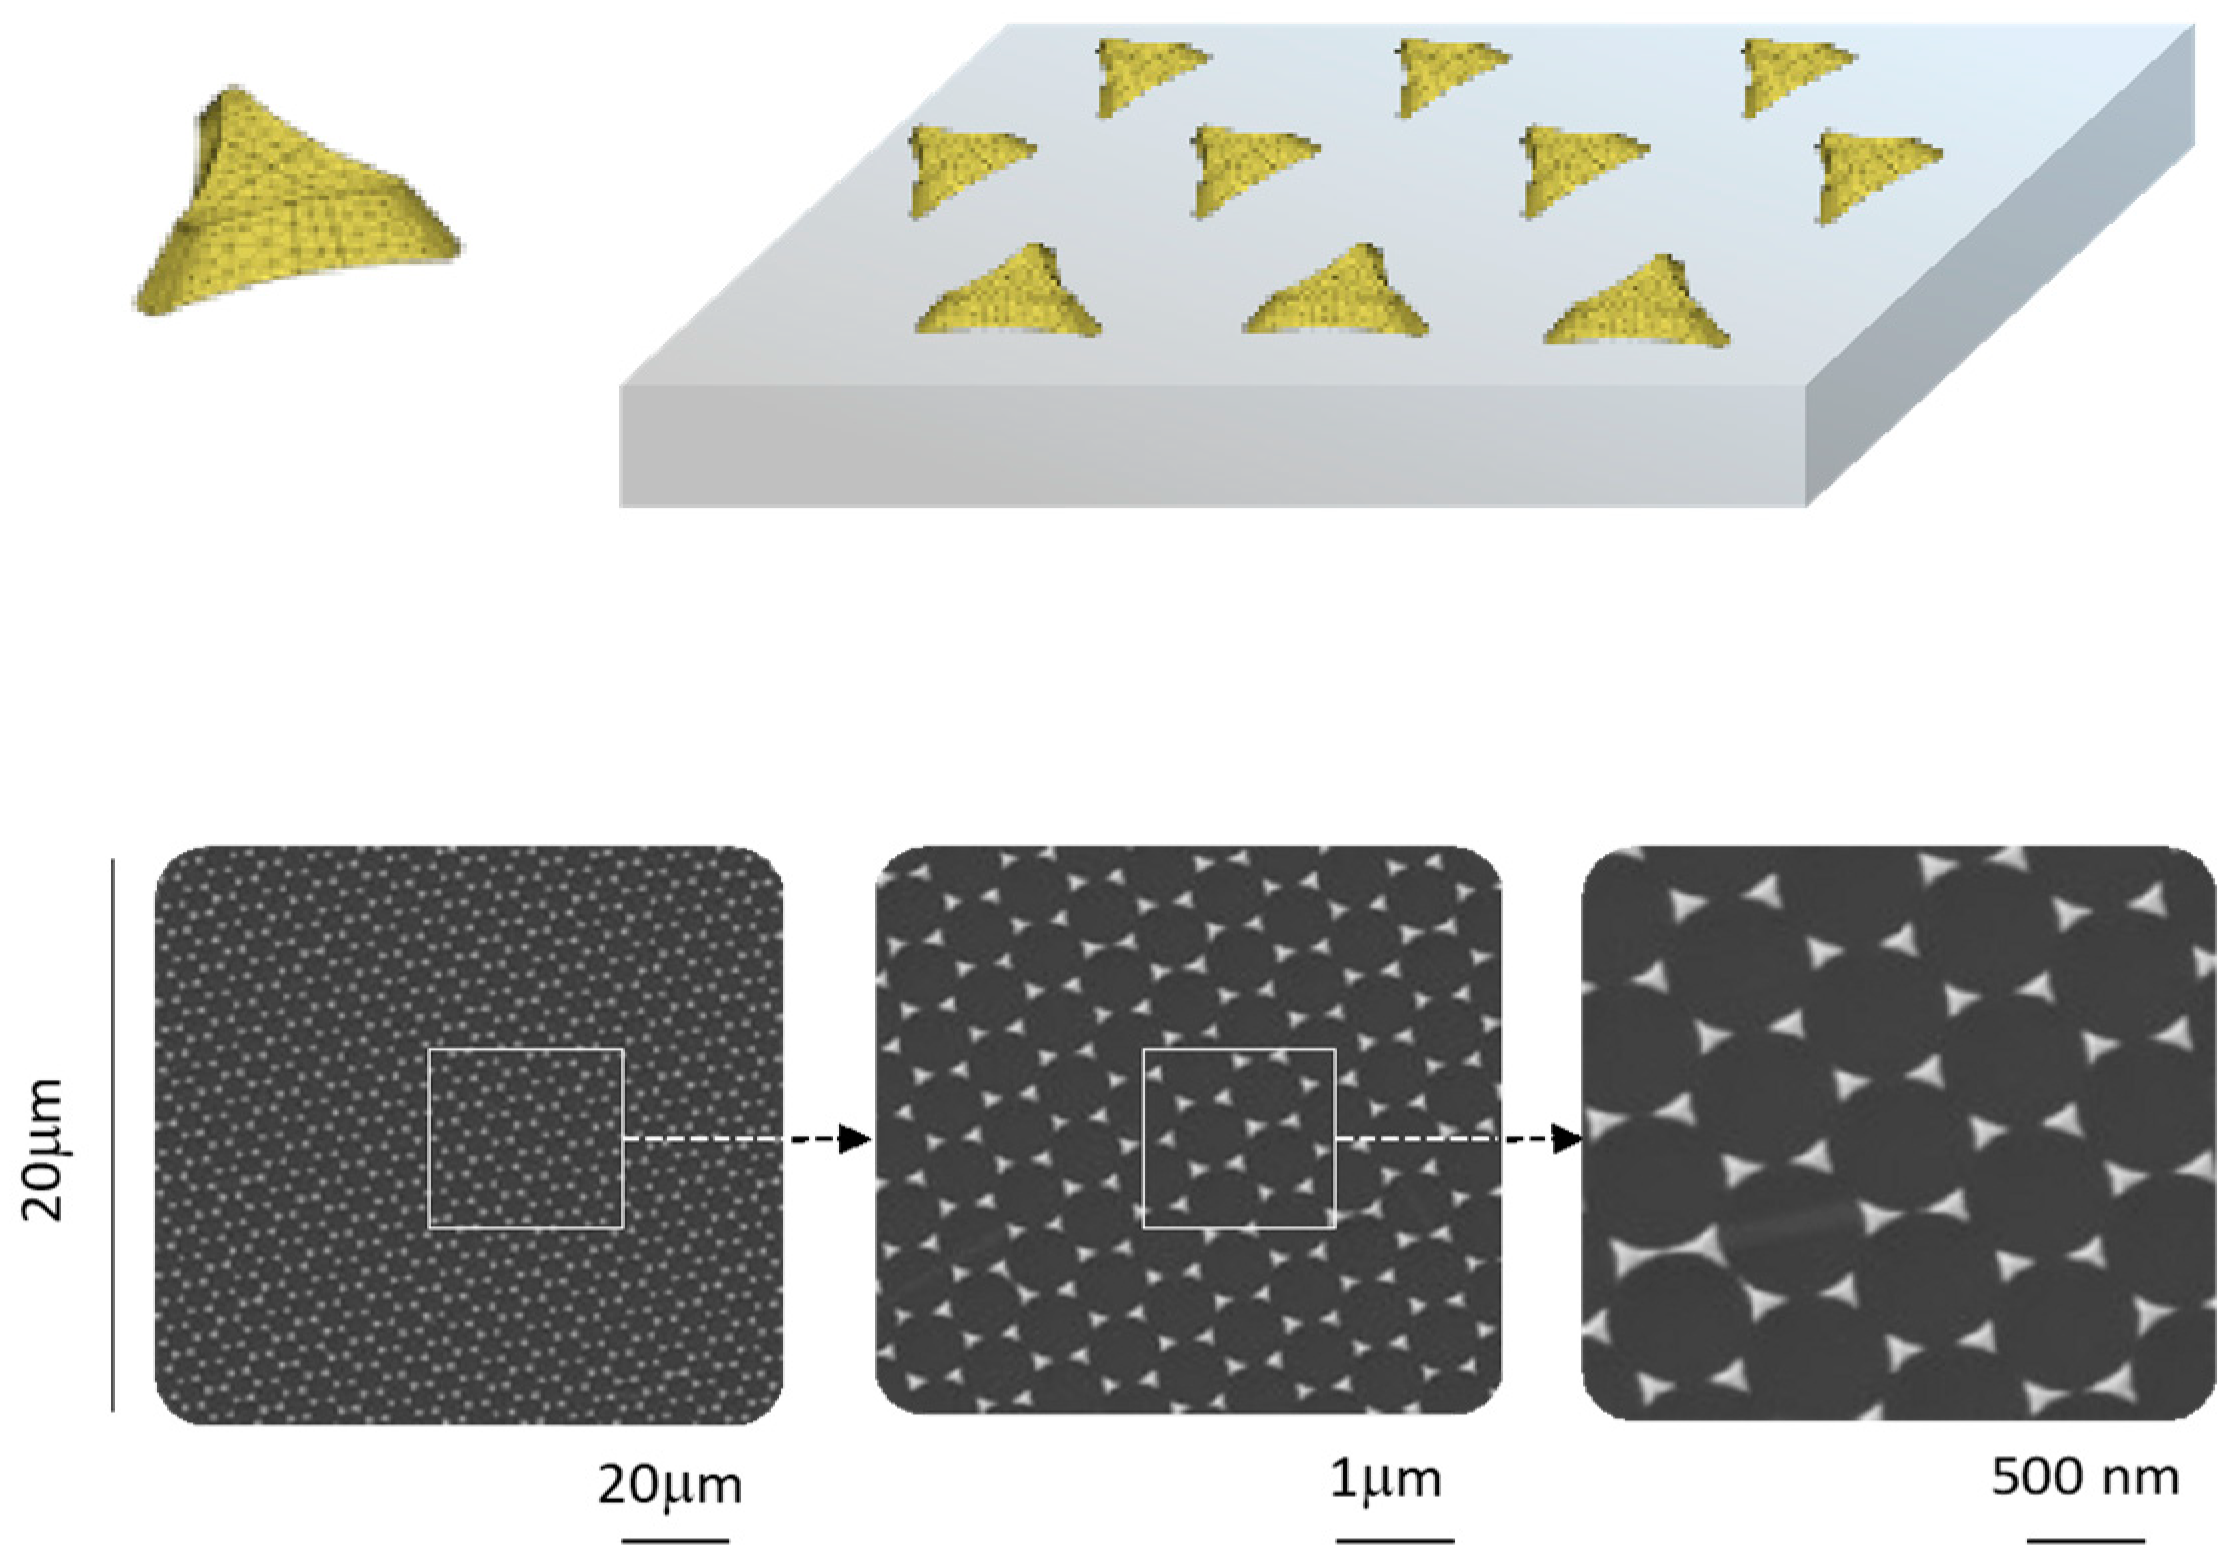
Figure 5.
(a–d) High-resolution AFM images showing the morphological evolution of the realized gold nanoprism upon thermal annealing. (e) Absorption spectra modification of the as deposited metal nanostructures after thermal treatments with increasing temperature, for 1 h; (f) the spectral position of the LSPR absorbance peak is plotted as function of the annealing temperature.

Figure 6.
(a) Schematic illustration of the NHA fabrication process; AFM image of the (b) CPA of PS particle deposited onto a glass substrate, (c) non-CPA obtained with an oxygen plasma treatment of the PS nanosphere; (d) AFM image and (e) photograph of the NHA obtained after mechanical and chemical PS Mask lift off.
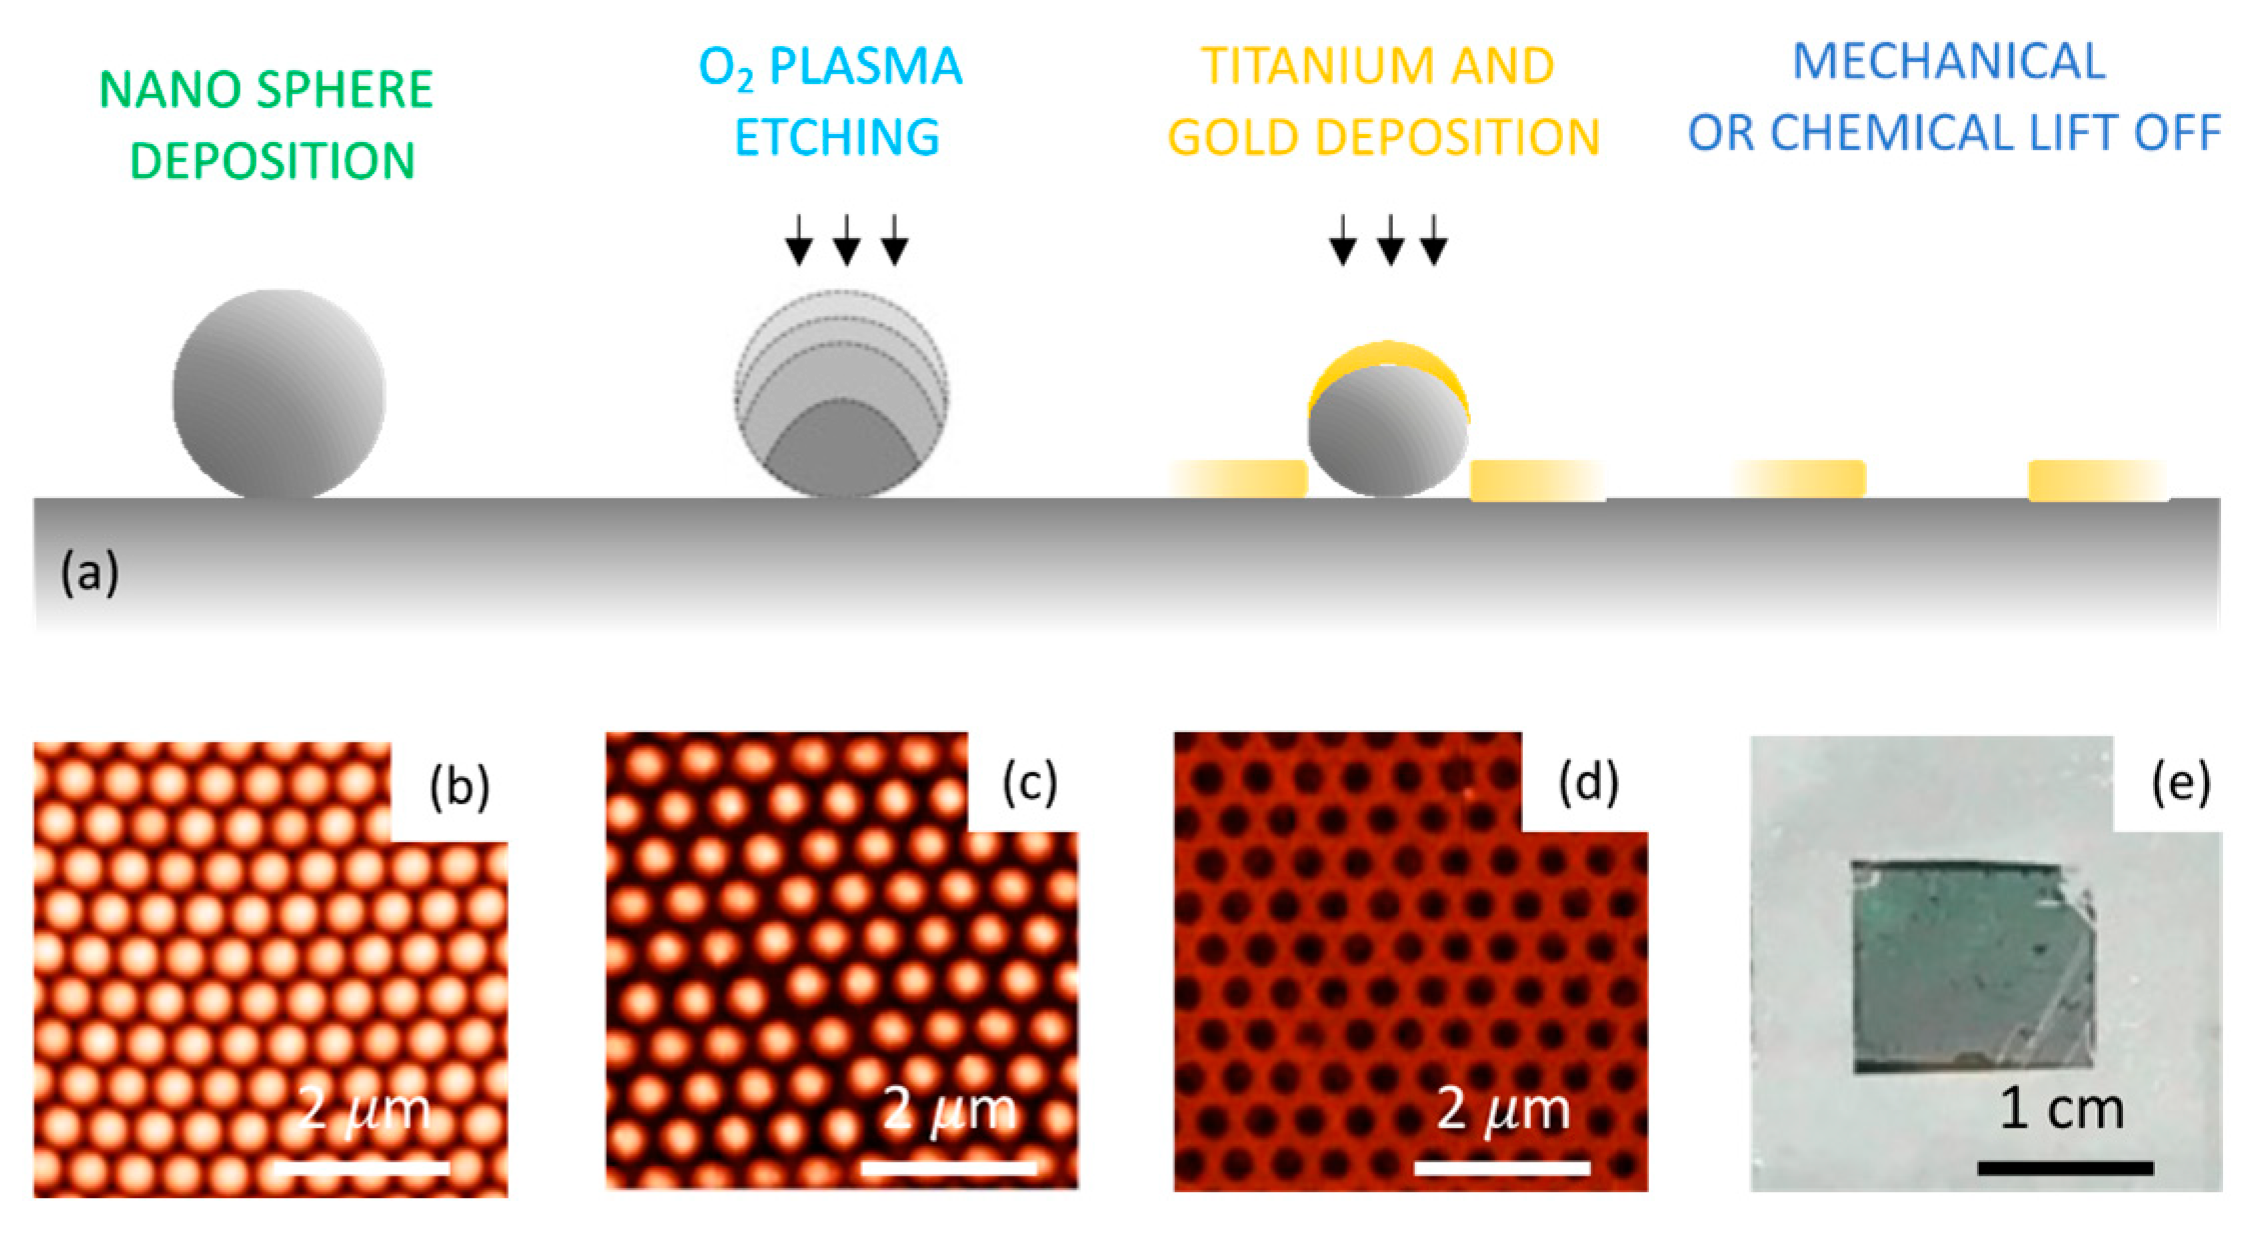
Figure 7.
Normalized absorbance spectra in the 400–1200 nm spectral range of long-range ordered distributions of NHA characterized by different holes diameter and realized in 30 nm thick Au layer.
Figure 7.
Normalized absorbance spectra in the 400–1200 nm spectral range of long-range ordered distributions of NHA characterized by different holes diameter and realized in 30 nm thick Au layer.
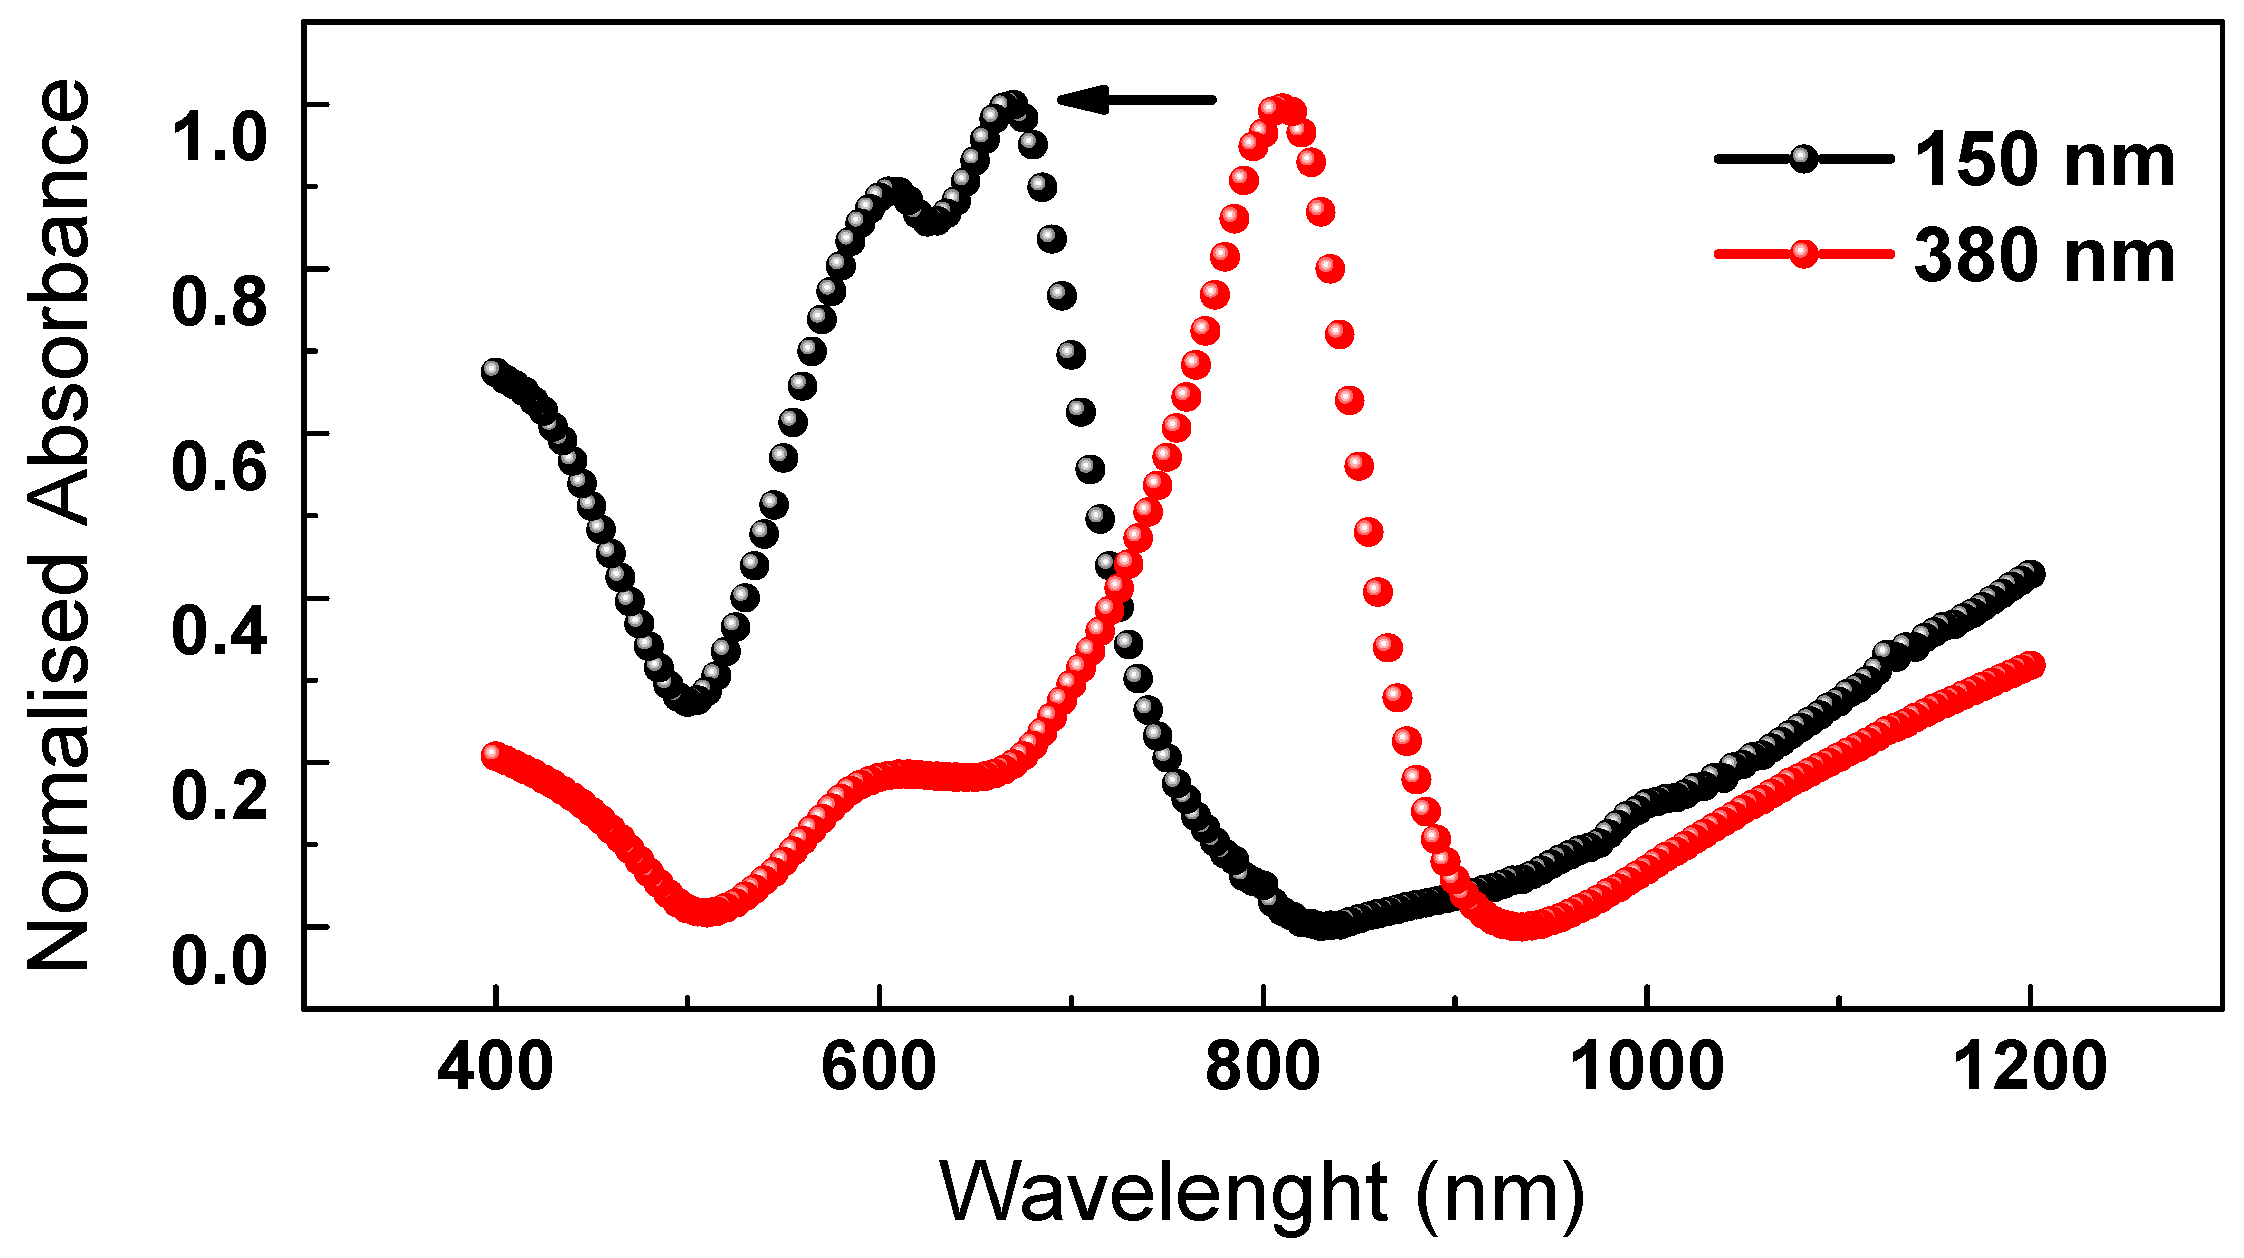
Figure 8.
(a) Schematic representation of the experimental setup used to perform optical measurements in liquid environment and transmission configuration; (b) picture of the miniaturized lab-on-a-chip (LOC) platform based on the integration of nano-structured LSPR transducers into a 2.5 cm × 2.5 cm PDMS microfluidic chip.
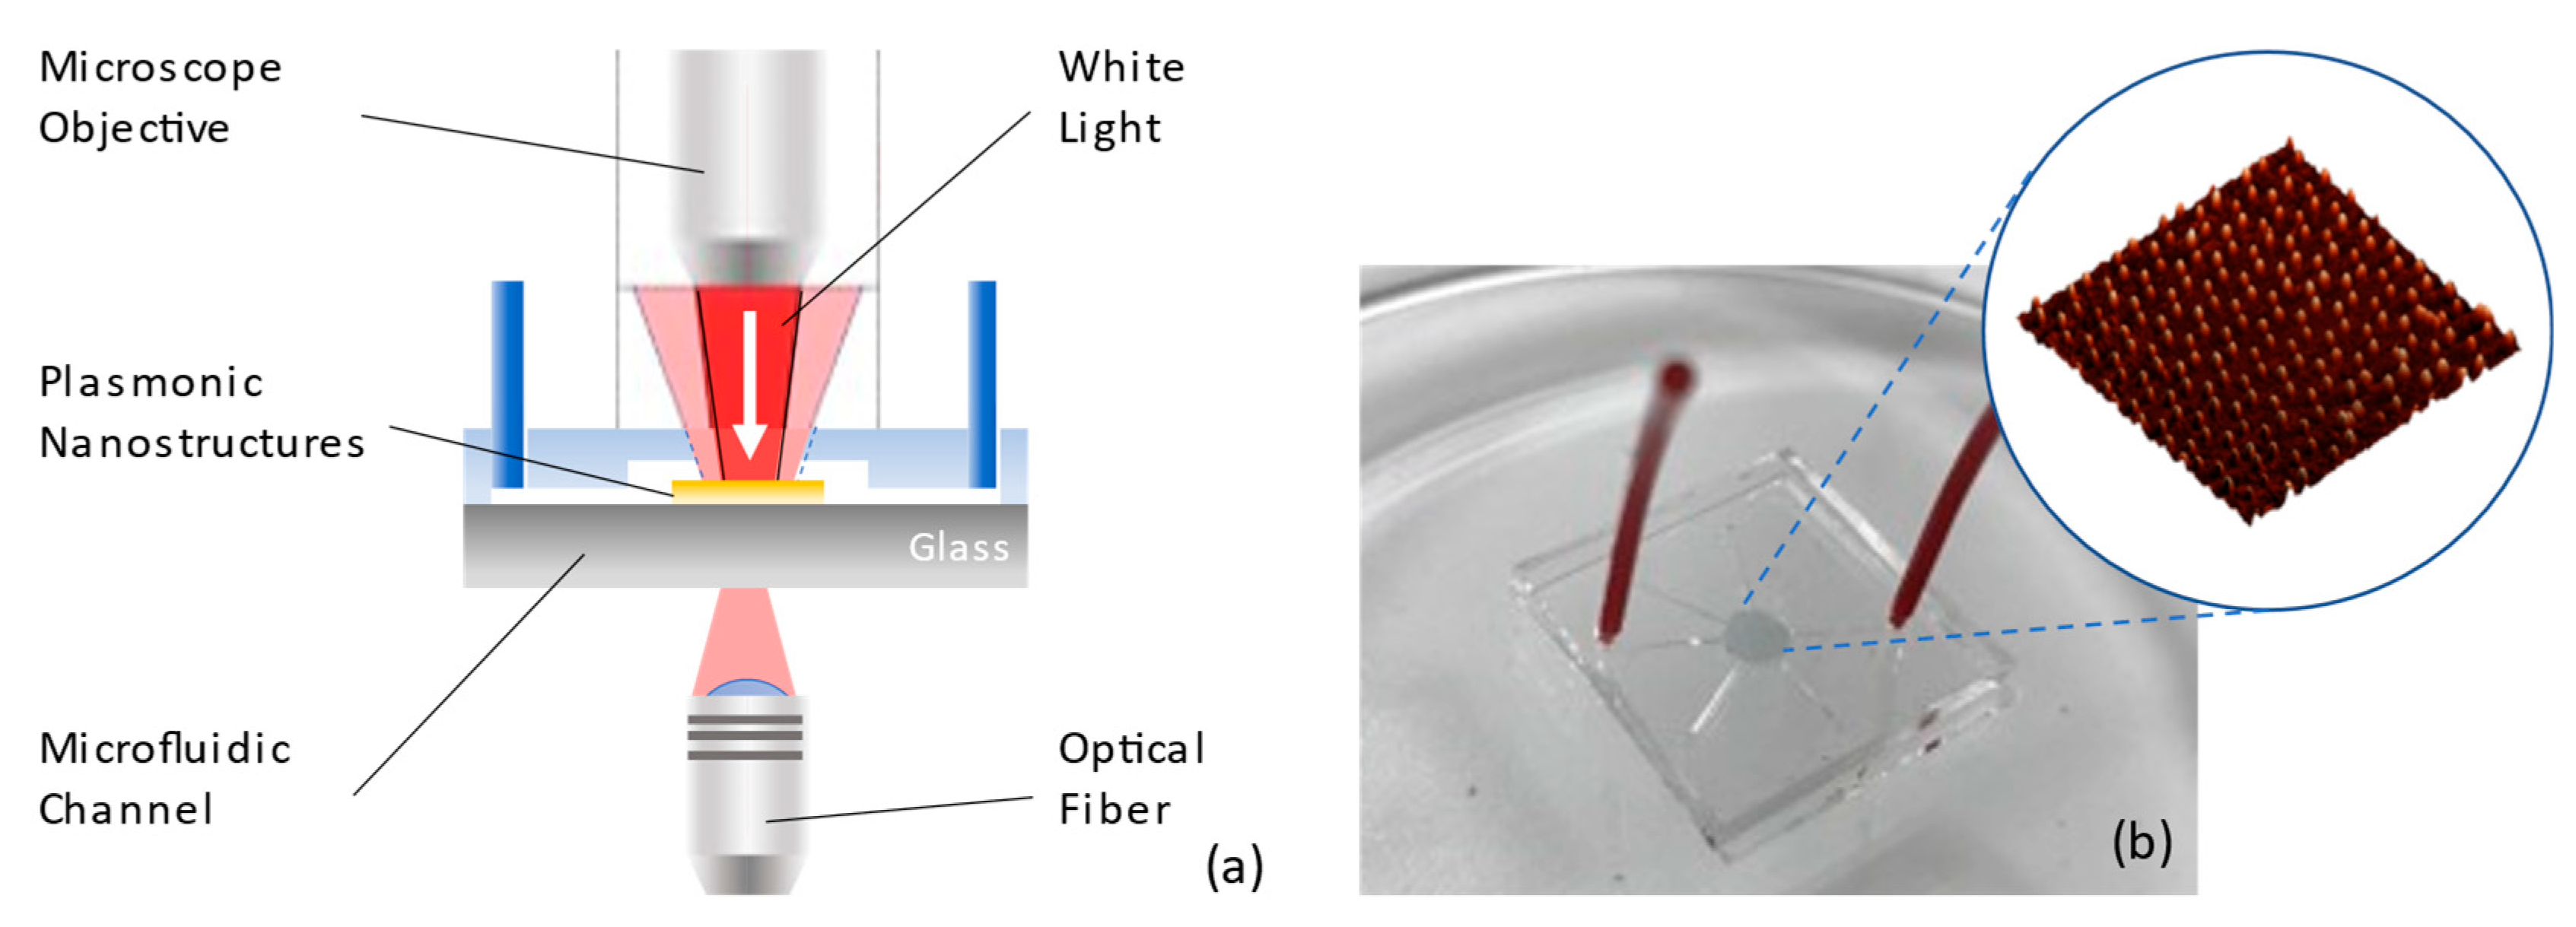
Figure 9.
(a) Optical absorption measurements in the UV-VIS spectral range and the relative calibration curve (b) have been reported; the plasmonic transducer response have been calculated by considering the spectral shift of LSPR absorbance peak in presence of EVO oil at different oxidation states and therefore increasing number of peroxides.
Disclaimer/Publisher’s Note: The statements, opinions and data contained in all publications are solely those of the individual author(s) and contributor(s) and not of MDPI and/or the editor(s). MDPI and/or the editor(s) disclaim responsibility for any injury to people or property resulting from any ideas, methods, instructions or products referred to in the content. |
© 2023 by the authors. Licensee MDPI, Basel, Switzerland. This article is an open access article distributed under the terms and conditions of the Creative Commons Attribution (CC BY) license (https://creativecommons.org/licenses/by/4.0/).
Share and Cite
MDPI and ACS Style
Colombelli, A.; Lospinoso, D.; Rella, R.; Manera, M.G. Tunable Nanoplasmonic Transducers: Performance Analysis and Potential Application. Chemosensors 2023, 11, 109. https://doi.org/10.3390/chemosensors11020109
AMA Style
Colombelli A, Lospinoso D, Rella R, Manera MG. Tunable Nanoplasmonic Transducers: Performance Analysis and Potential Application. Chemosensors. 2023; 11(2):109. https://doi.org/10.3390/chemosensors11020109
Chicago/Turabian StyleColombelli, Adriano, Daniela Lospinoso, Roberto Rella, and Maria Grazia Manera. 2023. "Tunable Nanoplasmonic Transducers: Performance Analysis and Potential Application" Chemosensors 11, no. 2: 109. https://doi.org/10.3390/chemosensors11020109
Note that from the first issue of 2016, this journal uses article numbers instead of page numbers. See further details here.