Communication

The Detection of 27 Fentanyl Compounds in Solid and Liquid Drugs Based on Differential Raman Spectroscopy

1
Chinese Academy of Inspection and Quarantine, No. A3, Gaobeidian Road, Chaoyang District, Beijing 100123, China
2
MOE Joint International Research Laboratory of Animal Health and Food Safety, College of Veterinary Medicine, Nanjing Agricultural University, Nanjing 210095, China
3
Technical Center of Hohhot Customs District, Hohhot 010020, China
4
Hunan Drug Inspection Center, Changsha 410001, China
5
College of Traditional Chinese Medicine, Changchun University of Traditional Chinese Medicine, Changchun 130117, China
6
Changchun Customs Technology Center, Changchun 130062, China
7
Beijing Key Laboratory of Microstructure and Properties of Solids, Faculty of Materials and Manufacturing, Beijing University of Technology, Beijing 100124, China
*
Authors to whom correspondence should be addressed.
These authors are contributed equally to this work.
Chemosensors 2023, 11(11), 561; https://doi.org/10.3390/chemosensors11110561
Submission received: 23 August 2023 / Revised: 13 October 2023 / Accepted: 19 October 2023 / Published: 11 November 2023
(This article belongs to the Section (Bio)chemical Sensing)

Abstract

:
Fentanyl and its derivatives have been mainstays for the treatment of pain for many years. To accurately detect them in medical applications and customs, a rapid, sensitive, and selective method is urgently needed. In this study, we established a point-of-care-testing (POCT) differential Raman approach for the detection of fentanyl substances in liquid and solid conditions. The silver nanoparticle was prepared and characterized as SERS substrate, which can adsorb fentanyl-related molecules on the rough surface to enhance the Raman signal. Subsequently, 27 kinds of fentanyl-related substances were detected to determine that the POCT spectral resolution is better than 6 cm−1, Raman detection range is 100–3200 cm−1, and the detection limit of the fentanyl-related substances at 1002 cm−1 is 0.1–25 ppb. Furthermore, the Raman characteristic peaks of fentanyl were checked through comparison between theoretical calculations and experiments to obtain a database for rapid on-site inspection. Thus, the fast, accurate, stable POCT approach can be widely applied to monitor drugs and toxins due to its sensitivity, specificity, and abundance database.

1. Introduction

Fentanyl is a powerful opioid analgesic, which is clinically used to treat cancer pain and other chronic pain as well as surgical anesthesia [1]. However, excessive fentanyl may cause side effects such as drowsiness, confusion, and nausea, as well as even more serious side effects, including addiction, hypotension, and respiratory depression. Fentanyl is considered as approximately 100-fold more effective than morphine and 50-fold more effective than heroin [2]. Some derivatives of fentanyl, such as carbofentanil, are even stronger for the nervous system, with an effect 100 times higher than that of common fentanyl, 5000 times higher than that of heroin, and 10,000 times higher than that of morphine. Stunningly, only 0.02 g of the fentanyl drug is enough to kill an adult [3]. Due to its strong toxic effect, numerous cases of drug overdose deaths have occurred since 2000 [4]. There has also been the clandestine and illegal synthesis of fentanyl analogues, and new fentanyl analogues continue to emerge and pose a major threat to public health and safety. Therefore, accurate identification and quantitative analysis of fentanyl is of great significance to control medicine dose and combat illegal psychoactive substances.
For different fentanyl substances, the components and molecular structure in organisms vary greatly. Thus, it is a challenge to establish a reliable and stable analysis method to detect them accurately. The detection methods for fentanyl substances mainly include high-performance liquid chromatography (HPLC) [5], gas chromatography–mass spectrometry (GC-MS) [6,7,8], liquid chromatography–tandem mass spectrometry (LC-MS/MS) [9,10], and enzyme-linked immunosorbent assay (ELISA) [11,12]. However, these traditional methods require large instruments and a long time due to tedious preprocessing procedures. A point-of-care-testing (POCT) method is urgently needed for the effective rapid on-site detection of fentanyl substances. Raman spectroscopy is a molecular vibration spectroscopy that offers nondestructive testing and rapid and accurate identification. Researchers have used SERS technology to conduct a lot of studies on fentanyl’s detection method [13,14,15,16]. For example, Zhang et al. use a gold-trisoctahedra-coated capillary-based SERS platform for microsampling and sensitive detection of trace fentanyl; the limit of detection is as low as 1.86 and 40.63 ng/mL in aqueous solution and serum samples [13]. Su et al. practice a freestanding hydrophobic plasmonic paper biosensor to detection fentanyl in biofluids with label-free SERS [14]. Ding et al. realize rapid and direct detection of trace fentanyl in real human urine without pretreatment by a portable surface enhanced Raman spectroscopy (SERS) strategy on liquid/liquid interfacial plasmonic arrays, and consequently amplify the detection sensitivity [15,16]. Thus, more specific and more sensitive SERS-based fentanyl detection is in demand. However, in practical application, when the laser source irradiates the actual sample, there is often a certain fluorescence background in the excitation environment, which will cause a great interference on the extraction of an effective characteristic peak. Raman spectroscopy is often interfered with by the fluorescence background when applied, which leads to the decrease in the Raman signal. The Raman signal would be submerged in the fluorescence background in the worst situation. In order to solve the problem of the fluorescence background interference in the application of Raman detection, frequency shift-excited Raman differential spectroscopy (SERS-DS) can overcome the shortcomings of the fluorescence background of traditional Raman spectroscopy [17,18,19]. SERS-DS is applied in this work because it can effectively avoid the fluorescence background interference in SERS detection.
Here, we synthesized silver nanoparticles to apply in SERS differential spectroscopy, to achieve a rapid and POCT detection method for 25 fentanyl-related substances and 2 fentanyl precursors in juice. The sensitivity can reach 0.1 ppb with great specificity. Moreover, based on this method, a Raman spectrum library of fentanyl-related substances was established, including characterized peak, intensity, and the spectrum matrix, which offers a database for rapid detection of multiple substances in a one-step method. As a quick on-site monitoring method, the SERS differential spectroscopy method will greatly improve the efficiency of law enforcement and biomedical applications in dealing with fentanyl-like substances due to its rapid determination, preliminary screening, and clear classification.

2. Experiments and Materials

The synthesized method of silver nanoparticles is modified upon our previous work [20]. Silver nitrate (AgNO3, 0.1 mmol) was dissolved in deionized water (10 mL), stirred for 30 min at ambient temperature, and then dilute polyvinyl pyrrolidone (PVP) in sulfuric acid (20% H2SO4) was next added dropwise into the mixture until pH = 5. The obtained solution was magnetically stirred for 6 h, forming a transparent colorless solution for the next step. The silver nanoparticles were synthesized after 350 K heating for 60 min. The prepared silver nanoparticle was placed in a newly set water pan and washed before testing. A handheld cloud intelligent Raman quick detector (Model: Guoyan®H01, D01) was used: laser source was 785 nm, laser power was 300 mW, and integration time was 5 s. In desktop Raman tests, unless specifically stated, the excitation wavelength was 785 nm, laser power was 0.5 mW, and the specification of the objective was ×50 L. A series of standard solutions of fentanyl were used as the probe molecules. We used fentanyl standard compounds (Table 1) dissolved in methanol (chromatographic purity, Fisher Scientific, USA) and ultrapure water (prepared by Milli-Q Pure Water instrument, USA). Fentanyl liquid sample: A 1 mL sample solution was treated with 9 mL ultrapure water. The SERS sensitized substrate and the tested fentanyl were evenly mixed into the reagent bottle at a 1:1 volume ratio. The analysis equipment was a handheld Raman spectrometer with 785 nm laser. If the signal of target concentration in the sample solution was not obvious and too low, then the sample weighing volume could be appropriately increased two to ten times to confirm detection limit. Fentanyl solid samples: (1) The samples were thoroughly ground and mixed, then analyzed by handheld Raman spectroscopy direct reading. (2) The sample was fully ground and mixed, and about 0.1 g was weighed. Next, 10 mL methanol was added, sealed, and oscillated for 10 min. After centrifugation, 5 mL supernatant was taken and nitrogen blow-dried. Next, 1 mL (1:9) methanol: water was added, vortexed; 100 μL was the smallest volume unit. The SERS-sensitized base and fentanyl substance tested were selected at 1:1 volume ratio and were evenly mixed in the reagent bottle. Analysis was also made by handheld Raman spectroscopy.

3. Results and Discussion

3.1. Preparation and Characterization of SERS-Enhanced Substrates

Among various SERS-enhanced substrates, silver nanoparticles are easily synthesized and have extremely high sensitivity, approximately 10 [12] times higher than conventional Raman spectroscopy for molecules. The silver nanoparticle SERS substrate in this work has good enhancement effect and stability.Figure 1a shows that the Ag nanoparticles building blocks were uniformly dispersed with sizes of 40 nm. The applied silver particles as shown in Figure 1b have a uniform size, approximate spherical shape, and good dispersion after evaporation in high-density conditions. The surface charge is evaluated to be around −20 mV by zeta potential.

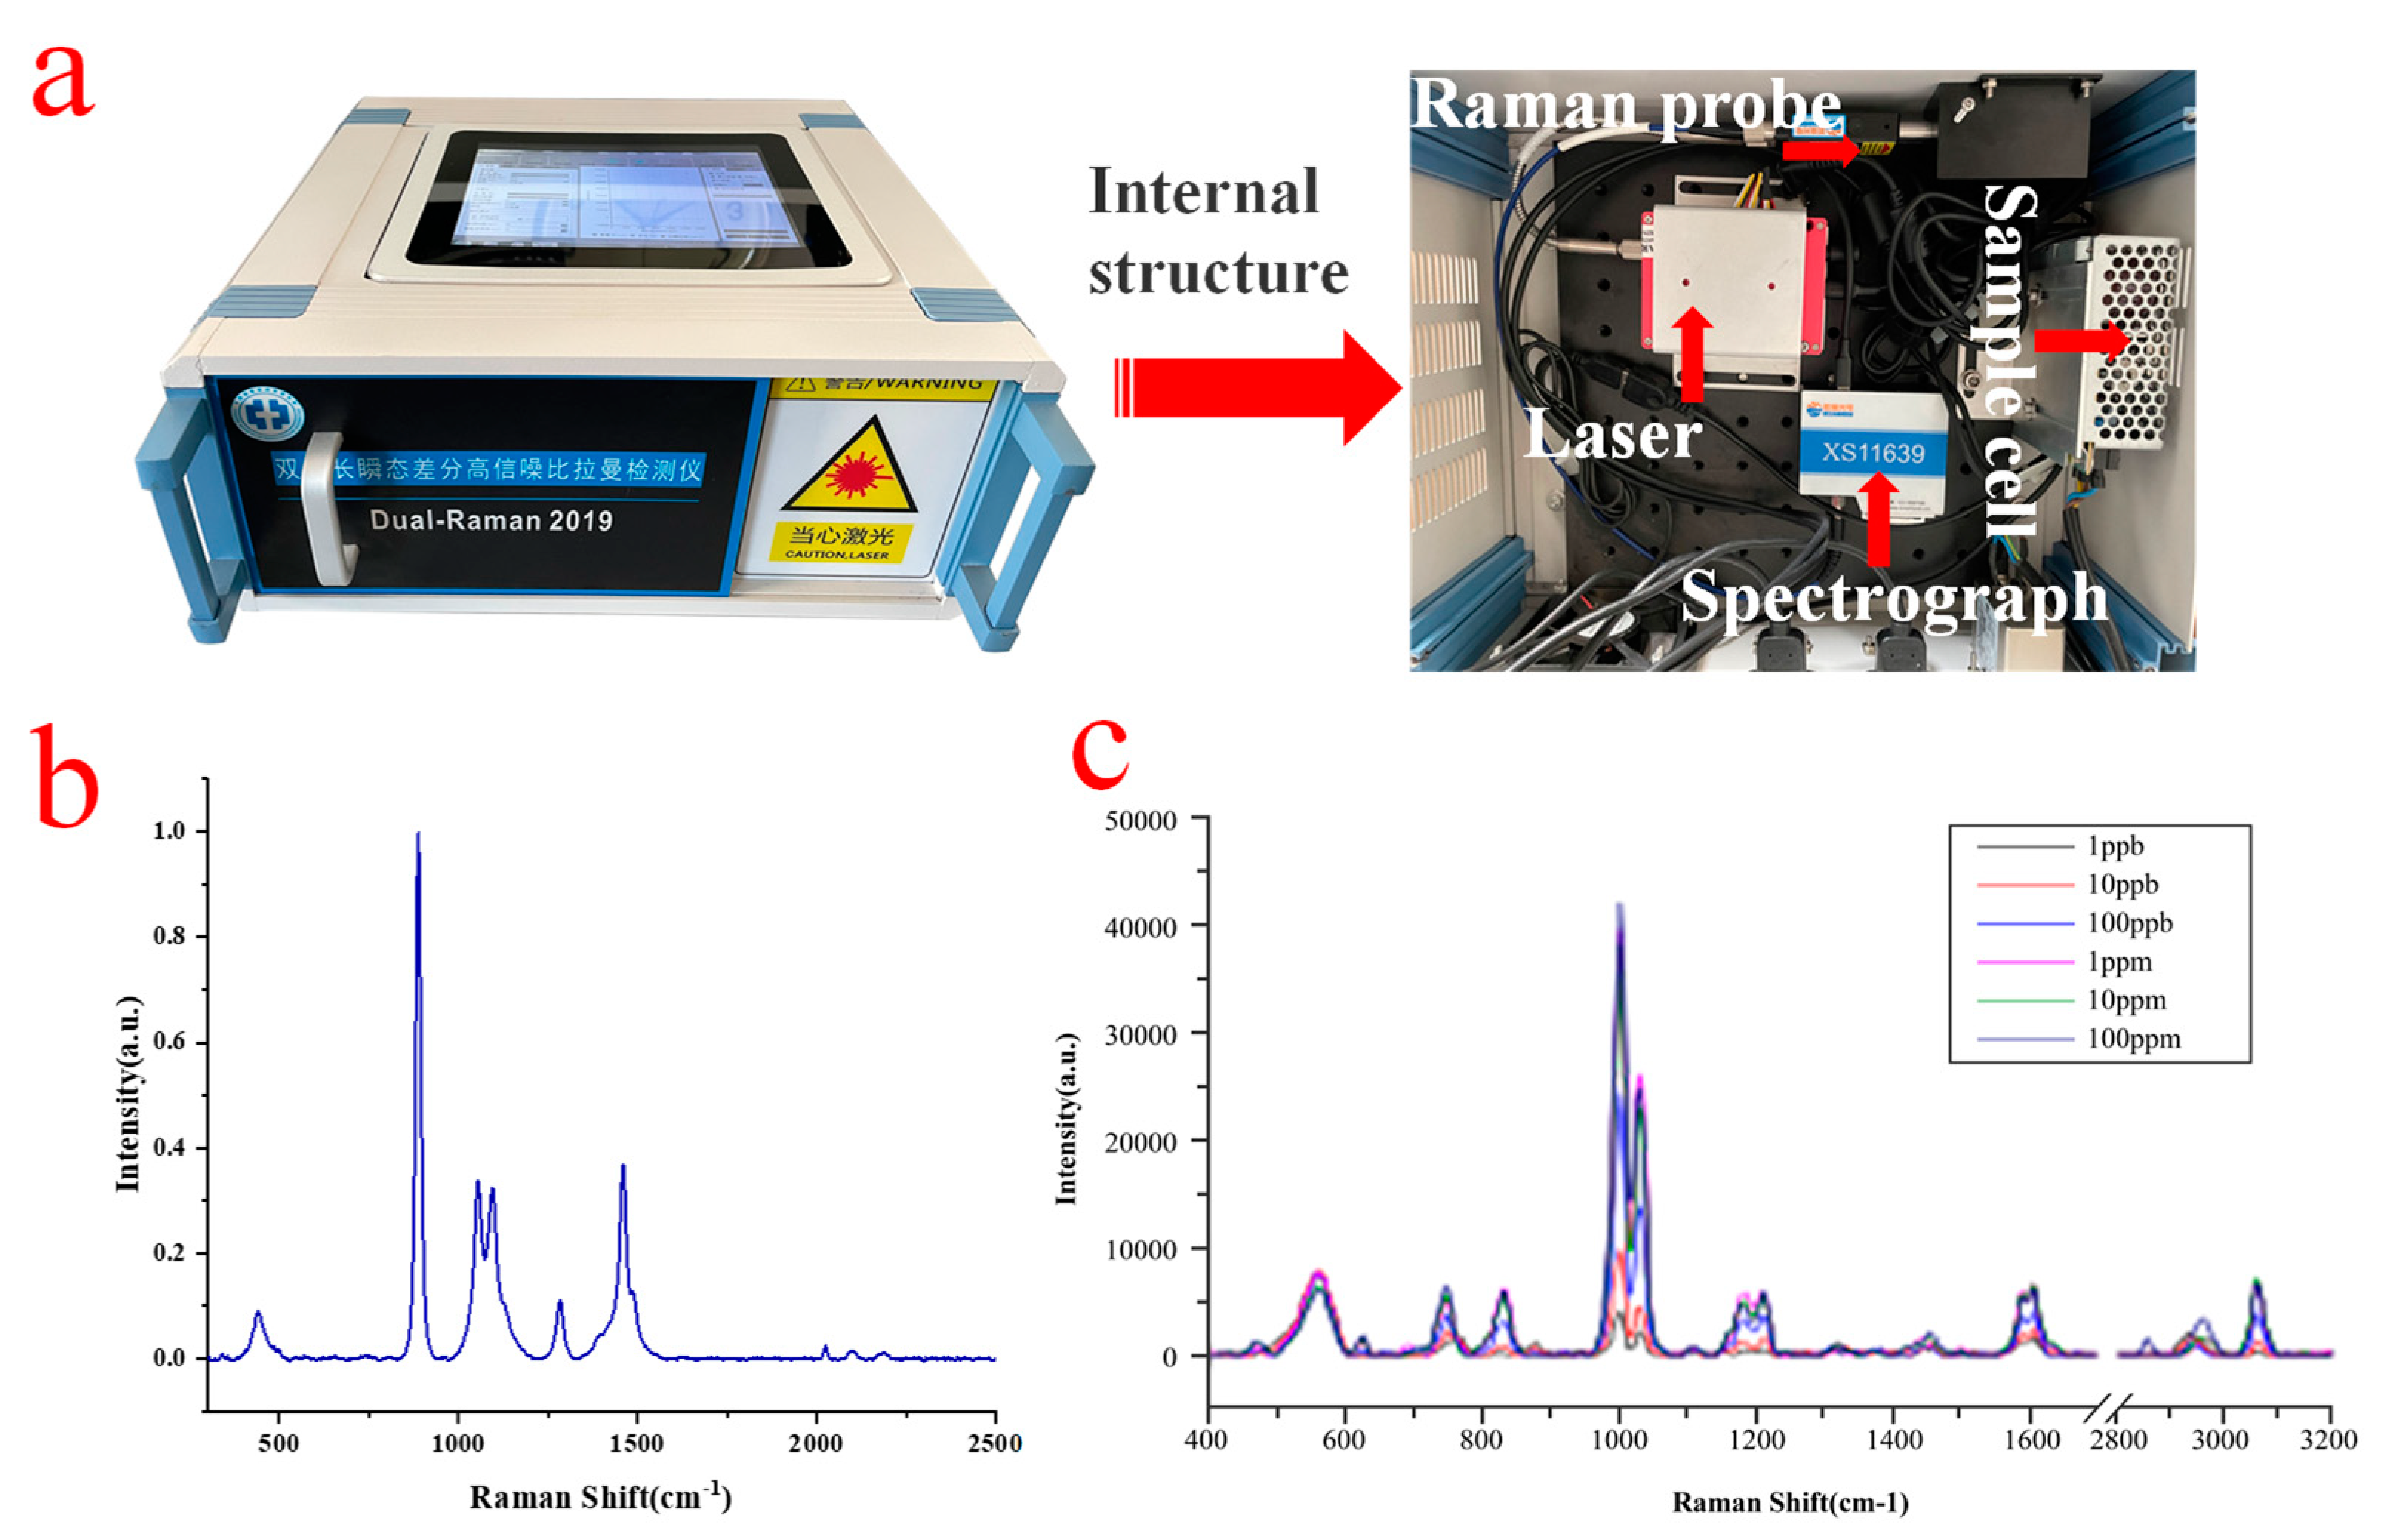
3.2. POCT Device and Optimization of Spectral Raman Detection Technique

The POCT device, consisting of a 785 nm dual-wavelength laser, fiber Raman optical module, silicon-based (Si) linear array CMOS detector, and indium gallium arsenic (InGaAs) surface array CCD detector, was established as shown in Figure 2a. Two steps were studied to obtain the stable and sensitive differential Raman signals: (1) establishment of a differential Raman system and (2) establishment of a dual-wavelength Raman detection module. For the set-up of device system, a 785 nm Raman system was established to detect the optical path. The Raman spectra of absolute ethanol is shown in Figure 2b. The Raman peaks of absolute ethanol are located at 424 cm−1, 876 cm−1, 1043 cm−1, 1087 cm−1, 1267 cm−1, 1446 cm−1, 2712 cm−1, 2872 cm−1, and 2920 cm−1. Furthermore, applying the dual-wavelength Raman system, a dual-wavelength transient differential Raman detection module with high signal-to-noise ratio was designed to eliminate the fluorescence background in the Raman signal. Our differential Raman was utilized to evaluate the sensitivity (Figure 2c). A standard fentanyl aqueous solution with a mass concentration of 1 ppm was prepared first and then diluted with deionized water to 1 ppb, 10 ppb, and 100 ppb concentration gradient solutions; the results show the detection limit can reach 1 ppb. The sensitivity of the dual-wavelength Raman detection module in this study is excellent, and the detection module realizes the Raman spectrum measurement of high-fluorescence background samples.

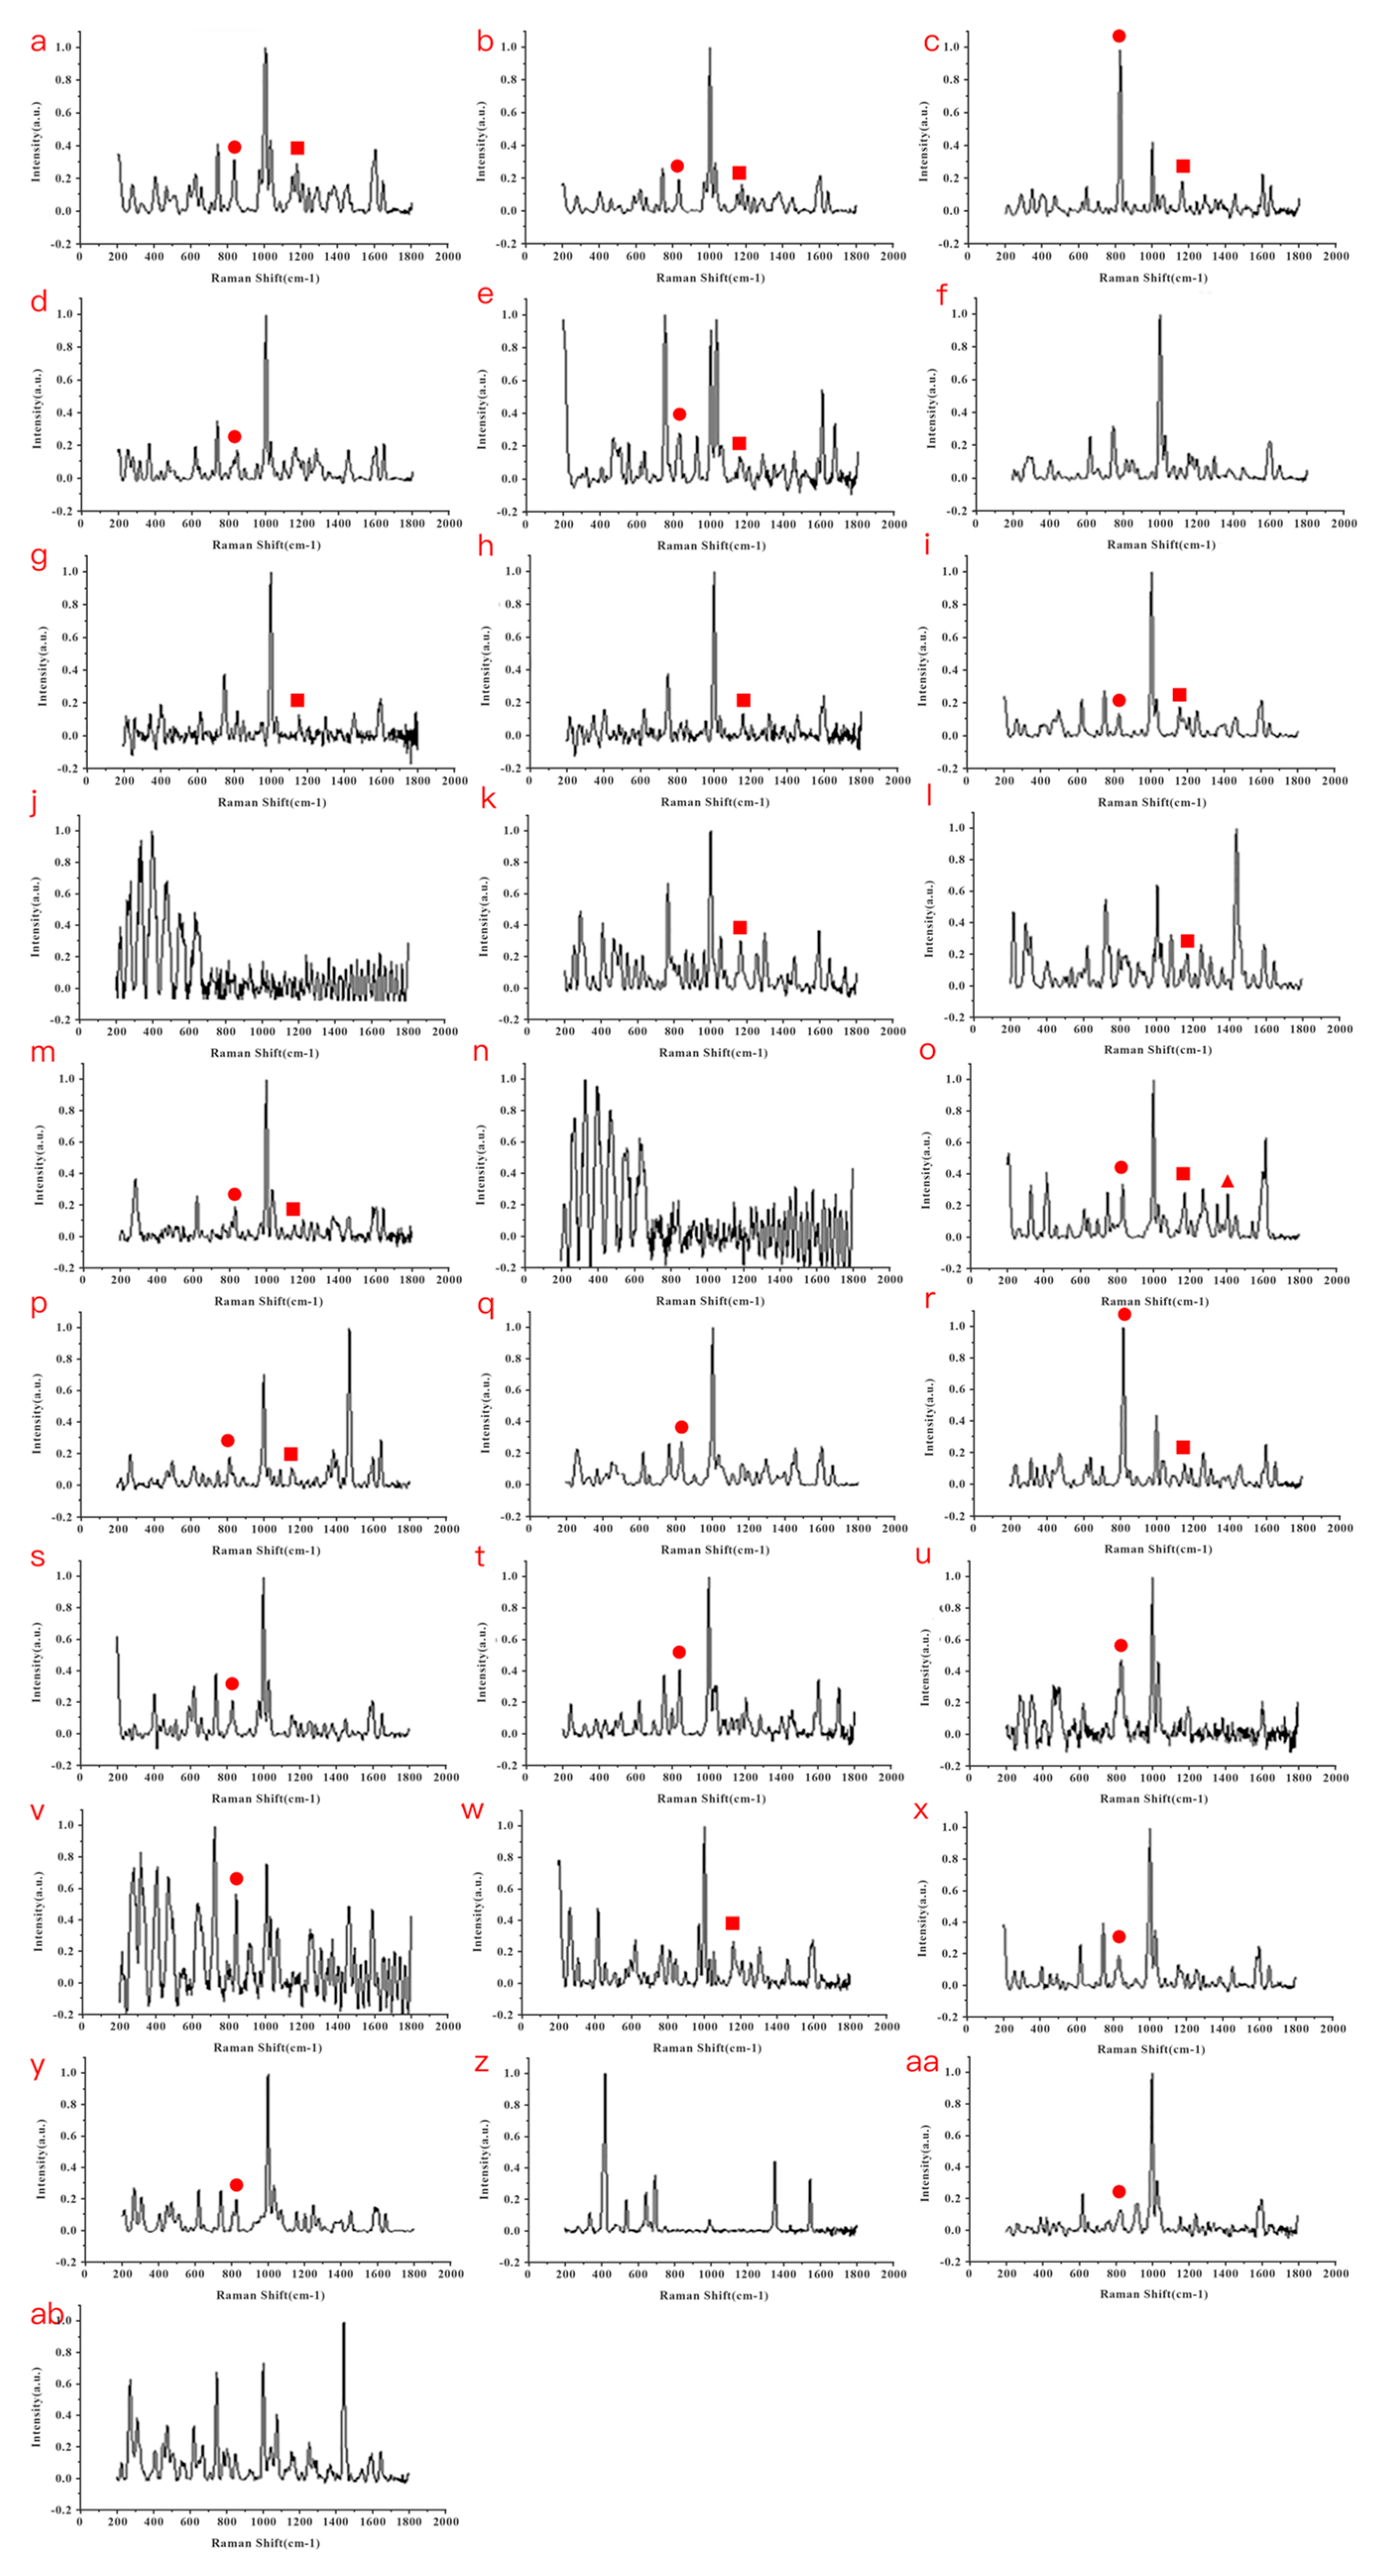
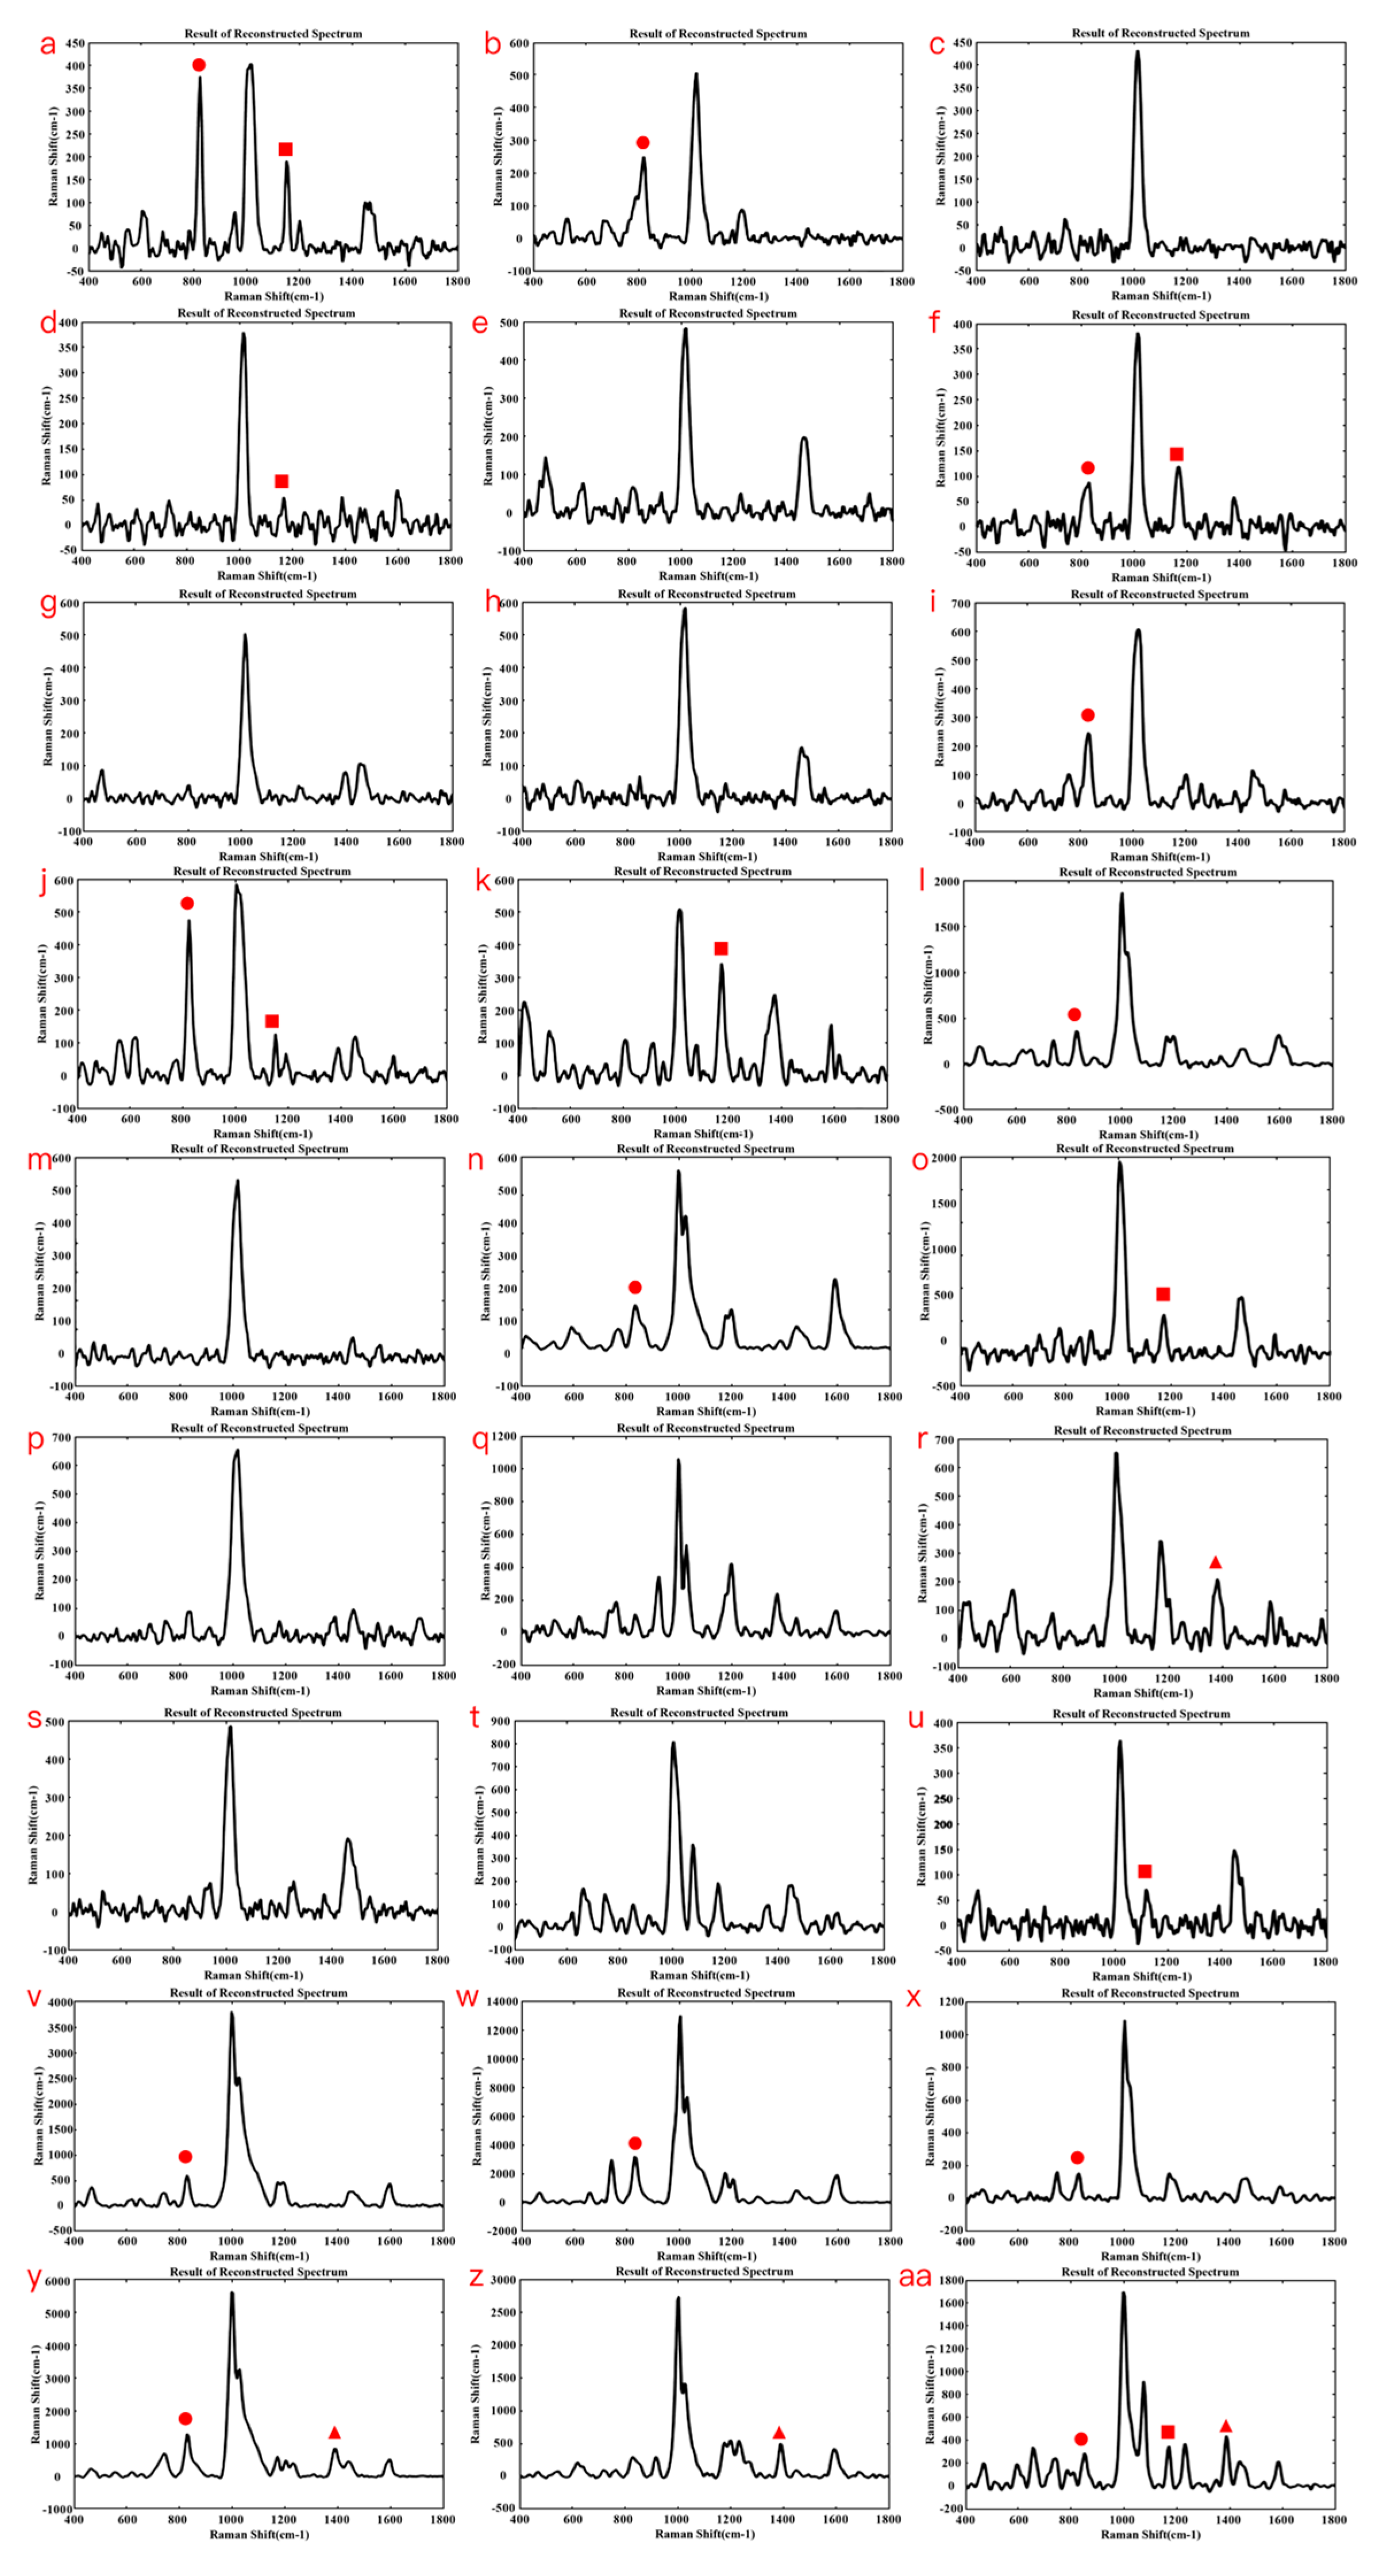
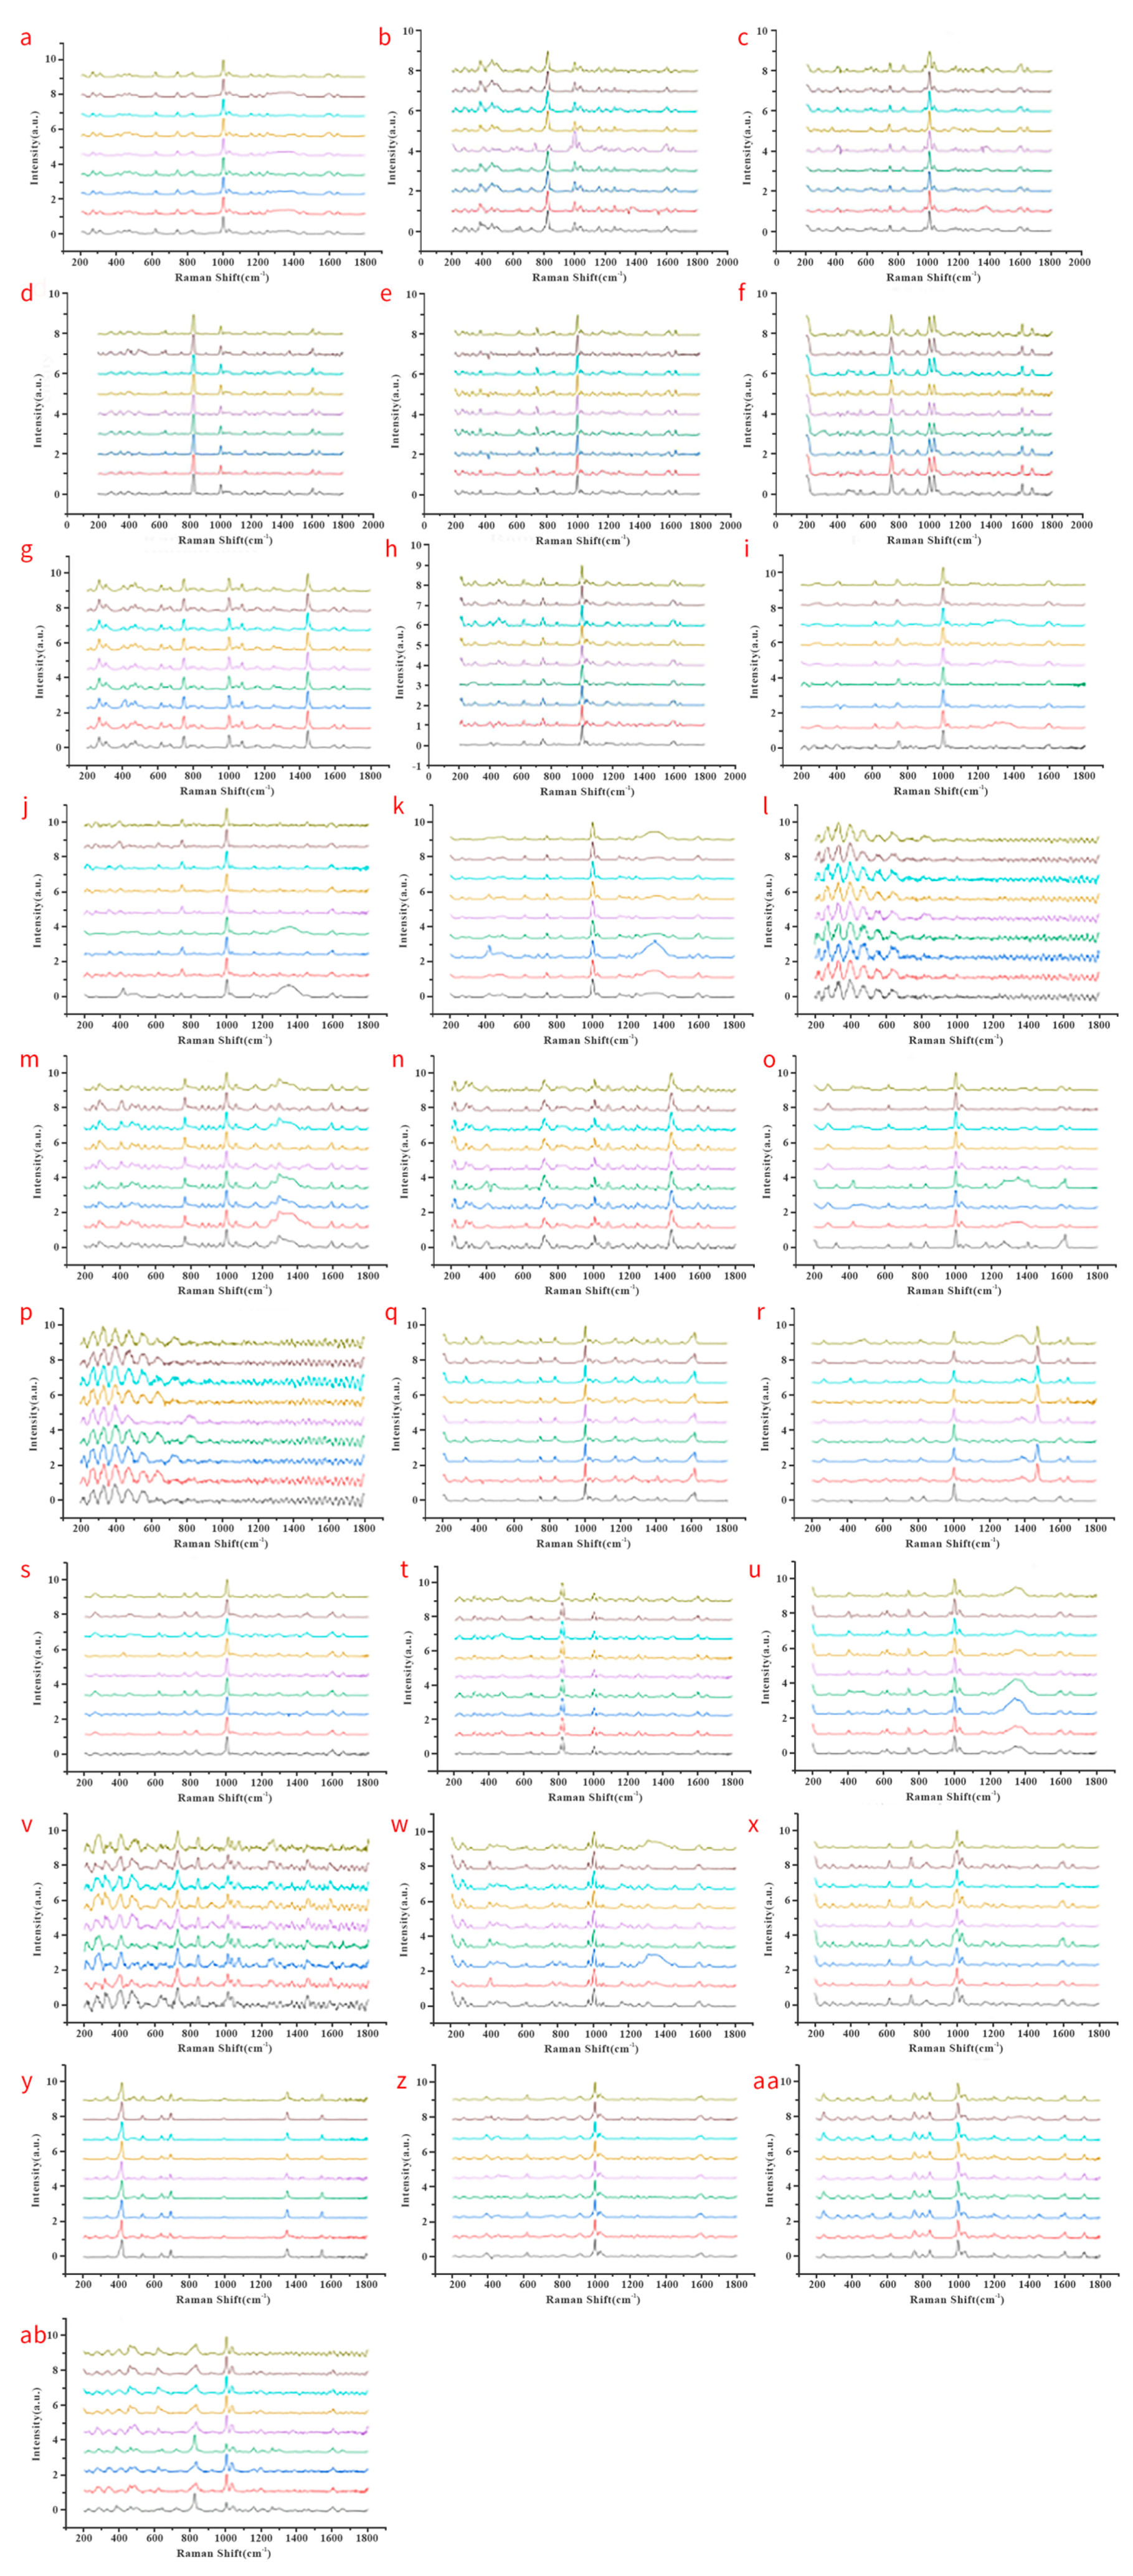
3.3. Establishment of a Fentanyl POCT Detecting Method

The list of fentanyl-like substances in the Ministry of Public Security shows 27 species including liquid samples of two precursors. Surface Raman enhancement technology was used to detect the detection limit of fentanyl standard. The limit of detection of 25 kinds of fentanyl and two precursor substances detected here is 0.1–25 ppb (Table 1), thus indicating that this method offers simple pretreatment, low matrix effects, high sensitivity and selectivity, and suitability for analysis of actual samples. Moreover, the characteristic peaks of the fentanyl sample in Raman spectra are unique due to the different components of the molecule’s vibrations. Therefore, molecular structure information can be obtained by analyzing the Raman peaks in the Raman spectrum [21,22]. Fentanyl-type substances generally refer to the compounds formed by taking fentanyl (N-[1-(2-phenylethyl)-4-piperidyl]-N-phenylpropionamide) as the parent substance and then replacing or adding other modifications on one or more positions of its phenylethyl, piperidyl ring, phenyl, and propionyl groups directly connected to the nitrogen atom [23,24]. The detailed variation can be realized by precise SERS detection with principal component analysis and maximum expectation algorithms (Figure 3). For instance, Figure 3k indicates a 1020 cm−1 vibration with the benzene-like functional group, and another 27 types of fentanyl compounds are also detected with this peak, which is consistent with the ppb level in serial samples in Table 1. Moreover, we marked other characterized peaks with red circle, cubic and triangle labels, which represent 816, 1160, and 1400 cm−1, respectively. Compared with various structural fentanyls, similar terminal groups can obtain similar signals, such as in Figure 3a (4-fluorobutanyl), Figure 3c (Tetrafluorobutyl-), and Figure 3r (4-Fluoroisobutyryl-), which all have the F terminal group, which induces a C-F stretching peak in 816 cm−1 (marked with circle). The C-O (1160) and C-H (1400) groups are also verified. However, in Figure 4, the SERS substrate has an adsorption site, which can influence the enhanced characterized peak. Hence, based on Figure 3 and Figure 5, we can establish a Raman database for quick fentanyl-related substance identification.

3.4. Screening Application of Fentanyl-like Substances by POCT Raman Spectroscopy

Raman spectroscopy screening was performed on 27 fentanyl substances, including desktop Raman and POCT Raman. Notably, fentanyl new essence active substances mainly modify the propionyl chain and the phenylethyl part of fentanyl to achieve similar or even stronger drug effects [25]. A stable and reliable Raman spectrum database has been established for 27 kinds of fentanyl substances in China, and blind sample field tests have been conducted with this database (Figure 4). The desktop Raman results show that the 27 kinds of fentanyl-class materials have qualitative results with high accuracy. Moreover, the sample testing time cost can be restricted within one minute. Furthermore, Fentanyl standards were also detected by POCT dual-wavelength differential Raman equipment, and then the Raman spectra of the two groups could be compared (Figure 3 and Figure 5). The spectra in these two figures are similar, and a certain small amount of Raman signal cannot be observed on the conventional Raman spectra of fentanyl standard stock due to molecular charge transfer. Compared with spectra in this work, the spectra in the POCT device have mean peak similarity with rare other information, which is due to the sensitivity of the POCT device. In the comparison between Figure 4 and Figure 5, the liquid surroundings should provide a suitable environment for analyte adsorption, which has better Raman signal, comparable to the pure samples. Additionally, the stability of POCT detecting fentanyl substances has been also discussed. To determine the reliability of the method, solid samples were tested nine times in the same experimental conditions (Figure 6). The test protocol was repeated three times a day after three consecutive days, and each fentanyl substance was summarized over nine maps (from bottom to top—the first to ninth detection spectra). The results show the detection stability of the Raman spectroscopy detection method. The matching degree between the detection results of each fentanyl-type substance and the automatic identification of the database was more than 90%. The results show that the SERSDS technique has good stability in the detection of fentanyl substances.
A stable and reliable Raman spectrum database has been established for 27 kinds of fentanyl substances, and blind sample tests have been conducted with this database to further amplify the database. When comparing with conventional Raman spectroscopy, the POCT dual-wavelength differential Raman spectrogram can identify the strong resonance characteristic peaks at 1002 cm−1 and 1029 cm−1, thus detecting the targeted molecules more sensitively. The characteristic peak amplification is the significant advantage of this approach. However, it is still necessary to improve the certainty of molecules’ adsorption configuration. For example, in the 27 types of fentanyl-like substances, several spectra (Figure 3j,n,z and Figure 4g,y,z) exhibit weaker intensities in characteristic peaks, which might be contributed by the adsorption sites through the thio-functional group on the substrate surface. These metal–sulfur bonds bind the molecule adsorption configuration differently in solid conditions, which greatly decreases the benzene vibrational states.

4. Conclusions

Differential Raman spectroscopy is a simple, accurate, and nondestructive method for fentanyl-like substance detection that can effectively overcome strong fluorescence interference induced by Raman lasers. Combined with SERS-assisted substrate, a POCT, rapid, and sensitive Raman spectral detection method was created and used for 25 fentanyl-like substances and 2 fentanyl precursors’ detection in this work. The detection results offer high sensitivity and good selectivity. Significantly, the POCT results are better than those on conventional desktop Raman in practical screening; these results are consistent with our previous research [26]. Moreover, a fentanyl-like substance library database can be established, and these unique algorithms would deal with complex matrix interference. It can potentially realize one-step rapid detection with uploading in real time and data transformation in cloud-based big data, which offer multi-dimensional statistics to achieve risk analysis and early warning in biomedical overdose and psychoactive substance security control.

Author Contributions

Conceptualization, Y.W. and W.S.; methodology, Y.W.; validation, X.L., J.G. and C.W.; formal analysis, Y.W. and W.S.; investigation, Y.W.; data curation, Y.W.; writing—original draft preparation, Y.W.; writing—review and editing, W.S. and C.W.; visualization, X.L.; supervision, X.Z., M.Z. and C.W.; project administration, X.Q. and M.Z.; funding acquisition, X.Q., M.Z. and C.W. All authors have read and agreed to the published version of the manuscript.

Funding

This work was financially supported by Basic research expenses of Chinese Academy of Inspection and Quarantine (No. 2022JK47), Key research and development project of Hainan Province (No. ZSQ2021SHFZ0069), Research Project of the General Administration of Customs (No. 2019HK004, No. 2020HK182), National Natural Science Fund Grant (No. 12104023, No. 81503544), Jilin Province Natural Science Foundation of Science and Technology (No. 20180101108JC), High-level Talents Fund Project of Changchun University of Traditional Chinese Medicine (No. 2018KJ23), Key Research and Development Project of Jilin Province (No. 20200403102SF), National Administration of Traditional Chinese Medicine Youth Qihuang Scholars Support Project (No. GZYYRJF [2020] No. 7). Also, the work was greatly supported by NMPA Key Laboratory for POCT Technology Transforming and Quality Control.

Institutional Review Board Statement

Not applicable.

Informed Consent Statement

Not applicable.

Data Availability Statement

The complete data of this study can be obtained upon request from the corresponding author.

Conflicts of Interest

The authors declare that there are no conflict of interest.

References

  1. Peterson, A.B.; Gladden, R.M.; Delcher, C.; Spies, E.; Garcia-Williams, A.; Wang, Y.; Halpin, J.; Zibbell, J.; McCarty, C.L.; DeFiore-Hyrmer, J. Increases in fentanyl-related overdose deaths—Florida and Ohio, 2013–2015. Morb. Mortal. Wkly. Rep. 2016, 65, 844–849. [Google Scholar] [CrossRef]
  2. Centers for Disease Control and Prevention. Increases in Fentanyl Drug Confiscations and Fentanyl-Related Overdose Fatalities. 26 October 2015. Available online: https://app.overton.io/document.php?policy_document_id=cdc-5fb7370ab681a48a2a4b85bd69b9f3a4&funder_highlight=U.S.%20Department%20of%20Health%20and%20Human%20Services (accessed on 1 January 2022).
  3. Salani, D.; Mckay, M.; Zdanowicz, M. The deadly trio: Heroin, FentaNYL, and carfentanil. J. Emerg. Nurs. 2020, 46, 26–33. [Google Scholar] [CrossRef] [PubMed]
  4. Spencer, M.R.; Warner, M.; Bastian, B.A.; Trinidad, J.P.; Hedegaard, H. Drug overdose deaths involving fentanyl, 2011–2016. Natl. Vital Stat. Rep. Cent. Dis. Control Prev. Natl. Cent. Health Stat. Natl. Vital Stat. Syst. 2019, 68, 1–19. [Google Scholar]
  5. Ebrahimzadeh, H.; Yamini, Y.; Gholizade, A.; Sedighi, A.; Kasraee, S. Determination of fentanyl in biological and water samples using single-drop liquid–liquid–liquid microextraction coupled with high-performance liquid chromatography. Anal. Chim. Acta 2008, 626, 193–199. [Google Scholar] [CrossRef] [PubMed]
  6. Wei, Q.; Su, F.H. Determination of Nine Fentanyl Drugs in Hair Samples by GC-MS/MS and LC-MS/MS. ACS Omega 2022, 7, 19176–19182. [Google Scholar] [CrossRef]
  7. Mochizuki, A.; Nakazawa, H.; Adachi, N.; Takekawa, K.; Shojo, H. Identification and quantification of mepirapim and acetyl fentanyl in authentic human whole blood and urine samples by GC–MS/MS and LC–MS/MS. Forensic Toxicol. 2018, 36, 81–87. [Google Scholar] [CrossRef]
  8. Gilbert, N.; Antonides, L.H.; Schofield, C.J.; Costello, A.; Kilkelly, B.; Cain, A.R.; Dalziel, P.R.; Horner, K.; Mewis, R.E.; Sutcliffe, O.B. Hitting the Jackpot–development of gas chromatography–mass spectrometry (GC–MS) and other rapid screening methods for the analysis of 18 fentanyl-derived synthetic opioids. Drug Test. Anal. 2020, 12, 798–811. [Google Scholar] [CrossRef]
  9. Strayer, K.E.; Antonides, H.M.; Juhascik, M.P.; Daniulaityte, R.; Sizemore, I.E. LC-MS/MS-based method for the multiplex detection of 24 fentanyl analogues and metabolites in whole blood at sub ng mL−1 concentrations. ACS Omega 2018, 3, 514–523. [Google Scholar] [CrossRef]
  10. Swaminathan, S.K.; Fisher, J.; Kandimalla, K.K. Sensitive determination of fentanyl in low-volume serum samples by LC-MS/MS. AAPS PharmSciTech 2018, 19, 2812–2817. [Google Scholar] [CrossRef]
  11. Guerrieri, D.; Kjellqvist, F.; Kronstrand, R.; Gréen, H. Validation and cross-reactivity data for fentanyl analogs with the immunalysis fentanyl ELISA. J. Anal. Toxicol. 2019, 43, 18–24. [Google Scholar] [CrossRef]
  12. Abbott, D.L.; Limoges, J.F.; Virkler, K.J.; Tracy, S.J.; Sarris, G.G. ELISA screens for fentanyl in urine are susceptible to false-positives in high concentration methamphetamine samples. J. Anal. Toxicol. 2022, 46, 457–459. [Google Scholar] [CrossRef] [PubMed]
  13. Zhang, M.; Pan, J.; Xu, X.; Fu, G.; Zhang, L.; Sun, P.; Yan, X.; Liu, F.; Wang, C.; Liu, X. Gold-trisoctahedra-coated capillary-based SERS platform for microsampling and sensitive detection of trace fentanyl. Anal. Chem. 2022, 94, 4850–4858. [Google Scholar] [CrossRef] [PubMed]
  14. Su, X.; Liu, X.; Xie, Y.; Chen, M.; Zhong, H.; Li, M. Quantitative Label-Free SERS Detection of Trace Fentanyl in Biofluids with a Freestanding Hydrophobic Plasmonic Paper Biosensor. Anal. Chem. 2023, 95, 3821–3829. [Google Scholar] [CrossRef]
  15. Ding, Z.; Wang, C.; Song, X.; Li, N.; Zheng, X.; Wang, C.; Su, M.; Liu, H. Strong π-Metal Interaction Enables Liquid Interfacial Nanoarray–Molecule Co-assembly for Raman Sensing of Ultratrace Fentanyl Doped in Heroin, Ketamine, Morphine, and Real Urine. ACS Appl. Mater. Interfaces 2023, 15, 12570–12579. [Google Scholar] [CrossRef] [PubMed]
  16. Feng, R.; Miao, Q.; Zhang, X.; Cui, P.; Wang, C.; Feng, Y.; Gan, L.; Fu, J.; Wang, S.; Dai, Z.; et al. Single-atom sites on perovskite chips for record-high sensitivity and quantification in SERS. Sci. China Mater. 2022, 65, 1601–1614. [Google Scholar] [CrossRef]
  17. Zhao, Y.; Li, X.; Cui, F.; Liu, J.; Li, X. Development and Application of Fluorescence Suppression Based on Multi Wavelength Raman Spectrometer. Spectrosc. Spectr. Anal. 2022, 42, 86–92. [Google Scholar]
  18. Mažeikienė, R.; Niaura, G.; Malinauskas, A. Study of deprotonation processes of polyaniline by differential multiwavelength Raman spectroscopy in an electrochemical system. Chemija 2019, 30, 4. [Google Scholar] [CrossRef]
  19. Oztekin, E.K.; Burton, D.J.; Hahn, D.W. Detection of explosives using differential laser-induced perturbation spectroscopy with a Raman-based probe. Appl. Spectrosc. 2016, 70, 676–687. [Google Scholar] [CrossRef]
  20. Wang, Y.; Zou, M.; Chen, Y.; Tang, F.; Dai, J.; Jin, Y.; Wang, C.; Xue, F. Ultrasensitive and selective detection of sulfamethazine in milk via a Janus-labeled Au nanoparticle-based surface-enhanced Raman scattering-immunochromatographic assay. Talanta 2023, 267, 125208. [Google Scholar]
  21. Yu, B.; Ge, M.; Li, P.; Xie, Q.; Yang, L. Development of surface-enhanced Raman spectroscopy application for determination of illicit drugs: Towards a practical sensor. Talanta 2019, 191, 1–10. [Google Scholar] [CrossRef]
  22. Inscore, F.; Shende, C.; Sengupta, A.; Huang, H.; Farquharson, S. Detection of drugs of abuse in saliva by surface-enhanced Raman spectroscopy (SERS). Appl. Spectrosc. 2011, 65, 1004–1008. [Google Scholar] [CrossRef] [PubMed]
  23. Stanley, T.H. The fentanyl story. J. Pain 2014, 15, 1215–1226. [Google Scholar] [CrossRef]
  24. Mirsafavi, R.; Moskovits, M.; Meinhart, C. Detection and classification of fentanyl and its precursors by surface-enhanced Raman spectroscopy. Analyst 2020, 145, 3440–3446. [Google Scholar] [CrossRef]
  25. Melent’ev, A.; Kataev, S. Metabolism of designer drugs. The fentanyl derivatives. Sudebno-Meditsinskaia Ekspertiza 2015, 58, 39–46. [Google Scholar] [CrossRef] [PubMed]
  26. Ye, J.; Wang, S.; Zhang, Y.; Li, B.; Lu, M.; Qi, X.; Wei, H.; Li, Y.; Zou, M. Surface-enhanced shifted excitation Raman difference spectroscopy for trace detection of fentanyl in beverages. Appl. Opt. 2021, 60, 2354–2361. [Google Scholar] [CrossRef] [PubMed]
Figure 1. (a) The dispersive and (b) aggregated SERS substrate’s structural characterization. The SERS reagents are silver nanoparticles.
Chemosensors 11 00561 g001
Figure 2. (a) The POCT device; (b) Raman spectroscopy of anhydrous ethanol; (c) 1 ppb–100 ppm concentration standard fentanyl samples are detected. The sensitivity of differential Raman can reach 1 ppb.
Chemosensors 11 00561 g002
Figure 3. Fentanyl solid standard spectrogram library of pure samples. (a) p-fluorofentanyl; (b) Acetyl fentanyl; (c) Tetrafluorobutylfentanyl; (d) Isobutylfentanyl; (e) Ocfentanil; (f) β-hydroxyfentanyl; (g) Beta-hydroxy-3-methyl fentanyl; (h) Cis-3-methylfentanyl; (i) Anti-3-methylfentanyl fentanyl; (j) 3-methylthiofentanyl; (k) Rosufentanil; (l) sufentanil; (m) Butylfentanyl; (n) Betahydroxythiofentanyl; (o) Acrylyl fentanyl; (p) Furan fentanyl; (q) Valanyl fentanyl; (r) 4-fluoroisobutylfentanyl; (s) Acetylafmethylene fentanyl; (t) N-phenylethyl-4-piperidone; (u) 4-aniline-N-phenylethylpiperidine; (v) alfentanil; (w) Carfentanil; (x) Afmethylene fentanyl; (y) fentanyl; (z) Alphamethylthiofentanyl; (aa) tetrahydrofuran fentanyl; (ab) Thiofentanil.
Chemosensors 11 00561 g003
Figure 4. SERS-enhanced spectrum of 1 ppm fentanyl compounds. (a) 4-flubuylfentanyl; (b) 4-fluoroisobutylfentanyl; (c) Butylfentanyl; (d) Isobutylfentanyl hydrochloride; (e) Furan fentanyl hydrochloride; (f) Pentanyl fentanyl hydrochloride; (g) Beta-hydroxy thiofentanyl; (h) Cis-3-methylfentanyl hydrochloride; (i) Ocfentanil; (j) p-fluorofentanyl; (k) Sufentanil citrate; (l) Acetyl fentanyl; (m) Beta-hydroxy-3-methyl fentanyl; (n) 4-aniline-N-phenylethylpiperidine; (o) Remifentanil hydrochloride; (p) Alpha-methyl fentanyl hydrochloride; (q) N-phenylethyl-4-piperidone; (r) Carfentanil; (s) Beta-hydroxyfentanyl; (t) 3-methylthiofentanyl; (u) alfentanil; (v) fentanyl; (w) Acetylafmethylene fentanyl; (x) Acrylyl fentanyl hydrochloride; (y) Thiofentanil hydrochloride; (z) Alphamethylthiofentanyl; (aa)T etrahydrofuran fentanyl.
Chemosensors 11 00561 g004
Figure 5. Standard spectrum of fentanyl in liquid solution. (a) 4-flubuylfentanyl; (b) 4-fluoroisobutylfentanyl; (c) Butylfentanyl; (d) Isobutylfentanyl hydrochloride; (e) Furan fentanyl hydrochloride; (f) Pentanyl fentanyl hydrochloride; (g) Beta-hydroxy thiofentanyl; (h) Cis-3-methylfentanyl hydrochloride; (i) Ocfentanil; (j) p-fluorofentanyl; (k) Sufentanil citrate; (l) Acetyl fentanyl; (m) Beta-hydroxy-3-methyl fentanyl; (n) 4- aniline -N- phenylethylpiperidine; (o) Remifentanil hydrochloride; (p) Alpha-methyl fentanyl hydrochloride; (q) N-phenylethyl-4-piperidone; (r) Carfentanil; (s) Beta-hydroxyfentanyl; (t) 3-methylthiofentanyl; (u) alfentanil; (v) fentanyl; (w) Acetylafmethylene fentanyl; (x) Acrylyl fentanyl hydrochloride; (y) Thiofentanil hydrochloride; (z) Alphamethylthiofentanyl; (aa) Tetrahydrofuran fentanyl.
Chemosensors 11 00561 g005
Figure 6. Stability results of fentanyl monohydrate via POCT-Raman. (a) Fentanyl hydrochloride; (b) p-fluorofentanyl; (c) Acetyl fentanyl hydrochloride; (d) 4-fluoro-butanylfentanyl; (e) isobutanylfentanyl hydrochloride; (f) Ocfentanil; (g) thiofentanyl hydrochloride; (h) β-hydroxythiofentanyl; (i) β-hydroxy-3-methylfentanyl; (j) cis-3-methylfentanyl Hydrochloride; (k) Anti-3-methylfentanyl hydrochloride; (l) 3-methylthiofentanyl Hydrochloride; (m) remifentanil hydrochloride; (n) sufentanil; (o) Butylfentanyl hydrochloride; (p) β-hydroxythiofentanyl; (q) Acrylyl fentanyl; (r) Furan fentanyl; (s) V alanyl fentanyl; (t) 4-fluoro-isobutanylfentanyl; (u) Acetylafmethylene fentanyl hydrochloride; (v) Afentanil hydrochloride; (w) Carfentanil hydrochloride; (x) Afmethylene fentanyl hydrochloride; (y) Afmethylene thiofentanyl hydrochloride; (z) Tetrahydrofuran fentanyl hydrochloride; (aa) N-phenylethyl-4-piperidone; (ab) 4-aniline-n-phenylethylpiperidine dihydrochloride.
Chemosensors 11 00561 g006
Table 1. Results of 27 types of fentanyl controlled by the state.
Serial NumberSampleTypeSubstrateCAS NumberDetection Limit (ppb)
14-fluorobutanyl fentanylStandardmethanol244195-31-110
24-fluoroisobutyrl fentanylStandardmethanol244195-32-210
3Butyryl fentanylStandardmethanol1169-70-610
4Isobutylfentanyl hydrochloridehydrochloridemethanol117332-90-8710
5Furanfentanyl hydrochloridehydrochloridemethanol101365-56-40.1
6Pentanyl fentanyl hydrochloridehydrochloridemethanol117332-91-925
7β-hydroxythiofentanylStandardmethanolNA10
8Cis-3-methylfentanyl hydrochloridehydrochloridemethanol78995-18-310
9OcfentanilStandardmethanol10343-69-510
10To the flufentanilStandardmethanol90736-23-510
11Sufentanil citrateStandardmethanol60561-17-310
12Acetyl fentanylStandardmethanol3258-84-210
13β-hydroxy-3-methylfentanylStandardmethanol78995-14-910
144-anilinegroup-N-phenylethyl piperidinePrecursormethanol21409-26-710
15Remifentanil hydrochloridehydrochloridemethanol132539-07-210
16Alpha-methylfentanyl hydrochloridehydrochloridemethanol1443-44-310
17N-phenylethyl-4-piperidonePrecursoracetonitrile39742-60-410
18CarfentanilStandardmethanol59708-52-010
19Beta-hydroxyfentanylStandardmethanol1473-95-610
203-methylthiofentanylStandardmethanol86052-04-210
21alfentanilStandardmethanol69049-06-51
22fentanylStandardmethanol437-38-710
23Acetyl alfa methyl fentanylStandardmethanol101860-00-810
24Allanyl fentanyl hydrochlorideStandardmethanol79279-03-110
25Thiofentanyl hydrochlorideStandardmethanol79278-88-910
26Alfa methyl thiofentanylStandardmethanol117332-94-2100
27Tetrahydrofuran fentanylStandardmethanolNA100
Disclaimer/Publisher’s Note: The statements, opinions and data contained in all publications are solely those of the individual author(s) and contributor(s) and not of MDPI and/or the editor(s). MDPI and/or the editor(s) disclaim responsibility for any injury to people or property resulting from any ideas, methods, instructions or products referred to in the content.

