Article

Real-Time Detection of the Bacterial Biofilm Formation Stages Using QCM-Based Sensors

1
IS2—Intelligent Systems and Integrated Systems Group, Department of Electronic Engineering, Universitat Politècnica de Catalunya, 08034 Barcelona, Spain
2
Department of Electronics, Escola Universitària Salesiana de Sarrià (EUSS), 08017 Barcelona, Spain
3
ISGlobal, Hospital Clínic-Universitat de Barcelona, 08036 Barcelona, Spain
4
CIBER Enfermedades Infecciosas (CIBERINFEC), Instituto de Salud Carlos III, 28029 Madrid, Spain
*
Author to whom correspondence should be addressed.
Chemosensors 2023, 11(1), 68; https://doi.org/10.3390/chemosensors11010068
Submission received: 29 November 2022 / Revised: 9 January 2023 / Accepted: 12 January 2023 / Published: 14 January 2023

Abstract

:
Bacterial biofilms are a major cause of harm related to medical infections and biofouling. Thus, 80% of total infections are caused by biofilm-forming microorganisms. Consequently, knowledge of biofilm formation stages is crucial to develop effective treatments to prevent their formation in medical implants, tools, and devices. For this purpose, quartz crystal microbalance (QCM) sensors are becoming a good alternative to analytical methods for the real-time monitoring of bacterial growth in liquid media culture. In a previous paper, the authors described an affordable multi-channel measurement instrument based on QCM sensors. However, in order to validate its correct operation, complementary experimental measurements based on bacterial biofilm growth were performed. In this work, the experimental measurements that allow the identification of the different biofilm formation stages are described. The results obtained are discussed.

1. Introduction

A biofilm is a form of bacterial growth in which microorganisms adhere to each other within a self-produced matrix of extracellular polymeric substances (EPSs) that usually adhere to a solid surface. The EPS matrix provides functional characteristics to the structure, such as improved resource capture, adhesion to surfaces, digestive capacity, protection against external agents, and the prevention of bacterial dehydration. Thus, the formation of the biofilm provides microorganisms with a strong resistance to antibacterial treatments [1]. This leads to significant problems of infections caused by the contamination of medical prostheses and tools, causing an increase in healthcare risks and significant economic losses. Another field where biofilm formation generates a great negative impact is water distribution systems [2,3,4]. The presence of bacterial biofilm in pipes is a major issue in terms of water quality and corrosion problems. For this reason, important research efforts are being carried out to understand the mechanism of biofilm formation and to develop specific medical treatments and more effective prevention and control techniques.
Biofilm formation is an extremely complex process that includes several stages. First, the initial attachment of planktonic bacteria to a surface is promoted by a conditioning layer consisting of organic and inorganic molecules. Specific cell membrane proteins, adhesins, or bacterial appendages, such as pili or flagella, play an important role in avoiding the action of hydrodynamic and repulsive forces, as well as selecting the surface. In the second stage, after the attachment has become irreversible, bacterial colonies grow to form a complex layer of biomolecules and cause EPS secretion that constitutes the external matrix. In the third stage, the biofilm reaches its maximum thickness, acquiring a three-dimensional gel-like structure. At this point, it has achieved its maturation. Finally, when biofilms are fully mature, detachment may occur, allowing bacteria to take on a planktonic state again that may be dispersed to colonize new sites. Identifying the first stages of biofilm adhesion to a surface is crucial for developing novel solutions to prevent biofilm formation. As a result, it is necessary to develop appropriate instrumental techniques that allow the online monitoring of biofilm growth. Traditional ways of studying biofilm growth are mainly based on bacteria counting techniques. These procedures involve the pre-treatment of the sample, which leads to biofilm destruction. Therefore, they are considered end-point detection techniques and are unable to monitor the process of biofilm formation over time. Alternatively, new technologies were developed for biofilm monitoring. These include the biofilm ring test, microtiter plate, and Calgary device. Nevertheless, these techniques fail to provide real-time information on biofilm growth. Other techniques, such as microfluidic systems and flow chambers, allow real-time biofilm monitoring by means of optical detection methods but require the use of additional instrumentation. Microscopy, including atomic force microscopy (AFM), transmission electron microscopy (TEM), and scanning electron microscopy (SEM), is also used. However, these are destructive, have a low throughput, require expensive instruments, and do not provide online information on biofilm growth. Recently, some reviews regarding different techniques for biofilm monitoring were published [5,6,7,8,9,10].
Acoustic sensors are becoming a good alternative for the measurement of bacterial growth in liquid media culture. Among them, sensors based on quartz crystal microbalances (QCMs) were demonstrated as a potentially cost-effective, reliable, and non-destructive technique. QCM-based sensors overcome the drawbacks of the previously mentioned ones, as they provide real-time information on the biofilm formation process. Several studies regarding the monitoring of biofilm formation using QCM sensors may be found in the literature [11,12,13,14,15,16,17,18,19,20,21].
These types of sensors are based on the fact that QCM resonance parameters (the series resonance frequency shift, Δfs, and the change in the resistance at this frequency, ΔRm) reflect the changes in the medium of contact. These two parameters correlate with the density and viscosity of the medium and are very sensitive to the dynamics at the solid-viscous liquid interface and to the appearance of a viscoelastic film that gradually replaces the contact of the QCM with the liquid. The measurement of both parameters could be performed using QCM-D dissipation monitoring techniques [22,23,24,25], by embedding the sensor in the feedback network of an oscillator [26,27] or by extracting them from the electrical impedance analysis [28,29], as in the case of our multi-channel system [30]. Novel system architecture, the measurement procedure, the automatic compensation of the static electrical capacitance Co of the QCM, and the accurate extraction of the series resonance frequency fs and the electrical impedance at resonance Rm were introduced. This was possible via the current availability of high-performance and low-cost analogue and digital integrated circuits that allow the implementation of specific impedance analysers that are compact, rapid, and affordable for the accurate measurement of the QCM resonance parameters. Accordingly, the system performance meets the demanding requirements for the simultaneous online monitoring of microbial growth and biofilm formation under controlled ambiance in multi-well Petri plates.
This paper presents the bacterial biofilm growth experiments that were carried out and the results obtained in order to characterize the different biofilm formation stages for the validation of the performance and limitations of the instrument. The theory of operation is explained in Section 2. In Section 3, the descriptions of the novel multi-channel system, the QCM sensors, and the materials and methods used in the experiments are detailed. The experimental results are shown and discussed in Section 4 in order to identify the biofilm development stages. Finally, in Section 5, the conclusions of the work are presented.

2. Theory

The electrical impedance of a QCM crystal depends on the electrical capacitance formed by the electrodes, the quartz as a dielectric material, and the so-called motional impedance, which presents a resonance. The two QCM resonance parameters, the series resonance frequency, fs, and the resistance at this frequency, Rm, are well correlated with the viscoelastic properties of the medium in physical contact with the front face of the QCM [31]. Therefore, the changes in the bacterial culture from initial bacterial adhesion to biofilm formation and subsequent growth could be estimated by measuring the shifts in the series resonance frequency and the resistance of a QCM.
The equivalent electrical model of the QCM sensor, when loaded with the bacterial culture and the biofilm adhered to its surface, could be derived from the classical Butterworth-Van Dyke (BVD) electrical circuit for an unperturbed QCM [17,18,27,31,32]. This model is depicted in Figure 1 and represents the electrical impedance of the sensor near resonance.
The electrical model is composed of two main parallel branches: the capacitance (Co) of the purely electrical branch, which includes the fixed dielectric capacitance and the holder and connector capacitances, and the impedance of the motional branch. The motional impedance of the unperturbed QCM is represented by the sum of the motional inductance, Lm, the motional capacitance, Cm, and the motional resistance, Rm. This resistance also includes the losses due to the loading effect caused by the support of the QCM on the holder. When the sensor is loaded using a material in contact with its surface, a new impedance Zload is added to the motional branch. A rigid layer or deposited mass attached to the sensor surface could be modelled as an inductance. A liquid loading with a density and viscous coefficient could be modelled as an inductance connected in series with resistance, respectively. However, as in our biofilm experiments, the effects of a thin viscous layer in combination with a liquid loading exhibit more complex behaviours.
The impedance of the motional branch of the unperturbed sensor exhibits a series resonance frequency, fs, which is provided in Equation (1).
f s = 1 2 π L m C m
The resistance of this branch at its resonance frequency is directly provided by the motional resistance, Rm. When the sensor surface is loaded, the resonance frequency is affected by the reactive component of the load impedance, while the resistance at resonance varies with the resistive part of the load due to its viscosity. The change in the resonance frequency, Δfs, of a QCM when it is loaded with a mass may be calculated using the Sauerbrey Equation (2), while the Kanazawa-Gordon Equation (3) is valid for liquid loading [33,34].
f s = - 2 f s 2 A ρ q μ q m
where A is the electrode area, ρq and μq are the density and rigidity moduli of the quartz crystal, respectively, and Δm is the mass change.
Δ f s = - f s 3 / 2 η l ρ l / π μ q ρ q 1 / 2
where ρl is the density of the liquid, ηl is the viscosity of the liquid, and ρq and μq are the density and rigidity moduli of the quartz crystal, respectively.
On the other hand, the change in the resistance at the resonance frequency ΔRm for the QCM with liquid loading conditions is provided in Equation (4).
Δ R m = 2 n f s L m 4 π f s η l ρ l / μ q ρ q 1 / 2
where n is the number of QCM sides in contact with the liquid, and Lm is the inductance for the unperturbed, i.e., dry, resonator.
However, as in our biofilm experiments, the effects of the formation of a thin viscous layer in combination with a liquid loading exhibit a more complex behaviour than those explained by Sauerbrey and Kanazawa for purely mass loading or viscous liquid loading, respectively.
Additionally, it should be noted that the resonance frequency is usually estimated by obtaining the minimum electrical impedance measurement at the QCM terminals. However, the error committed is considerable when the motional resistance increases due to the capacitance (Co) influence, as it occurred in our case of interest. For this reason, the suitable extraction of the parameters of the motional branch was based on the accurate compensation of this capacitance in the QCM sensor electrical impedance measurement.
Therefore, the accurate analysis of the impedance of the motional branch provides useful information about the changes in the QCM sensor loading material, that is, about the process of biofilm formation and growth.

3. Materials and Methods

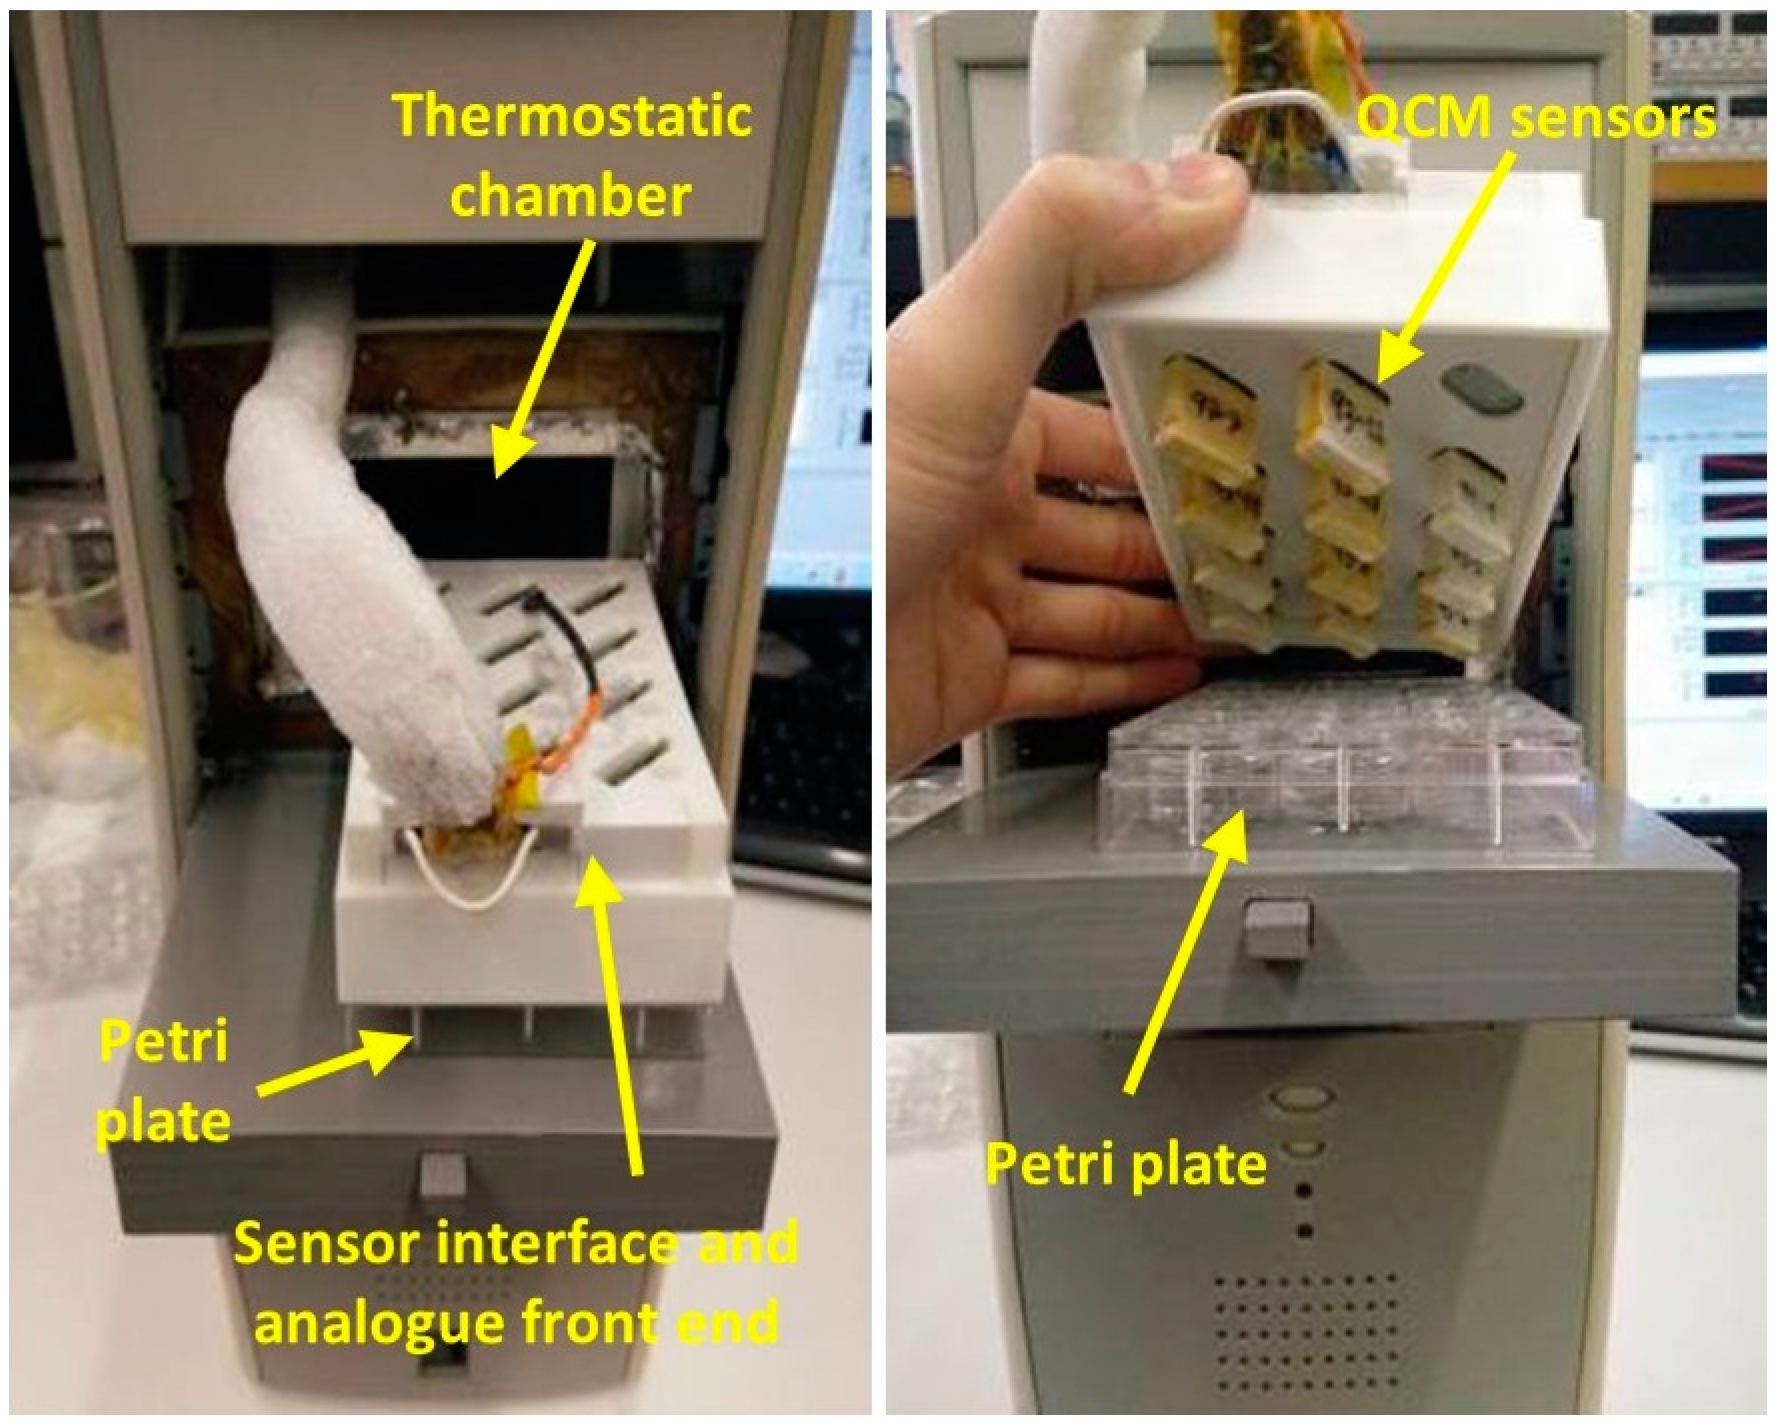
3.1. QCM Sensor Design and Fabrication

A QCM-based sensor was designed to be submerged in the wells of a Petri plate containing the bacterial culture. This sensor required a specific holder design because it was placed vertically inside each well to cause the measurement not to be sensitive to sedimentation. A commercial QCM crystal with a resonance frequency of 5 MHz and gold/titanium electrodes manufactured by Quartzpro (model QCM5140TiAu120-050-Q) was chosen. Figure 2 shows the designed QCM-based sensor. The holder consists of a compact construction manufactured employing a digital light processing (DLP) 3D resin printer. It housed the QCM crystal, whose back face was maintained without any contact or acoustic loading. Biocompatible 3D printer resins (TD90 and R140D90) manufactured by 3Dresyn were considered for this purpose. In this new sensor design for bacterial biofilm measurements, the sensitivity and losses produced by the crystal support on the holder, assembly stability, airtightness, measurement specificity, and compatibility of the holder material with the biological culture media were taken into account. More details about the QCM sensor are explained by the authors in previous works [35,36].

3.2. The Measurement System

A multi-channel instrument for online monitoring was developed in order to measure bacterial biofilm growth in liquid media culture. It was composed of an array of QCM sensors placed inside a multi-well Petri plate with liquid samples, as shown in Figure 3. Therefore, the system permitted the parallel real-time measurement of several bacterial cultures and control channels at the same time. A 12-channel setup was used in the experiments of the present work.
The QCM resonance parameters of each sensor were obtained from the measurements of their electrical impedance, Zx, in a frequency range around its mechanical resonance. The electrical impedance was determined by means of an electronic circuit based on an auto-balancing impedance bridge, as shown in Figure 4, and using Equation (5).
Z x j ω - V 1 j ω V 2 j ω · R
The system architecture of the measurement system was based on four blocks: the sensor interface and analogue front-end, the signal generation block, the data acquisition and communication block, and the control block. The whole system was connected to a personal computer in order to control the experiments, perform the data acquisition and processing, and present the results. The sensor interface and analogue front-end block included the signal conditioning circuits responsible for properly obtaining voltage V1 and V2, corresponding, respectively, to the voltage and the current of each QCM sensor in order to calculate its electrical impedance at every excitation frequency. These circuits were excited by means of a sinusoidal signal. The signal generation block generated the voltage V1 and performed the frequency-sweep of the sinusoidal signal in the frequency range of interest by means of a direct digital synthesizer DDS. The analogue signals V1 and V2 from the signal conditioning circuit were captured by means of two A/D converters in the data acquisition block. As the instrument was a multi-channel system, signals from each QCM sensor were multiplexed in order to use a single A/D converter for all of them. Then, the digital signals were stored in an FPGA device and transferred to the PC. All these tasks were implemented using the data acquisition and communication block. Finally, a control block was responsible for enabling and disabling the QCM sensor input channels, configuring the DDS device and the A/D converter, and supervising the data configuration. A custom software application developed using the LabVIEW language and running on a PC controlled the measurement system and provided a graphical interface to the user. The automatic compensations of the QCM static electrical capacitance (Co) and the frequency response of the measurement circuit permitted a very accurate analysis of the motional branch impedance and the determination of the resonance parameters in the heavily loaded QCM, as occurs with biofilms. Finally, in order to keep the temperature under control, the multi-well Petri plate with the QCM sensors was placed into a thermostatic chamber. The temperature in the thermostatic chamber was controlled and measured accordingly. The measurement system is described in more detail by the authors in a previous paper [30].

3.3. Bacterial Cultures and Experimental Preparation

In order to perform the bacterial biofilm formation and growth experiments, liquid cultures of Staphylococcus aureus were used since it is one of the most frequently involved in biofilm-related infections. Staphylococcus aureus was spread on Columbia Agar with 5% sheep blood (BD, Fraga, Spain) and incubated at 37 °C overnight. Afterwards, the bacterial culture was diluted to a 0.5 McFarland and grown in Trypto-Casein Soy Broth (TSB) plus 0.25% glucose (which stimulates biofilm formation) to obtain a final concentration of 106 CFU/mL.
In the 12-well Petri plate setup, 9 were filled with 3.8 mL of bacterial culture. The three remaining wells were filled with a 3.8 mL volume of TSB plus 0.25% glucose without bacteria for control purposes.
Prior to each experiment, the sensors were thoroughly cleaned. Traces of biofilms, which could adhere to the sensors from previous measurements, were removed with 70% ethanol. Then, they were cleaned with 10% bleach for 20 min, dried, and UV radiated for 15 min before mounting them on the interface and analogue front-end board. A calibration of the instrument was performed prior to use with the procedure described in a previous paper [30]. The different experimental parameters, number of channels, total time, sampling period, frequency range, and temperature, among others, were specified by means of the graphical user interface of the software application of the instrument.
At the end of the experiments, to measure the quantity of the biofilm formed exclusively in the active area of the sensors that remained submerged in the bacterial culture, a flocked swab was used to remove it, avoiding touching the holder. All biofilm collected was completely recovered in a 1× Phosphate Buffer Saline (PBS) solution for each sensor. Serial dilutions (1/10) were performed and subsequently spread on a Luria-Bertani medium (LB agar). The plates were incubated at 37 °C overnight. After that, colony counts were carried out, and only the plates with a total of 30–300 colonies were considered valid for determining the concentration in CFU/mL. The same procedure was reproduced for the planktonic culture in the wells of the plate corresponding to each sensor.

4. Results

The multi-channel system based on QCM sensors was widely used to perform the online monitoring of bacterial biofilm formation and growth and to identify the different stages of these processes. Several 24-h and 48-h experiments were performed, mainly using Staphylococcus aureus. The instrument was obtained over the total experimental time, both the resonance frequency and the resistance at resonance for each QCM sensor submerged in the wells of the plate. The temperature of the thermostatic chamber was set to a temperature of 37 °C to facilitate biofilm growth.
Figure 5 and Figure 6 show the representative results of the resonance frequency shift, Δfs, and the resistance at the resonance shift, ΔRm, in two different experiments using a Staphylococcus aureus culture over 24 h and 48 h, respectively. The evolution of the QCM sensor resonance parameters for only two different channels among the nine wells containing the bacterial culture is presented.
The results of the rest of the active channels are not presented as the behaviours of all of them are quite similar. The resonance parameter evolution of the control channels is not presented either, as it does not show any significant variation, as expected.
The changes in the resistance at the resonance (ΔRm) of the QCM sensors submerged in the channels with the bacterial culture always exhibited a similar profile. After the fluctuations attributed to the initial perturbations of the cultures and temperature stabilization inside the measurement chamber at the beginning of the experiment, the resistance remained stable until the bacteria began to adhere to the sensor surface, starting the resistance-growing phase. This phase behaviour reflects the transition from the instant when the QCM is only loaded with a liquid bacterial culture to when it is loaded with a viscous biofilm adhered to its surface. The initial adhesion of the free-floating bacteria to the sensor surface implies a mass addition to the QCM, but when they are structured within an extracellular polymeric substance (EPS) matrix conforming a viscous layer, the viscosity dampens the QCM’s operation and results in increased resistance at resonance. The more abundant and viscoelastic the biofilm is, the more resistance is measured. When the biofilm is thick enough, the load effects of the liquid media are not relevant, prevailing the viscoelastic properties of this layer. Finally, once the biofilm reaches its maturation, several effects occur that could explain the variations shown in the resistance. The changes in the biofilm’s structure and the bacterial metabolism are translated into changes in the shear rigidity and viscosity of the layer detected with the QCM sensor. Also, the detachment processes with the dispersion of bacteria result in mass losses of the biofilm that also affect the sensor’s electrical impedance. As seen in the resistance profile, it clearly permits the real-time identification of the different stages of the biofilm’s formation and growth, from initial bacterial adhesion to the surface to biofilm growth and biofilm maturation.
On the other hand, the resonance frequency shift (Δfs) of the sensors in the wells with bacteria shows a decreasing trend due to the mass loading effects of the media at the QCM sensor surface, as predicted with the Sauerbrey and Kanazawa equations. Nevertheless, from one biofilm formation stage to another, a slope change in the evolution of the resonance frequency may be seen. Even in some other experiments that were carried out, increments in the resonance frequency were measured. These behaviours cannot be explained by the too-simplified Sauerbrey and Kanazawa equations, as the adhesion of the flexible microorganisms to the surface results in the formation of a soft film, which cannot be considered a rigidly attached mass. In this situation, a more complex model of the impedance Zload added to the motional branch of the BVD model must be used [18,23,37,38].
In Figure 5, the 24-h experiment presents a total resistance change at a resonance (ΔRm) of 32 Ω and a total resonance frequency change (Δfs) of −200 Hz in channel two and a total change of 35 Ω and −250 Hz in channel four. The rest of the channels in this experiment presented variations of ΔRm ranging from 30 to 60 Ω and variations of Δfs ranging from −140 to −200 Hz. The 48-h experiment results in Figure 6 show a total resistance at a resonance change (ΔRm) of 110 Ω and a total resonance frequency change (Δfs) of −300 Hz in channel one and a total change of 150 Ω and −250 Hz in channel nine. The rest of the channels presented variations of ΔRm ranging from 80 to 150 Ω and variations of Δfs ranging from −250 to −350 Hz. The maximum resistance changes of the different channels and experiments correlated well with the final quantities of biofilm that could be observed at the sensor surface by optical inspection. In the pictures of the active surface of the sensors presented in Figure 7, although the biofilm quantity cannot be appreciated, the presence of the biofilm was confirmed.
In addition to the optical inspection, the quantification of the biofilm’s formation at the end of the experiments was performed with the measurement of the bacterial concentration of both the biofilm adhered to the active surface of the QCM sensor and the planktonic culture. Table 1 shows the concentrations measured for each channel and experiment.
This quantification of the bacterial biofilm adhered to the sensor surface at the end of the experiments is in good agreement with the QCM sensor measurements. All channels where the biofilm was more abundant show a larger increment in the resistance at the resonance, and the slope changes in the resonance frequency profile are more abrupt. The measurements of the concentration were only performed at the end of the experiment, as we did not want to interrupt the biological processes involved. However, our results are in good agreement with more detailed time-dependent morphological characterization studies that may be found in the literature focusing on the use of a QCM for biofilm growth monitoring [14,24]. In these works, biofilm images and alternative techniques were performed at specific times after stopping the biofilm growth process, which implied the completion of the entire experiment.
All the experiments carried out with the developed instrument, even with different bacterial types, such as Escherichia coli or Staphylococcus epidermidis, exhibited similar evolutions with the same process stages, although the instant when the biofilm formation started, the growth slope and biofilm quantity varied.

5. Conclusions

The experimental results of a multi-channel system based on QCM sensors for the real-time monitoring of bacterial biofilm growth in liquid media culture are presented. The measuring principle of the system is based on the impedance spectroscopy method, taking advantage of the availability of high-performance and low-cost analogue and digital integrated circuits, which allow the implementation of specific impedance analysers that are compact, rapid, and affordable. Both the QCM-based sensors and the measurement system were purposely designed to meet the demanding requirements to accurately measure and analyse the main resonance parameters of the QCM motional impedance. The results show that the series resonance frequency and the resistance at this frequency are well correlated with the viscoelastic properties of the medium in physical contact with the front face of the QCM sensor. In addition, the results are very sensitive to the dynamics at the solid-viscous liquid interface and to the appearance and growth of the bacterial biofilm.
A motional impedance analysis related to the phenomena involved in the biofilm formation and growth dynamics may be basically explained with the Sauerbrey and Kanazawa equations. However, when the initial bacterial biofilm adhesion to the surface occurred, much more complex effects were involved, and the explanation with the too-simple classical model is not possible.
The multi-channel system was widely used to perform experiments with bacterial cultures, mainly with Staphylococcus aureus, and this demonstrated the capabilities to identify the different biofilm formation stages. All the experiments carried out exhibited similar evolutions with the same process stages, i.e., initial bacterial adhesion to the surface, biofilm growth, and biofilm maturation, although the time when the biofilm formation started and the growth velocity and biofilm quantity varied.

Author Contributions

Conceptualisation, J.S., A.T. and J.-A.C.; methodology, J.S., A.T., J.-A.C. and S.S.; software, M.N. and N.C.; validation, M.N., N.C., Y.G. and Y.L.; formal analysis, M.-À.A., A.T. and J.-A.C.; investigation, J.S., A.T., J.-A.C. and S.S.; resources, M.N., N.C., Y.G. and Y.L.; data curation, M.-À.A. and N.C.; writing—original draft preparation, M.-À.A. and A.T.; writing—review and editing, J.-A.C. and J.S.; visualisation, J.-A.C.; supervision, J.S. and S.S.; project administration, A.T.; funding acquisition, J.S. All authors have read and agreed to the published version of the manuscript.

Funding

This research was funded by the Ministry of Science, Innovation of Spain under the project RTI2018-099938-B-I00.

Institutional Review Board Statement

Not applicable.

Informed Consent Statement

Not applicable.

Data Availability Statement

The datasets generated and analysed during the current study are available from the corresponding author upon reasonable request.

Conflicts of Interest

The authors declare no conflict of interest.

References

  1. Khatoon, Z.; McTiernan, C.D.; Suuronen, E.J.; Mah, T.-F.; Alarcon, E.I. Bacterial biofilm formation on implantable devices and approaches to its treatment and prevention. Heliyon 2018, 4, e01067. [Google Scholar] [CrossRef] [PubMed] [Green Version]
  2. Liu, S.; Gunawan, C.; Barraud, N.; Rice, S.A.; Harry, E.J.; Amal, R. Understanding, Monitoring, and Controlling Biofilm Growth in Drinking Water Distribution Systems. Environ. Sci. Technol. 2016, 50, 8954–8976. [Google Scholar] [CrossRef] [PubMed]
  3. Di Pippo, F.; Di Gregorio, L.; Congestri, R.; Tandoi, V.; Rossetti, S. Biofilm growth and control in cooling water industrial systems. FEMS Microbiol. Ecol. 2018, 94, fiy044. [Google Scholar] [CrossRef] [PubMed] [Green Version]
  4. Gutman, J.; Walker, S.L.; Freger, V.; Herzberg, M. Bacterial attachment and viscoelasticity: Physicochemical and motility effects analysed using quartz crystal microbalance with dissipation (QCM-D). Environ. Sci. Technol. 2013, 47, 398–404. [Google Scholar] [CrossRef] [PubMed]
  5. Azeredo, J.; Azevedo, N.F.; Briandet, R.; Cerca, N.; Coenye, T.; Costa, A.R.; Desvaux, M.; Di Bonaventura, G.; Hébraud, M.; Jaglic, Z.; et al. Critical review on biofilm methods. Crit. Rev. Microbiol. 2017, 43, 313–351. [Google Scholar] [CrossRef] [Green Version]
  6. Wilson, C.; Lukowicz, R.; Merchant, S.; Valquier-Flynn, H.; Caballero, J.; Sandoval, J.; Okuom, M.; Huber, C.; Brooks, T.D.; Wilson, E.; et al. Quantitative and Qualitative Assessment Methods for Biofilm Growth: A Mini-review. Res. Rev. J. Eng. Technol. 2017, 6, 4. [Google Scholar]
  7. Saccomano, S.C.; Jewell, M.P.; Cash, K.J. A review of chemosensors and biosensors for monitoring biofilm dynamics. Sens. Actuators Rep. 2021, 3, 100043. [Google Scholar] [CrossRef]
  8. Funari, R.; Shen, A.Q. Detection and Characterization of Bacterial Biofilms and Biofilm-Based Sensors. ACS Sens. 2022, 7, 347–357. [Google Scholar] [CrossRef]
  9. Prabowo, B.A.; Cabral, P.D.; Freitas, P.; Fernandes, E. The Challenges of Developing Biosensors for Clinical Assessment: A Review. Chemosensors 2021, 9, 299. [Google Scholar] [CrossRef]
  10. Xu, W.; Koydemir, H.C. Non-invasive biomedical sensors for early detection and monitoring of bacterial biofilm growth at the point of care. Lab Chip 2022, 22, 4758–4773. [Google Scholar] [CrossRef]
  11. Saitakis, M.; Gizeli, E. Acoustic sensors as a biophysical tool for probing cell attachment and cell/surface interactions. Cell. Mol. Life Sci. 2012, 69, 357–371. [Google Scholar] [CrossRef]
  12. Huang, R.; Yi, P.; Tang, Y. Probing the interactions of organic molecules, nanomaterials, and microbes with solid surfaces using quartz crystal microbalances: Methodology, advantages, and limitations. Environ. Sci. Process. Impacts 2017, 19, 793–811. [Google Scholar] [CrossRef]
  13. Afzal, A.; Mujahid, A.; Schirhagl, R.; Bajwa, S.Z.; Latif, U.; Feroz, S. Gravimetric Viral Diagnostics: QCM Based Biosensors for Early Detection of Viruses. Chemosensors 2017, 5, 7. [Google Scholar] [CrossRef]
  14. Chen, J.Y.; Penn, L.S.; Xi, J. Quartz crystal microbalance: Sensing cell-substrate adhesion and beyond. Biosens. Bioelectron. 2018, 99, 593–602. [Google Scholar] [CrossRef]
  15. Jandas, P.J.; Prabakaran, K.; Luo, J.; M G, D.H. Effective utilization of quartz crystal microbalance as a tool for biosensing applications. Sens. Actuators A 2021, 331, 113020. [Google Scholar] [CrossRef]
  16. Lim, H.J.; Saha, T.; Tey, B.T.; Tan, W.S.; Ooi, C.W. Quartz crystal microbalance-based biosensors as rapid diagnostic devices for infectious diseases. Biosens. Bioelectron. 2020, 168, 112513. [Google Scholar] [CrossRef]
  17. Na Songkhla, S.; Nakamoto, T. Interpretation of Quartz Crystal Microbalance Behavior with Viscous Film Using a Mason Equivalent Circuit. Chemosensors 2021, 9, 9. [Google Scholar] [CrossRef]
  18. Na Songkhla, S.; Nakamoto, T. Overview of Quartz Crystal Microbalance Behavior Analysis and Measurement. Chemosensors 2021, 9, 350. [Google Scholar] [CrossRef]
  19. Akgönüllü, S.; Özgür, E.; Denizli, A. Recent Advances in Quartz Crystal Microbalance Biosensors Based on the Molecular Imprinting Technique for Disease-Related Biomarkers. Chemosensors 2022, 10, 106. [Google Scholar] [CrossRef]
  20. Xu, Z.; Yuan, Y.J. Quantification of Staphylococcus aureus using surface acoustic wave sensors. RSC Adv. 2019, 9, 8411. [Google Scholar] [CrossRef] [Green Version]
  21. Xu, Z.; Luo, Y. Immunoglobulin-Immobilized Quartz Crystal Microbalance for Staphylococcus Aureus Real-Time Detection. IEEE Sens. J. 2022, 22, 12. [Google Scholar] [CrossRef]
  22. Olsson, A.L.; Mitzel, M.R.; Tufenkji, N. QCM-D for non-destructive real-time assessment of Pseudomonasaeruginosa biofilm attachment to the substratum during biofilm growth. Colloids Surf. B Biointerfaces 2015, 136, 928–934. [Google Scholar] [CrossRef] [PubMed]
  23. Alexander, T.E.; Lozeau, L.D.; Camesano, T.A. QCM-D characterization of time-dependence of bacterial adhesion. Cell Surf. 2019, 5, 100024. [Google Scholar] [CrossRef] [PubMed]
  24. Ripa, R.; Shen, A.Q.; Funari, R. Detecting Escherichia coli Biofilm Development Stages on Gold and Titanium by Quartz Crystal Microbalance. ACS Omega 2020, 5, 2295–2302. [Google Scholar] [CrossRef] [PubMed] [Green Version]
  25. Fernandez, R.; Calero, M.; Garcia-Narbon, J.V.; Reviakine, I.; Arnau, A.; Jimenez, Y. A Fast Method for Monitoring the Shifts in Resonance Frequency and Dissipation of the QCM Sensors of a Monolithic Array in Biosensing Applications. IEEE Sens. J. 2021, 21, 6643–6651. [Google Scholar] [CrossRef]
  26. Arnau, A. A Review of Interface Electronic Systems for AT-cut Quartz Crystal Microbalance Applications in Liquids. Sensors 2008, 8, 370–411. [Google Scholar] [CrossRef] [Green Version]
  27. Fort, A.; Panzardi, E.; Vignoli, V.; Tani, M.; Landi, E.; Mugnaini, M.; Vaccarella, P. An Adaptive Measurement System for the Simultaneous Evaluation of Frequency Shift and Series Resistance of QCM in Liquid. Sensors 2021, 21, 678. [Google Scholar] [CrossRef]
  28. Castro, P.; Resa, P.; Duran, C.; Maestre, J.R.; Mateo, M.; Elvira, L. Continuous monitoring of bacterial biofilm growth usinguncoated Thickness-Shear Mode resonators. International Symposium on Ultrasound in the Control of Industrial Processes (UCIP 2012). IOP Conf. Ser. Mater. Sci. Eng. 2012, 42, 012054. [Google Scholar] [CrossRef]
  29. Castro, P.; Elvira, L.; Maestre, J.R.; De Espinosa, F.M. Study of the Relation between the Resonance Behavior of Thickness Shear Mode (TSM) Sensors and the Mechanical Characteristics of Biofilms. Sensors 2017, 17, 1395. [Google Scholar] [CrossRef] [Green Version]
  30. Amer, M.-A.; Turo, A.; Salazar, J.; Berlanga-Herrera, L.; Garcia-Hernandez, M.J.; Chavez, J.A. Multichannel QCM-Based System for Continuous Monitoring of Bacterial Biofilm Growth. IEEE Trans. Instrum. Meas. 2020, 69, 2982–2995. [Google Scholar] [CrossRef]
  31. Martin, S.J.; Granstaff, V.E.; Frye, G.C. Characterization of a Quartz Crystal Microbalance with Simultaneous Mass and Liquid Loading. Anal. Chem. 1991, 63, 2272–2281. [Google Scholar] [CrossRef]
  32. Encarnação, J.M.; Baltazar, R.; Stallinga, P.; Ferreira, G.N.M. Piezoelectric biosensors assisted with electroacoustic impedance spectroscopy: A tool for accurate quantitative molecular recognition analysis. J. Mol. Recognit. 2009, 22, 129–137. [Google Scholar] [CrossRef]
  33. Sauerbrey, G.Z. Use of quartz crystal vibrator for weighting thin films on a microbalance. Physics 1959, 155, 206–222. [Google Scholar]
  34. Kanazawa, K.K.; Gordon, J.G.I. Frequency of a quartz microbalance in contact with liquid. Anal. Chem. 1985, 57, 1770–1771. [Google Scholar] [CrossRef]
  35. Amer, M.A.; Chávez, J.A.; García-Hernández, M.J.; Salazar, J.; Turó, A. Quartz Crystal Microbalance Holder Design for On-Line Sensing in Liquid Applications. Int. J. Electr. Comput. Energetic Electron. Commun. Eng. 2016, 10, 602–605. [Google Scholar]
  36. Amer, M.-A.; Navarro, M.; Turo, A.; Hernandez, M.G.; Salazar, J.; Chavez, J.A. Design of a QCM-sensor for online monitoring biofilm growth. In Proceedings of the 2021 IEEE International Instrumentation and Measurement Technology Conference (I2MTC), Virtual Conference, 17–20 May 2021. [Google Scholar] [CrossRef]
  37. van der Westen, R.; Sharma, P.K.; De Raedt, H.; Vermue, I.; van der Mei, H.C.; Busscher, H.J. Elastic and viscous bond components in the adhesion of colloidal particles and fibrillated streptococci to QCM-D crystal surfaces with different hydrophobicities using Kelvin–Voigt and Maxwell models. Phys. Chem. Chem. Phys. 2017, 19, 25391–25400. [Google Scholar] [CrossRef]
  38. Tarnapolsky, A.; Freger, V. Modeling QCM-D Response to Deposition and Attachment of Microparticles and Living Cells. Anal. Chem. 2018, 90, 13960–13968. [Google Scholar] [CrossRef]
Figure 1. Equivalent electrical model of the QCM sensor.
Chemosensors 11 00068 g001
Figure 2. QCM sensor design. Left: front face. Right: back face with the rear cover.
Chemosensors 11 00068 g002
Figure 3. Array of QCM sensors, thermostatic chamber, and multi-well Petri plate.
Chemosensors 11 00068 g003
Figure 4. Auto-balancing impedance bridge scheme.
Chemosensors 11 00068 g004
Figure 5. Resonance frequency shift, Δfs, and resistance at resonance shift, ΔRm, in a 24-h experiment using a Staphylococcus aureus culture: (a) channel 2 and (b) channel 4. The different stages of biofilm formation and growth were identified in the graphs: (1) initial stabilization, (2) biofilm formation and growth, and (3) maturation.
Chemosensors 11 00068 g005
Figure 6. Resonance frequency shift, Δfs, and resistance at resonance shift, ΔRm, in a 48-h experiment using a Staphylococcus aureus culture: (a) channel 1 and (b) channel 9. The different stages of biofilm formation and growth were identified in the graphs: (1) initial stabilization, (2) biofilm formation, and (3) maturation.
Chemosensors 11 00068 g006
Figure 7. Pictures of the sensor active surfaces where biofilms were adhered to in the experiments: (a) channel 2 of the 24-h experiment, (b) channel 4 of the 24-h experiment, (c) channel 1 of the 48-h experiment, and (d) channel 9 of the 48-h experiment.
Chemosensors 11 00068 g007
Table 1. Bacterial concentrations of both the biofilm adhered to the QCM sensor surface and the planktonic culture at the end of the experiments.
Experimental
Duration
Channel
Number
Biofilm Adhered to
the Surface Sensor
Remaining Bacteria
in the Liquid Culture
24 h22.5 × 106 CFU/mL9.7 × 108 CFU/mL
24 h43.3 × 106 CFU/mL8.5 × 109 CFU/mL
48 h11.15 × 107 CFU/mL1.56 × 108 CFU/mL
48 h91.23 × 107 CFU/mL1.84 × 108 CFU/mL
Disclaimer/Publisher’s Note: The statements, opinions and data contained in all publications are solely those of the individual author(s) and contributor(s) and not of MDPI and/or the editor(s). MDPI and/or the editor(s) disclaim responsibility for any injury to people or property resulting from any ideas, methods, instructions or products referred to in the content.

