
Hydrothermal Synthesis and Annealing Effect on the Properties of Gas-Sensitive Copper Oxide Nanowires


1
Escuela de Ingeniería Química, Pontificia Universidad Católica de Valparaíso, Av. Brasil 2162, Valparaíso 2362854, Chile
2
Institute of Microelectronics of Barcelona (IMB-CNM, CSIC), Campus UAB, Cerdanyola del Vallès, 08193 Barcelona, Spain
3
CEITEC—Central European Institute of Technology, Brno University of Technology, 61200 Brno, Czech Republic
*
Author to whom correspondence should be addressed.
Chemosensors 2022, 10(9), 353; https://doi.org/10.3390/chemosensors10090353
Submission received: 3 August 2022
/
Revised: 16 August 2022
/
Accepted: 24 August 2022
/
Published: 26 August 2022
(This article belongs to the Section Nanostructures for Chemical Sensing)
Abstract
:In this study, we report a straightforward and reproducible hydrothermal synthesis of copper oxide nanowires, their morphological and chemical characterization, and their application in gas sensing. Results show that the hydrothermal process is mainly influenced by the reaction time and the concentration of the reducing agent, demonstrating the synthesis of fine and long nanowires (diameter of 50–200 nm and length of 25 µm) after 10 h of reaction with 0.1 M of pyrrole. Two different annealing temperatures were tested (205 and 450 °C) and their effect on the morphology, chemical composition, and crystal size of the nanowires was analyzed by SEM, XPS, and XRD techniques, respectively. The analysis shows that the Cu2+ oxidation state is mainly obtained at the higher annealing temperature, and the nanowires’ shape suffers a transformation due to the formation of agglomerated crystallites. The gas sensing tests for acetone, ethanol, toluene, and carbon monoxide show preferential response and sensitivity to acetone and ethanol over the other analytes. The annealing temperature proves to have a higher influence on the stability of the nanowires than on their gas sensitivity and selectivity, showing better medium-term stability for the nanowires annealed at 450 °C.

1. Introduction
With potential technological applications, one-dimensional (1D) nanostructures exhibit distinctive optical, mechanical, electronic, and thermal properties generally due to their high surface-area-to-volume ratio [1]. Hence, nanowires and nanorods of several metal oxides semiconductors (MOS) [2,3,4], including copper oxide [5,6,7], have attracted scientific interest in the past years for a variety of electronic devices, amongst them gas/vapor sensors.
1D copper oxides nanostructures are obtained by different approaches in the literature, such as chemical vapor deposition [8], exfoliation of copper mesh [9], copper film anodization [10], and thermal oxidation of copper foil [3,11,12], among others [13,14]. Even though these approaches produce the desired morphology of the nanostructure, they have limitations for scalability since they need complex equipment, high temperatures, and long procedures. In this context, from the point of view of practicality, the hydrothermal method has been shown to be a versatile procedure for the synthesis of well-defined 1D nanostructures at relatively low temperatures and high yields [15,16,17,18,19,20,21].
Copper oxide has two natural oxides: cuprous oxide (Cu2O) and cupric oxide (CuO). Both are considered p-type semiconductors with band gaps of 2.0 eV and 1.2 eV, respectively [22]. At the nanoscale, these two copper oxide states have been extensively studied in different fields such as magnetic storage media [23], catalysis [24,25], photocatalysis [26,27], energy storage in supercapacitors [28], and biosensors [29] among several others [30]. In the field of gas sensors, the nature of the copper oxide is an influencing factor in the performance of the sensor [31]. For instance, recent studies on the performance of Cu2O/CuO nanowires at 177 °C using operando near-ambient-pressure X-ray photoelectron spectroscopy (NAP-XPS) showed that the nanowires (NWs) exposed to oxygen temporarily oxidize, decreasing Cu+ concentration. In contrast, upon the presence of EtOH/O2 mixture, the surface is partially re-oxidized to a Cu+/Cu2+ ratio [32]. However, despite the interest in these findings, there is still a need to gain further insight into the correlation of thermally treated copper oxide with its sensing properties and stability, considering its working temperatures for gas sensing are usually near the complete oxidation of this material.
In this context, here, we explore the hydrothermal synthesis controlling parameters for the selective formation of copper oxide nanowires, the effect of temperature on their morphology, structure, and chemical composition, and the middle-term stability of their gas sensing properties toward relevant gases/vapors.
2. Materials and Methods
2.1. Hydrothermal Synthesis
Copper oxide nanowires were formed via hydrothermal synthesis using copper (II) acetate as source of copper following the procedure of Tan et al. [15] with slight changes in temperature and concentrations. Briefly, 200 mg of the salt was dissolved in 40 mL of deionized water at room temperature and stirred for 15 min. After, 10 mL of 0.1 M of pyrrole was added and stirred for 5 min. The suspension was poured into an autoclave vessel (100 cm3) and kept for 10 h at 150 °C. After this process, the autoclave vessel was cooled down naturally at ambient temperature. Subsequently, the final product (a greenish powder) was separated and washed (first with water and later with ethanol by several ultrasonic-centrifuge cycles). Finally, the product was dried at 90 °C for 12 h and later annealed at different temperatures (205 °C or 450 °C) for 4 h. After annealing, the samples were cooled down to room temperature naturally.
Morphological characterization was carried out by scanning electron microscopy (SEM, Tescan FE Mira II LMU, Brno, Czech Republic). The surface chemical composition determination was performed using X-ray photoelectron spectroscopy (XPS, Kratos Axis Supra with monochromatic Al Kα X-ray radiation, emission current of 15 mA, and hybrid lens mode, Manchester, UK). The XPS passing energy for detailed and wide spectra was set at 80 eV and 20 eV, respectively. XPS resulted spectra were analyzed by CasaXPS software, using calibration of C 1s peak fixed at 284.7 eV. All spectra were fitted with Shirley algorithm background and Gaussian–Lorentzian line shape. The crystalline phase composition was analyzed with an X-ray diffractometer with high brightness source (XRD, Rigaku SmartLab 9kW CF2, Neu-Isenburg, Germany). XRD scans were performed in Bragg–Brentano geometry and Cu Κα radiation (scan range between 10° and 80° and scan speed of 4°·min−1). The results from XRD were also used to calculate the crystal size evolution by the Scherrer equation (Equation (1)) using the dimensions of the principal diffraction peaks of the phase:
where L is the crystallite size, K is the Scherrer constant (also known as the shape factor ~0.9), λ is the wavelength of the X-ray radiation (1.5406 Å), β is the full width at half maximum (FWHM) of the diffraction peak, and θ is the angle of the principal peaks.
2.2. Gas Sensing Tests
The as-synthesized and annealed copper oxide nanowires were integrated into silicon-based platforms containing Cr/Au (40/200 nm thick) interdigitated electrodes (15 µm apart) isolated from the Si substrate by a SiO2 layer. The silicon platforms were cleaned with isopropyl alcohol in an ultrasonic bath for 15 min before the nanowires integration. The nanowires were integrated by drop-coating (5 µL) assisted by dielectrophoresis process using an alternating voltage (5 Vpp) at a frequency of 5 MHz for 90 s. The drop-coating solution consisted of suspended nanowires in water and agitated ultrasonically before the deposition.
The NWs-based sensors were characterized using dc resistance measurements in a continuous flow (100 sccm) test system consisting of various mass flow controllers (Brooks 5850E) and a test chamber connected to calibrated gas bottles of synthetic air, carbon monoxide, acetone, ethanol, and toluene. Further details of the gas characterization systems were described elsewhere [33]. The sensors were exposed to the gaseous analytes for 10 min, and subsequently, the chamber was purged with air for 30 min until initial baseline resistance was recovered. The whole testing period was comprised of two stages separated by 6 months. During the first stage, the sensors accumulated an operation time of 50 h along 8 days, whereas during the second stage the sensors operated for 40 h along 5 days. During both periods, the sensors (three of each type) were tested at various operating temperatures and gas concentrations, performing three replicates for each sensor and condition. The sensor response (R) is defined as R= (Ra − Rg)/Ra, where Ra is the sensor resistance in air and Rg represents the sensor resistance after 10 min of the target gas exposure.
3. Results and Discussions
3.1. Copper Oxide Nanowires Formation
The hydrothermal process of copper acetate resulted in the formation of powders with different morphologies, mainly affected by the processing time (h) and concentration (M) of the reducing agent (i.e., pyrrole). Figure 1, illustrates the influence of these parameters on the morphology while keeping constant the processing temperature at 150 °C and the copper precursor concentration at 0.025 M. The illustration shows that a reaction process of 14 h with 0.1 M of pyrrole (as a departing point based on a previous report [15]) delivers structures with diverse morphologies. Amongst them is a round-shaped conglomerate of nanoparticles, star-like structures, and nanowires of short length. Further experiments tuning the processing time and the pyrrole concentration demonstrated the processing time as the most sensitive parameter to the definition of the copper oxide nanowires. For instance, our experiments showed that a decrease in the processing time from 14 h to 12 h favors the formation of a higher number of wires, eliminating to a great extent the round-shaped conglomerate of nanoparticles and star-like structures. This tendency was shown to continue in the same direction by decreasing the processing time from 12 h to 10 h, the final condition used to obtain powders dominated by nanowire-like structures. In contrast, the effect of the reducing agent concentration showed a mild influence on the morphology of copper oxide, where higher concentrations favor the formation of particles and bulk structures instead of wires.
The greenish as-synthesized product obtained from the 10 h hydrothermal synthesis based on 0.1 M pyrrole concentration displayed a high quantity of long (~25 µm) smooth surface topography nanowires with diameters from 50 to 200 nm. XRD and XPS analysis of the as-synthesized samples confirmed the presence of copper with mixed oxidation states; these results and the annealing temperature effect on the nanowires’ structure and composition are discussed in the next section. Overall, the synthesis procedure was tested repeatable, obtaining a yield of around 67%. This procedure allowed for large-scale synthesis and the simple separation of the remnant liquid since the powder settled quickly.
3.2. Copper Oxide Hydrothermal Growth
The synthesis of the copper oxides takes place due to a redox reaction between the pyrrole and copper acetate [34]. Under hydrothermal conditions and temperatures (above 110 °C), initially, the Cu2+ (from the Cu(OAc)2) initiates an oxidative polymerization that results in a pyrrole cation radical, poly(pyrrole). Later, this in situ formed poly(pyrrole) reduces the Cu2+ of copper acetate to Cu+, resulting in Cu2O nanowires. The possible reaction occurring during this process is shown in reaction 1 [35]. After annealing at temperatures above 200 °C, the oxidation of the Cu2O occurs to finally obtain CuO (reaction 2).
| 2n(C4H5N) + 2Cu2+ + nH2O → nCu2O + 2(2n − 1)H+ + C4H4N  C4H3N C4H3N  2(n−1)C4H4N 2(n−1)C4H4N | (reaction 1) |
| nCu2O + O2 → 2nCuO | (reaction 2) |
It has been found that single crystalline nanowire formation is related to the growth rate along one crystallographic direction, which is faster than in the other directions [16]. This anisotropic growth mechanism for the formation of the single crystalline Cu2O nanowire may be due to the formation of the polymers that adsorbs onto the crystallographic planes of Cu2O; it has been suggested that the adsorption of the polymers over the Cu2O crystallites is based in the chemical interaction between the given facets and the ligand in the amine group (-NH-) [15].
The oxygen concentration gradient is the other main driver in nanowire formation that is usually considered constant and homogeneous. However, studies have shown that a concentration gradient is formed since a large amount of oxygen contributes to the formation of copper oxides during the first seconds of the reaction. Thus, there is a “layer-by-layer” diffusion of oxygen to the copper surface [36], which favors the formation of nanowires, especially at intermediate temperatures (400–700 °C). At higher temperatures, higher concentrations of oxygen must be supplied, while at lower temperatures, this gradient is negligible due to the little diffusion of copper ions [28,37].
Thus, the formation of copper oxide nanowires depends on the amount of polymer adsorbed over the Cu2O crystallites, a factor controlled by the polymer concentration and the processing temperature (which influences the grain boundary diffusion and oxygen concentration gradient mechanisms).
3.3. Annealing Temperature Effect on the Copper Oxide Nanowires
The thermal stability of the wires was evaluated by annealing the as-synthetized products at an intermediate (205 °C) and a high temperature (450 °C) in order to approach and exceed the typical sensor operating temperatures, respectively. The SEM images of the annealed powders are displayed in Figure 2c,d. We observed that after the heating treatment, the original greenish powder became brownish regardless of the annealing temperature. The color change is most likely connected with the oxidation of the initial copper species (Cu0 and Cu+), which usually occurs at lower temperatures for nano-sized crystallites compared to their bulk counterparts due to an effective diffusion of oxygen (threshold between 190 to 200 °C) [37,38]. The surface of the nanowires annealed at 205 °C did not show marked differences compared to the as-prepared nanowires. However, the nanowires annealed at 450 °C displayed a rough surface formed of nanocrystals of 10–40 nm in diameter along the nanowire.
The XRD diffraction patterns of the as-synthesized and annealed powders at 205 °C and 450 °C are displayed in Figure 3a. Overall, the patterns show intense diffraction peaks confirming the formation of crystalline structures. The spectrum of the as-synthetized sample shows intense diffraction peaks appearing at 29.45° 2θ, 36.31° 2θ, 42.20° 2θ, and 61.29° 2θ, which are assigned to (011), (111), (002), and (022) planes of copper (I) oxide in cubic crystalline phase (Cu2O, cubic cuprite ICSD Card No. 98-017-3982). The other diffractions, at 43.21° 2θ and 50.35° 2θ, are in agreement with the (111) and (002) planes of the metallic copper (Cu, cubic crystallographic system, ICSD Card No. 98-005-3757). After annealing at 205 °C, the diffraction pattern of the nanowires also contains the main peaks of Cu2O and Cu (ICSD Card No. 98-005-3756), similar to the as-synthetized sample. However, at an annealing temperature of 450 °C, the Cu0 peaks are no longer visible and the diffractogram shows less intense peaks of Cu2O peaks at 36.43° 2θ and 42.32° 2θ. In addition, other high-intensity diffraction peaks appear at 35.53° 2θ, 38.65° 2θ, 48.85° 2θ, and 61.59° 2θ. These are assigned to the (002), (11-1), (20-2), and (11-3) planes, respectively, from copper (II) oxide in the monoclinic phase (CuO, tenorite, ICSD Card No. 98-004-3179) and confirm the oxidation of the nanowires inferred by the color change after annealing.
The Scherrer equation was used for the determination of the crystal size based on the most intense peaks of each diffraction pattern. Figure 3b displays the correlation of the crystal size and the annealing temperature along with their corresponding SEM image. Results show an expansion of the as-synthesized Cu2O crystals from 44.24 nm to 81.25 nm after annealing at 205 °C; an increase of the nanowire diameter from ~60 nm to ~99 nm is also observed after annealing. These changes are attributed to the oxidation process of the copper oxide [21,39]. In contrast, the increase of the annealing temperature to 450 °C diminishes the crystal size to 24.59 nm and promotes the formation of agglomerates that make the nanowire surface texture rough and increase the nanowire diameter to ~125 nm, as identified by HR-SEM (Figure 2 and inset in Figure 3b).
The surface chemical composition was also evaluated by XPS for the as-synthesized and annealed samples. Overall, the spectra (Figure 4) display typical Cu 2p3/2 peaks and their corresponding satellites separated by a binding energy of ~8 eV as reported in previous literature [40]. The (Cu0 + Cu+) and Cu2+ species at the surface are quantified by the Jasienek and Gerson methodology [41], which uses the deconvoluted peaks of Cu 2p3/2 and their closest satellite peaks for the estimation. Previous studies suggest these satellites are present due to the partially filled d-orbital (d9) of the Cu2+ oxidation state, and therefore, their presence and intensity relate to the concentration of the Cu2+ at the surface [40,42,43,44].
As can be seen in Figure 4a, the Cu 2p3/2 spectra of the as-synthesized sample show a main peak located at 933.54 eV that can be deconvoluted in two components, located at 932.3 eV and 934.5 eV and assigned to (Cu0 + Cu+) and Cu2+ oxidation states, respectively. The spectrum also shows a less intense satellite peak located at ~942.3 eV and deconvoluted in two components. After annealing at 205 °C (Figure 4b), the Cu2+ component shows a higher contribution to the main Cu 2p3/2 peak. Simultaneously, the satellite peaks (which only relate to Cu2+) become more intense due to the increase in the percentage of Cu2+ (61.2%). Similarly, annealing of the samples at 450 °C (Figure 4c) increases the presence of the Cu2+ component in the main Cu 2p3/2 peak, as well as the intensity of the satellite peaks, which suggests a significant increment (98.1%) of the Cu2+ oxidation state content in the sample compared to the initial as-synthesized structures.
3.4. Gas Sensing Properties of the Copper Oxide Nanowires
The gas sensing tests of the nanowires annealed at 205 and 450 °C focused firstly on studying the dependence of the response to the operating temperature. These tests were run in the range of 205 and 285 °C using carbon monoxide as the target analyte. The responses proved good repeatability, showing insignificant deviation in the magnitude or dynamic of the response for the measures realized during the same period (Figure 5a,b). The response deviations were also insignificant for other gas analytes, including acetone, ethanol, and toluene. Overall, the samples showed a proportional increase in the response to the temperature. For instance, the responses to carbon monoxide at 285 °C proved ~4 times higher than those at 205 °C. This behavior is opposite to the response time, which decreased with the temperature from 600 s to approximately 110 s, displaying a high decrement between 205 and 220 °C and moderate decrement between 220 and 285 °C.
Along the tests, we could observe that sensors based on the nanowires annealed at 450 °C kept relatively good stability during the two testing periods separated by six months, showing a loss of response minor to 15% for carbon monoxide, toluene, and acetone; the loss of response for ethanol was higher (27%). In contrast, the sensors based on the nanowires annealed at 205 °C showed early damage (Figure 5c). This was most likely caused by the instability of the nanowire morphology in the temperature range used for the gas tests, as proved above by the material analysis. In this context, hereafter, the gas sensing properties of the copper oxide nanowires annealed at 450 °C, i.e., those composed mainly of CuO, towards various gases (acetone, ethanol, toluene, carbon monoxide) and concentrations, are shown.
The response variation as a function of the target gas concentrations is presented in Figure 6a. The trends of these results describe typical power-law fitting curves with higher responses for acetone and ethanol compared to carbon monoxide and toluene. The power-law prefactors displayed in Figure 6a and plotted as a bar diagram in Figure 6b indicate that the sensitivity of the CuO nanowires is higher for acetone compared to the other analytes. These results also indicate good selectivity for the nanowires towards acetone.
The results in Figure 7 display the typical resistance changes registered for the nanowires annealed at 450 °C during the first and second testing periods towards various concentrations of acetone and ethanol. The dynamic of the response in both periods and for both gases reveals fast responses with a complete recovery of the baseline resistance. The response to 80 ppm of acetone during the first testing period, for instance, registered a response time (tr) of 210 s and a recovery time (trec) of 270 s; these characteristics are better than those recorded for ethanol, tr = 270 s, and trec = 720 s. We also observed that the baseline resistance kept relatively stable (around 8 kΩ) within each period with little changes along the whole testing time of ±1.2 kΩ for the operating temperature of 285 °C.
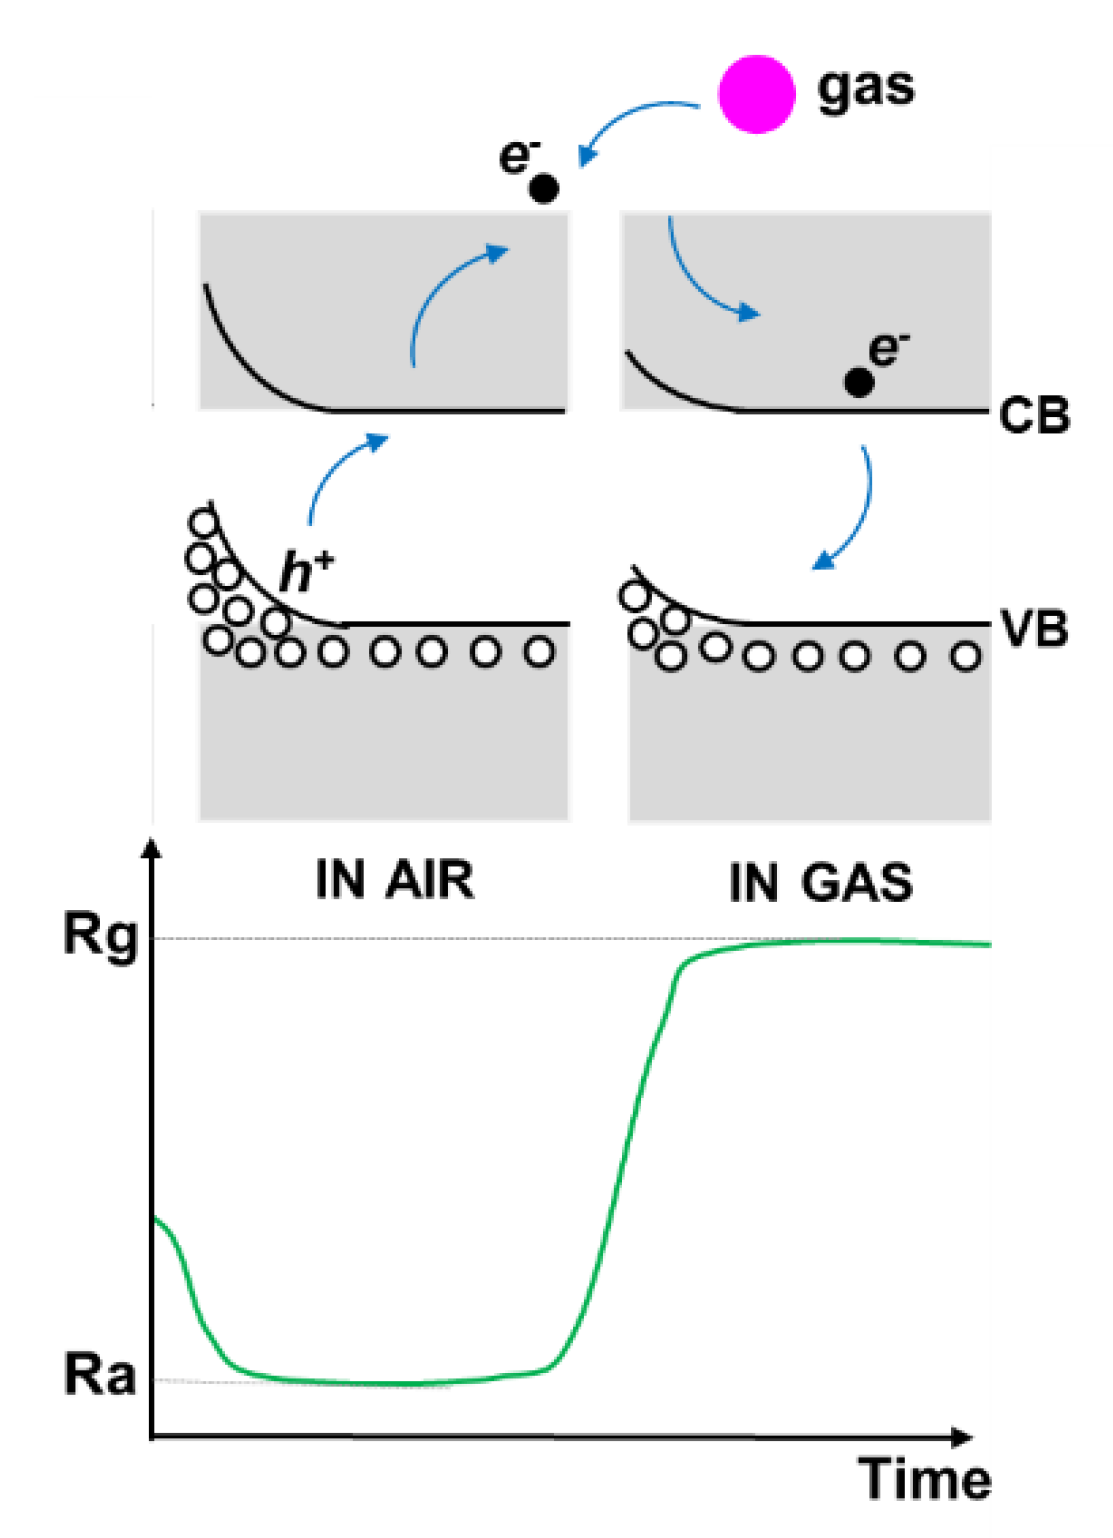
CuO typically behaves as a p-type semiconductor. As such, it responds to reducing gases by increasing its electrical resistance proportionally to the gas concentration [45,46], consistent with the results observed in Figure 7. This is because oxygen adsorption at the nanowire surface captures electrons from the CuO conduction band, increasing the density of hole carriers and forming an accumulation hole layer at the nanowire surface. At this initial stage, the electrical resistance of the CuO nanowires decreases, as depicted in Figure 8 (left). Upon CuO exposure to reducing gases, such as acetone or ethanol, the gaseous chemicals react with the pre-adsorbed oxygen on the surface, leading to the release of the trapped electrons back to the conduction band and in turn to the reduction of the hole accumulation layer. Consequently, the electrical resistance of the nanowires increases, as shown in Figure 8 (right). This process is reversible and repeatable, as confirmed by the tests of the hydrothermally synthesized CuO nanowires.
A comparison of our results and those registered in the literature for CuO with varied morphologies from films [8] and nanoparticles [19] to nanorods [47] and nanowires [9,14] are summarized in Table 1. The left side of the table provides information about the synthesis method and morphology of CuO tested, whereas the right side displays the operation temperature and gas concentration annotated in each reference. The color codes from blue to red and numbers from 1 to 10 along each column show the response to each targeted gas and its load in percentage for the highest response (colored in red and labeled as 10). Thus, for instance, the first row displays our results and indicates that the hydrothermally synthesized CuO nanowires respond preferentially to acetone and ethanol (both in red color 10) instead of carbon monoxide (green 4) and toluene (cyan 3), which comparatively present lower responses. The literature reports corroborate this fact by showing noteworthy sensitivities to acetone [8,9,14] and ethanol [47]. However, they also suggest the relevance of CuO as a good candidate to sense n-propanol [14], toluene [19], and benzaldehyde [9], suggesting these gases may have high cross-responses among them and with acetone and ethanol.
Overall, the literature reports on copper oxides for gas sensing (Table 1) refer to CuO as the sensitive element, without clarifying its relationship with other copper oxide stoichiometry in the samples or its thermal stability. Although these characteristics might not represent a significant change in the sensitivity or response magnitudes of copper oxide (as registered in our results, Figure 5), we observed that they are relevant to the physical properties, inducing morphological and structural transformations that affect the stability of the sensor (Figure 3 and Figure 4). The data collected in Table 1 reveal that the maximum responses for intrinsic CuO are for temperatures between 160 °C to 320 °C. Moreover, our results consistently showed that the nanowires annealed at higher temperatures (450 °C) than those required for the sensor operation have a longer operation life than those stabilized at lower temperatures (205 °C), as observed in our results in Figure 5 and Figure 7. In this context, it is concluded that the use of CuO in gas sensing requires a significant control not only of the synthesis process but also of the post-thermal treatments to ensure a chemically stable surface and the middle/long-term stability of CuO nanowires-based gas sensor for their practical application.
4. Conclusions
This work discussed the control parameters of hydrothermal synthesis for the selective formation of copper oxide nanowires and the effects of the thermal post-treatment process on the nanowires’ physical, chemical, and gas sensing properties. Results pointed out the pyrrole concentration and the reaction time as the most influencing parameters for the formation and dominance (in the resulting powders) of long and smooth surface nanowires (25 µm in length and 50–200 nm diameter). The surface morphology and the chemical composition of the nanowires demonstrated to depend strongly on the annealing temperatures, particularly at high temperatures (450 °C), at which the roughness of nanowires’ surface increased due to the formation of nanocrystals and completed the oxidation of Cu0 and Cu+ to Cu2+. The lifetime of the sensors based on the hydrothermally synthesized copper oxide nanowires suggested depending on the annealing-induced physical and chemical changes, in contrast to the sensitivity and magnitude of the response, which showed low variations. Overall, the copper oxide nanowires showed high sensitivity and selectivity to acetone, consistent with other reports in the literature.
Author Contributions
M.C.; synthesis and characterization of nanowires, M.C. and S.V.; XPS and morphological characterization analysis, I.G. and E.F.; gas sensing test, M.C.; writing—original draft preparation, M.C., S.V., I.G. and E.F.; writing—review and editing. S.V.; funding acquisition. All authors have read and agreed to the published version of the manuscript.
Funding
This research was funded by the Czech Science Foundation (GAČR) via Grant no. 20-20123S.
Institutional Review Board Statement
Not applicable.
Informed Consent Statement
Not applicable.
Data Availability Statement
Not applicable.
Acknowledgments
This research was made using the infrastructures of CEITEC NanoLab Research Infrastructure supported by MEYS CR (LM2018110). We also acknowledge the support of the MCIN/AEI/10.13039/501100011033 via Grant PID2019-107697RB-C42 (ERDF A way of making Europe).
Conflicts of Interest
The authors declare no conflict of interest.
References
- Zhai, T.; Yao, J. One-Dimensional Nanostructures: Principles and Applications; John Wiley & Sons, Inc.: Hoboken, NJ, USA, 2013. [Google Scholar] [CrossRef]
- Hontañón, E.; Vallejos, S. One-Dimensional Metal Oxide Nanostructures for Chemical Sensors. In 21st Century Nanostructured Materials—Physics, Chemistry, Classification, and Emerging Applications in Industry, Biomedicine, and Agriculture; IntechOpen: London, UK, 2022; ISBN 978-1-80355-085-5. [Google Scholar] [CrossRef]
- Liang, J.; Kishi, N.; Soga, T.; Jimbo, T. The synthesis of highly aligned cupric oxide nanowires by heating copper foil. J. Nanomater. 2011, 2011, 268508. [Google Scholar] [CrossRef]
- Kang, K.; Park, J.; Kim, B.; Na, K.; Cho, I.; Rho, J.; Yang, D.; Lee, J.Y.; Park, I. Self-Powered Gas Sensor Based on a Photovoltaic Cell and a Colorimetric Film with Hierarchical Micro/Nanostructures. ACS Appl. Mater. Interfaces 2020, 12, 39024–39032. [Google Scholar] [CrossRef] [PubMed]
- Umar, A.; Ibrahim, A.A.; Nakate, U.T.; Albargi, H.; Alsaiari, M.A.; Ahmed, F.; Alharthi, F.A.; Ali Alghamdi, A.; Al-Zaqri, N. Fabrication and characterization of CuO nanoplates based sensor device for ethanol gas sensing application. Chem. Phys. Lett. 2021, 763, 138204. [Google Scholar] [CrossRef]
- Hu, Q.; Zhang, W.; Wang, X.; Wang, Q.; Huang, B.; Li, Y.; Hua, X.; Liu, G.; Li, B.; Zhou, J.; et al. Binder-free CuO nanoneedle arrays based tube-type sensor for H2S gas sensing. Sens. Actuators B Chem. 2021, 326, 128993. [Google Scholar] [CrossRef]
- Umar, A.; Alshahrani, A.A.; Algarni, H.; Kumar, R. CuO nanosheets as potential scaffolds for gas sensing applications. Sens. Actuators B Chem. 2017, 250, 24–31. [Google Scholar] [CrossRef]
- Hien, V.X.; Minh, N.H.; Son, D.T.; Nghi, N.T.; Phuoc, L.H.; Khoa, C.T.; Vuong, D.D.; Chien, N.D.; Heo, Y.W. Acetone sensing properties of CuO nanowalls synthesized via oxidation of Cu foil in aqueous NH4OH. Vacuum 2018, 150, 129–135. [Google Scholar] [CrossRef]
- Yang, F.; Guo, J.; Liu, M.; Yu, S.; Yan, N.; Li, J.; Guo, Z. Design and understanding of a high-performance gas sensing material based on copper oxide nanowires exfoliated from a copper mesh substrate. J. Mater. Chem. A 2015, 3, 20477–20481. [Google Scholar] [CrossRef]
- Şişman, O.; Kılınç, N.; Öztürk, Z.Z. Structural, electrical and H2 sensing properties of copper oxide nanowires on glass substrate by anodization. Sens. Actuators B Chem. 2016, 236, 1118–1125. [Google Scholar] [CrossRef]
- Sondors, R.; Kosmaca, J.; Kunakova, G.; Jasulaneca, L.; Ramma, M.M.; Meija, R.; Kauranens, E.; Antsov, M.; Erts, D. Size distribution, mechanical and electrical properties of cuo nanowires grown by modified thermal oxidation methods. Nanomaterials 2020, 10, 1051. [Google Scholar] [CrossRef]
- Zhong, M.L.; Zeng, D.C.; Liu, Z.W.; Yu, H.Y.; Zhong, X.C.; Qiu, W.Q. Synthesis, growth mechanism and gas-sensing properties of large-scale CuO nanowires. Acta Mater. 2010, 58, 5926–5932. [Google Scholar] [CrossRef]
- Pathiraja, G.; Yarbrough, R.; Rathnayake, H. Fabrication of ultrathin CuO nanowires augmenting oriented attachment crystal growth directed self-assembly of Cu(OH)2 colloidal nanocrystals. Nanoscale Adv. 2020, 2, 2897–2906. [Google Scholar] [CrossRef]
- Tan, J.; Dun, M.; Li, L.; Zhao, J.; Li, X.; Hu, Y.; Huang, G.; Tan, W.; Huang, X. Self-template derived CuO nanowires assembled microspheres and its gas sensing properties. Sens. Actuators B Chem. 2017, 252, 1–8. [Google Scholar] [CrossRef]
- Tan, Y.; Xue, X.; Peng, Q.; Zhao, H.; Wang, T.; Li, Y. Controllable fabrication and electrical performance of single crystalline Cu2O nanowires with high aspect ratios. Nano Lett. 2007, 7, 3723–3728. [Google Scholar] [CrossRef]
- Du, G.H.; Van Tendeloo, G. Cu(OH)2 nanowires, CuO nanowires and CuO nanobelts. Chem. Phys. Lett. 2004, 393, 64–69. [Google Scholar] [CrossRef]
- Shi, G.; Liu, J.; Chen, B.; Bao, Y.; Xu, J. Phase-controlled growth of cubic phase CuO nanoparticles by chemical vapor deposition. IPSS Appl. Mater. Sci. 2017, 214, 1700041. [Google Scholar] [CrossRef]
- Cao, M.; Wang, Y.; Guo, C.; Qi, Y.; Hu, C.; Wang, E. A simple route towards CuO nanowires and nanorods. J. Nanosci. Nanotechnol. 2004, 4, 824–828. [Google Scholar] [CrossRef]
- Gounder Thangamani, J.; Khadheer Pasha, S.K. Hydrothermal synthesis of copper (II) oxide-nanoparticles with highly enhanced BTEX gas sensing performance using chemiresistive sensor. Chemosphere 2021, 277, 130237. [Google Scholar] [CrossRef]
- Mohamed, R.M.; Harraz, F.A.; Shawky, A. CuO nanobelts synthesized by a template-free hydrothermal approach with optical and magnetic characteristics. Ceram. Int. 2014, 40, 2127–2133. [Google Scholar] [CrossRef]
- Kevin, M.; Ong, W.L.; Lee, G.H.; Ho, G.W. Formation of hybrid structures: Copper oxide nanocrystals templated on ultralong copper nanowires for open network sensing at room temperature. Nanotechnology 2011, 22, 235701. [Google Scholar] [CrossRef]
- Filipič, G.; Cvelbar, U. Copper oxide nanowires: A review of growth. Nanotechnology 2012, 23, 194001. [Google Scholar] [CrossRef]
- Zoolfakar, A.S.; Rani, R.A.; Morfa, A.J.; O’Mullane, A.P.; Kalantar-Zadeh, K. Nanostructured copper oxide semiconductors: A perspective on materials, synthesis methods and applications. J. Mater. Chem. C 2014, 2, 5247–5270. [Google Scholar] [CrossRef]
- Rajabzadeh, M.; Khalifeh, R.; Eshghi, H.; Sorouri, M. Design and Preparation of Hallow Mesoporous Silica Spheres Include CuO and Its Catalytic Performance for Synthesis of 1,2,3-Triazole Compounds via the Click Reaction in Water. Catal. Lett. 2019, 149, 1125–1134. [Google Scholar] [CrossRef]
- Arfaoui, L.; Janene, F.; Kouass, S.; Mignard, S.; Touati, F.; Dhaouadi, H. CuO Nanosheets: Synthesis, Characterization, and Catalytic Performance. Russ. J. Inorg. Chem. 2019, 64, 1687–1696. [Google Scholar] [CrossRef]
- Siddiqui, H.; Qureshi, M.S.; Haque, F.Z. Biosynthesis of Flower-Shaped CuO Nanostructures and Their Photocatalytic and Antibacterial Activities. Nano Micro Lett. 2020, 12, 29. [Google Scholar] [CrossRef] [PubMed]
- Arshad, A.; Iqbal, J.; Siddiq, M.; Ali, M.U.; Ali, A.; Shabbir, H.; Nazeer, U.B.; Saleem, M.S. Solar light triggered catalytic performance of graphene-CuO nanocomposite for waste water treatment. Ceram. Int. 2017, 43, 10654–10660. [Google Scholar] [CrossRef]
- Dubal, D.P.; Gund, G.S.; Holze, R.; Jadhav, H.S.; Lokhande, C.D.; Park, C.J. Surfactant-assisted morphological tuning of hierarchical CuO thin films for electrochemical supercapacitors. Dalt. Trans. 2013, 42, 6459–6467. [Google Scholar] [CrossRef]
- Li, Y.; Zhang, Q.; Li, J. Direct electrochemistry of hemoglobin immobilized in CuO nanowire bundles. Talanta 2010, 83, 162–166. [Google Scholar] [CrossRef]
- Stepniowski, W.J.; Misiolek, W.Z. Review of Fabrication Methods, Physical Properties, and Applications of Nanostructured Copper Oxides Formed via Electrochemical Oxidation. Nanomaterials 2018, 8, 379. [Google Scholar] [CrossRef] [Green Version]
- Steinhauer, S. Gas Sensors Based on Copper Oxide Nanomaterials: A Review. Chemosensors 2021, 9, 51. [Google Scholar] [CrossRef]
- Hozák, P.; Vorokhta, M.; Khalakhan, I.; Jarkovská, K.; Cibulková, J.; Fitl, P.; Vlček, J.; Fara, J.; Tomeček, D.; Novotný, M.; et al. New Insight into the Gas-Sensing Properties of CuOx Nanowires by Near-Ambient Pressure XPS. J. Phys. Chem. C 2019, 123, 29739–29749. [Google Scholar] [CrossRef]
- Vallejos, S.; Grácia, I.; Chmela, O.; Figueras, E.; Hubálek, J.; Cané, C. Chemoresistive micromachined gas sensors based on functionalized metal oxide nanowires: Performance and reliability. Sens. Actuators B Chem. 2016, 235, 525–534. [Google Scholar] [CrossRef]
- Kasisomayajula, S.; Jadhav, N.; Gelling, V.J. In situ preparation and characterization of a conductive and magnetic nanocomposite of polypyrrole and copper hydroxychloride. RSC Adv. 2015, 6, 967–977. [Google Scholar] [CrossRef]
- Stoesser, A.; von Seggern, F.; Purohit, S.; Nasr, B.; Kruk, R.; Dehm, S.; Wang, D.; Hahn, H.; Dasgupta, S. Facile fabrication of electrolyte-gated single-crystalline cuprous oxide nanowire field-effect transistors. Nanotechnology 2016, 27, 415205. [Google Scholar] [CrossRef] [PubMed]
- Cao, F.; Jia, S.; Zheng, H.; Zhao, L.; Liu, H.; Li, L.; Zhao, L.; Hu, Y.; Gu, H.; Wang, J. Thermal-induced formation of domain structures in CuO nanomaterials. Phys. Rev. Mater. 2017, 1, 053401. [Google Scholar] [CrossRef]
- Han, Z.; Lu, L.; Zhang, H.W.; Yang, Z.Q.; Wang, F.H.; Lu, K. Comparison of the Oxidation Behavior of Nanocrystalline and Coarse-Grain Copper. Oxid. Met. 2005, 63, 261–275. [Google Scholar] [CrossRef]
- Yabuki, A.; Tanaka, S. Oxidation behavior of copper nanoparticles at low temperature. Mater. Res. Bull. 2011, 46, 2323–2327. [Google Scholar] [CrossRef]
- Mardiansyah, D.; Badloe, T.; Triyana, K.; Mehmood, M.Q.; Raeis-Hosseini, N.; Lee, Y.; Sabarman, H.; Kim, K.; Rho, J. Effect of temperature on the oxidation of Cu nanowires and development of an easy to produce, oxidation-resistant transparent conducting electrode using a PEDOT:PSS coating. Sci. Rep. 2018, 8, 10639. [Google Scholar] [CrossRef]
- Biesinger, M.C. Advanced analysis of copper X-ray photoelectron spectra. Surf. Interface Anal. 2017, 49, 1325–1334. [Google Scholar] [CrossRef]
- Biesinger, M.C.; Payne, B.P.; Grosvenor, A.P.; Lau, L.W.M.W.; Gerson, A.R.; Smart, R.S.C.; StC Smart, R. Resolving surface chemical states in XPS analysis of first row transition metals, oxides and hydroxides: Cr, Mn, Fe, Co and Ni. Appl. Surf. Sci. 2011, 257, 2717–2730. [Google Scholar] [CrossRef]
- Vuong, N.M.; Chinh, N.D.; Huy, B.T.; Lee, Y.I. CuO-decorated ZnO hierarchical nanostructures as efficient and established sensing materials for H2S Gas Sensors. Sci. Rep. 2016, 6, 26736. [Google Scholar] [CrossRef]
- Grosvenor, A.P.; Kobe, B.A.; Biesinger, M.C.; McIntyre, N.S. Investigation of multiplet splitting of Fe 2p XPS spectra and bonding in iron compounds. Surf. Interface Anal. 2004, 36, 1564–1574. [Google Scholar] [CrossRef]
- Claros, M.; Setka, M.; Jimenez, Y.P.; Vallejos, S. AACVD Synthesis and Characterization of Iron and Copper Oxides Modified ZnO Structured Films. Nanomaterials 2020, 10, 471. [Google Scholar] [CrossRef] [PubMed]
- Bejaoui, A.; Guerin, J.; Aguir, K. Modeling of a p-type resistive gas sensor in the presence of a reducing gas. Sens. Actuators B Chem. 2013, 181, 340–347. [Google Scholar] [CrossRef]
- Li, Z.; Li, H.; Wu, Z.; Wang, M.; Luo, J.; Torun, H.; Hu, P.; Yang, C.; Grundmann, M.; Liu, X.; et al. Advances in designs and mechanisms of semiconducting metal oxide nanostructures for high-precision gas sensors operated at room temperature. Mater. Horiz. 2019, 6, 470–506. [Google Scholar] [CrossRef]
- Yang, C.; Su, X.; Xiao, F.; Jian, J.; Wang, J. Gas sensing properties of CuO nanorods synthesized by a microwave-assisted hydrothermal method. Sens. Actuators B Chem. 2011, 158, 299–303. [Google Scholar] [CrossRef]
Figure 1.
Illustration of the morphology changes as a result of the processing time and pyrrole concentration variations during the hydrothermal process of copper acetate.
Figure 1.
Illustration of the morphology changes as a result of the processing time and pyrrole concentration variations during the hydrothermal process of copper acetate.
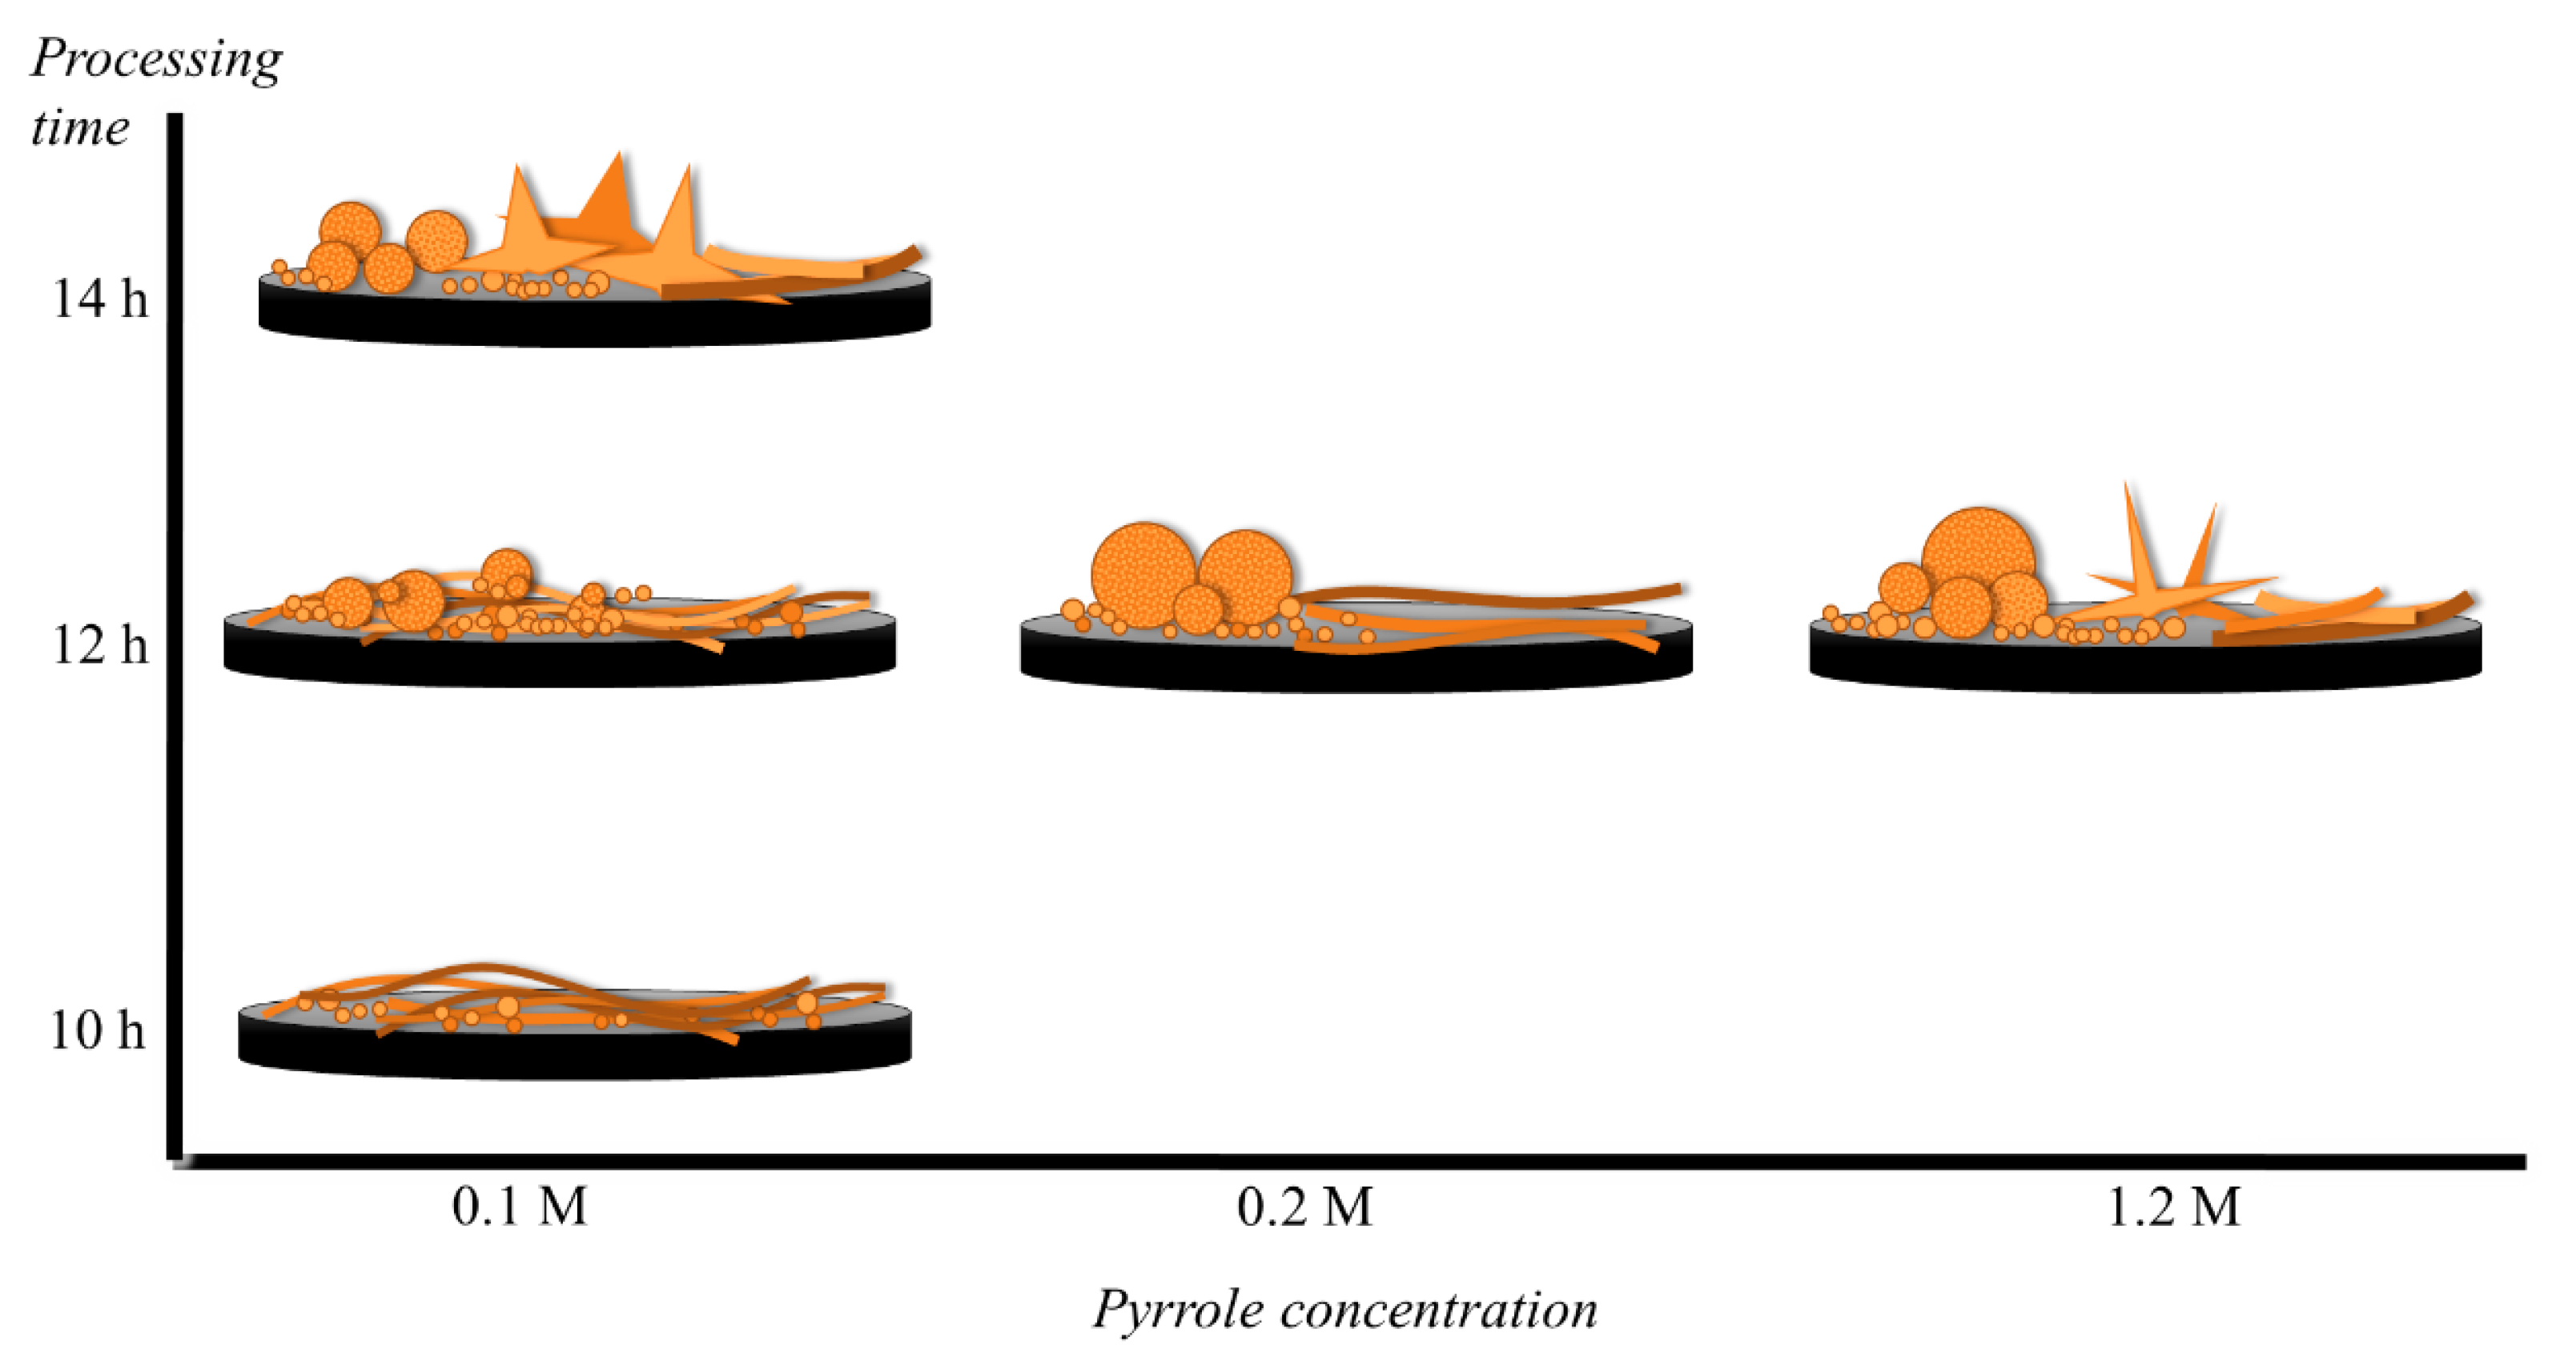
Figure 2.
(a) SEM and (b) HR-SEM images of the as-obtained samples. HR-SEM images of the samples annealed at (c) 205 °C and (d) 450 °C.
Figure 2.
(a) SEM and (b) HR-SEM images of the as-obtained samples. HR-SEM images of the samples annealed at (c) 205 °C and (d) 450 °C.
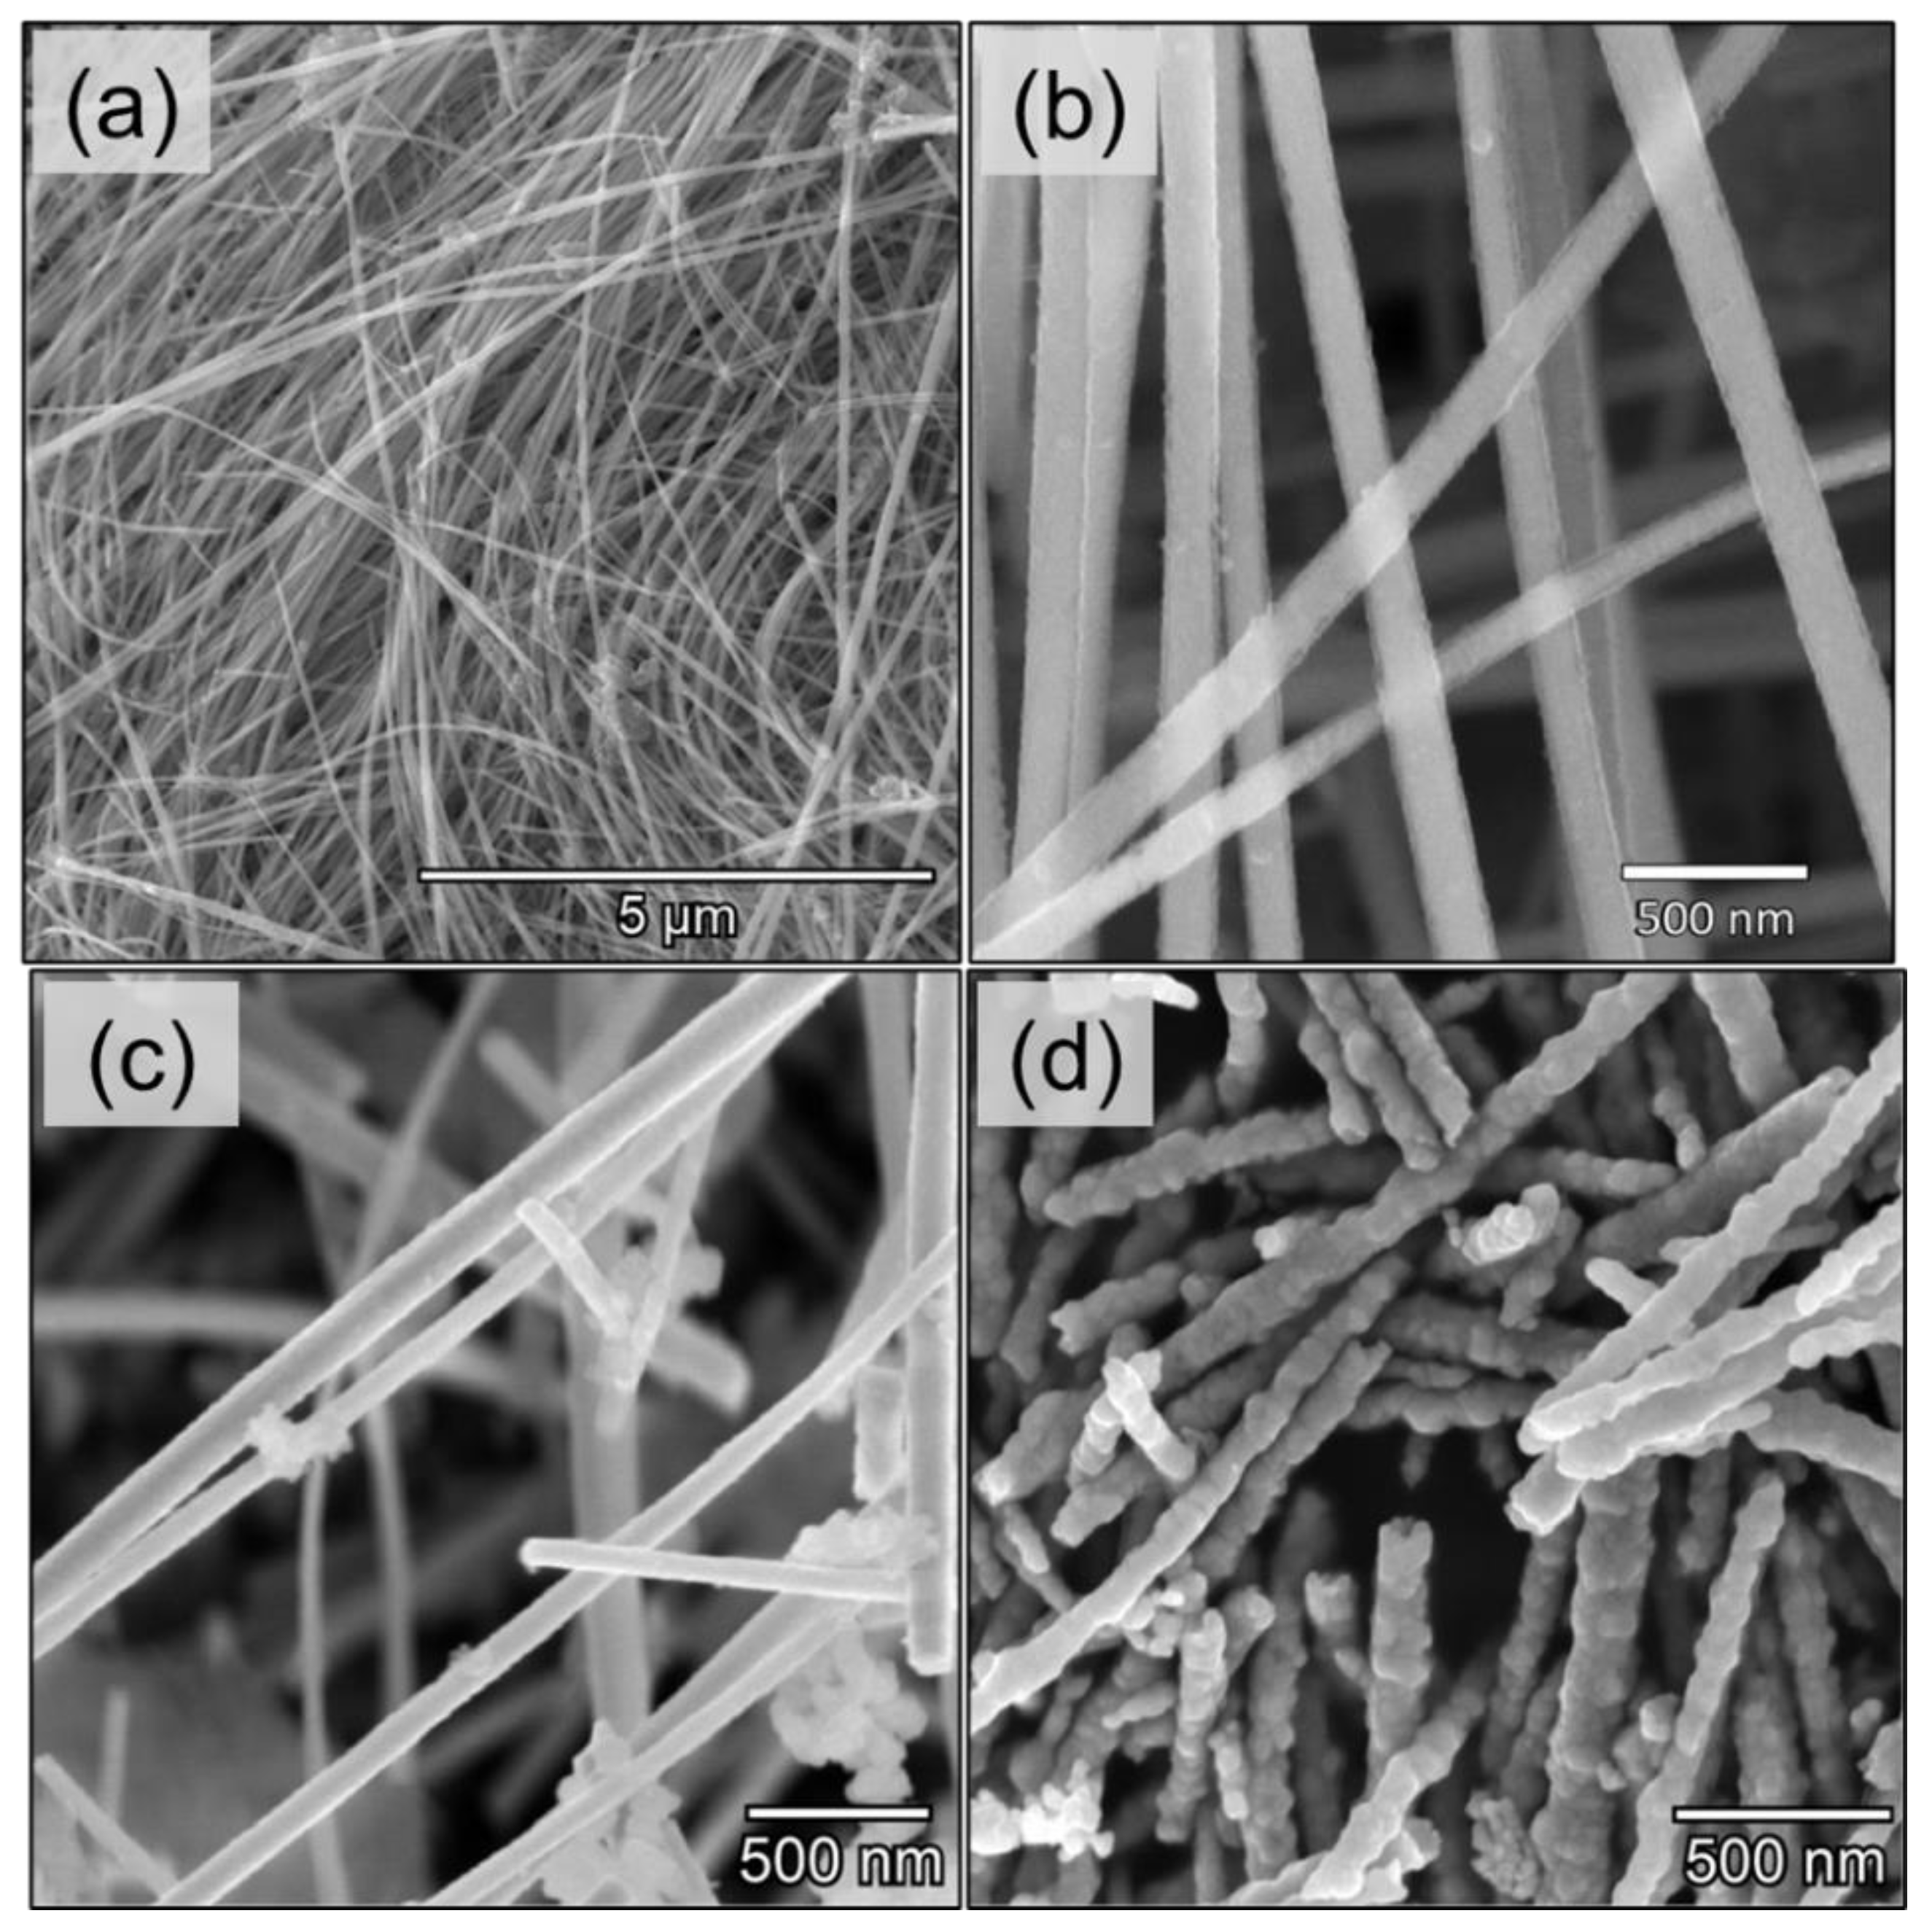
Figure 3.
(a) XRD diffractogram for the copper oxide nanowires as-obtained (green circle), annealed at 205 °C (dark blue circle) and at 450 °C (light blue circle), (b) change of crystal size, phase, and nanowire morphology with annealing temperature.
Figure 3.
(a) XRD diffractogram for the copper oxide nanowires as-obtained (green circle), annealed at 205 °C (dark blue circle) and at 450 °C (light blue circle), (b) change of crystal size, phase, and nanowire morphology with annealing temperature.

Figure 4.
Cu 2p3/2 core level XPS spectra and deconvolution curves for the (a) as-synthesized and annealed samples at (b) 205 °C and (c) 450°C.
Figure 4.
Cu 2p3/2 core level XPS spectra and deconvolution curves for the (a) as-synthesized and annealed samples at (b) 205 °C and (c) 450°C.

Figure 5.
Temperature dependence of the response and response time of the copper oxide nanowires annealed at, (a) 205 °C and (b) 450 °C to 80 ppm of carbon monoxide during the first test period, and (c) replicates of the response to 80 ppm of various gases during six months (operating temperature: 285 °C). The zero value in (c) represents the impossibility to obtain a measure due to the early damage of the sensor. Empty and filled symbols stand for the annealed samples at 205 and 450 °C, respectively.
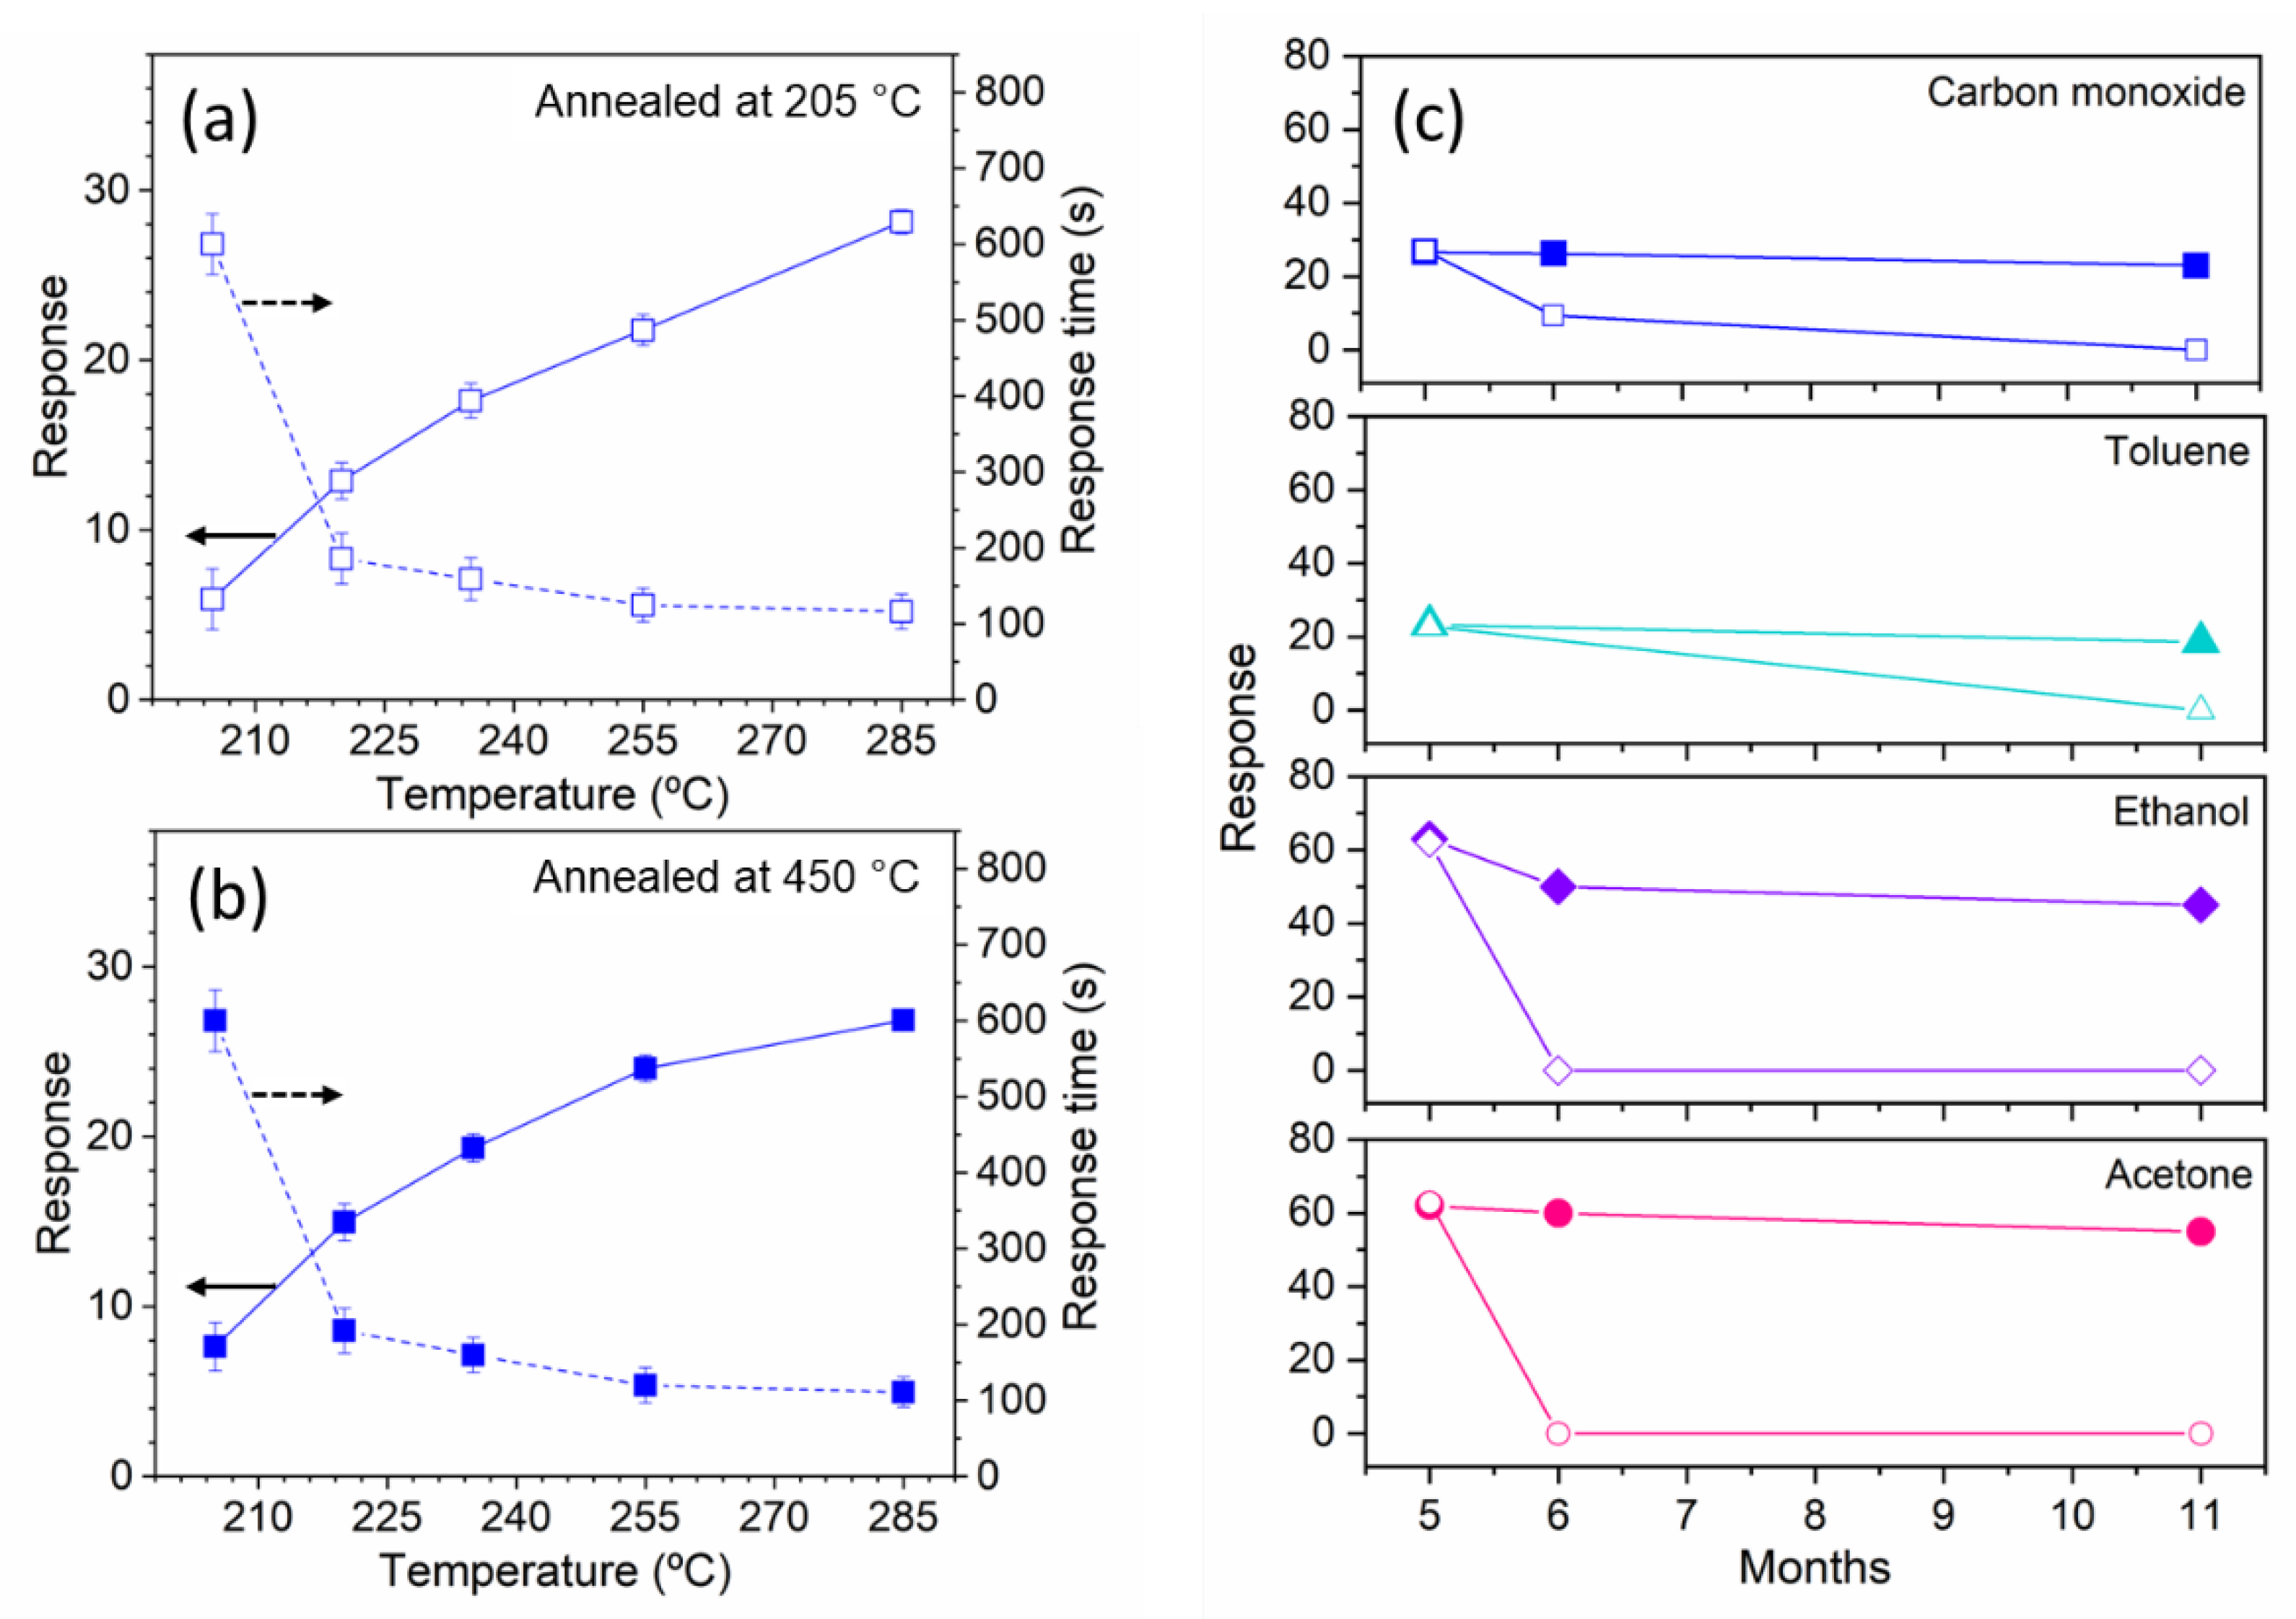
Figure 6.
Summary of the gas sensing results obtained at 285 °C for the samples annealed at 450 °C. (a) Dependency of the response to acetone, ethanol, toluene, and carbon monoxide concentration. (b) CuO nanowires’ sensitivity to acetone, ethanol, toluene, and carbon monoxide.
Figure 6.
Summary of the gas sensing results obtained at 285 °C for the samples annealed at 450 °C. (a) Dependency of the response to acetone, ethanol, toluene, and carbon monoxide concentration. (b) CuO nanowires’ sensitivity to acetone, ethanol, toluene, and carbon monoxide.
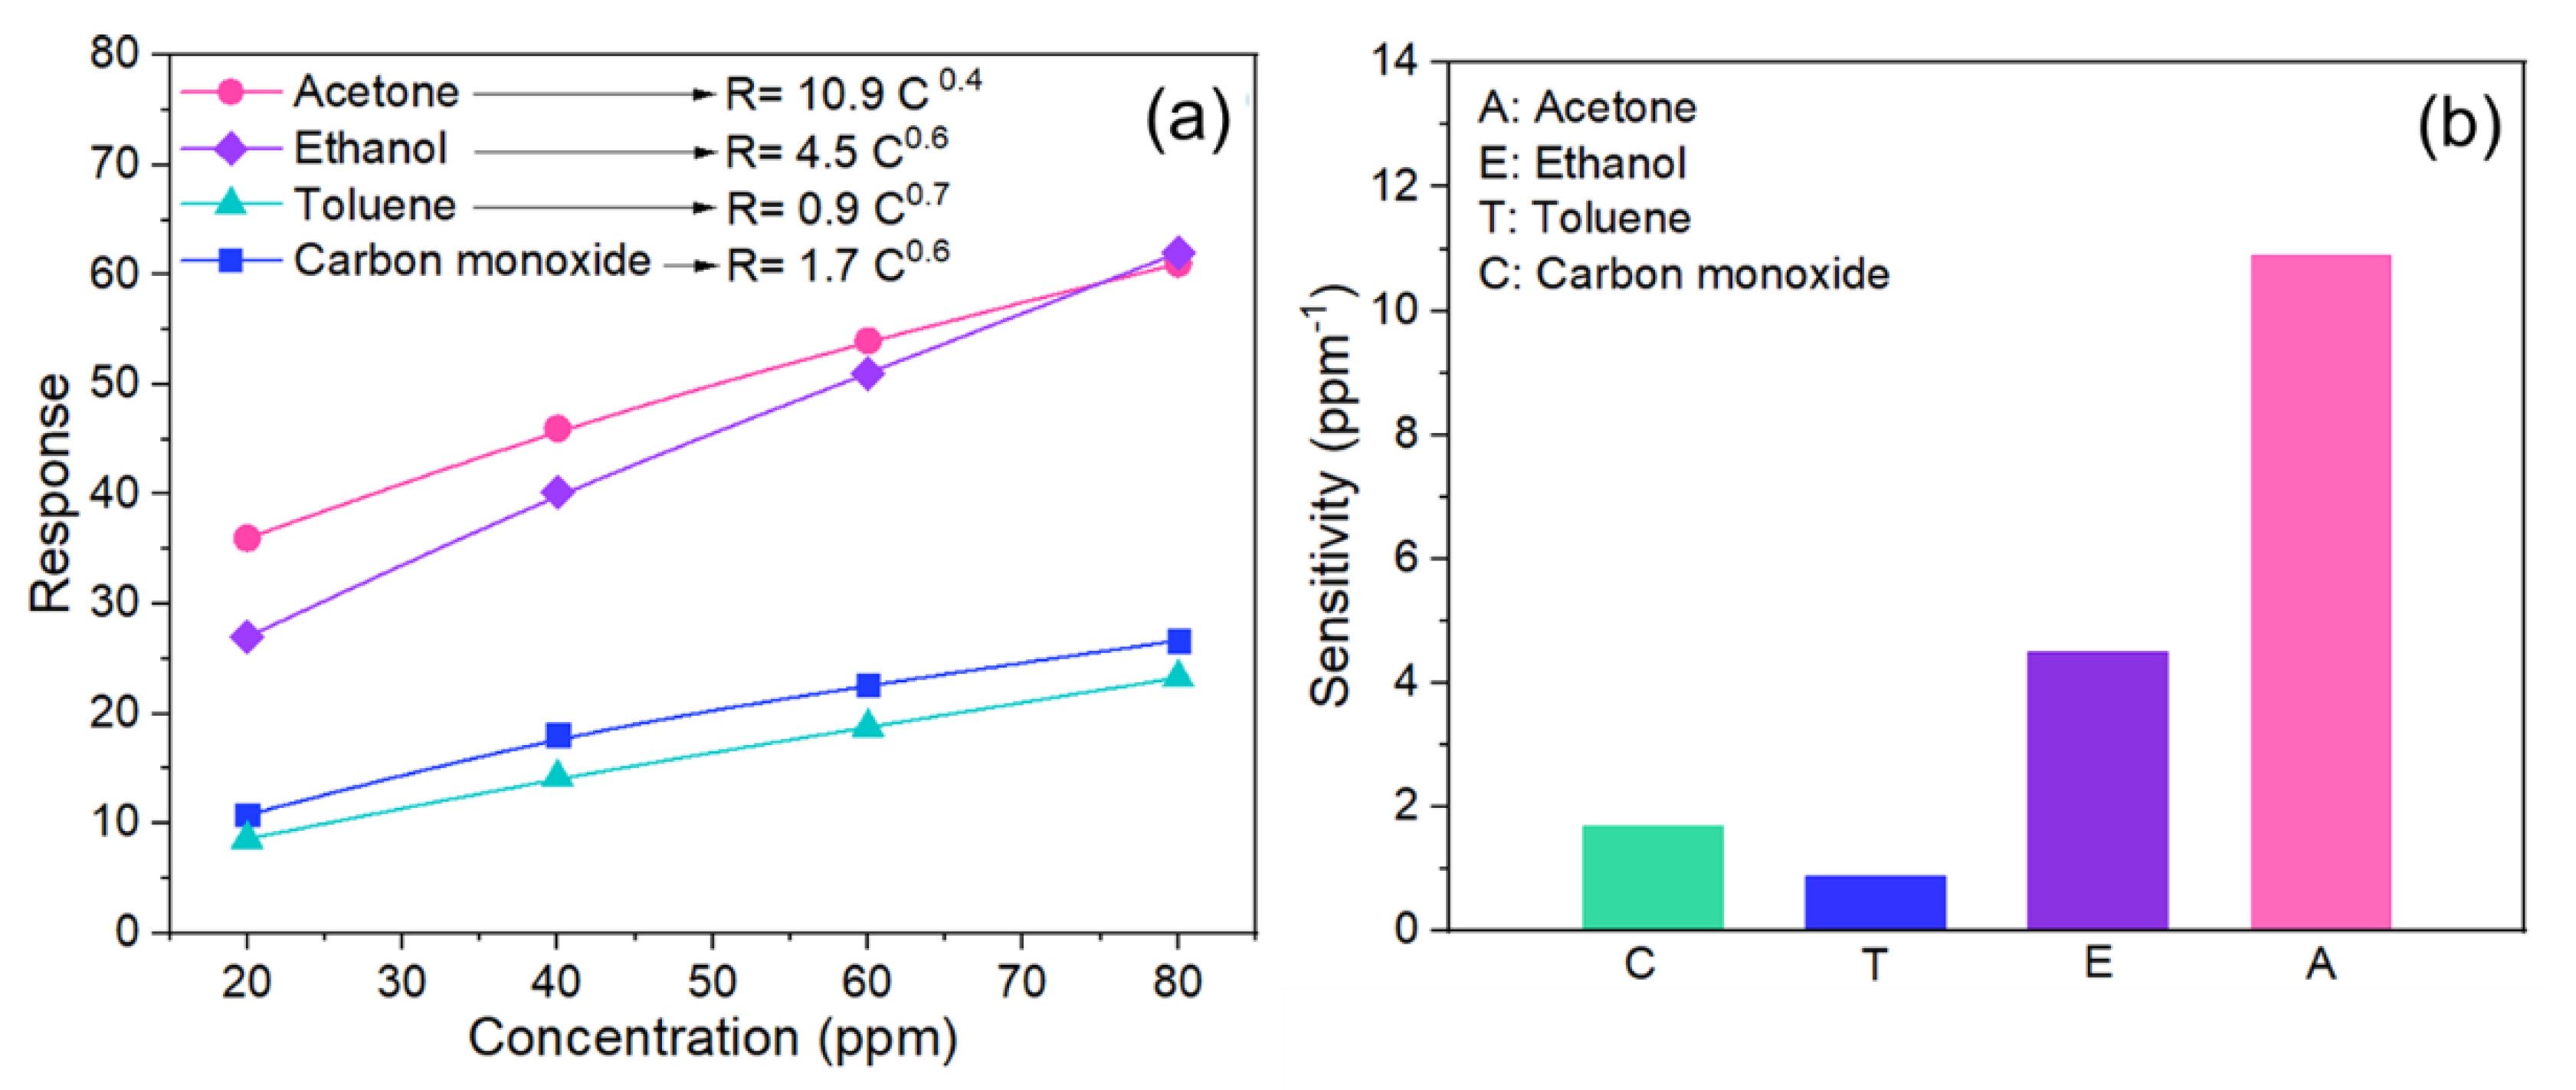
Figure 7.
Comparison of the resistance changes for the samples annealed at 450 °C toward various concentrations of (a) acetone and (b) ethanol measured at 285 °C during the first and second testing periods. The resistance is represented by a line with symbols, whereas the concentrations are displayed as pink and purple bars for acetone and ethanol, respectively.
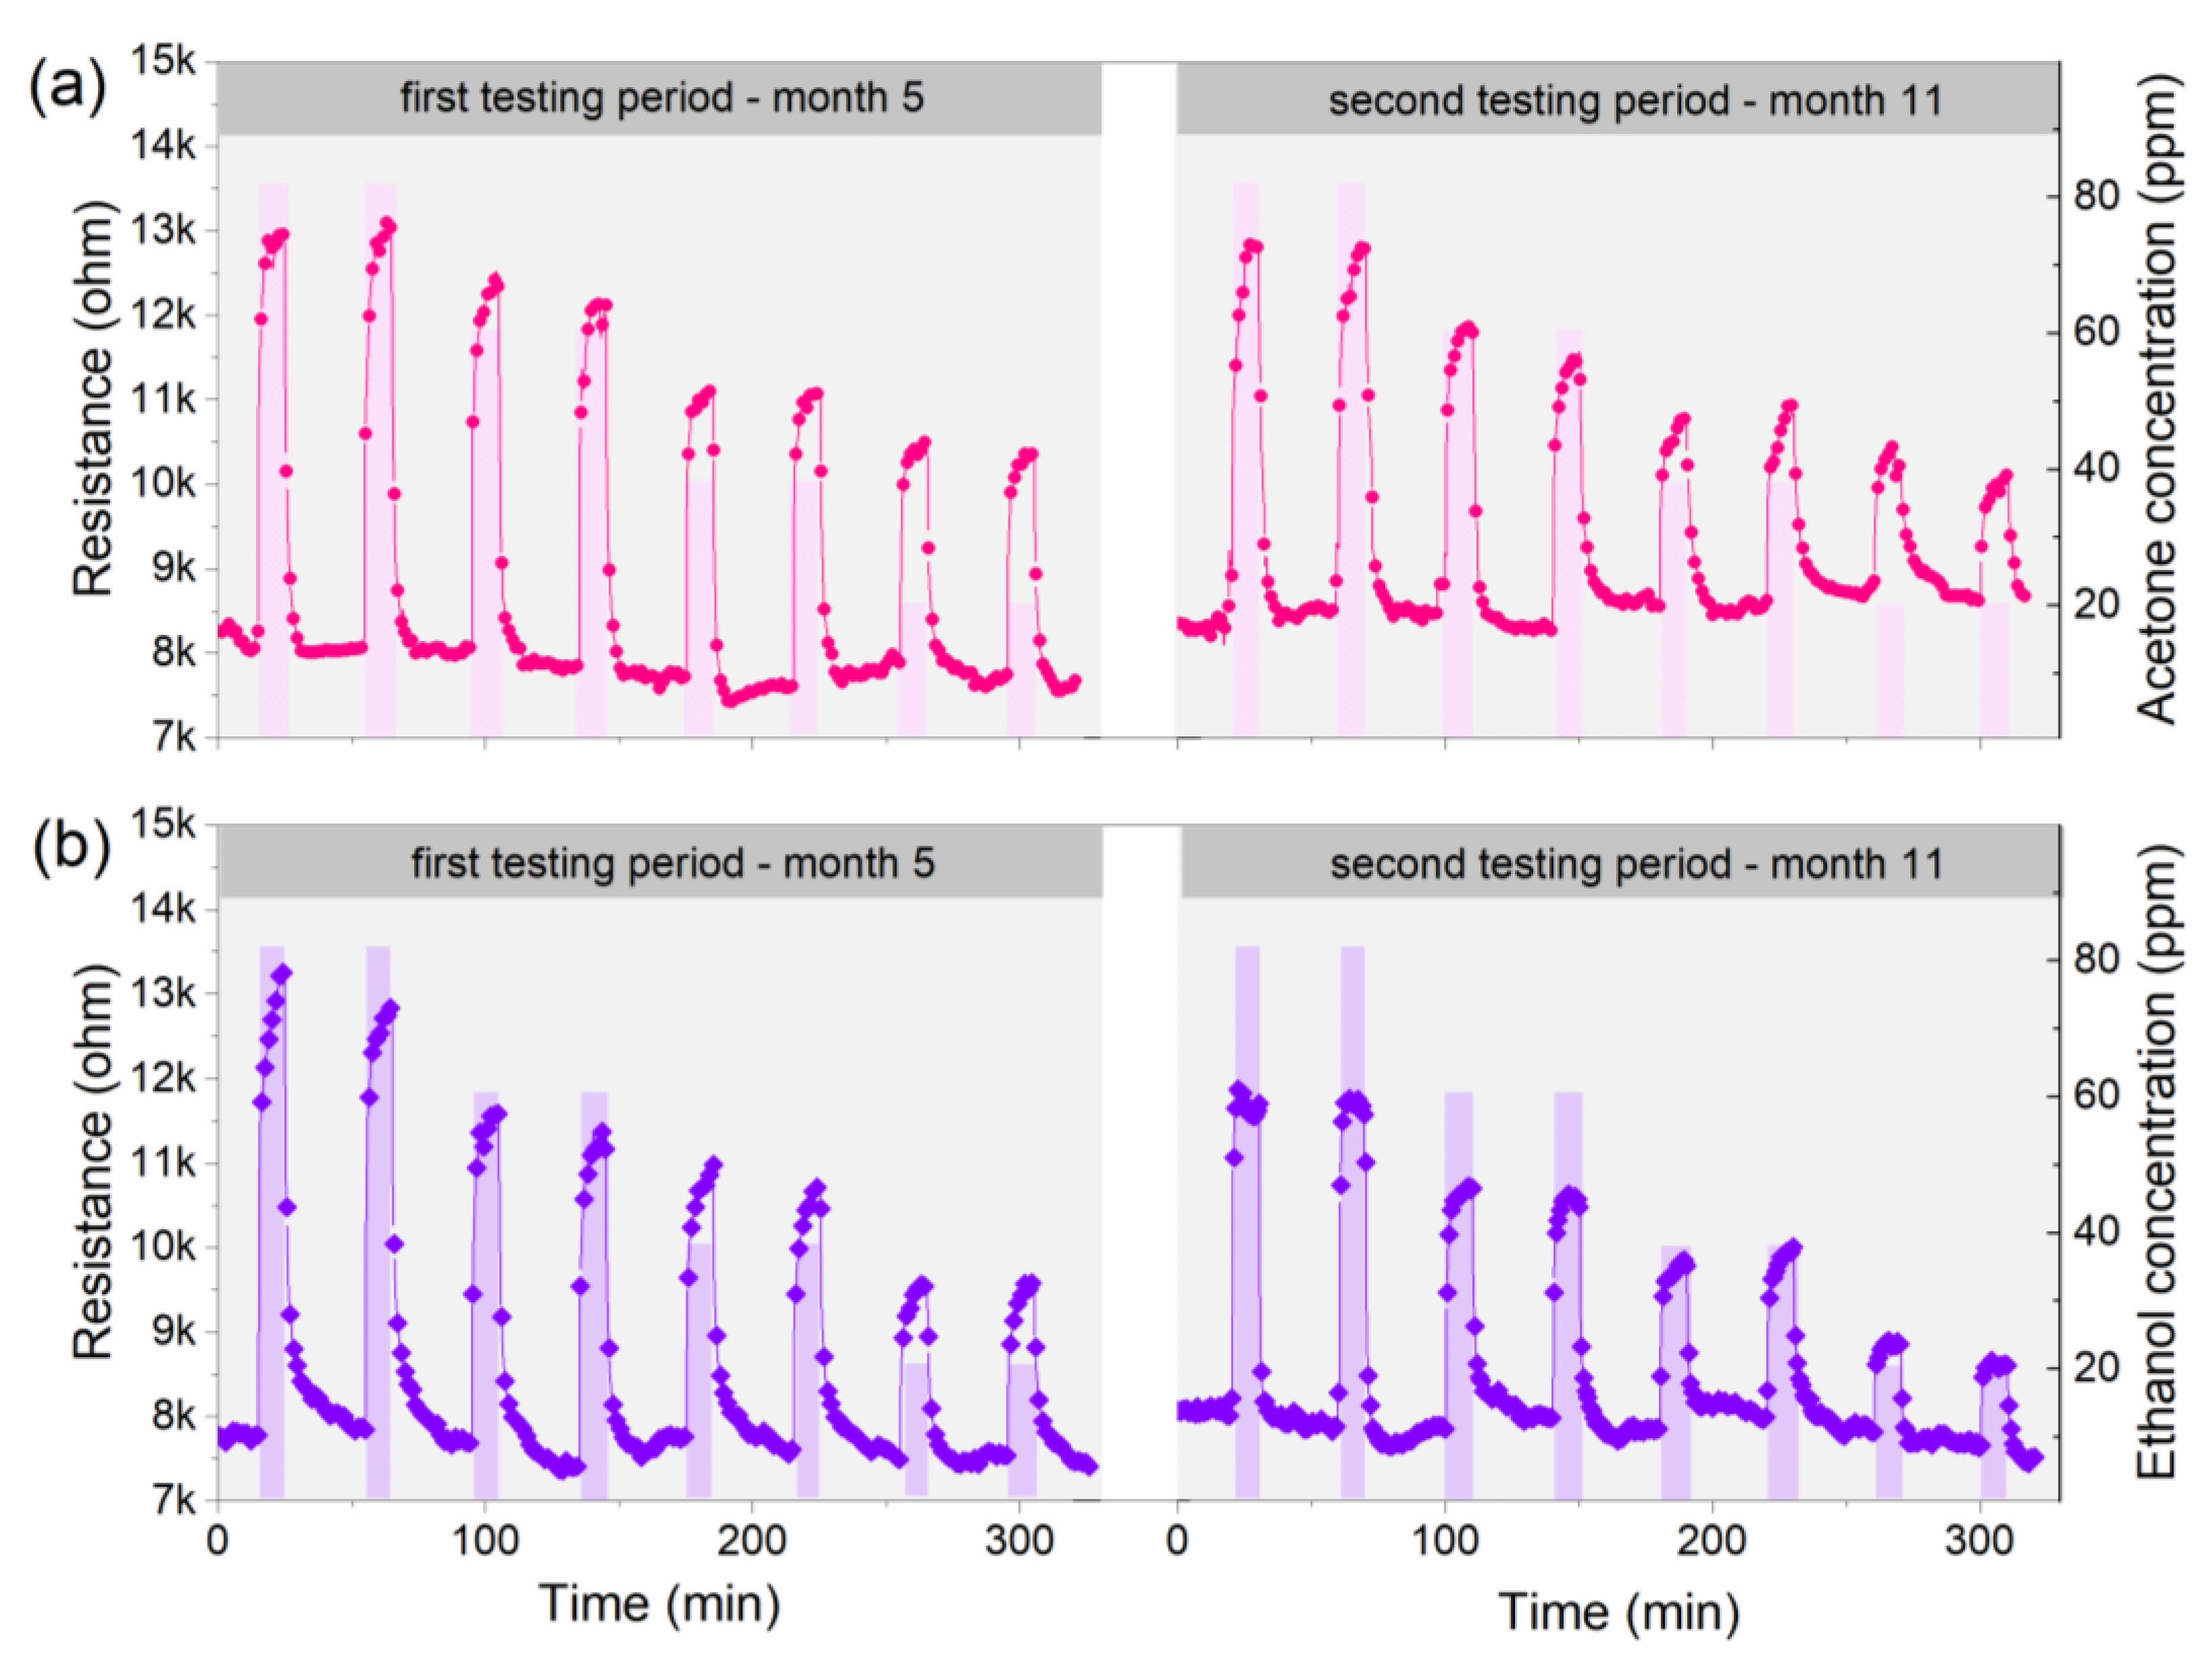
Figure 8.
Schematic illustration of the change of CuO electrical resistance upon exposure to air (left) and a reducing gas (right). CB: conduction band minimum. VB: Valence band maximum. Ra: Resistance in air. Rg: Resistance in gas. e−: electrons. h+: holes.
Figure 8.
Schematic illustration of the change of CuO electrical resistance upon exposure to air (left) and a reducing gas (right). CB: conduction band minimum. VB: Valence band maximum. Ra: Resistance in air. Rg: Resistance in gas. e−: electrons. h+: holes.

Table 1.
Comparative table showing the cross-responses to various reducing gases recorded using CuO. The color codes and numbers in each row of the table represent the load of response for the referenced material towards the same gas concentration of various tested analytes. HP-NWS: Hydrothermal synthesis—nanowires. CuFE-NWlls: Cu foil oxidation—nanowalls. CuME-NWs: Cu mesh exfoliation—nanowires. KR-NW: Kirkendal reaction—nanowires. MAHS-NRs: microwave-assisted hydrothermal synthesis—nanorods. ϕ: Diameter in nm. L: Length in nm. T: Thickness in nm. CS: Crystal size in nm. ppm: Parts per million.
| Ethanol | Methanol | n-propanol | Acetone | Toluene | Benzene | Xylene | Ethylbenzene | Ethyl Acetate | Benzaldehyde | Benzyl Alcohol | Cyclo Hexane | Hydrogen Sulfide | Carbon Monoxide | ||||
|---|---|---|---|---|---|---|---|---|---|---|---|---|---|---|---|---|---|
| HS–NWS | 80–140 ϕ 18,000 L | ❿ | ❿ | ❸ | ❹ | 285 °C—80 ppm | This work | ||||||||||
| CuFE–NWlls | 45 T | ❹ | ❿ | 320 °C—500 ppm | [8] | ||||||||||||
| CuME–NWs | 50–70 ϕ | ❼ | ❻ | ❸ | ❸ | ❿ | ❼ | 260 °C—100 ppm | [9] | ||||||||
| KR–NW | 15 ϕ | ❼ | ❹ | ❿ | ❼ | ❸ | ❺ | 190 °C—100 ppm | [14] | ||||||||
| MAHS–NRs | 15–20 ϕ 60–80 L | ❿ | ❺ | ❺ | ❶ | ❺ | ❽ | ❸ | 220 °C—100 ppm | [45] | |||||||
| NPs | 20 CS | ❿ | ❷ | ❺ | ❹ | 160 °C—240 ppm | [19] |
Publisher’s Note: MDPI stays neutral with regard to jurisdictional claims in published maps and institutional affiliations. |
© 2022 by the authors. Licensee MDPI, Basel, Switzerland. This article is an open access article distributed under the terms and conditions of the Creative Commons Attribution (CC BY) license (https://creativecommons.org/licenses/by/4.0/).
Share and Cite
MDPI and ACS Style
Claros, M.; Gràcia, I.; Figueras, E.; Vallejos, S. Hydrothermal Synthesis and Annealing Effect on the Properties of Gas-Sensitive Copper Oxide Nanowires. Chemosensors 2022, 10, 353. https://doi.org/10.3390/chemosensors10090353
AMA Style
Claros M, Gràcia I, Figueras E, Vallejos S. Hydrothermal Synthesis and Annealing Effect on the Properties of Gas-Sensitive Copper Oxide Nanowires. Chemosensors. 2022; 10(9):353. https://doi.org/10.3390/chemosensors10090353
Chicago/Turabian StyleClaros, Martha, Isabel Gràcia, Eduard Figueras, and Stella Vallejos. 2022. "Hydrothermal Synthesis and Annealing Effect on the Properties of Gas-Sensitive Copper Oxide Nanowires" Chemosensors 10, no. 9: 353. https://doi.org/10.3390/chemosensors10090353
Note that from the first issue of 2016, this journal uses article numbers instead of page numbers. See further details here.