Article

A Novel Voltammetric Electronic Tongue Based on Nanocomposites Modified Electrodes for the Discrimination of Red Wines from Different Geographical Origins

1
College of Materials and Environmental Engineering, Hangzhou Dianzi University, Hangzhou 310018, China
2
Department of Biosystems Engineering, Zhejiang University, 866 Yuhangtang Road, Hangzhou 310058, China
3
Division of Environmental Science & Technology, Graduate School of Agriculture, Kyoto University, Kita-shirakawa-Oiwakecho, Sanyo-ku, Kyoto 606-8502, Japan
*
Authors to whom correspondence should be addressed.
Chemosensors 2022, 10(8), 332; https://doi.org/10.3390/chemosensors10080332
Submission received: 20 June 2022 / Revised: 31 July 2022 / Accepted: 3 August 2022 / Published: 13 August 2022
(This article belongs to the Special Issue Nanomaterials Based on Bio/Chemical Sensors)

Abstract

:
A novel voltammetric electronic tongue (VE-tongue) system based on three nanocomposites modified working electrodes was used for the discrimination of red wine from different geographical origins. The three types of modified working electrodes were fabricated to detect glucose (Glu), tartaric acid (TA), and non-specific flavor information in a red wine sample, respectively. The electrochemical properties of three electrodes were tested by cyclic voltammetric method, and pH, accumulation time, and scan rates were optimized for Glu and TA sensors. Scanning electron microscopy (SEM), X-ray proton spectrum (XPS), and X-ray diffraction (XRD) were used for the characterization of modified materials. This sensor array was then applied to identify four kinds of red wines from different geographical origins, and the multi-frequency and potential steps (STEP) method was used to obtain flavor information regarding rice wines. The classification ability of this VE-tongue system was evaluated by using partial least squares (PLS) regression and principal component analysis (PCA), while back propagation neural network (BPNN), random forest (RF), support vector machines (SVM), deep neural network (DNN), and K-nearest neighbor (KNN) were used for the prediction. The results showed that PCA could explain about the 95.7% of the total variance, and BPNN performed best in the prediction work (the prediction accuracy was 95.8%). Therefore, the VE-tongue system with BPNN was chosen to effectively discriminate red wines from different geographical origins, and the novel VE-tongue aiming at red wine discrimination with high accuracy and lower cost was established.

1. Introduction

Red wine is a popular alcoholic beverage around the world. Since red wines of certain geographic origins are excellent in regard to flavor profile and thus preferred by consumers, some unscrupulous merchants mislabel spurious information, falsify or adulterate wine products in order to profiteer [1]. Precision instruments, such as gas chromatography with mass spectrometry (GC-MS), high-performance liquid chromatography (HPLC) and H-1 NMR, have been applied for the quantitative determination of substances in red wine, yet these approaches are confined by high cost, long detection time, expensive instruments, and complicated operation [2]. However, those modern instruments could barely notice the importance of the flavor of red wines, which is significantly dependent on the global constitution of multiple taste chemical substances, and the synergistic or suppression interactions between different taste substances. So, there is a call for developing a fast, inexpensive, and accurate method for discriminating red wine from different denominations of origin to prevent the red wine market from being disturbed by inferior wines.
Electronic tongue (E-tongue) is based on an array of cross-sensitive chemical sensors that can obtain the global and synergetic flavor information from analyzed solutions [3,4], rather than detecting one certain chemical substance. E-tongue exhibits superiority in analyzing flavor quality of complex liquid-phase samples [5,6]. E-tongues based on voltametric methods (VE-tongue) have been used extensively in food identification, process monitoring, and quality investigation, due to their high versatility, sensitivity, simplicity, and robustness [7,8]. VE-tongues based on the traditional bare metallic electrodes (gold, platinum, cuprum, cobalt, et al.) and carbon paste electrodes (CPEs) have been demonstrated to be an accurate, effective, and rapid analytical tool in food discrimination [9,10]. However, these sensor arrays suffer from some drawbacks of being a weak catalyst with respect to the taste of organic substances and the incomplete information obtained by traditional bare metallic electrodes.
To date, studies have focused on the synthesis of composite materials combining nanoparticle materials with polymer skeleton, and glassy carbon electrode-modified chemically active materials have shown high sensitivity to organic substances [11,12]. Nanoparticle materials (metal/metal-oxide nanoarchitectures) have exhibited high sensitivities toward organic analytes [13]. Besides, the aggregation of nanomaterial activity has attracted researchers’ interests due to unique properties, such as inherent electrical, magnetic, optical specifications, and strong van der Waals attraction, instead of simple coating [14,15]. The nanocomposite of conductive polymers and nanoparticle materials has excellent electrochemical properties, e.g., impeding the aggregation tendency of nanoparticles, notably improving the stability of the electrode response and the selectivity to analytes [16]. The stereoscopic structure of nanocomposite with abundant mesopores dispersed along the surfaces can afford a high active-site density, promote the charge-transport rate, and boost the catalytic activities of electrochemical catalysts. Therefore, the nanocomposite modified electrodes can detect the weak electrolytes and monitor trace substances. So, the VE-tongue based on the nanocomposite modified electrodes can obtain complete flavor information of food samples.
For food samples, glucose (Glu) is an important index to evaluate their taste and values, especially for red wines. During the fermentation of red wines, Glu is converted into ethanol and carbon dioxide. Thus, ethanol is able to enhance bitterness and reduce astringency. So, Glu can directly or indirectly influence the red wine flavor profile, which can influence the consumers’ preference. For red wines, the contents of tartaric acid (TA), the major organic acid, can distinguish the different types of wines with different grape varieties and/or producing areas [16]. Contrary to the Glu, the concentration of TA can influence the precipitation of potassium bitartrate, which lowers the quality of wine and is not acceptable to most consumers [17]. Glu and TA are the two of the most important components influencing the flavor of red wines [18]. Recently, researchers have sought sensors capable of detecting the contents of Glu and TA with good stability and anti-interference ability in a real, complex detection environment. As shown in Donmez’s research, poly L-aspartic acid in the modified electrode provided free carboxyl groups to immobilize the glucose oxidase (GOx) and displayed both good stability and good bioactivity [19]. In Zhang’s study, the modified glassy carbon electrode (GCE) with Cu bismuthate nanosheets have demonstrated good promise for application in the electrochemical detection of tartaric acid [20].
In this work, a novel VE-tongue system based on three nanocomposite modified electrodes was established to evaluate the electrochemical behavior of Glu and TA. The modified electrodes were poly-aspartic acid/nickel oxide modified electrode (PASP/NiO/GCE), having high sensitivity to Glu, copper/poly-tryptophan/Nafion modified electrode (Cu/PTRP/Nafion/GCE) having high sensitivity to TA, and copper/poly-neutral red modified electrode (Cu/PNR/GCE) for non-specific flavor information detection. To optimize detection performance, the electrochemical detecting characteristics of three working electrodes were tested. Characterizations were carried out with scanning electron microscopy (SEM), X-ray photoelectron spectrum (XPS) and X-ray diffraction (XRD). For wine sample tests, two types of multi-frequency and potential steps (STEP) were used to obtain taste information. The capacity of the VE-tongue in discriminating red wines of different origin was evaluated by visualization methods, and the prediction accuracy was determined by different pattern recognition methods.

2. Materials and Methods

2.1. Reagents and Apparatus

L-aspartic acid (ASP), nickel chloride, D-glucose, disodium hydrogen phosphate, sodium dihydrogen phosphate, potassium ferricyanide, potassium ferrocyanide, neutral red (NR), D-tartaric acid and L-tryptophan (TRP), Nafion solution (5 wt.% in mixture of lower aliphatic alcohols and water, containing 45% water) were used as received from Aladdin Chemical Co. Ltd. (Shanghai, China). Copper nitrate, ammonium chloride, sodium hydroxide, sulfuric acid (98%), absolute ethyl alcohol, nitric acid (65.0~68.0%), and potassium chloride were used as received from Sinopharm Chemical Reagent Ltd. (Shanghai, China). Deionized water (18.25 MΩcm) obtained from a Millipore purification system was used to prepare all solutions.
The morphologies of the modified electrodes were examined using SEM (Hitachi SU-8010, Japan) at an acceleration voltage of 3.0 kV. The phase composition and crystal structure of all three electrodes were identified by XRD using a Brucker D8 Advance X-ray diffractometer. The samples were scanned at a scan rate of 0.05°·s−1 with 2θ range of 5–90°. XPS analyses were performed using the Escalab X-ray photoelectron spectrometer with the exciting source of Mg. Both the modified samples for XRD and XPS were prepared on FTO conducting glass.

2.2. Wine Samples

Four kinds of wine samples were acquired from a local supermarket. These samples were selected with various denominations of origin. Table 1 summarizes detailed information regarding these wine samples. A total of 120 samples of red wines (30 samples of each type of red wine) were randomly selected. All the samples were bottled in 2019.
STEP was applied to sample detection. Trapezoidal wave (MRPV) and squares wave (MSPV) were used as two waveforms. Both waveforms were composed of three segments of different frequencies: 1 Hz, 10 Hz, and 100 Hz. The trigger potential was set to step to a fixed potential after 1 s, 0.1 s and 0.01 s, respectively. Because of the formation of a Helmholz double layer, a sharp transient current would flow to the working electrode. When the potential stepped back to 0 V, an opposite reaction occurred. In the case of 10 Hz and 100 Hz, the time interval provided insufficient time for the modified nanocomposites to be oxidized or reduced completely so that extra information could be obtained.

2.3. Preparation of Nanocomposites Modified Electrodes

Before modification, a glassy carbon electrode (GCE, 3 mm in diameter) was polished on chamois leather, with 1.5 μm and 50 nm α-alumina suspension with double-distilled water. The treated GCE was cleaned in an ultrasonic cleaner with deionized water, alcohol, and nitric acid (1:1) for 30 s, respectively. The cleaned GCE was examined in solution of 1 mM K3[Fe(CN)6], 1 nM K4[Fe(CN)6] and 0.1 M KCl, by using cyclic voltametric (CV) method. The GCE was then immersed in 0.5 M H2SO4 and scanned between −0.5 and appro1.2 V at a rate of 100 mV/s for 40 cycles, then the reproducible background was obtained. All the electrochemical methods were conducted by CHI660E electrochemical analyzer (Shanghai CH Instrument Company, Shanghai, China) and in a three-electrode system, with a platinum electrode as the counter electrode, saturated calomel electrode (SCE) as the reference electrode, and GCE as the working electrode.

2.3.1. Preparation of Poly-Aspartic Acid/Nickel Oxide/GCE

The optimization of the parameters in Section 2.3.1, Section 2.3.2 and Section 2.3.3 referenced our previous works [21,22], and the final process parameters are displayed in this section. Treated GCE was modified with poly aspartic acid (PASP) in a 2 mM aspartic acid solution (pH = 6, PBS). The CV method was applied to polymerize aspartic acid with a potential range of −1.2~2 V for 15 cycles, at a scan rate of 100 mV/s. Then, the PASP/GCE was put into 20 mM NiCl2 solution (pH = 4, PBS) to electrolytically deposit Ni. The chronoamperometry technique was applied at −0.8 V for 180 s. The PASP/Ni/GCE was then electrochemically oxidized in 0.1 M NaOH, using CV with a potential range of 0~0.6 V for 40 cycles, at a scan rate of 100 mV/s. After electrolysis, the PASP/NiO/GCE was brought out and washed by deionized water.

2.3.2. Preparation of Copper/Poly-Tryptophan/Nafion/GCE

Treated GCE was electrochemically deposited with copper in a mixed solution of 20 mM CuNO3 and 0.1 M NH4Cl, with a constant potential of −0.55 V for 300 s, at room temperature. The Cu/GCE was then put into 20 mM tryptophan solution (pH = 4, PBS) to electrolytically polymerize tryptophan. The CV method was applied with a potential range of −0.6~1.6 V for 10 cycles, at a scan rate of 100 mV/s. After electrolysis, the Cu/PTRP/GCE was brought out and washed by deionized water. 2 μL 0.5% Nafion was casted onto Cu/PTRP/GCE and the electrode was dried under an infrared lamp for one hour. The casting and drying procedure was repeated for five times to prepare Cu/PTRP/Nafion/GCE.

2.3.3. Preparation of Copper/Poly-Neutral Red/GCE

Treated GCE was immersed in a mixed solution of 20 mM CuNO3 and 0.1 M NH4Cl. Then, the chronoamperometry technique was applied at a constant potential of −0.55 V for 300 s, at 60 °C. The Cu/GCE was then polymerized with neutral red in a mixed solution of 0.5 mM neutral red and 0.5 M NaNO3 (pH = 5, PBS). The CV method was applied with a potential range of −0.8~0.8 V for 20 cycles, at a scan rate of 100 mV/s. The Cu/PNR/GCE was brought out and washed by deionized water.

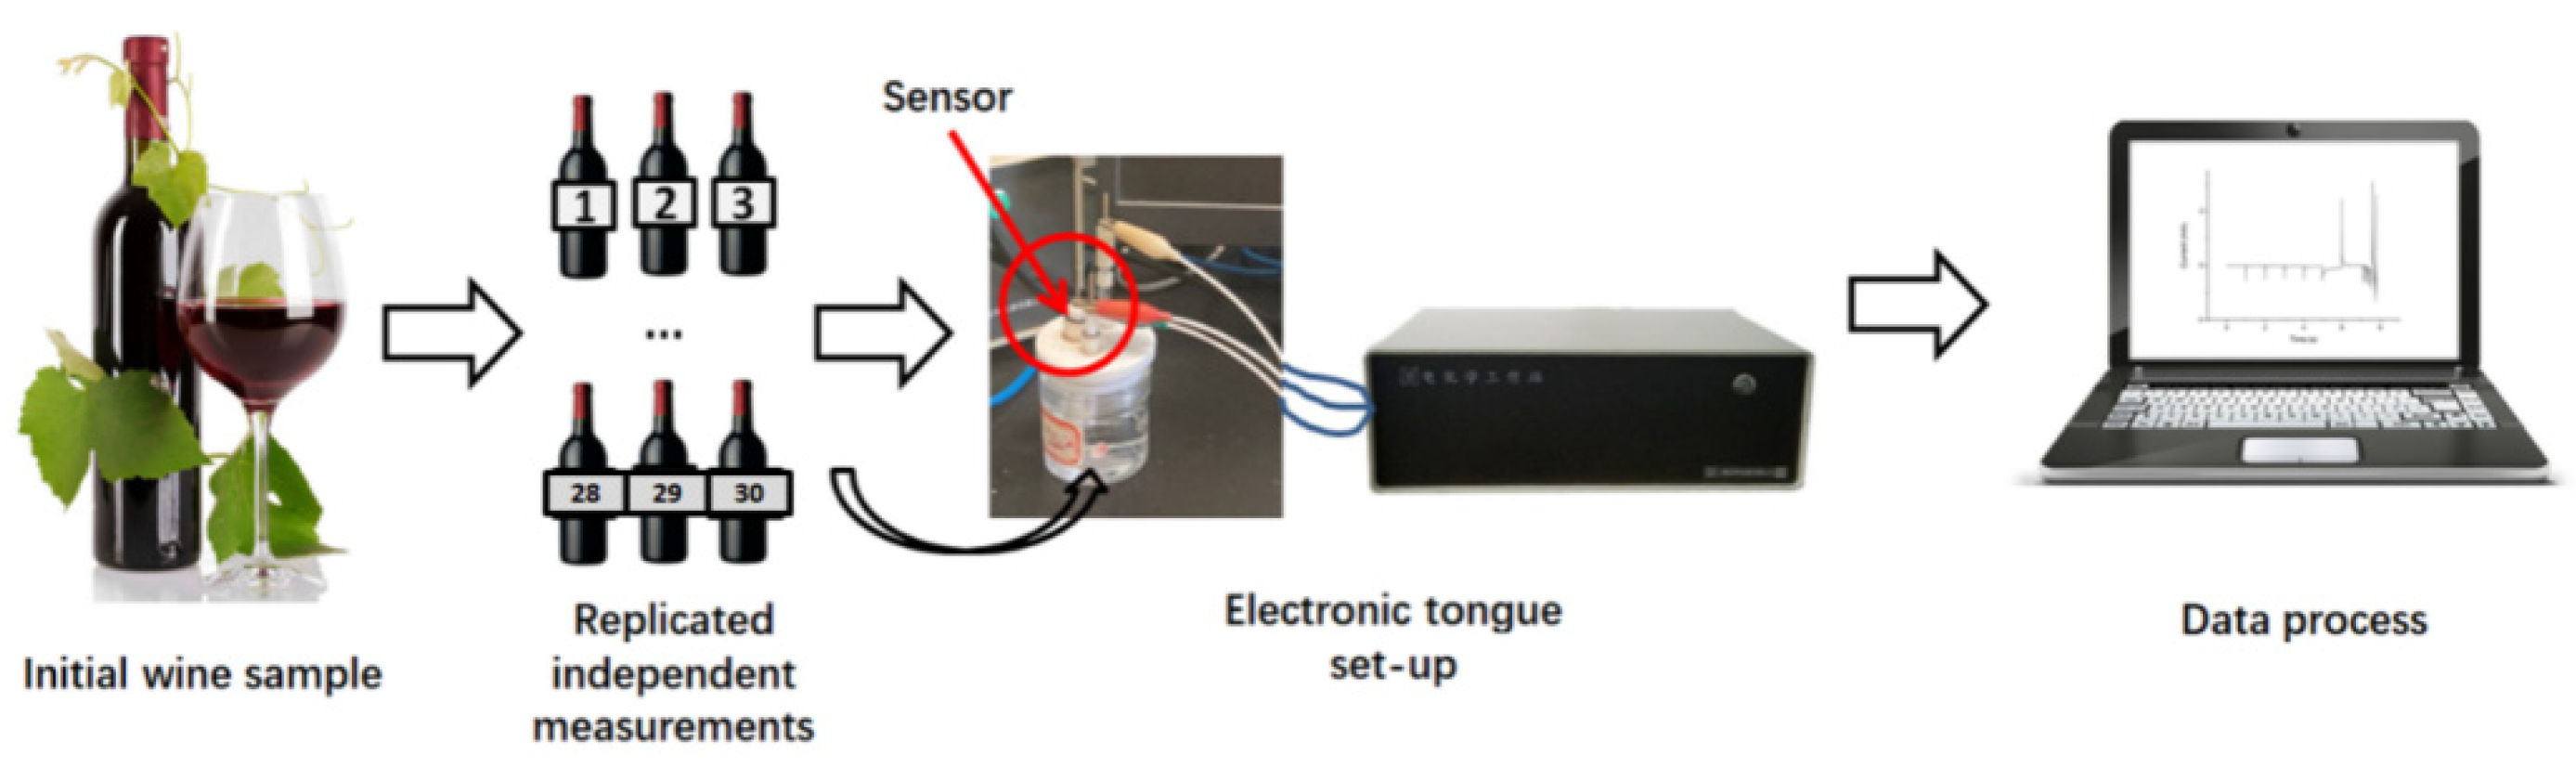
2.4. Experiment Procedures

Before the start of the sample tests, 25 mL red wine was mixed with 25 mL 0.1 M PBS (pH = 3) in order to provide stable working condition for each electrode. Then, the Cu/PTRP/Nafion/GCE and Cu/PNR/GCE individually worked as the working electrode in three-electrode system to collect the information of red wine in different aspects. Since alkaline condition was optimal for Glu sensor, NaOH was added into the sample, and the PASP/NiO/GCE was then used as the working electrode to detect it. 30 samples of each type of red wine were tested by each working electrode separately, and each electrode was washed by deionized water before next detection. Therefore, each sample test of each kind of wine was independent. A schematic presentation of the adopted process flow and instrument set-up is shown in Scheme 1.

2.5. Statistical Analysis

Data from the sensor array were analyzed by visualization methods like PLS and PCA. Matlab v5.3. (Natick, MA, USA) and The Unscrambler (v10.1, CAMO ASA, Norway) were used to process data. In the PCA score figures presented in this report, X axis represents PC1, Y axis represents PC2, Z axis represents PC3, X-expel represents the percentage of variance. All the wine samples were detected by each working electrode in a random order. There were 4 types of red wines × 30 samples for each type = 120 sets of data. In each data set, feature data were extracted by area method (by calculating the area that the response curves encircled) and then normalized. BPNN and RF was conducted for training and prediction by Python version 3.6 (Python Software Foundation, Beaverton, OR, USA). 96 selected of the 120 data sets were set as training set, and the left 24 data sets were prediction set. The training set and prediction set were divided with a randomize select algorithm conducted by Python. The discrimination accuracies of both methods were determined and compared.

3. Results and Discussion

3.1. Characterization of Working Electrodes

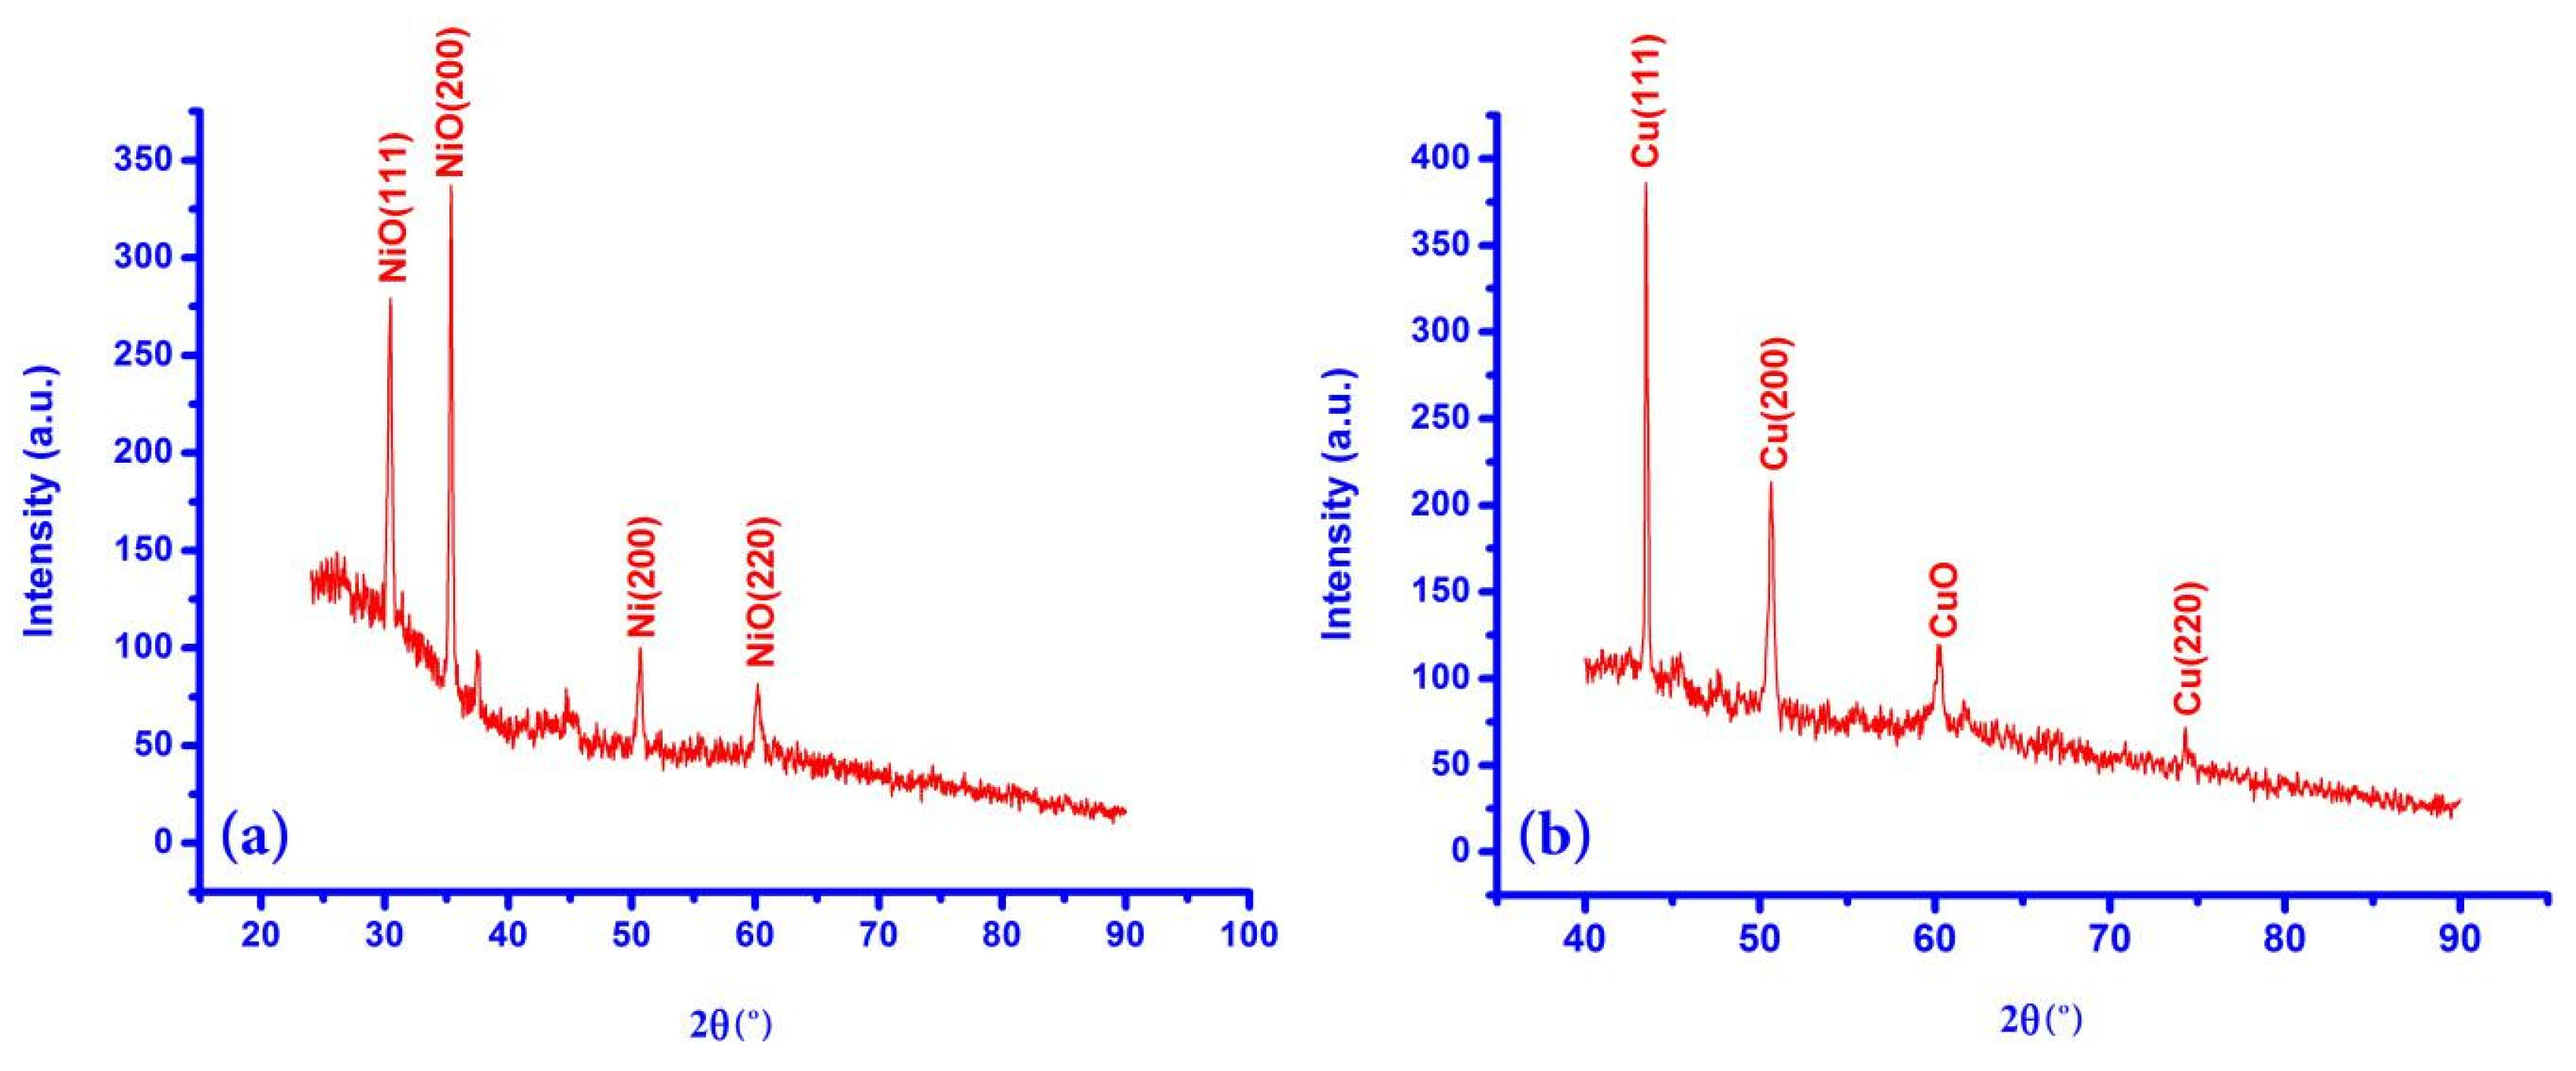
3.1.1. XRD Patterns of Working Electrodes

In the case of the Glu sensor (PASP/NiO/FTO), the XRD pattern of NiO deposited onto FTO conducting glass is shown in Figure 1a. All the diffraction peaks can be assigned to NiO phase and Ni phase (JCPDS card, PDF No. 87-0712 and PDF No.78-0643) due to incomplete oxidation. The diffraction peaks from other impurities were not obvious, which indicated that the preparation method introduced in Section 2.3.1 can modify NiO of high purity onto GCE.
As for the TA sensor (Cu/PTRP/FTO) and non-specific electrode (Cu/PNR/FTO), the XRD pattern of Cu deposited onto FTO conducting glass is shown in Figure 1b. The diffraction peaks can be assigned to Cu phase and CuO phase (JCPDS card, PDF No. 89-2838 and PDF No. 89-5895). The small amount of CuO may come from the copper oxidized by oxygen in the air. No other peaks of impurities were observed.
The XRD results of all three electrodes can accurately reflect the preparation procedure, thus realizing the goal of detecting given target substances, i.e., Glu and TA.

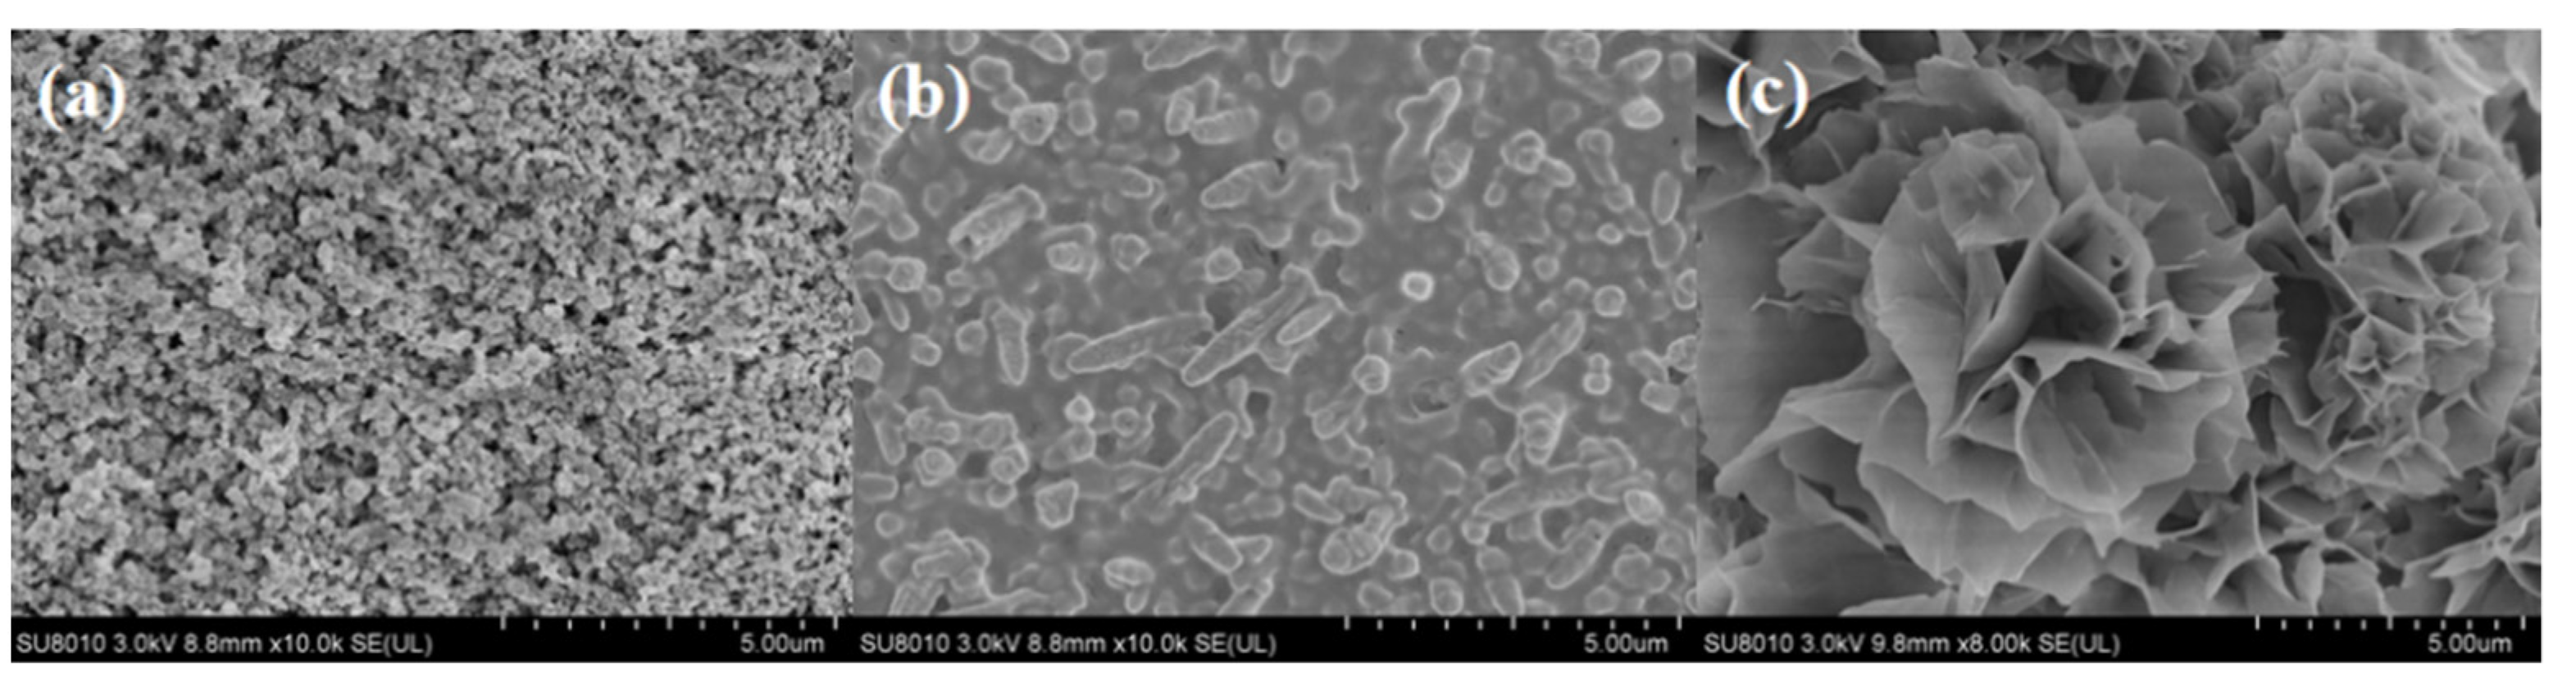
3.1.2. Morphologies of Working Electrodes

The morphologies of three working electrodes were observed by using SEM, as shown in Figure 2. The morphology of PASP/NiO/GCE (Figure 2a) appeared to be an accumulation of numerous metallic balls with diameter of about 10 nm. A poriferous structure was formed by these NiO nanoparticles, which could significantly enhance conducting electrons in an electro-catalytic reaction, as well as the effectivity of capturing Glu. As for Cu/PTRP/Nafion/GCE (shown in Figure 2b), the surface looks much smoother compared with metallic particles because of the coverage of the PTRP layer and Nafion over copper. The shape of the composites appeared to be rods, with an average length of 1~2 μm. This shape can also improve conductivity and the outer PTRP layer can selectively identify tartaric acid through chiral recognition. In Figure 2c, the flower-like microstructure of Cu/PNR/GCE was observed. Quantities of small rooms of this morphology can significantly increase the specific surface area of the modified electrode and thus enhancing sensitivity. Therefore, highly accessible active sites, short ion transport pathways, and high electron conduction were provided by the Cu/PNR/GCE.

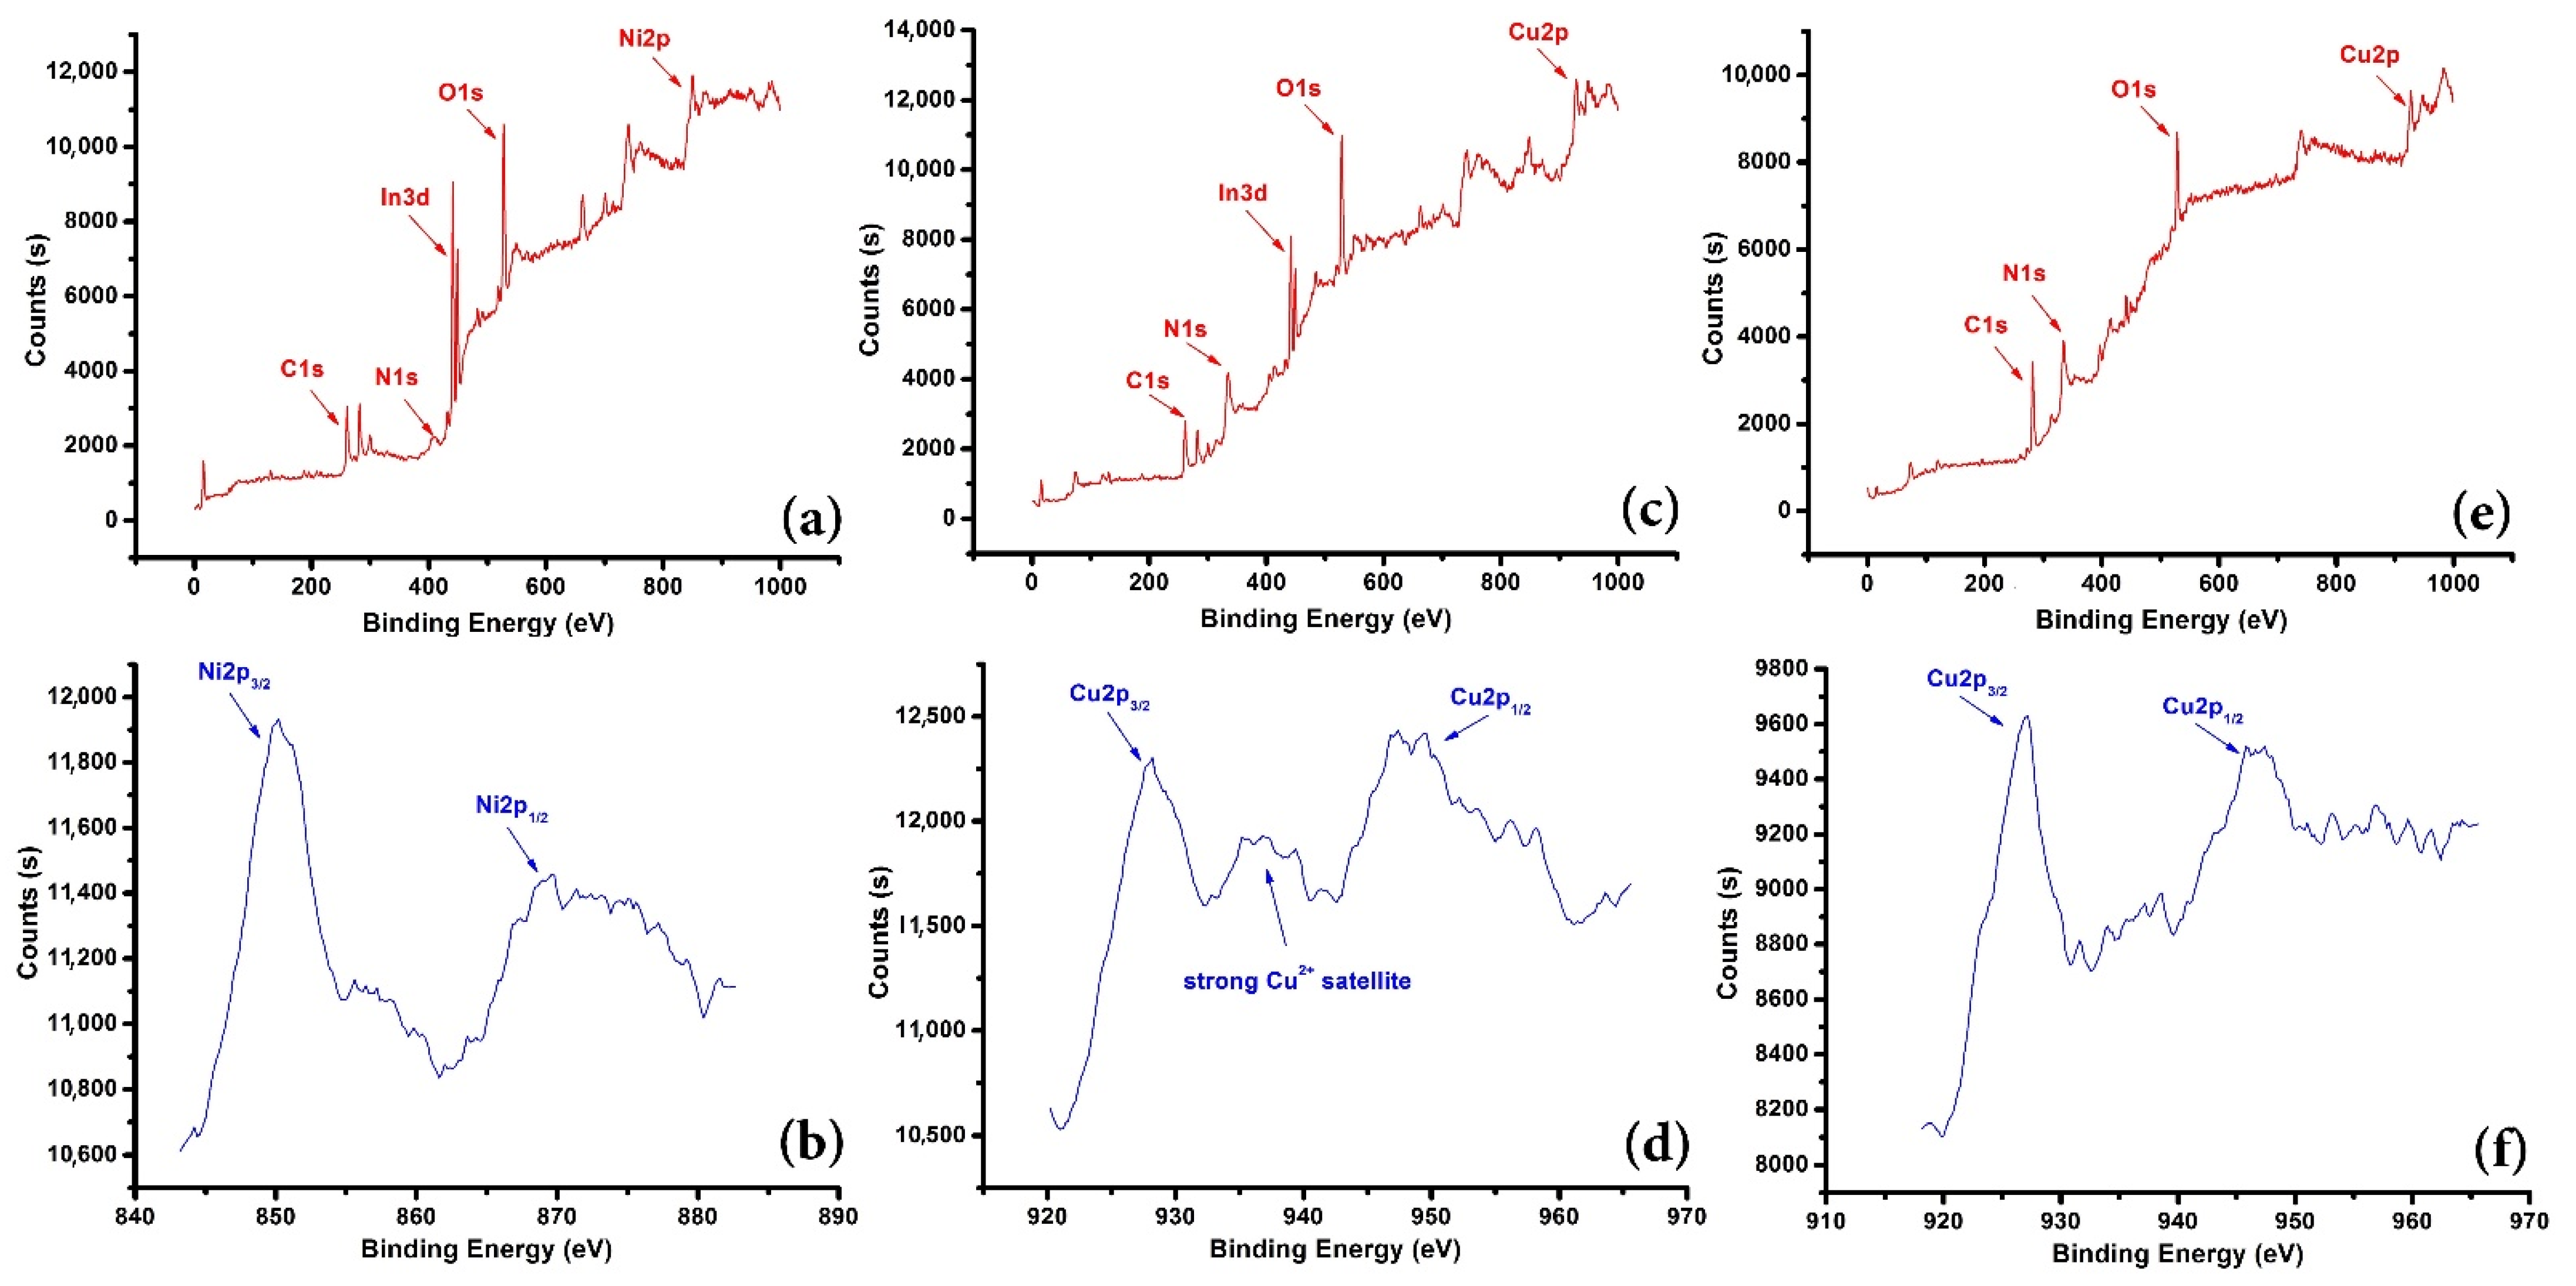
3.1.3. XPS Pattern of Working Electrodes

The XPS spectra of three working electrodes are shown in Figure 3. Figure 3a,c,e show the full spectra of three working electrodes, and the binding energy of all the elements exhibited in the spectra were in consistent with preparation method. Small amount of In was from FTO conducting glass. In Figure 3b, Ni 2p regions show correspondence to the Ni2+ due to electrochemical oxidation in NaOH solution, so there may be both NiO and Ni(OH)2 in the sample. In Figure 3d,f, Cu 2p in the TA detection electrode and non-specific detection electrode are presented. These two spectra show resemblance to some extent, except for the obvious Cu2+ satellite in Figure 3d. This may result from the oxidation of Cu by oxygen in the air. Yet, the binding energy shown in Figure 3c and Figure 4d still typically corresponds to Cu, demonstrating that the modified layers mainly consisted of Cu.

3.2. Electrochemical Behaviors of Target Substances at Working Electrodes

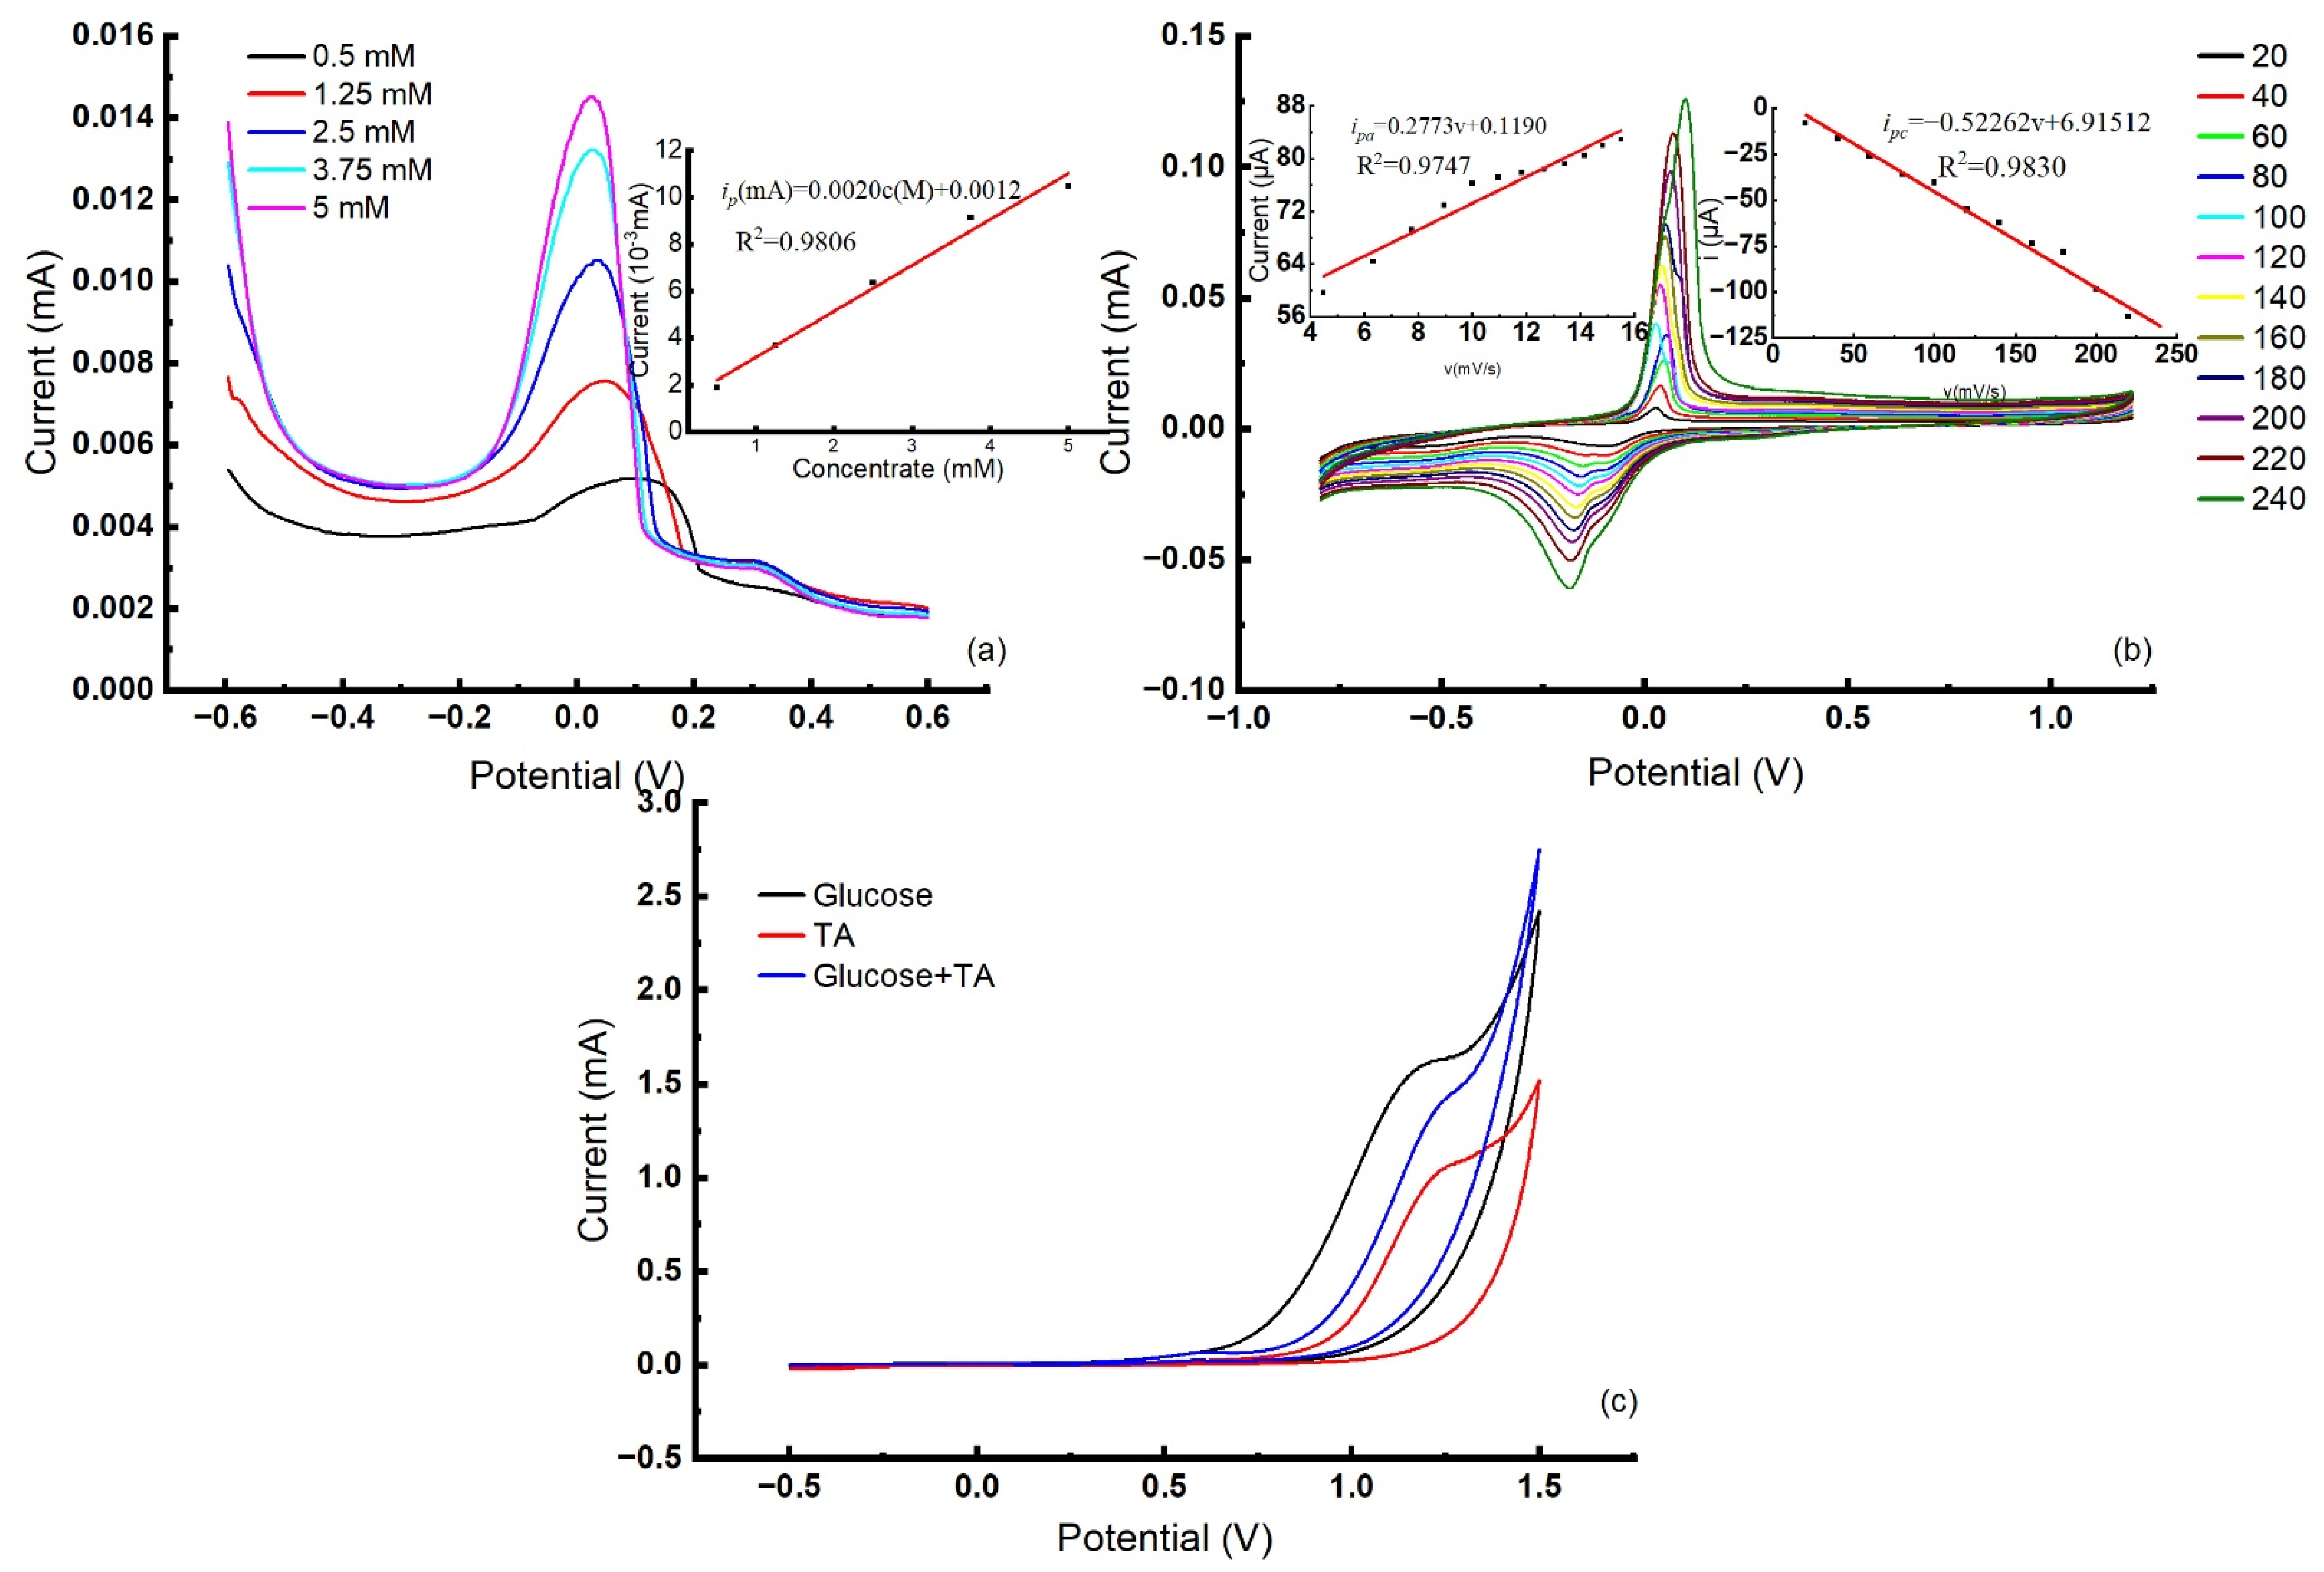
3.2.1. Electrochemical Behaviors of Glu at PASP/NiO/GCE

Amino acid, with amidogen and carboxyl, has made itself to be an ideal monomer for electrochemical polymerization. With PASP layer supporting the structure of NiO nanoparticles, its selectivity as well as sensitivity to Glu was enhanced. The preparation of PASP/NiO/GCE procedure was as reported in Section 2.3.1. The electrochemical response to 100 μM Glu in NaOH solutions of different concentration was tested, as is shown in Figure 4a. The working buffer was changed from 0.1 M NaOH to 0.5 M NaOH. As the pH of Glu solution changed, both the redox peak current and peak potential of response curves shifted. In 0.5 M NaOH, the potential peak current was most obvious and detectable, indicating that the oxidation of Glu was most catalyzed, so 0.5 M NaOH was set as the optimal working pH for Glu electrode.
The influence of scan rate on the peak current of CV response curves has also been studied, as is shown in Figure 4b. PASP/NiO/GCE was used for 100 μM Glu solution detection. As the scan rate increased, the peak current increased proportionally. The linear regression equations were: ipa (mA) = 0.0020v (mV/s) + 0.0948, ipc (mA) = 0.0023v (mV/s) + 0.1413, with correlation efficient of 0.98094 and 0.98568, respectively. The linear relation of scan rate and peak current demonstrated that the electrocatalytic process of Glu at PASP/NiO/GCE was controlled by absorption rate, but not diffusion. Therefore, accumulation time can also affect the peak current of CV curve. The accumulation time was changed from 0 s to 260 s, and according to Figure 4c, the accumulation time of 120 s was chosen as the optimal condition to acquire the most obvious peak current.
For Glu determination, the chronoamperometric technique was employed to observe the current response. Hence, 1 mL 0.1 mM, 0.25 mM, 0.5 mM, 0.75 mM and 1 mM Glu solutions were successively added into 50 mL 0.1 M NaOH solution, with a time interval of 50 s. Each concentration addition was repeated five times. The response curve is shown in Figure 4d. The applied potential was set to 0.5 V for the oxidation of Glu at PASP/NiO/GCE, and the linear regression equation was: ip (mA) = 4.3528 × 10⁻⁵c (μM) + 0.0011, with a correlation coefficient of 0.9980. In Soner Donmez’s work, the modified CPE with PASP detected the contents of Glu ranged from 50 μM to 1000 μM [19]. In this work, the PASP/NiO/GCE linear range extended from 2 μM to 270 μM, because the electrode was enhanced by NiO nanoparticles, which provided a PASP layer supporting structure and itself also sensitive to Glu.

3.2.2. Electrochemical Behaviors of TA at Cu/PTRP/Nafion/GCE

The outer PTRP layer can catch TA molecule by chiral recognition through the formation of stable hydrogen-bonds. Following by the chiral recognition of TA, the cooper layer reacts with it. The electrochemical responses to TA were tested in 0.5 mM–5 mM TA solution, as is shown in Figure 5a. Differential pulse voltammetry (DPV) was applied to observe the current curve. The results demonstrated the capacity of Cu/PTRP/Nation/GCE in detecting TA. The linear regression equation was: ip (mA) = 0.0020c (mM) + 0.0012, with a correlation coefficient of 0.9809. The linearity range extended from 0.4 mM to 5 mM. However, compared to the TA detection electrode based on Cu bismuthate, the detection range was 0.005–2 mM, which presents a lower detection limitation [20]. However, for red wine samples, the contents of TA are higher than 2 mM. So, Cu/PTRP/Nafion/GCE is still suitable for TA detection in red wine samples. The electrocatalytic process of TA at Cu/PTRP/Nafion/GCE has also proved to be determined by absorption, according to Figure 5b. The experiment was conducted in 1 mM TA solution (pH = 3, PBS), and the scan rate was changed from 20 mV/s to 240 mV/s to obtain CV response curves. The result showed the peak current of CV curve was proportional to scan rate, and the linear regression equations were: ipa (mA) = 0.2273v (mV/s) − 0.1190, ipc (mA) = −0.5226v (mV/s) + 6.9151, with the correlation efficient of 0.9747 and 0.9830, respectively.

3.2.3. Electrochemical Behaviors of Glu and TA at Cu/PNR/GCE

The Cu/PNR/GCE was prepared for non-specific detection with its three-dimensional flower-like morphology. CV method was applied to observe its electrochemical responses to Glu and TA. In Figure 5c, the CV curves of different substance have different shapes and areas, indicating that the Cu/PNR/GCE has different responses to different substances. The results demonstrated this electrode’s capacity to discriminate between solutions of different substances and can help to recognize global information in wine samples. Therefore, this flower-like electrode can be used for non-specific detection as expected.

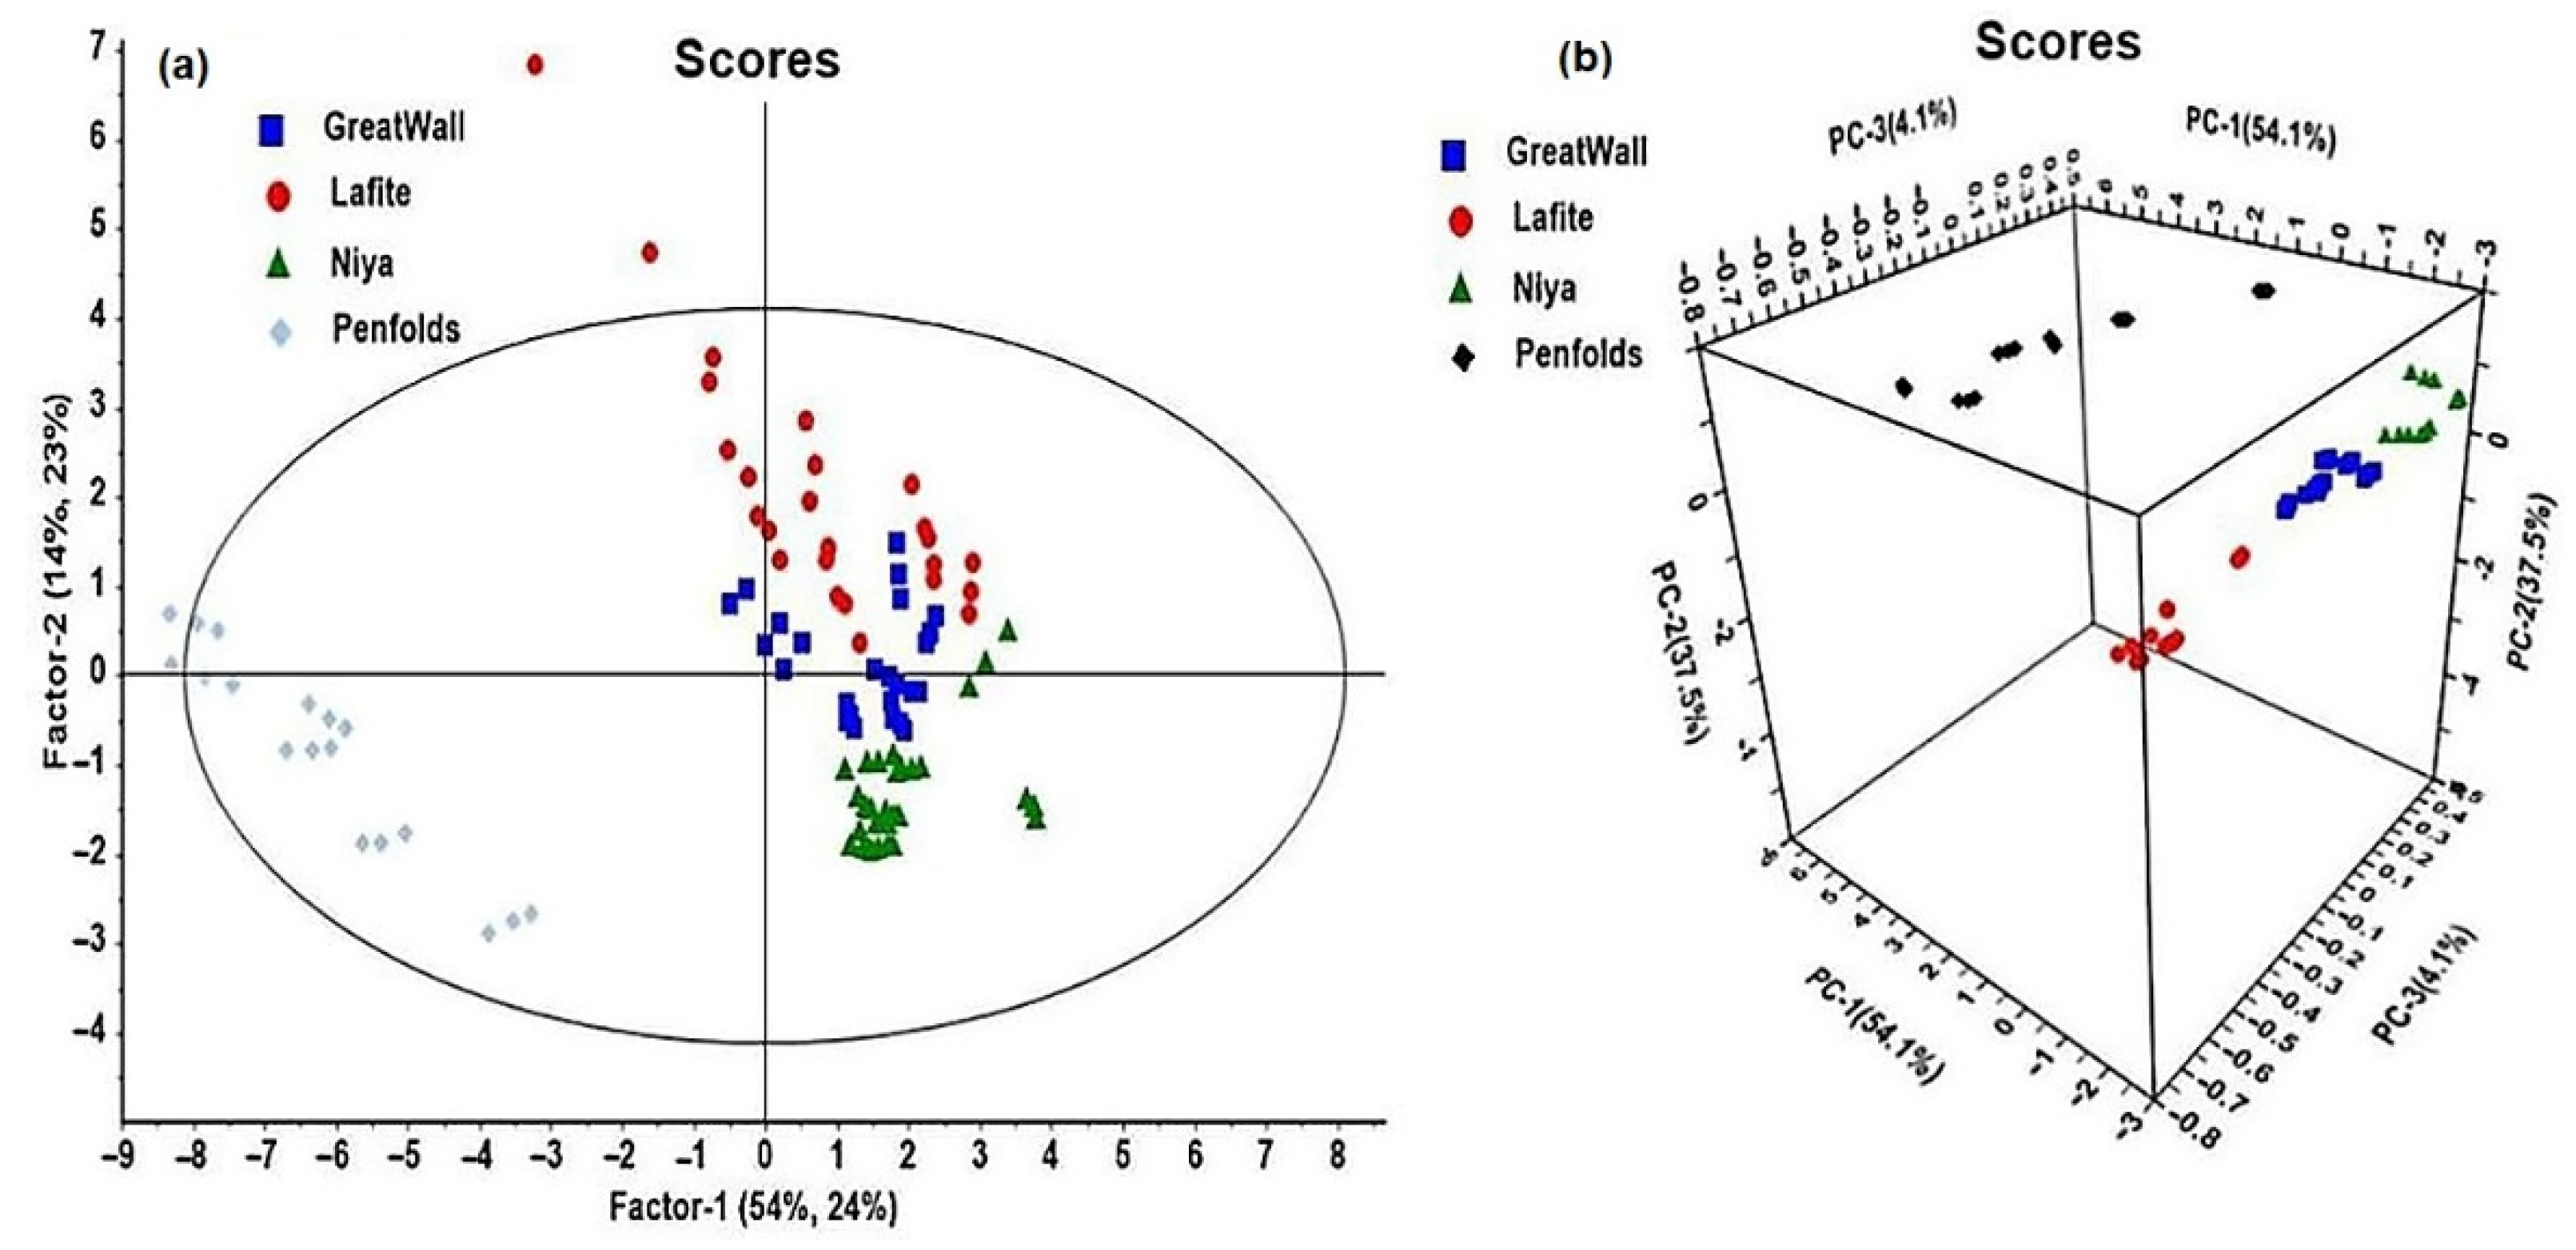
3.3. Tests on Wine Samples

Four wine samples listed in Table 1 were used for tests. It is worth mentioning that the limit of detection (LOD) of Glu and TA sensor was far smaller than Glu and TA concentration in red wines. Therefore, the two electrodes can collect flavor information included Glu and TA because of cross-sensitivity. Briefly, with this sensor array of global selectivity, the tests on wine samples were qualitative.
Although the electrochemical responses characterization of three working electrodes employed chronoamperometric, CV, or DPV techniques, these methods are not effective enough for sample detection. The complex components in wine could lead to distortion in the obtained data. In this study, STEP was applied to sample detection. MRPV and MSPV were set as trigger signals, as shown in Figure 6a,b. The potentials for both trigger signals were 0 V, 0.3 V, 0.6 V, 0.9 V, 1.2 V, and 1.5 V, and frequency was set to 1 Hz, 10 Hz, and 100 Hz. Hence, 30 samples of each kind of red wine were detected by each working electrode at all three frequency settings and two trigger signal types. Since the optimal working pH for Glu electrode was much higher than that of wine, NaOH was added into wine samples to reach a concentration of 0.5 M before tested by Glu electrode.
Figure 6c and show the response curves of PASP/NiO/GCE in S1. Since MRPV worked 12.21 s and MRPV worked 7.77 s in each wine sample for each electrode every testing time, there were 12.21 s/0.02 s × 3 electrodes = 18,315 data and 7.77 s/0.02 s × 3 electrodes = 11,655 data obtained. To preprocess the data, feature data extraction was necessary. Inflection point, maximum value and minimum value are commonly used as feature values. However, these features can only provide information in one dimension and are not sufficient for flavor information extraction. Therefore, the area that the response curves encircled was used as feature value in order to provide two-dimensional information for wine sample discrimination and reduce original response values to 3 electrodes × 2 potential waveforms × 3 frequencies = 18 feature values.
PLS and PCA were used to treat the information from the sensor array in order to visualize different wine sample groups. The Unscrambler was used to carry out both treatments. As shown in Figure 7a, some groups overlapped others and the boundaries among different groups were not obvious, especially for S1 (Greatwall) and S2 (Lafite). S3 (Penfolds) can be recognized easily from other samples, but the data of S3 (Penfolds) also dispersed out of the 95% normal range. Considering the discrimination results, PLS cannot be applied as an effective method of discriminating wine samples. Figure 7b presents the score plot of PCA. PCA is a method used to reduce dimension of data with the least important information lost during the process. The four types of red wine sample can be discriminated into different groups according to their denominations of origin, as is shown in Figure 7. The first three principal components capture 95.7% of the total variance (54.1%, 37.5% and 4.1% respectively). As can be observed, the four samples, of different denominations of origin were clearly grouped into four classes, despite the relatively dispersion in S2 (Lafite) and S3 (Penfolds). Besides, as the denominations of origin became farther from one another, the groups were much more easily discriminated. Since S1 (Greatwall) and S4 (Niya) both originated from different provinces in China, the two groups were much closer to each other than those originated from France or Australia.
Five types of methods (BPNN, RF, DNN, SVM and KNN) were applied for the prediction work and to examine the prediction ability of this VE-tongue system. The accuracy of both methods is shown in Table 2. BPNN is a nonlinear method that can get collected data rid of noise data and approach random nonlinear function. The layer number was set as 4, and the network topology was 18-64-64-4, with 18 nodes in the input layer, which represents 18 feature values extracted from raw data. There were two hidden layers, and 64 neurons in each hidden layer. The output layer had 4 nodes, representing four origins of wine. RF is based on decision tree ensemble learning and can avoid overfitting, noise, abnormal value, etc. that may interfere classification results. Classification accuracy was enhanced by using out-of-bag (OOB) estimation. In this study, 25 decision trees were used in RF to discriminate different wine by denominations of origin. Support vector machines (SVMs) represent one of these new and attractive methodologies, having been introduced to perform nonlinear classification and multivariate function estimation or nonlinear regression. Moreover, in the study, the radial basis function was used as the kernel function. DNN is a selective learning machine and has shown to perform well in the source separation, and the DNN training framework contains five layers (input layer, three hidden layers, and output layer). In the study, the network topology of DNN was 18-64-8-64-4. The KNN algorithm was used for classification based on the determination of the complexity of imbalanced datasets, and the metric captures the data complexity by focusing on the local information for each data point via the nearest neighbors (five nearest neighbors were selected in the study).
The 120 data sets were divided into training set (96 data sets) and prediction set (24 data sets): six samples of each red wine (24 samples in total) were randomly selected as the testing data subset, leaving 24 samples of each red wine (96 samples in total) to constitute the training data subset. As shown in Table 2, BPNN presented the best classification accuracy of 100% in the training set, and the best prediction accuracy of 95.8% in the testing set.

4. Conclusions

(1) The PASP/NiO/GCE, Cu/PTRP/Nafion/GCE, and Cu/PNR/GCE were successfully fabricated to detect Glu, TA, and non-specific information, respectively. The electrochemical behaviors of the wine chemicals on the proposed electrodes were tested by CV and DPV, and the experiment parameters of pH value, scan rate, and accumulation time were optimized gradually. The limits of detection of Glu and TA were 2 μM and 0.5 mM, which was far lower than their respective concentration in red wine samples.
(2) The three working electrodes were applied for the classification and prediction of red wine samples of different denominations of origin. MRPV and MSPV worked with the electrodes as potential waveforms, and the chronoamperometric responses were recorded as the original data. The feature data were extracted by the area method, and then processed by pattern recognition methods. All the samples could be classified completely in the 3D plot only through the application of the PCA method. Moreover, all the samples also grouped best in the PCA plot, compared to PLS. BPNN worked better and more stable than other methods, and the accuracy of the training set was 100%, while the prediction accuracy was 95.7%.
Therefore, the three novel working electrodes together with the BPNN processing method delivered a VE-tongue system that can successfully discriminate different red wine samples by their denomination of origins, thus cutting down the detection cost of a versatile E-tongue system without interfering in the discrimination capacity of the system.

Author Contributions

Conceptualization, S.Q. and Z.W.; methodology, Z.Z. and Z.W.; software, Z.Z. and S.Q.; validation, S.Q.; formal analysis, Z.Z.; investigation, S.Q. and Z.Z.; resources, Z.W.; data curation, Z.Z.; writing—original draft preparation, Z.Z. and S.Q.; writing—review and editing, S.Q.; visualization, S.Q.; supervision, S.Q.; project administration, S.Q. and Z.W.; funding acquisition, S.Q. and Z.W. All authors have read and agreed to the published version of the manuscript.

Funding

The authors acknowledge the financial support of National Key R&D Program of China (2019YFE0124600) and the National Science and Technology Planning Project of China (Grant No. 31972200).

Conflicts of Interest

The authors declare no conflict of interest.

References

  1. Bronzi, B.; Brilli, C.; Beone, G.M.; Fontanella, M.C.; Ballabio, D.; Todeschini, R.; Consonni, V.; Grisoni, F.; Parri, F.; Buscema, M. Geographical identification of Chianti red wine based on ICP-MS element composition. Food Chem. 2020, 315, 126248. [Google Scholar] [CrossRef] [PubMed]
  2. Muñoz-González, C.; Pérez-Jiménez, M.; Pozo-Bayón, M.A. Oral persistence of esters is affected by wine matrix composition. Food Res. Int. 2020, 135, 109286. [Google Scholar] [CrossRef] [PubMed]
  3. Jia, L.; Shuxia, H.; Junhong, Y.; Shumin, H.; Zhaoxia, Y.; Shuli, H.; Yuxin, Z. Beer taste evaluation using electronic tongue and the relationship between sensor information and flavor compounds. Food Ferment. Ind. 2019, 45, 196–201. [Google Scholar]
  4. Kutyła-Olesiuk, A.; Wesoły, M.; Wróblewski, W. Hybrid electronic tongue as a tool for the monitoring of wine fermentation and storage process. Electroanalysis 2018, 30, 1983–1989. [Google Scholar] [CrossRef]
  5. Martín-Vertedor, D.; Rodrigues, N.; Marx, Í.M.G.; Veloso, A.C.A.; Peres, A.M.; Pereira, J.A. Impact of thermal sterilization on the physicochemical-sensory characteristics of Californian-style black olives and its assessment using an electronic tongue. Food Control 2020, 117, 107369. [Google Scholar] [CrossRef]
  6. Walsh, E.A.; Diako, C.; Smith, D.M.; Ross, C.F. Influence of storage time and elevated ripening temperature on the chemical and sensory properties of white Cheddar cheese. J. Food Sci. 2020, 85, 268–278. [Google Scholar] [CrossRef]
  7. Jiang, H.; Zhang, M.; Bhandari, B.; Adhikari, B. Application of electronic tongue for fresh foods quality evaluation: A review. Food Rev. Int. 2018, 34, 746–769. [Google Scholar] [CrossRef]
  8. Tan, J.; Xu, J. Applications of electronic nose (e-nose) and electronic tongue (e-tongue) in food quality-related properties determination: A review. Artif. Intell. Agric. 2020, 4, 104–115. [Google Scholar] [CrossRef]
  9. Han, F.; Zhang, D.; Aheto, J.H.; Feng, F.; Duan, T. Integration of a low-cost electronic nose and a voltammetric electronic tongue for red wines identification. Food Sci. Nutr. 2020, 8, 4330–4339. [Google Scholar] [CrossRef]
  10. Rudnitskaya, A.; Schmidtke, L.M.; Reis, A.; Domingues, M.R.M.; Delgadillo, I.; Debus, B.; Kirsanov, D.; Legin, A. Measurements of the effects of wine maceration with oak chips using an electronic tongue. Food Chem. 2017, 229, 20–27. [Google Scholar] [CrossRef]
  11. Gutiérrez, J.M.; Moreno-Barón, L.; Pividori, M.I.; Alegret, S.; del Valle, M. A voltammetric electronic tongue made of modified epoxy-graphite electrodes for the qualitative analysis of wine. Microchim. Acta 2010, 169, 261–268. [Google Scholar] [CrossRef]
  12. Milovanovic, M.; Žeravík, J.; Obořil, M.; Pelcová, M.; Lacina, K.; Cakar, U.; Petrovic, A.; Glatz, Z.; Skládal, P. A novel method for classification of wine based on organic acids. Food Chem. 2019, 284, 296–302. [Google Scholar] [CrossRef] [PubMed]
  13. Kalinke, C.; de Oliveira, P.R.; Bonet San Emeterio, M.; González-Calabuig, A.; del Valle, M.; Salvio Mangrich, A.; Humberto Marcolino Junior, L.; Bergamini, M.F. Voltammetric electronic tongue based on carbon paste electrodes modified with biochar for phenolic compounds stripping detection. Electroanalysis 2019, 31, 2238–2245. [Google Scholar] [CrossRef]
  14. Zhao, H.; Xu, J.; Sheng, Q.; Zheng, J.; Cao, W.; Yue, T. NiCo2O4 Nanorods decorated MoS2 nanosheets synthesized from deep eutectic solvents and their application for electrochemical sensing of glucose in red wine and honey. J. Electrochem. Soc. 2019, 166, H404–H411. [Google Scholar] [CrossRef]
  15. Shokrekhodaei, M.; Quinones, S. Review of non-invasive glucose sensing techniques: Optical, electrical and breath acetone. Sensors 2020, 20, 1251. [Google Scholar] [CrossRef]
  16. Wang, J.; Wan, Z.; Xu, C.; Zhang, K.; Wang, W.; Zhang, Z. Comparative analysis of organic acids in wine grape fruits from Xinjiang. Food Sci. Technol. Res. 2020, 36, 249–254. [Google Scholar]
  17. Yalcin, D.; Özçalık, O.; Altıok, E.; Bayraktar, O. Characterization and recovery of tartaric acid from wastes of wine and grape juice industries. J. Therm. Anal. Calorim. 2008, 94, 767–771. [Google Scholar] [CrossRef]
  18. Wang, H.; Ni, Z.J.; Ma, W.P.; Song, C.B.; Zhang, J.G.; Thakur, K.; Wei, Z.J. Effect of sodium sulfite, tartaric acid, tannin, and glucose on rheological properties, release of aroma compounds, and color characteristics of red wine. Food Sci. Biotechnol. 2019, 28, 395–403. [Google Scholar] [CrossRef]
  19. Donmez, S. A novel electrochemical glucose biosensor based on a poly (L-aspartic acid)-modified carbon-paste electrode. Prep. Biochem. Biotechnol. 2020, 50, 961–967. [Google Scholar] [CrossRef]
  20. Zhang, Y.; Lin, F.F.; Wei, T.; Pei, L.Z. Facile synthesis of Cu bismuthate nanosheets and sensitive electrochemical detection of tartaric acid. J. Alloys Compd. 2017, 723, 1062–1069. [Google Scholar] [CrossRef]
  21. Wang, J.; Zhu, L.; Zhang, W.; Wei, Z. Application of the voltammetric electronic tongue based on nanocomposite modified electrodes for identifying rice wines of different geographical origins. Anal. Chim. Acta 2019, 1050, 60–70. [Google Scholar] [CrossRef] [PubMed]
  22. Wei, Z.; Zhang, J.; Shao, W.; Wang, J. Fabrication and application of three-dimensional nanocomposites modified electrodes for evaluating the aging process of Huangjiu (Chinese rice wine). Food Chem. 2022, 372, 131158. [Google Scholar] [CrossRef] [PubMed]
Scheme 1. Schematic present of process flow and instrument set-up.
Chemosensors 10 00332 sch001
Figure 1. XRD pattern of NiO on PASP/NiO/FTO (a) and Cu/PTRP/FTO and Cu/PNR/FTO (b).
Chemosensors 10 00332 g001
Figure 2. SEM images of (a) PASP/NiO/GCE, (b) Cu/PTRP/Nafion/GCE, and (c) Cu/PNR/GCE.
Chemosensors 10 00332 g002
Figure 3. XPS spectra of PASP/NiO (a), Ni 2p in PASP/NiO (b), Cu/PTRP (c), Cu/PNR (e), Cu 2p in Cu/PTRP (d), Cu 2p in Cu/PNR (f).
Chemosensors 10 00332 g003
Figure 4. Electrochemical behavior of Glu at PASP/NiO/GCE: (a) CV curves of detecting 100 μM Glu in Glu 0.1 M–0.5 M NaOH buffer; (b) CV curves of detecting 100 μM Glu in 0.1 M–0.5 M NaOH buffer; (c) The relation between accumulation time and peak current of CV curve in 100 μM Glu; (d) Chronoamperometric determination of Glu with PASP/NiO/GCE.
Chemosensors 10 00332 g004
Figure 5. Electrochemical behavior of TA at Cu/PTRP/Nafion/GCE: (a) DPV curves of detecting 0.5 M~5 M TA solution with Cu/PTRP/Nafion/GCE; (b) CV curves of detecting 0.5 M~5 M TA solution with Cu/PTRP/Nafion/GCE; (c) CV curves of detecting Glu solution, TA solution and mix solution of Glu and TA with Cu/PNR/GCE.
Chemosensors 10 00332 g005
Figure 6. Trigger signal of Squares wave (a) and trapezoidal wave (b); response curve of S1 on Glu electrode triggered by squares wave (c) and trapezoidal wave (d).
Chemosensors 10 00332 g006
Figure 7. PLS (a) and PCA (b) scores plot of four wine samples.
Chemosensors 10 00332 g007
Table 1. Characteristics of wine samples under study.
SampleBrandDenominations of OriginsType of Grape
S1GreatwallShacheng, Hebei, ChinaCabernet Sauvignon
S2LafiteFranceCabernet Sauvignon
S3PenfoldsAustraliaCabernet Sauvignon, Shiraz
S4NiyaChangji, Xinjiang, ChinaCabernet Sauvignon
Table 2. Classification accuracy of BPNN and RF.
MethodParameter 1Training AccuracyPrediction Accuracy
BPNN18-64-64-4100%95.8%
DNN18-64-8-64-4100%94.5%
RF25100%91.7%
SVMradial basis function98.9%79.2%
KNN590.6%75%
1 The parameter of BPNN is layer number and network topology, the number in each layer means node number; the parameter of DNN is the network topology; the parameter of RF is decision tree number; the parameter of SVM is the type of kernel function; the parameter of KNN is the K values (the k neighbor samples with the smallest distance from the current sample).
Publisher’s Note: MDPI stays neutral with regard to jurisdictional claims in published maps and institutional affiliations.

