
Semiconductor-Type Gas Sensors Based on γ-Fe2O3 Nanoparticles and Its Derivatives in Conjunction with SnO2 and Graphene


1
Department of Materials Science and Chemical Engineering, Zhongyuan University of Technology, Zhengzhou 450007, China
2
College of Science, Zhongyuan University of Technology, Zhengzhou 450007, China
*
Author to whom correspondence should be addressed.
Chemosensors 2022, 10(7), 267; https://doi.org/10.3390/chemosensors10070267
Submission received: 11 May 2022
/
Revised: 18 June 2022
/
Accepted: 2 July 2022
/
Published: 8 July 2022
(This article belongs to the Special Issue High-Sensitivity and -Selectivity Gas Sensors with Nanoparticles, Nanostructures, and Thin Films)
Abstract
:The gas sensitivity of semiconductor metal oxides, such as γ-Fe2O3 and SnO2, is investigated together with the synergistic effects in conjunction with grapheme. Nanoparticles of γ-Fe2O3, γ-Fe2O3/SnO2, and γ-Fe2O3/SnO2/RGO, prepared by two-step fabrication, were assembled in gas-sensing devices to assess their sensitivities; response and recovery times for the detection of ethanol, methanol, isopropanol, formaldehyde, H2S, CO, and NO gases at different temperatures but constant concentrations of 100 particles per million (ppm); and H2S, which underwent the dynamic gas sensitivity test in different concentrations. Each sample’s crystallinity and microscopic morphology was investigated with X-ray diffraction and a scanning electron microscope. In comparative gas sensitivity measurements, the ternary composite of γ-Fe2O3/SnO2/RGO was identified as an ideal candidate, as it responds to all four tested liquids in the gas phase as well as H2S with a response value equal to 162.6. Further, only the ternary composite γ-Fe2O3/SnO2/RGO hybrid nanoparticles responded to NO gas with a sensor response value equal to 4.09 in 12 s. However, only the binary composite γ-Fe2O3/SnO2 responded to CO with a corresponding sensitivity of 1.59 units in 7 s.
1. Introduction
High sensitivity gas sensors are key for the management of combustible and toxic gases in the oil and gas, chemical, mining, and power industries. This sector discharges an enormous amount of gases, such as carbon monoxide, ammonia, carbon dioxide, hydrogen sulfide, and hydrocarbons [1]. Thinking about the environmental impact of the aforementioned gases, we can say that an extensive discharge of those gases may have a damaging effect on the matter of health and safety. The discharge of explosive gases, e.g., methane, propane, and butane, can lead to unwanted fire events [2]. Various protective and mitigating restrictions are being implemented to protect the ecosystem from harmful gases that require tracking and monitoring of dangerous gases and implementation of preventive measures ensuring that only small amounts of these gases are released directly into the atmosphere.
Nowadays, it is clearly seen that gas-sensing technologies are broadening their occupation areas, starting with environmental monitoring, the chemical industry, and natural gas analyzing techniques in petroleum engineering applications, including breath analyzers [3], medical diagnosis methods, and safety systems [4].
Graphene is the most renowned and exceptional members of CNPs’ family, as it is a single-layer allotrope form of carbon atoms settled in a 2D hexagonal lattice where each atom constructs a pinnacle. Firstly, it was observed in 1962 by electron microscopes, yet it was only researched when supported on surfaces of metal. This material was rediscovered later. Andre Geim and Konstantin Novoselov isolated and described it in 2004 at the University of Manchester; the Nobel Prize was awarded to them for this work in 2010 [5]. Since then, it has continued to attract more and more researchers and scientists making nano-compositions based on graphene.
A specific surface area of 2630 m2/g [6] was theoretically assigned to graphene, which was three times that of carbon black and almost similar to activated carbon. Since graphene has a 2D structure, it allows every single atom to participate in a chemical reaction from both sides, and it is the only form of carbon or any solid material that has such a property. In addition to that, there is a special chemical reactivity at the outermost atoms of graphene. Among the other allotropes, graphene has the highest ratio of edge. The chemical reactivity of graphene increases with an increase in the defects within a sheet.
Graphene is regarded as a zero-gap semiconductor because its valence and conduction bands meet at the Dirac point [7].
Even at room temperature, graphene has outstanding electron mobility with a value of more than 15,000 cm2⋅V−1⋅s−1 [8], where the hole and electron mobility remain unchanged.
Basic knowledge about the properties of carbon nanomaterials is crucial to further develop multi-functional material systems. Nanostructured materials of a nano size and extraordinary shapes offer extremely high surface-to-volume ratios, and, regarding the surface activity, carrier mobility is exploited to improve sensitivity of the semiconductor metal oxide (SMO) [9]. Recent studies have investigated different types of graphene that have been functionalized with SMO materials; these have shown considerable promise in detecting many reducing and oxidizing gases, such as H2 [10], NH3 [11], H2S [12,13,14,15], H2S at 100 ppm and 24 °C (S = 87%; Tres = 14; Trec = 32;) [16], NOx [17], CO, O2 [18], liquid petroleum [19], ethanol, methanol, isopropanol, formaldehyde, toluene, acetone, and so on [20,21].
Thanks to these features, graphene might be useful in the formation of a variety of novel gas-sensing materials to decrease the maintenance temperatures of their sensing devices in order to detect harmful gases.
The ternary composite γ-Fe2O3 (maghemite) is important in the conventional fabrication of magnetic materials. It is a semiconductor metal oxide with a band gap of ca. 2 eV in bulk form; in the form of nanoparticles, the calculated value is 3.9 eV, though this can be adjusted with the dopants [22]. Maghemite is a post-product of Fe2+-containing compounds, such as magnetite or titanomagnetite, made by erosion or controllable oxidation at lower temperatures [23]. These methods were considered to produce γ-Fe2O3 in a proper particle size and surface area [24] in this study. The electronic structure of γ-Fe2O3 suggests an n-type semiconductor due to vacancies in the valence band and a conduction band populated by electrons [25]. Higher conductivity can be reached through combination with a less defective graphene that displays p-type semiconductor properties [26]; this was further confirmed by the preparation of a γ-Fe2O3/RGO-sensing device working at room temperature (S = 520.73 at 97 ppm) [27].
Several researchers have investigated another n-type semiconductor oxide, SnO2, with a band gap equal to 3.6 eV [28]. With its high gas sensitivity, absorption, and environmentally friendly profile, this substance is already used in the preparation of numerous gas-sensing products [29]. Gas sensors made of SnO2 and its compositions were studied to detect different organic vapors, such as formaldehyde (Sr = 9 at 200 ppm) [30], acetone (Sr = 153; Tres = 10 s; Trec = 12 s) [31], and many other VOCs (volatile organic compounds) [32], as well as its conjugations with graphene to detect toxic gases, such as H2S (Sr = 23.9 at 200 ppb) [33]; the SnO2/RGO sensor for H2S operates at room temperature (Sr = 33; Tres = 2 s at 50 ppm) [34].
It is proposed that a combination of these two concepts makes it possible to achieve better improvements in the manufacture of sensing devices and to enhance current fast-time and accurate responses [35,36].
A series of novel gas-sensitive films are produced by combining semiconductor metal oxides (SMO) (e.g., γ-Fe2O3, SnO2) with graphene oxide [37]. Experimentation with these films investigates the accuracy of response reactions toward a variety of harmful gases and liquids in a gas phase and establishes the performance of these novel films at lower working temperatures. The research aims to synthesize novel types of gas sensor media based on SMOs and graphene by use of relatively cost-effective and easier methods, and to measure materials’ sensitivity capabilities toward different gases to estimate their possible implementation into practical use to fabricate industrial gas sensing devices.
2. Materials and Methods
Samples were produced via a double-step synthesis involving solvothermal and successive sintering [38,39].
2.1. Materials
Graphene oxide (Deyang Alkene Carbon Technology Co., Ltd., Deyang, China), ferric (III) chloride hexahydrate (Shanghai Zhanyun Chemical Co., Ltd., Shanghai, China), tin (II) chloride dihydrate, sodium acetate anhydrous (Tianjin Fengchuan Chemical Reagent Technology Co., Ltd., Tianjin, China), and polyethylene glycol (Tianjin Kemiou Chemical Technology Co., Ltd., Tianjin, China) were used. All reagents were used at an analytical degree of purity and without further purification.
2.2. Preparation of γ-Fe2O3 Nanospheres
FeCl3·6H2O was used as the iron precursor. An amount of 1.012 g of FeCl3·6H2O was added to 50 mL of ethylene glycol in a beaker and stirred for 20 min; once a uniform solution was obtained, 2.7 g of sodium acetate and 0.75 g of polyethylene glycol (PEG-20000) were added to the solution and stirred vigorously for an hour. Then, the mixture was poured into a 100-mL Teflon-lined stainless-steel autoclave and kept in a heating oven at 200 °C for 12 h. After cooling, the black-colored nanospheres were collected, washed 5 times with ethanol and deionized water, and centrifuged with a mixture of ethanol and DI water in a 1:1 volume ratio at 4000 RPM (revolutions per minute) for 10 min after each wash. The Fe3O4 yield was separated with a magnet, dried at room temperature, ground into a fine powder, and placed into a crucible for sintering in a furnace. The heating rate was set at 5 °C·min−1 until it reached 300 °C, and then the temperature was kept steady at 300 °C for 2 h to produce γ-Fe2O3. After natural cooling, the as-prepared reddish-brown γ-Fe2O3 nanospheres were collected [40].
2.3. Preparation of γ-Fe2O3/SnO2 Nanoparticles
Nanoparticles of γ-Fe2O3/SnO2 were synthesized in a 7.5/1.5 ratio. An amount of 1.012 g of FeCl3·6H2O was added to 30 mL of ethylene glycol and stirred for 20 min; once a homogenous solution was obtained, 2.7 g of sodium acetate and 0.15 g of polyethylene glycol (PEG-20000) were added to the solution and stirred for an hour at room temperature. Simultaneously, 0.09 g of SnCl2·2H2O and 1.3 g of sodium acetate were put into a beaker with 20 mL of ethylene glycol and vigorously stirred at 60–70 °C for 2 h on a thermostat magnetic stirrer. Then, the two mixtures were sealed in a 100-mL stainless-steel autoclave and thermally treated at 200 °C for 10 h. After naturally cooling down, the mixture was washed with deionized water and ethanol several times, centrifuged, and dried at room temperature. The dried mixture was then collected and placed into a ceramic crucible and sintered in a high-temperature furnace at a heating rate of 5 °C·min−1 until the temperature reached 300 °C. It was kept at this temperature for 2 h. The product was cooled in ambient conditions and collected for later use.
2.4. Preparation of γ-Fe2O3/SnO2/RGO Hybrid Nanoparticles
Nanoparticles of γ-Fe2O3/SnO2/RGO were synthesized in a 1/7.5/1.5 ratio. An amount of 1.012 g of FeCl3·6H2O was added to 30 mL of ethylene glycol and stirred for 20 min; once a homogenous solution was obtained, 2.7 g of sodium acetate and 0.15 g of polyethylene glycol (PEG-20000) were added to the solution and vigorously stirred for an hour. At the same time, 0.09 g of SnCl2·2H2O and 1.3 g of sodium acetate were put into a beaker with 20 mL of ethylene glycol and stirred at 60–70 °C for 2 h. Then, the two mixtures and 10 mL of GO (4 mg·mL−1) were sealed in a 100-mL stainless-steel autoclave and heated at 200 °C for 10 h. After naturally cooling down, the mixture was washed with deionized water and ethanol 5 times, centrifuged, and dried at room temperature. The dried mixture then was placed into a ceramic crucible and sintered in a high-temperature furnace at a heating rate of 5 °C·min−1 until the temperature reached 300 °C. It was kept at this temperature for 2 h. The product was cooled in ambient conditions and collected for later use.
2.5. Characterization of Phases and Microstructures
Synthesized samples were characterized with an UItima IV X-ray diffractometer (Rigaku Electric Corporation) (Cu Kα radiation) at a scanning speed of 10°/min and a scanning range of 2θ = 10–80°. The XRD analysis determined if precursors were correctly transformed into the desired materials.
SEM images and EDS spectrum data were obtained by Zeiss Sigma-300 (Carl Zeiss AG).
2.6. Fabrication of Gas-Sensing Devices
Sensing devices were fabricated with a brush coating method. A Ni-Cr alloy heating coil (Figure 1b) was passed through the alumina tube (Figure 1a), and then an alumina microtube was placed and fixed to a special platform with 6 poles. Next, 4 electrodes made of Pt were soldered to 4 contact poles on the platform [41]; the heating coil with 2 legs was soldered to the remaining 2 poles of the pedestal, respectively (Figure 1d). All test samples were marked and ground into fine particles in an agate mortar grinder with the addition of absolute ethanol, and a small brush was used to lightly attach the ground samples. After applying samples on the alumina ceramic tube, the coating process proceeded until an even coating layer was formed. Completely formed devices were installed on a large circuit board with 32 inlet slots.
2.7. Measurement of Gas-Sensitivity Performance of the Sensors
Gas-sensing performance in static testing conditions was assessed with a computer-controlled data acquisition system interface provided by Winsen WS-30A testing equipment (Winsen Electronics Technology Co., Ltd., Zhengzhou, Henan). Experimental gas sensors were installed on a circuit in a connector within a securely fastened transparent glass chamber (approximately 16.7 L volume) that restricted the gas flow between the inlet and outlet. The data acquisition system detects resistance changes through the connector; it reads, processes, and reports results as statistical graphs [42]. The final response data is derived from simple statistical averages. Samples of target gases were taken from gasbags and injected into the reaction system using micro-syringes (1–10 μL volume). Gas sample concentrations were calibrated to exactly 100 ppm using a known organic vapor density and the test chamber’s volume (Table 1). The operational temperature points were set at 100 °C, 160 °C, 200 °C, and 300 °C [43], and the ambient relative humidity varied between 18 and 40%. During temperature tolerance experiments, the temperature sensing devices lost stability above 370 °C, producing unstable fluctuations on the statistical graphs.
Prior to injecting any target gas into the sensing chamber, the reaction system was first sealed at the start of each test run, and the instruments were heated until a stable graph line appeared on the testing software. Graphic information and corresponding data from the test system were used to calculate component voltage values, resistance values, and the response time and recovery time of the component. An identical integral circuit of the gas-sensing media is shown in Figure 1f. The sensor components (R) are connected in a series with the load resistor (R0) with a known resistance of 47 MΩ, and a source voltage (U0) of 5 V is applied. The sensitivity (S) of each response is calculated (1) based on the absolute difference in resistance between the sensor in synthetic air (Rair) and in the gas-injected test atmosphere (Rgas).
The resistance (R) of each response is calculated by measuring the voltages (U) applied to the resistor R0 (2)
The sensitivity response (Sr) for the n-type semiconductor sensors in (1) electron-donating gas atmospheres is calculated using Formula (3); in electron-withdrawing gas atmospheres, it is calculated using Formula (4) where Ra is the resistance of the sensors in air, and Rg is the resistance in the target gases [44]. Since we observed a voltage elevation caused by a decrease in resistance when the sensing components made contact with the target gases, Formula (3) was used to calculate the sensitivity response values.
where the response time (τres) denotes the time that is necessary for the sensor to reach 90% of its maximum resistance change post-exposure to samples of target gas molecules. The recovery time (τres) indicates the time elapsed between the target gas’s elimination from the test chamber and until the sensor returns to 90% of its initial resistance [45].
3. Results and Discussion
3.1. Characterization
3.1.1. Characterization of γ-Fe2O3
The reaction mechanism involved in the solvothermal synthesis of Fe3O4 can be expressed by the following initial reaction [46]. At the beginning of the process, dissolving iron (III) chloride and sodium acetate in ethylene glycol leads to the formation of the Fe(OH)3:
When the mixture is heated at the high temperature of 200 °C, close to the boiling point of ethylene glycol (197 °C), the ethylene glycol reacts as a reducing agent to produce iron (II) hydroxide:
Consequently, the two iron (III) and iron (II) hydroxides then react in a 2:1 molar ratio at the high temperature of 200 °C to form magnetite nanospheres:
Finally, magnetite undergoes an oxidation reaction in the sintering furnace at the controllable temperature of 300 °C.
Black-colored Fe3O4 nanoparticles have high crystallinity rates when produced via solvothermal synthesis (Figure 2b). The results were compared in agreement with the reference patterns of Fe3O4 phase (Figure 2a), and the following characteristic peaks at 2θ values were observed at the corresponding atomic planes: 18.3° (111), 30° (220). The highest intensity peaks were observed at 35.4° (311), 43.1 (400), 57° (333), 62.5° (440) and 74° (533) [47].
The presence of the as-prepared γ-Fe2O3 nanospheres in samples sintered from the previously investigated Fe3O4 was investigated using an XRD analysis. While an XRD spectral sample analysis of the samples mostly yields distinct structural patterns, complexity remains in distinguishing between the Fe3O4 and γ-Fe2O3 phases due to differential identities for some decimal units on the peak representing angles. Further differentiation is possible using atomic plane numbers.
Characteristics of the XRD spectra from the samples were analyzed in comparison to reference diffraction patterns (Figure 2d). The presence of the as-prepared γ-Fe2O3 is confirmed by comparing the peak angles at 30.3° (220), 35.6° (311), 43.25° (400), 53.7° (422) 57.2° (511), and 63° (440) with their respective atomic planes. However, the atomic plane at 2θ = 57.2° (511) might be considered similar to a contrast between the γ-Fe2O3 and the Fe3O4 with an almost similar peak angle at 2θ = 57° (333) (Figure 2b). Further, the light brown color of the sample mentioned in the JCPDS card 39-1346 provides further confirmation of an effective synthesis of the maghemite nanoparticles.
To prepare the nanoparticle samples for SEM analysis, a thin layer of gold plating (up to a dozen atomic layers) was sprayed to cover their surface due to the super-paramagnetic properties of these samples [48].
The experimental γ-Fe2O3 samples appear as relatively uniform spheres composed of nanocrystal aggregates (Figure 3) in which the population of the spherical particles on their own created a highly porous microstructure, simultaneously leading to an increase in the density of theactive surface. The morphology and particle size of the experimental γ-Fe2O3 nanospheres was not expressively changed during the sintering oxidation of the Fe3O4 nanospheres; instead, the resultant nanoparticles are more tightly aggregated.
3.1.2. Characterization of γ-Fe2O3/SnO2
A two-step synthesis, in which the initial mixture was stirred at 60–70 °C before being passed to the higher temperature second reaction stage, was implemented to avoid rapid homogeneous nucleation of SnO2 in the first step [49].
Characteristics of the XRD spectra from the samples were analyzed in comparison to reference diffraction patterns (Figure 2d–f). The γ-Fe2O3/SnO2 nanoparticles’ XRD spectra show five high points, including a representation of three superimposed peak positions at 30° (111), 35.7° (021) (JCPDS 29-1484), and 62.8° (311) (JCPDS 33-1374) for tin dioxide, and, at the same, 2θ angles with corresponding atomic planes of (220), (311), and (440) for maghemite overlaid with tin dioxide, whereas the remaining two peaks come out at 43.3° (400) and 57.2° (511) (JCPDS 39-1346), confirming the γ-Fe2O3 phase.
The SEM image of this experimental binary metal oxide compound (Figure 4a) displays a very densely populated morphological structure with nanospheres that contain huge numbers of porous micro-clusters at the same time.
The high weight (wt = 75.99%) and atomic (at = 63.78%) percentage of iron (Figure 4b) produces this very dense formation of γ-Fe2O3 nanospheres. While graphene oxide was not used in the production of this sample, the footprints of carbon atoms are apparent. It is presumed that the carbon atoms identified in the EDS spectrum result from carbon containment in the previous reactions shown in Equation (6).
3.1.3. Characterization of γ-Fe2O3/SnO2/RGO
Characteristics of the XRD spectra from the samples were analyzed in comparison to reference diffraction patterns (Figure 2h). The spectra display the same five diffraction peaks in Figure 2f, with three overlaying positions that represent the γ-Fe2O3 and SnO2 phases merged together and two distinct positions for the γ-Fe2O3 phase itself. However, two additional diffraction peaks exist: one at 2θ = 26.3°, representing RGO at the atomic plane (002), and another at 2θ = 53.7°, belonging to the γ-Fe2O3 phase at atomic plane (422). These spectra provide confirmation of an effective synthesis of the γ-Fe2O3/SnO2/RGO nanoparticles.
SEM imaging of the morphological surface structure of the γ-Fe2O3/SnO2/RGO hybrid nanoparticles (Figure 5) can be characterized as the accumulation of these two metal oxide nanoparticles on the surface of graphene sheets. The joint growth of the metal oxides on the surface of the graphene is observable in an SEM image in Figure 5b.
An EDS inspection of the surface content of the sample recorded that a majority of the surface is distributed by iron by weight and carbon by atomic dispersion (Figure 6), while only 11% of the weight content and a minor 3% of the atomic dispersion is accounted for for tin.
Elemental mapping documents an interesting arrangement of the atoms. Iron and tin appear to be superimposed (Figure 7b,c); however, the carbon atoms extend to other parts (Figure 7d). It becomes visible that the central field of the scanning region is excessively occupied with iron due to the excessively high γ-Fe2O3 content of wt = 65.52% and at = 35.19%.
3.2. Gas-Sensing Mechanism
The semiconductor materials selected for this topic, γ-Fe2O3 and SnO2, are both n-type semiconductors. For n-type semiconductors, when the semiconductor material and the target gas are fully reacted, an oxidation–reduction reaction occurs. When the reaction has not yet started, the oxygen molecules on the surface of the semiconductor can snatch electrons to become adsorbed oxygen anions and, eventually, transform into O2−, O−, and O2− Equation (9).
Since many electrons are looted near the surface of the semiconductor in the adsorbed oxygen, the surface layer of the material turns into an electron depletion layer; therefore, the gas sensor’s potential barrier increases, and, as a result, the conductivity decreases. However, this process increases the electric resistance of the material. The resistance of the sensor significantly decreases when a certain concentration of gas is injected into the testing chamber and the sensing devices make contact with the target gases.
When the gas sensor reacts with the reducing gases (such as NO, CO, H2S, CH3OH, CH2O, etc.), the reducing gas molecules will undergo oxidation–reduction reactions with the adsorbed oxygen ions (Equations (10)–(12)). At this time, the previously captured electrons will be released back to the conduction band. Therefore, with the use of these electrons as an electric charge carrier, generation of a surface depletion layer occurs on the semiconductor’s surface [50]. As was noted in previous reports [51], when the sensors are exposed to an electron-donating gas, the resistance of a hybrid sensor with a p-n heterojunction might be enhanced due to expansion of the depletion layer.
As the H2S gas is injected into the test chamber, more electrons start to flow through the conduction layer because the presence of H2S gas eliminates adsorbed oxygen on the surface of semiconductor materials, Equation (12), simultaneously narrowing down the potential barrier [52]. Therefore, the heterostructure of the γ-Fe2O3/SnO2 nanocomposites can provide a high specific surface area and more active sites [53], so that the oxygen molecules and gas molecules can be intensively absorbed on the surface of the sensing materials. In addition to that, the empty holes of RGO, acting as a p-type semiconductor, will lead to a shortening of the time of electron transmission.
3.3. Results and Discussion on the Gas-Sensitivity Test for Organic Vapors
The sensitivity of experimental nanoparticles for the detection of gases was initially investigated using four liquids: methanol, ethanol, isopropyl alcohol, and formaldehyde in a gas phase. The gas concentrations were set at 100 ppm, and the temperature varied at 100 °C, 160 °C, and 200 °C with a relative humidity range from RH = 20% to RH = 38%. Finally, the values for sensor response (Sr), response time (Tres), and recovery time (Trec) were calculated and recorded (Table 2).
Relying on the data illustrated in Table 2, the lowest sensor response among all the tests was observed from single-component γ-Fe2O3 nanospheres when the samples were exposed to methanol at 160 °C. In contrast, the highest sensitivity (Sr value: 22.16) was also observed from γ-Fe2O3 nanospheres exposed to isopropyl alcohol at 200 °C (Figure 8c). Many experimental nanospheres did not respond at 100 °C, and the gas sensitivities of the materials were comparably lower at 160 °C. Sensing capabilities increased as the temperatures increased, with a similar trend in improving the response and recovery times. The fastest results (Tres = 12 s and Trec = 9 s) were observed with the ternary composite γ-Fe2O3/SnO2/RGO at 200 °C. The longest recovery time (Trec = 107 s) was observed for γ-Fe2O3 when it was exposed to ethanol vapor at 200°, with a simultaneous best response (Sr = 16.4 s) in the same experiment.
The tests show that, in several gas-sensitivity measurements targeted to organic liquids in a gas phase, the binary component γ-Fe2O3/SnO2 recorded lower response values than those of the pure γ-Fe2O3. In this case, it is believed that the heterojunction could reduce the recombination of the electron and hole and, simultaneously, allow the electrons to move effectively from the surface of the sensing materials to the reducing gas.
3.4. Results and Discussion on the Gas-Sensitivity Test for H2S, CO, and NO Gases
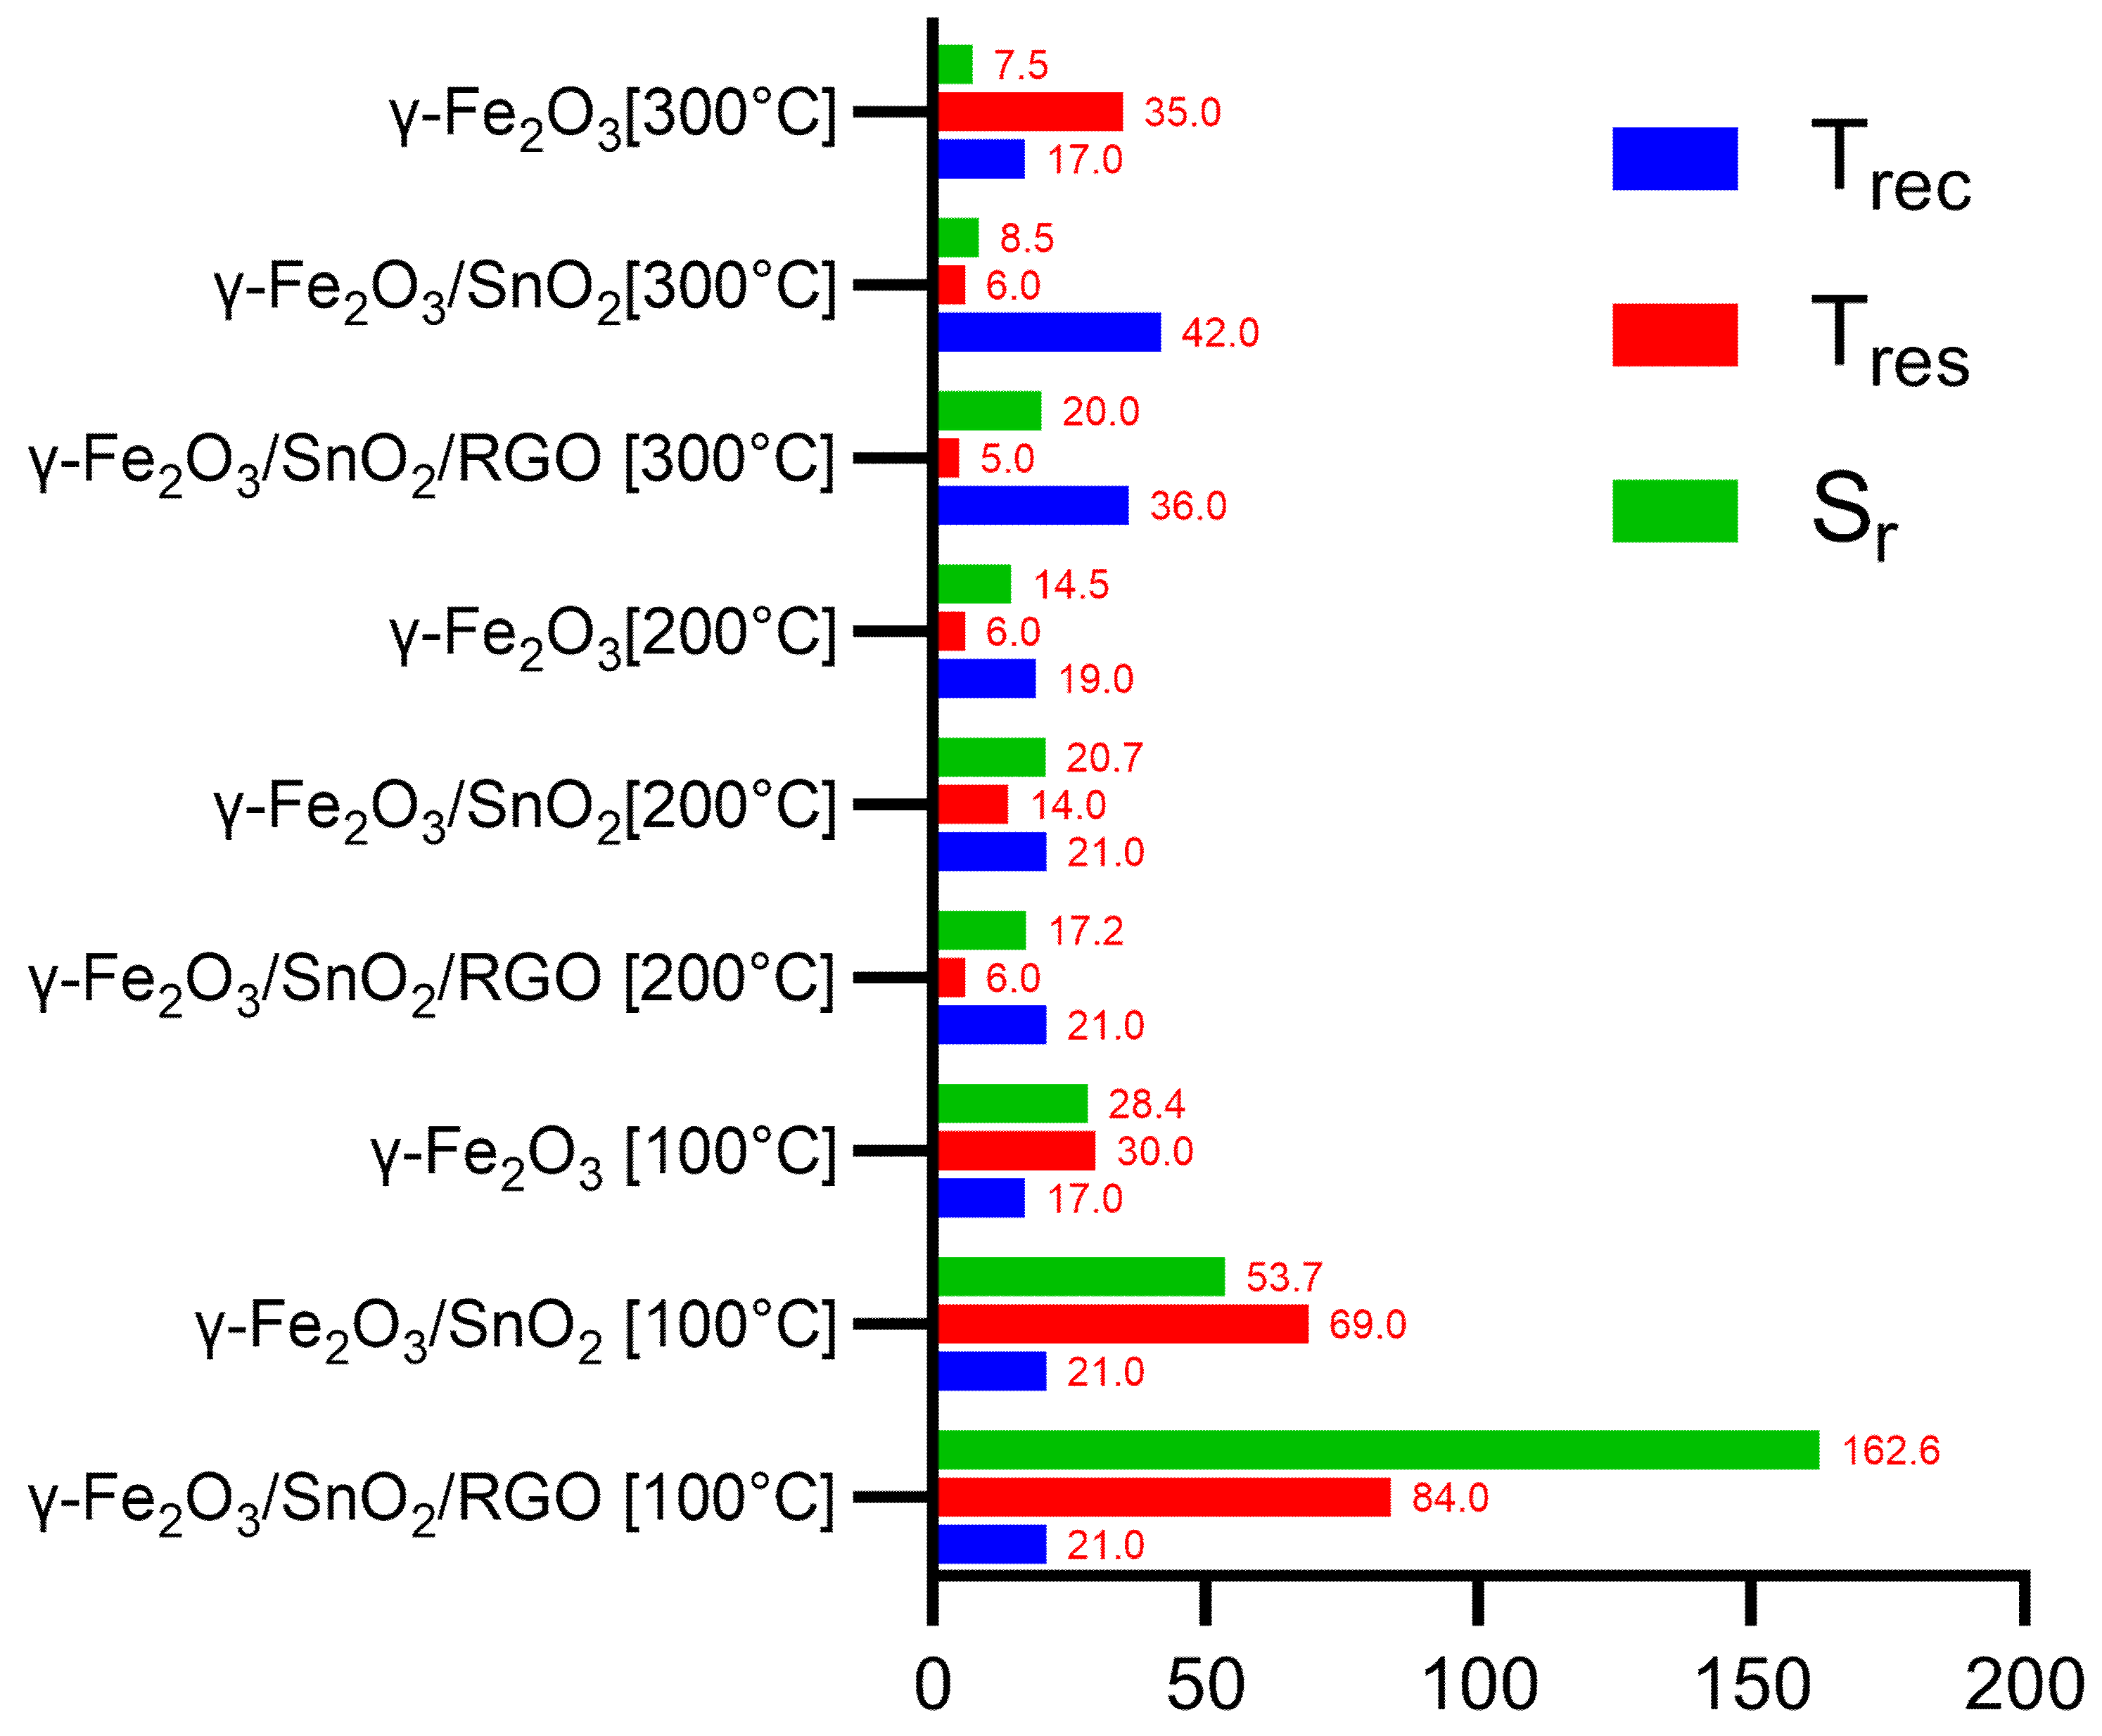
When investigating the experimental nanoparticle sensitivity to H2S gas at 100 °C (Figure 9a), 200 °C (Figure 9b), and 300 °C, a strong differentiation was observed in the sensor response. The leading result (Sr = 162.6 points at 100 °C) was observed with γ-Fe2O3/SnO2/RGO hybrid nanoparticles and a comparably longer response time (Tres = 84 s). While γ-Fe2O3/SnO2/RGO hybrid nanoparticles’ sensitivity showed major declines with an increase in temperatures (Sr = 17.2 points at 200 °C; Sr = 20 value at 300 °C), the response time improved significantly from Tres = 84 s to 6 s (a decrease of 78 s in sensitivity time), with an extra 1 s increase at 300 °C. It is suggested that this improved reaction response is achieved due to improvements in the surface area responsive to H2S and an increased electron transfer to the graphene layer provided by a large population of the tiny γ-Fe2O3 nanospheres [54].
Figure 10 and Figure 11 display the dynamic response values of sensing materials upon exposure to different concentrations of H2S. It is clearly visible that the Sr values increased alongside the concentration, and the ternary component γ-Fe2O3/SnO2/RGO recorded dominant points at all concentrations. Figure 12 shows the sensitivity responses towards H2S at different temperatures.
While the sensitivity of the experimental nanoparticle to CO gas was investigated at 200 °C, 240 °C, 270 °C, 300 °C, and 370 °C, measurable but limited responses were only observed at 300 °C with the binary SMO component of γ-Fe2O3/SnO2 nanoparticles (Sr = 1.59 units in Tres = 7 s and Trec = 18 s).
In sensitivity tests to NO gas, the ternary component γ-Fe2O3/SnO2/RGO hybrid nanoparticles were the only experimental material to respond (at 100 °C [55]; Sr = 4.09 points in Tres = 12 s and Trec = 14 s).
Other experimental materials did not show sensitivity reactions to CO and NO.
4. Conclusions
Nanomaterials containing two kinds of n-type semiconductor metal oxides (γ-Fe2O3 and SnO2) were prepared via relatively simple methods to create a p-n heterojunction within SMOs and their reduced GO layers. The prepared sensing composites were brush-coated on an alumina tube connected with Pt electrodes and tested upon exposure to seven different gases of environmental and industrial concern (methanol, ethanol, isopropyl alcohol, formaldehyde, H2S, CO, and NO). Materials were tested toward different gases to indicate materials’ distinct selectivity and accurate responses to certain types of tested gases. Yet, sensing mechanisms were similar for tested VOCs and other three types of gases. Experimental results are presented for all investigations. The triple-composite sensing media γ-Fe2O3/SnO2/RGO was sensitive to all organic vapors at 100 °C for all of the tested organic vapors. Tests for the H2S gas confirmed that temperature had a great impact on the sensitivity of the materials, and, with an elevation in the testing temperature, significant declines in sensitivity were observed. However, though the sensitivity declined, the sensor response time was significantly faster at higher temperatures, especially for H2S at 200 °C where a remarkable Tres value of 6s was recorded.
Author Contributions
Conceptualization: D.O. and Q.Q.; methodology: Q.Q., D.O. and L.Y.; software, D.O. and L.Y.; validation: Q.Q.; formal analysis: D.O.; investigation: Q.Q., D.O. and L.Y.; resources: D.O. and L.Y.; data curation: Q.Q. and D.O.; writing—original draft preparation: D.O.; writing—review and editing: D.O.; visualization: D.O.; supervision: Q.Q.; project administration: Q.Q. All authors have read and agreed to the published version of the manuscript.
Funding
This work was supported by the Independent Innovation Application Research Project funded by the Basic Scientific Research Expenses of Zhongyuan University of Technology (No. K2020YY014), the Training Program for Young Backbone Teachers in Henan Colleges and Universities (No. 2021GGJS110), and the Natural Science Foundation of Zhongyuan University of Technology (No. K2022MS005).
Institutional Review Board Statement
Not applicable.
Informed Consent Statement
Not applicable.
Data Availability Statement
Not applicable.
Acknowledgments
Olimov Diyor conveys his gratitude to Zhongyuan University of Technology, Zhengzhou, Henan, China, for providing the equipped facilities and chemical reagents for carrying out the research work.
Conflicts of Interest
The authors declare no conflict of interest.
References
- Yadav, M.S.; Mandloi, R.K.; Singh, I. Environmental Impact Assessment of Human Error to Exhaust Toxic Gases and Oil Spilling for Prevention of Natural Disaster Through Fault Tree Analysis. IJERT 2020, 9, 82–91. [Google Scholar] [CrossRef]
- Dhall, S.; Mehta, B.R.; Tyagi, A.K.; Sood, K. A review on environmental gas sensors: Materials and technologies. Sens. Int. 2021, 2, 100116. [Google Scholar] [CrossRef]
- Winkless, L. Breathalyzer gets the nanotech treatment. Mater. Today 2015, 18, 421–422. [Google Scholar] [CrossRef]
- Javaid, M.; Haleem, A.; Rab, S.; Singh, R.P.; Suman, R. Sensors for daily life: A review. Sens. Int. 2021, 2, 100121. [Google Scholar] [CrossRef]
- Gerstner, E. Nobel Prize 2010: Andre Geim & Konstantin Novoselov. Nat. Phys. 2010, 6, 836. [Google Scholar] [CrossRef]
- Zhang, S.; Wang, H.; Liu, J.; Bao, C. Measuring the specific surface area of monolayer graphene oxide in water. Mater. Lett. 2020, 261, 127098. [Google Scholar] [CrossRef]
- Guinea, F.; Katsnelson, M.I.; Geim, A.K. Energy gaps and a zero-field quantum Hall effect in graphene by strain engineering. Nat. Phys. 2010, 6, 30–33. [Google Scholar] [CrossRef] [Green Version]
- Cooper, D.R.; D’Anjou, B.; Ghattamaneni, N.; Harack, B.; Hilke, M.; Horth, A.; Majlis, N.; Massicotte, M.; Vandsburger, L.; Whiteway, E.; et al. Experimental Review of Graphene. ISRN Condens. Matter Phys. 2012, 2012, 1–56. [Google Scholar] [CrossRef] [Green Version]
- Dey, A. Semiconductor metal oxide gas sensors: A review. Mater. Sci. Eng. B 2018, 229, 206–217. [Google Scholar] [CrossRef]
- Pal, P.; Yadav, A.; Chauhan, P.S.; Parida, P.K.; Gupta, A. Reduced graphene oxide based hybrid functionalized films for hydrogen detection: Theoretical and experimental studies. Sens. Int. 2021, 2, 100072. [Google Scholar] [CrossRef]
- Haridas, V.; Sukhananazerin, A.; Sneha, J.M.; Pullithadathil, B.; Narayanan, B. α-Fe2O3 loaded less-defective graphene sheets as chemiresistive gas sensor for selective sensing of NH3. Appl. Surf. Sci. 2020, 517, 146158. [Google Scholar] [CrossRef]
- Bai, S.; Chen, C.; Luo, R.; Chen, A.; Li, D. Synthesis of MoO3/reduced graphene oxide hybrids and mechanism of enhancing H2S sensing performances. Sens. Actuators B Chem. 2015, 216, 113–120. [Google Scholar] [CrossRef]
- Yang, M.; Zhang, X.; Cheng, X.; Xu, Y.; Gao, S.; Zhao, H.; Huo, L. Hierarchical NiO Cube/Nitrogen-Doped Reduced Graphene Oxide Composite with Enhanced H2S Sensing Properties at Low Temperature. ACS Appl. Mater. Interfaces 2017, 9, 26293–26303. [Google Scholar] [CrossRef]
- MalekAlaie, M.; Jahangiri, M.; Rashidi, A.M.; HaghighiAsl, A.; Izadi, N. Selective hydrogen sulfide (H2S) sensors based on molybdenum trioxide (MoO3) nanoparticle decorated reduced graphene oxide. Mater. Sci. Semicond. Processing 2015, 38, 93–100. [Google Scholar] [CrossRef]
- Yin, L.; Wang, H.; Li, L.; Li, H.; Chen, D.; Zhang, R. Microwave-assisted preparation of hierarchical CuO@rGO nanostructures and their enhanced low-temperature H2S-sensing performance. Appl. Surf. Sci. 2019, 476, 107–114. [Google Scholar] [CrossRef]
- Shewale, P.S.; Yun, K.-S. Synthesis and characterization of Cu-doped ZnO/RGO nanocomposites for room-temperature H2S gas sensor. J. Alloys Compd. 2020, 837, 155527. [Google Scholar] [CrossRef]
- Patekari, M.D.; Pawar, K.K.; Salunkhe, G.B.; Kodam, P.M.; Padvi, M.N.; Waifalkar, P.P.; Sharma, K.K.; Patil, P.S. Synthesis of Maghemite nanoparticles for highly sensitive and selective NO2 sensing. Mater. Sci. Eng. B 2021, 272, 115339. [Google Scholar] [CrossRef]
- Radhakrishnan, J.K.; Kumara, M. Effect of temperature modulation, on the gas sensing characteristics of ZnO nanostructures, for gases O2, CO and CO2. Sens. Int. 2021, 2, 100059. [Google Scholar] [CrossRef]
- Aishwarya, K.; Nirmala, R.; Navamathavan, R. Recent advancements in liquefied petroleum gas sensors: A topical review. Sens. Int. 2021, 2, 100091. [Google Scholar] [CrossRef]
- Sharafeldin, I.; Garcia-Rios, S.; Ahmed, N.; Alvarado, M.; Vilanova, X.; Allam, N.K. Metal-decorated carbon nanotubes-based sensor array for simultaneous detection of toxic gases. J. Environ. Chem. Eng. 2021, 9, 104534. [Google Scholar] [CrossRef]
- Javaid, M.; Haleem, A.; Singh, R.P.; Rab, S.; Suman, R. Exploring the potential of nanosensors: A brief overview. Sens. Int. 2021, 2, 100130. [Google Scholar] [CrossRef]
- Priyadarshi, H.; Singh, K.; Shrivastava, A. Experimental study of maghemite nanomaterials towards sustainable energy storage device application. Mater. Sci. Semicond. Processing 2022, 147, 106698. [Google Scholar] [CrossRef]
- Shokrollahi, H. A review of the magnetic properties, synthesis methods and applications of maghemite. J. Magn. Magn. Mater. 2017, 426, 74–81. [Google Scholar] [CrossRef]
- Trushkina, Y.; Tai, C.-W.; Salazar-Alvarez, G. Fabrication of Maghemite Nanoparticles with High Surface Area. Nanomaterials 2019, 9, 1004. [Google Scholar] [CrossRef] [Green Version]
- Wu, H.; Wu, G.; Wang, L. Peculiar porous α-Fe2O3, γ-Fe2O3 and Fe3O4 nanospheres: Facile synthesis and electromagnetic properties. Powder Technol. 2015, 269, 443–451. [Google Scholar] [CrossRef]
- Kim, W.; Lee, J.S.; Jang, J. Facile synthesis of size-controlled Fe2O3 nanoparticle-decorated carbon nanotubes for highly sensitive H2S detection. RSC Adv. 2018, 8, 31874–31880. [Google Scholar] [CrossRef] [Green Version]
- Zhang, C.; Zhang, S.; Yang, Y.; Yu, H.; Dong, X. Highly sensitive H2S sensors based on metal-organic framework driven γ-Fe2O3 on reduced graphene oxide composites at room temperature. Sens. Actuators B Chem. 2020, 325, 128804. [Google Scholar] [CrossRef]
- Batzill, M.; Diebold, U. The surface and materials science of tin oxide. Prog. Surf. Sci. 2005, 79, 47–154. [Google Scholar] [CrossRef]
- Zhao, Y.; Zhang, J.; Wang, Y.; Chen, Z. A Highly Sensitive and Room Temperature CNTs/SnO2/CuO Sensor for H2S Gas Sensing Applications. Nanoscale Res. Lett. 2020, 15, 40. [Google Scholar] [CrossRef] [PubMed]
- Yang, J.; Wang, S.; Dong, R.; Zhang, L.; Zhu, Z.; Gao, X. One-pot synthesis of SnO2 hollow microspheres and their formaldehyde sensor application. Mater. Lett. 2016, 184, 9–12. [Google Scholar] [CrossRef]
- Wang, T.T.; Ma, S.Y.; Cheng, L.; Jiang, X.H.; Zhang, M.; Li, W.Q.; Jin, W.X. Facile fabrication of multishelled SnO2 hollow microspheres for gas sensing application. Mater. Lett. 2016, 164, 56–59. [Google Scholar] [CrossRef]
- Vaishanv, V.S.; Patel, P.D.; Patel, N.G. Indium Tin Oxide Thin-Film Sensor for Detection of Volatile Organic Compounds (VOCs). Mater. Manuf. Processes 2006, 21, 257–261. [Google Scholar] [CrossRef]
- Zhang, D.; Wu, Z.; Zong, X. Flexible and highly sensitive H2S gas sensor based on in-situ polymerized SnO2/rGO/PANI ternary nanocomposite with application in halitosis diagnosis. Sens. Actuators B Chem. 2019, 289, 32–41. [Google Scholar] [CrossRef]
- Song, Z.; Wei, Z.; Wang, B.; Luo, Z.; Xu, S.; Zhang, W.; Yu, H.; Li, M.; Huang, Z.; Zang, J.; et al. Sensitive Room-Temperature H2S Gas Sensors Employing SnO2 Quantum Wire/Reduced Graphene Oxide Nanocomposites. Chem. Mater. 2016, 28, 1205–1212. [Google Scholar] [CrossRef]
- He, H. Metal oxide semiconductors and conductors. In Solution Processed Metal Oxide Thin Films for Electronic Applications; Elsevier: Amsterdam, The Netherlands, 2020; pp. 7–30. [Google Scholar] [CrossRef]
- Firtat, B.; Moldovan, C.; Brasoveanu, C.; Muscalu, G.; Gartner, M.; Zaharescu, M.; Chesler, P.; Hornoiu, C.; Mihaiu, S.; Vladut, C.; et al. Miniaturised MOX based sensors for pollutant and explosive gases detection. Sens. Actuators B Chem. 2017, 249, 647–655. [Google Scholar] [CrossRef]
- Song, Z.; Liu, J.; Liu, Q.; Yu, H.; Zhang, W.; Wang, Y.; Huang, Z.; Zang, J.; Liu, H. Enhanced H2S gas sensing properties based on SnO2 quantum wire/reduced graphene oxide nanocomposites: Equilibrium and kinetics modeling. Sens. Actuators B Chem. 2017, 249, 632–638. [Google Scholar] [CrossRef]
- Rashad, M.M.; Ibrahim, I.A.; Osama, I.; Shalan, A.E. Distinction between SnO2 nanoparticles synthesized using co-precipitation and solvothermal methods for the photovoltaic efficiency of dye-sensitized solar cells. Bull. Mater. Sci. 2014, 37, 903–909. [Google Scholar] [CrossRef]
- Wang, W.W.; Yao, J.L. Hydrothermal Synthesis of SnO2/Fe3O4 Nanocomposites and Their Magnetic Property. J. Phys. Chem. C 2009, 113, 3070–3075. [Google Scholar] [CrossRef]
- Zou, C.; Hu, J.; Su, Y.; Zhou, Z.; Cai, B.; Tao, Z.; Huo, T.; Hu, N.; Zhang, Y. Highly repeatable and sensitive three-dimensional γ-Fe2O3@reduced graphene oxide gas sensors by magnetic-field assisted assembly process. Sens. Actuators B Chem. 2020, 306, 127546. [Google Scholar] [CrossRef]
- Nikolic, M.V.; Milovanovic, V.; Vasiljevic, Z.Z.; Stamenkovic, Z. Semiconductor Gas Sensors: Materials, Technology, Design, and Application. Sensors 2020, 20, 6694. [Google Scholar] [CrossRef]
- Chen, D.; Yin, L.; Ge, L.; Fan, B.; Zhang, R.; Sun, J.; Shao, G. Low-temperature and highly selective NO-sensing performance of WO3 nanoplates decorated with silver nanoparticles. Sens. Actuators B Chem. 2013, 185, 445–455. [Google Scholar] [CrossRef]
- Wang, C.; Yin, L.; Zhang, L.; Xiang, D.; Gao, R. Metal Oxide Gas Sensors: Sensitivity and Influencing Factors. Sensors 2010, 10, 2088–2106. [Google Scholar] [CrossRef] [Green Version]
- Yamazoe, N.; Shimanoe, K. Fundamentals of semiconductor gas sensors. In Semiconductor Gas Sensors; Elsevier: Amsterdam, The Netherlands, 2013; pp. 3–34. [Google Scholar] [CrossRef]
- Hunter, G.W.; Akbar, S.; Bhansali, S.; Daniele, M.; Erb, P.D.; Johnson, K.; Liu, C.C.; Miller, D.; Oralkan, O.; Hesketh, P.J.; et al. Editors’ Choice—Critical Review—A Critical Review of Solid State Gas Sensors. J. Electrochem. Soc. 2020, 167, 037570. [Google Scholar] [CrossRef]
- Madrid, S.I.U.; Pal, U.; Sanchez-De Jesus, F. Controlling size and magnetic properties of Fe3O4 clusters in solvothermal process. Adv. Nano Res. 2014, 2, 187–198. [Google Scholar] [CrossRef] [Green Version]
- De Villiers, J.P.; Lu, L. Quantitative XRD analysis and evaluation of iron ore, sinter, and pellets. In Iron Ore; Elsevier: Amsterdam, The Netherlands, 2022; pp. 109–126. [Google Scholar] [CrossRef]
- Schroder, D.K. Semiconductor Material and Device Characterization, 3rd ed.; IEEE Press: Hoboken, NJ, USA; Wiley: Piscataway, NJ, USA, 2006. [Google Scholar]
- Zuo, J.; Tavakoli, S.; Mathavakrishnan, D.; Ma, T.; Lim, M.; Rotondo, B.; Pauzauskie, P.; Pavinatto, F.; MacKenzie, D. Additive Manufacturing of a Flexible Carbon Monoxide Sensor Based on a SnO2-Graphene Nanoink. Chemosensors 2020, 8, 36. [Google Scholar] [CrossRef]
- Choi, K.S.; Park, S.; Chang, S.-P. Enhanced ethanol sensing properties based on SnO2 nanowires coated with Fe2O3 nanoparticles. Sens. Actuators B Chem. 2017, 238, 871–879. [Google Scholar] [CrossRef]
- Ye, Z.; Yang, W.; Yuan, Z.; Zhang, K.; Tai, H. Facile depositing strategy to fabricate a hetero-affinity hybrid film for improving gas-sensing performance. Nanotechnology 2021, 32, 205502. [Google Scholar] [CrossRef] [PubMed]
- Balasubramani, V.; Sureshkumar, S.; Rao, T.S.; Sridhar, T.M. Impedance Spectroscopy-Based Reduced Graphene Oxide-Incorporated ZnO Composite Sensor for H2S Investigations. ACS Omega 2019, 4, 9976–9982. [Google Scholar] [CrossRef] [Green Version]
- Wei, Q.; Song, P.; Yang, Z.; Wang, Q. Hierarchical assembly of Fe2O3 nanorods on SnO2 nanospheres with enhanced ethanol sensing properties. Phys. E Low-Dimens. Syst. Nanostructures 2018, 103, 156–163. [Google Scholar] [CrossRef]
- Sowmya, B.; John, A.; Panda, P.K. A review on metal-oxide based p-n and n-n heterostructured nano-materials for gas sensing applications. Sens. Int. 2021, 2, 100085. [Google Scholar] [CrossRef]
- Bo, Z.; Wei, X.; Guo, X.; Yang, H.; Mao, S.; Yan, J.; Cen, K. SnO2 nanoparticles incorporated CuO nanopetals on graphene for high-performance room-temperature NO2 sensor. Chem. Phys. Lett. 2020, 750, 137485. [Google Scholar] [CrossRef]
Figure 1.
(a) Alumina tube with 4 Pt electrodes, (b) Ni-Cr heating coil, (c) an empty pedestal, (d) a microtube-installed pedestal, (e) a schematic diagram of alumina tube coated with the sensing materials, (f) an equivalent circuit of the gas-sensing testing system used.
Figure 1.
(a) Alumina tube with 4 Pt electrodes, (b) Ni-Cr heating coil, (c) an empty pedestal, (d) a microtube-installed pedestal, (e) a schematic diagram of alumina tube coated with the sensing materials, (f) an equivalent circuit of the gas-sensing testing system used.
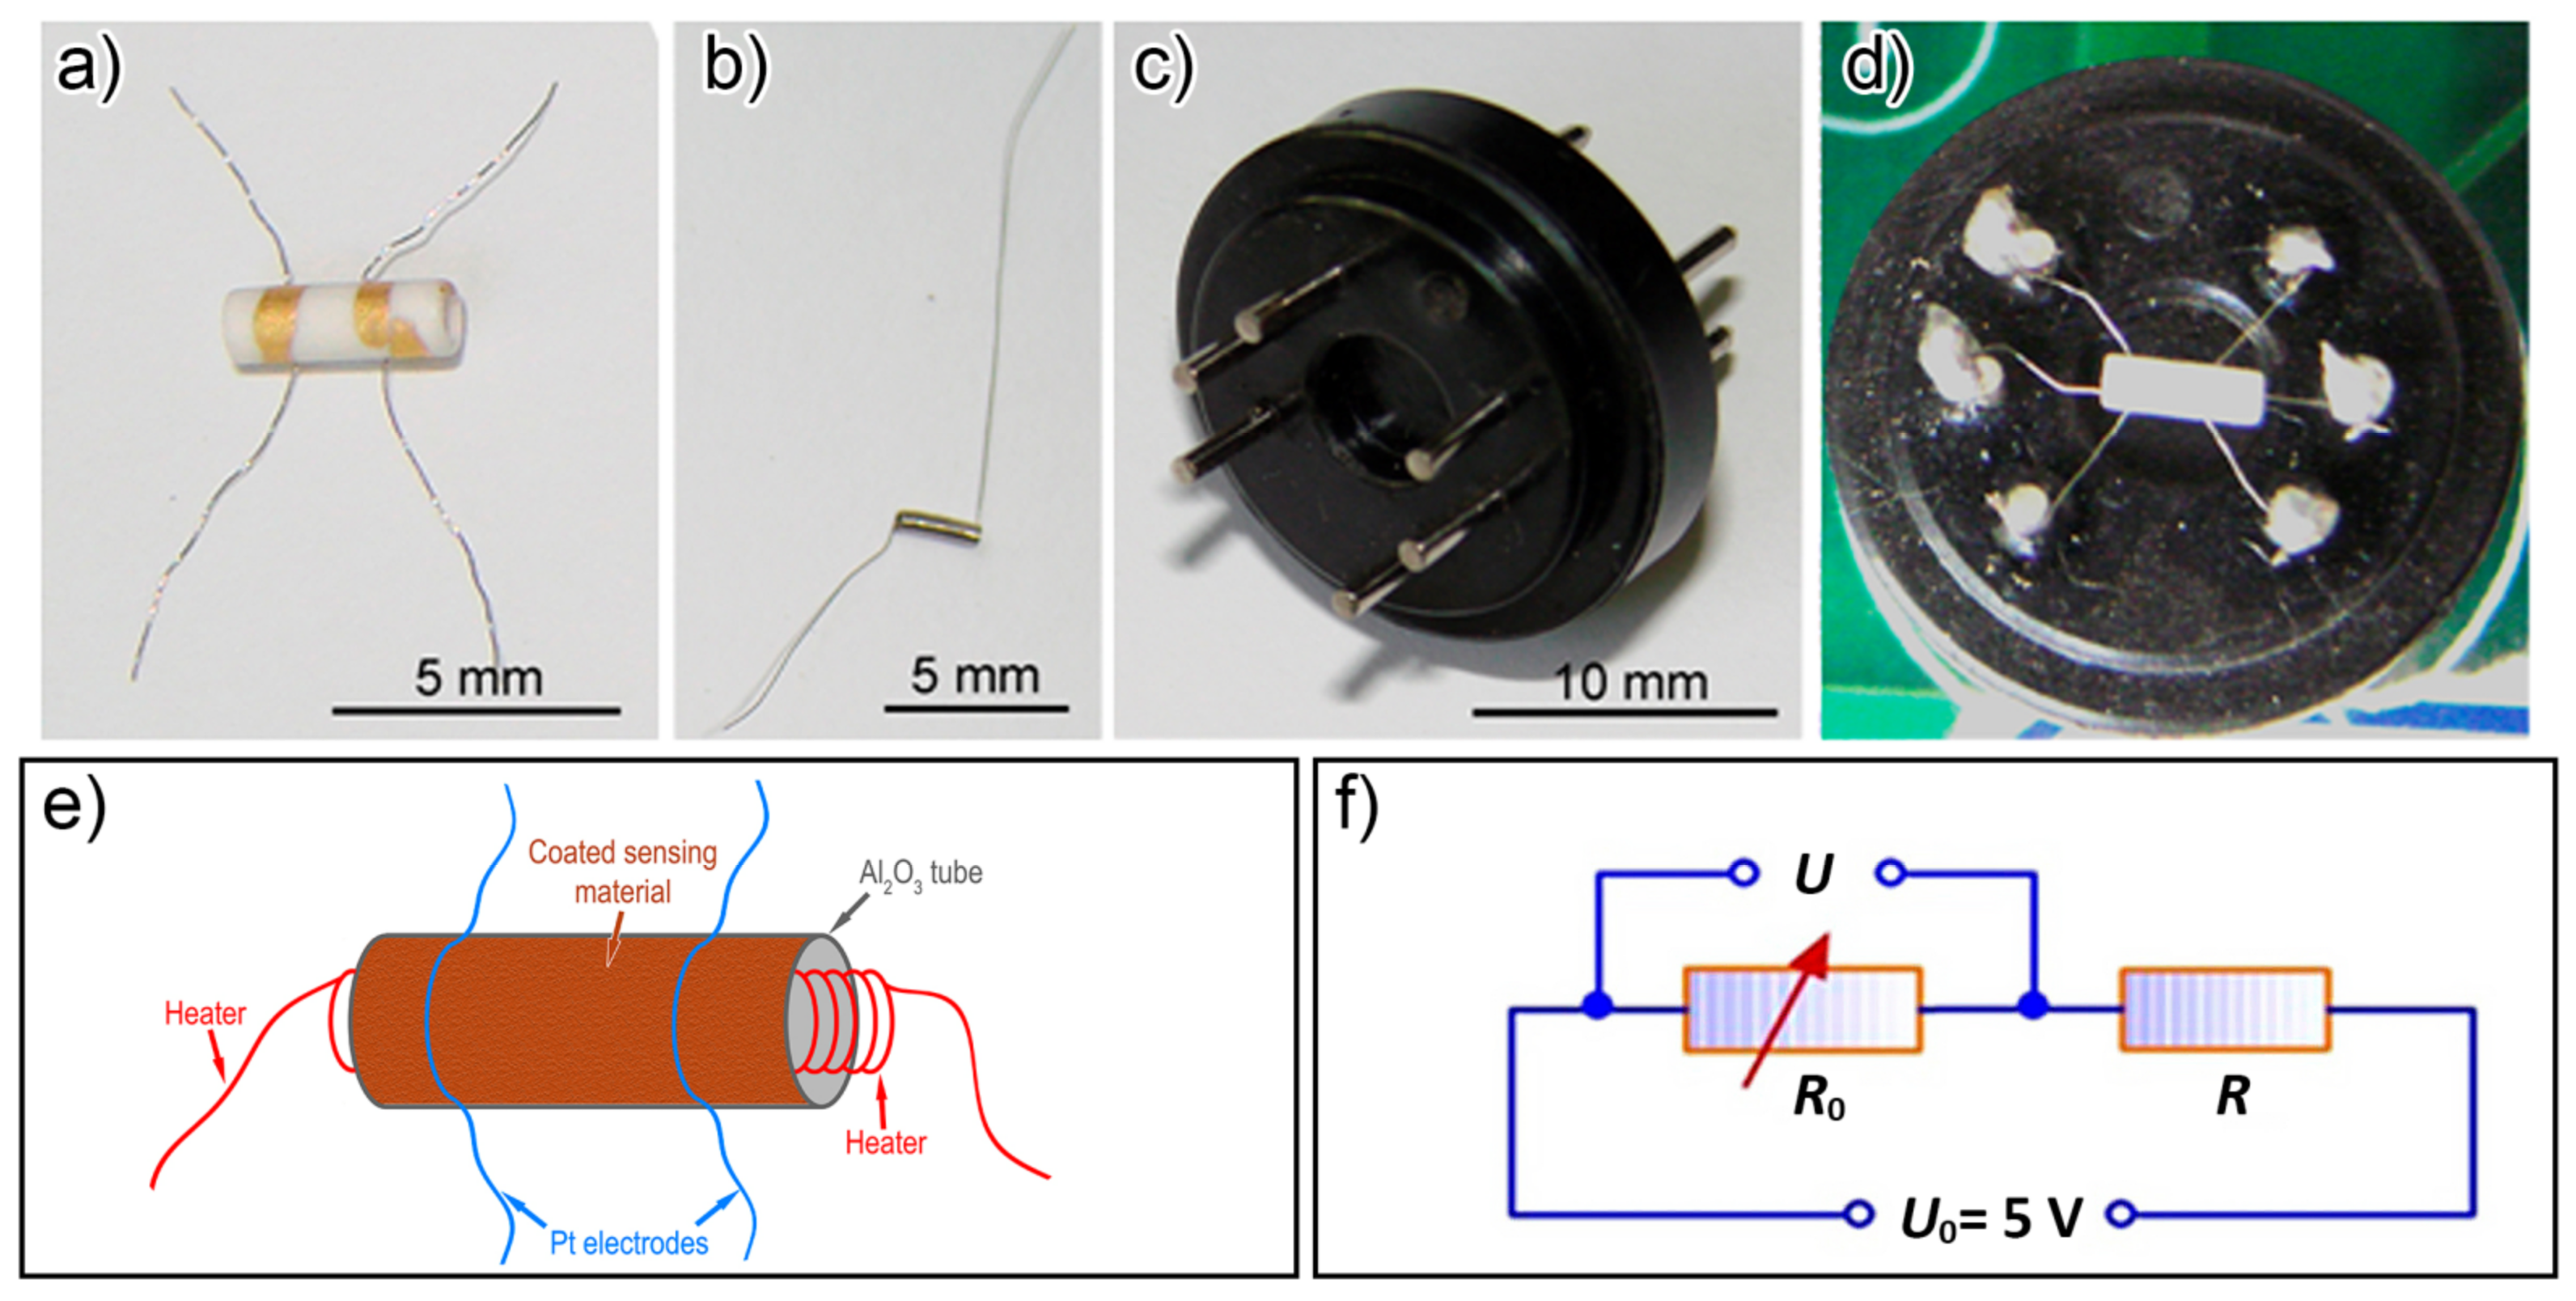
Figure 2.
XRD pattern of (a) #82-1533 standard PDF card of Fe3O4 phase, (b) synthesized Fe3O4 nanoparticles, (c) #39-1346 standard PDF card of γ-Fe2O3 phase, (d) synthesized γ-Fe2O3 nanospheres, (e) #29-1484 and #33-1374 standard PDF cards of SnO2, (f) synthesized γ-Fe2O3/SnO2 nanoparticles, (g) #75-1621 standard PDF card of graphite, (h) synthesized γ-Fe2O3/SnO2/RGO hybrid nanoparticles.
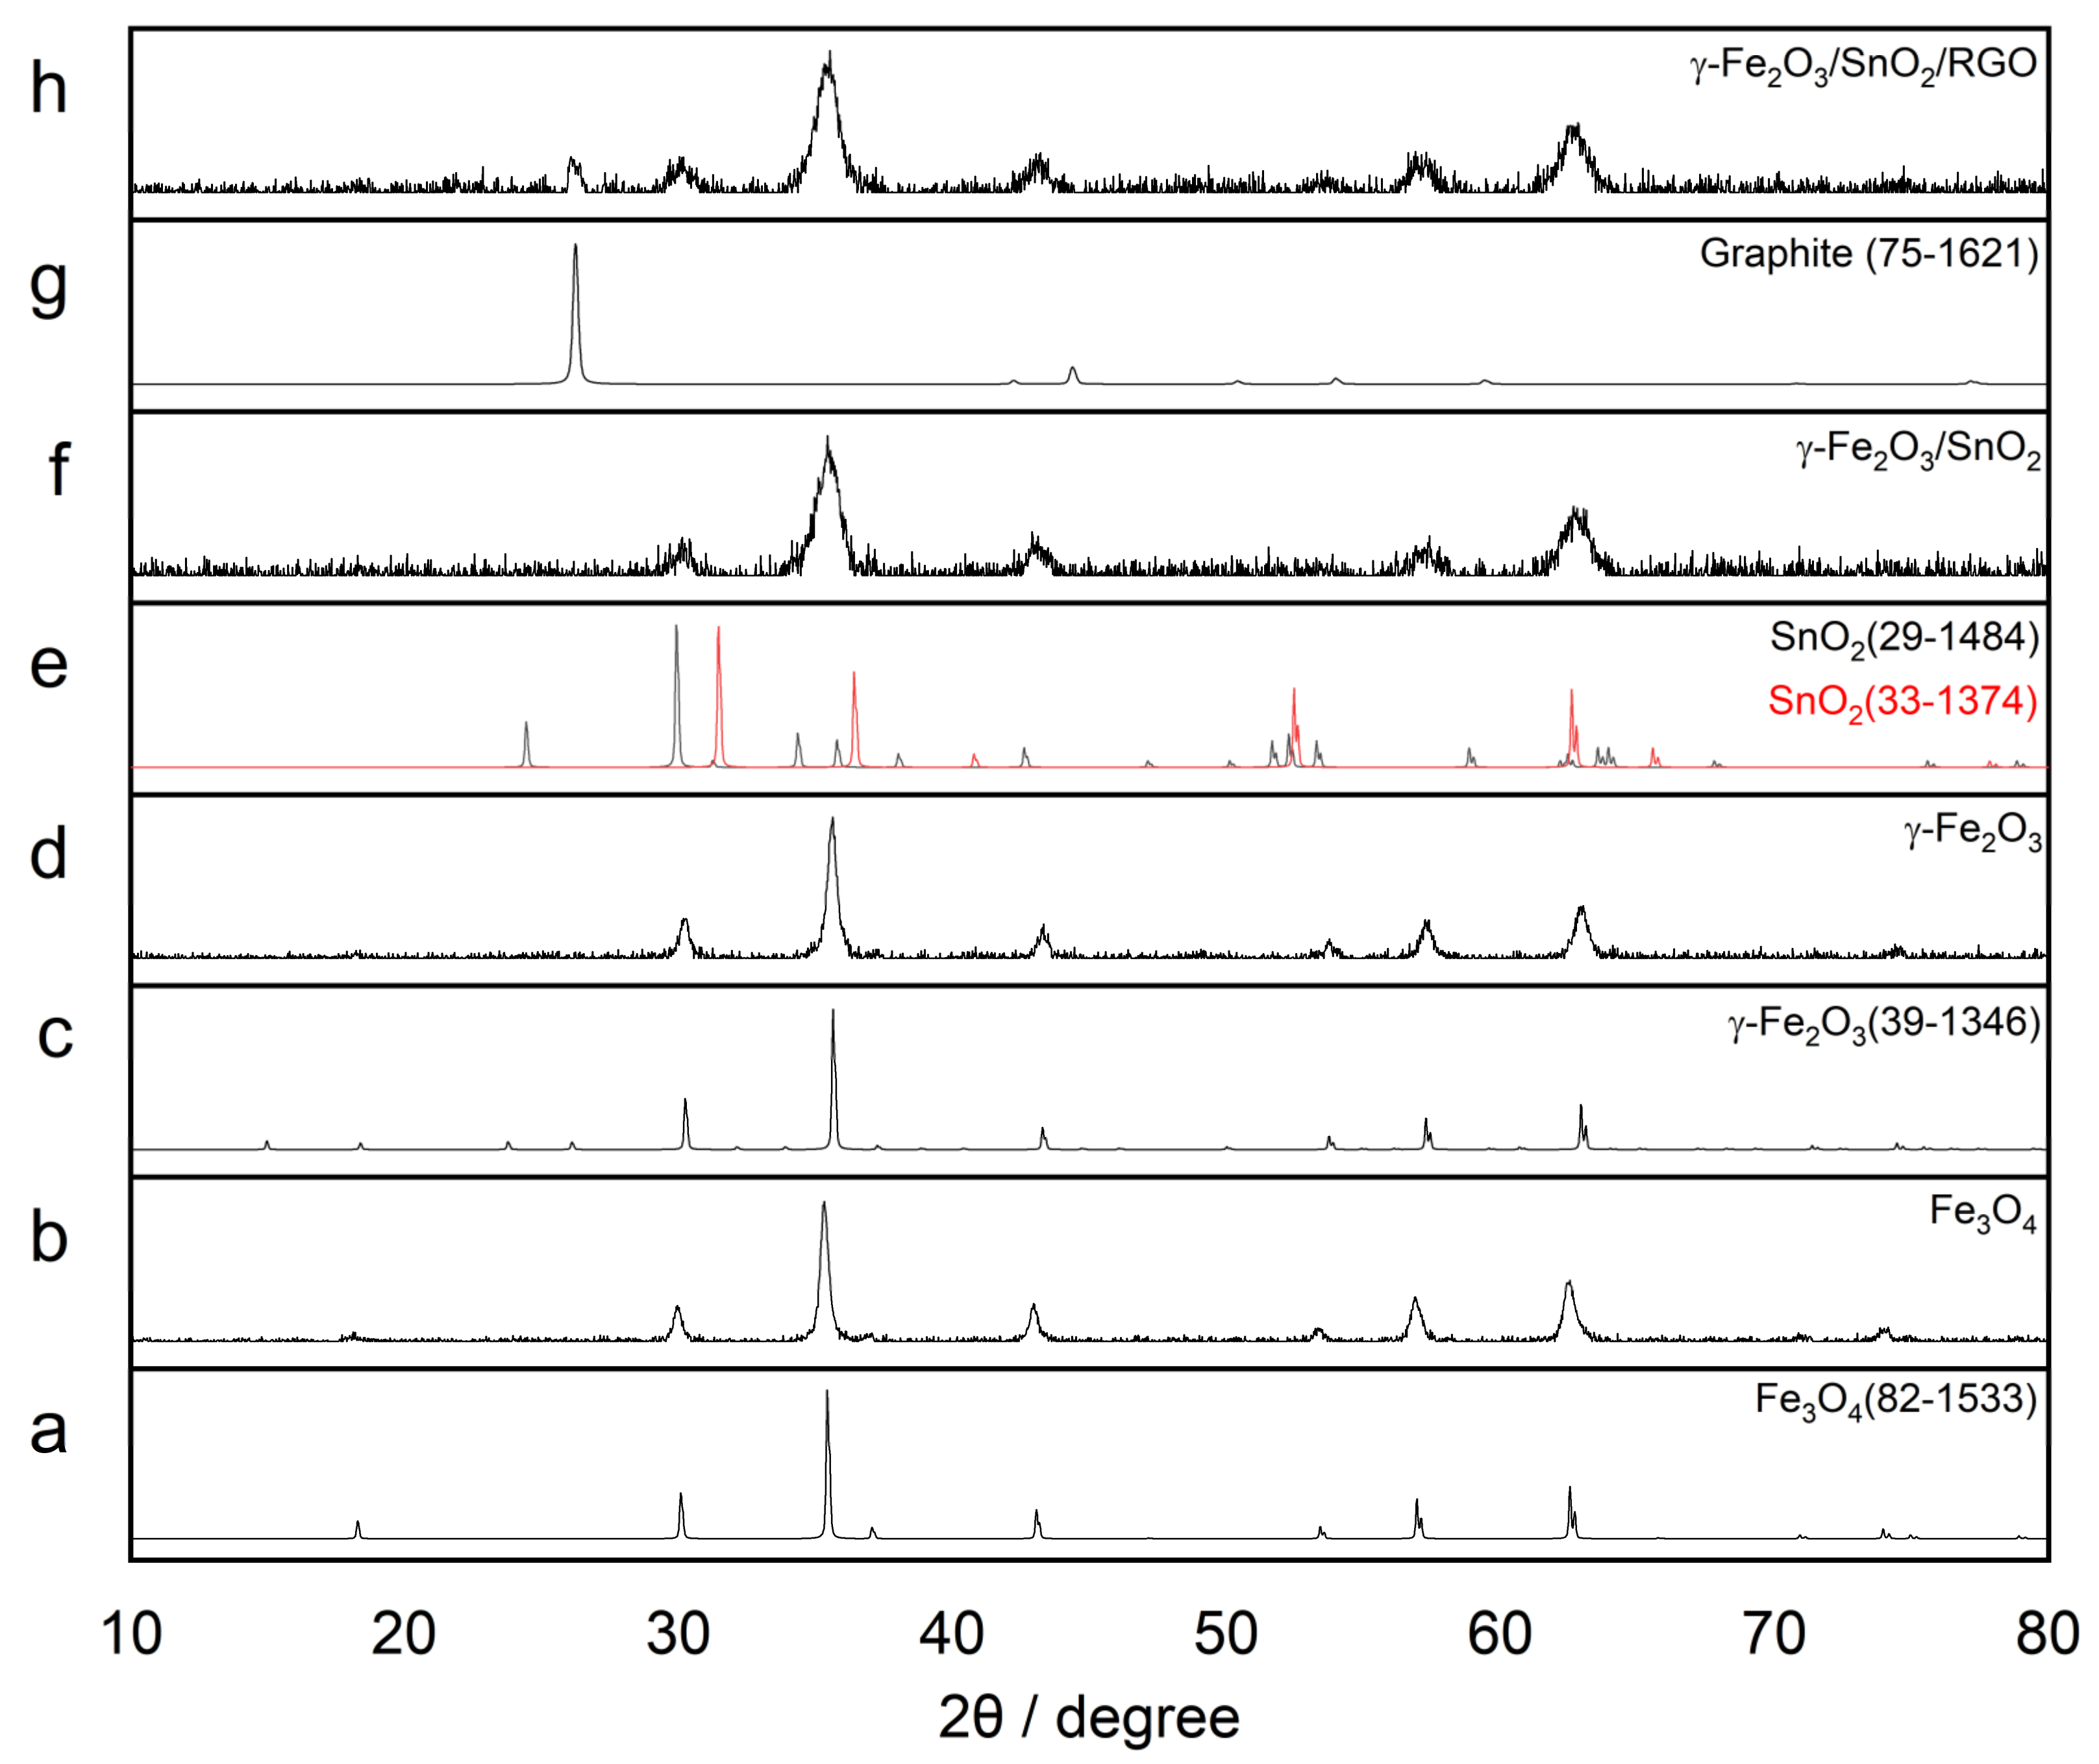
Figure 3.
SEM image of γ-Fe2O3 nanospheres (at 5.0 kV).
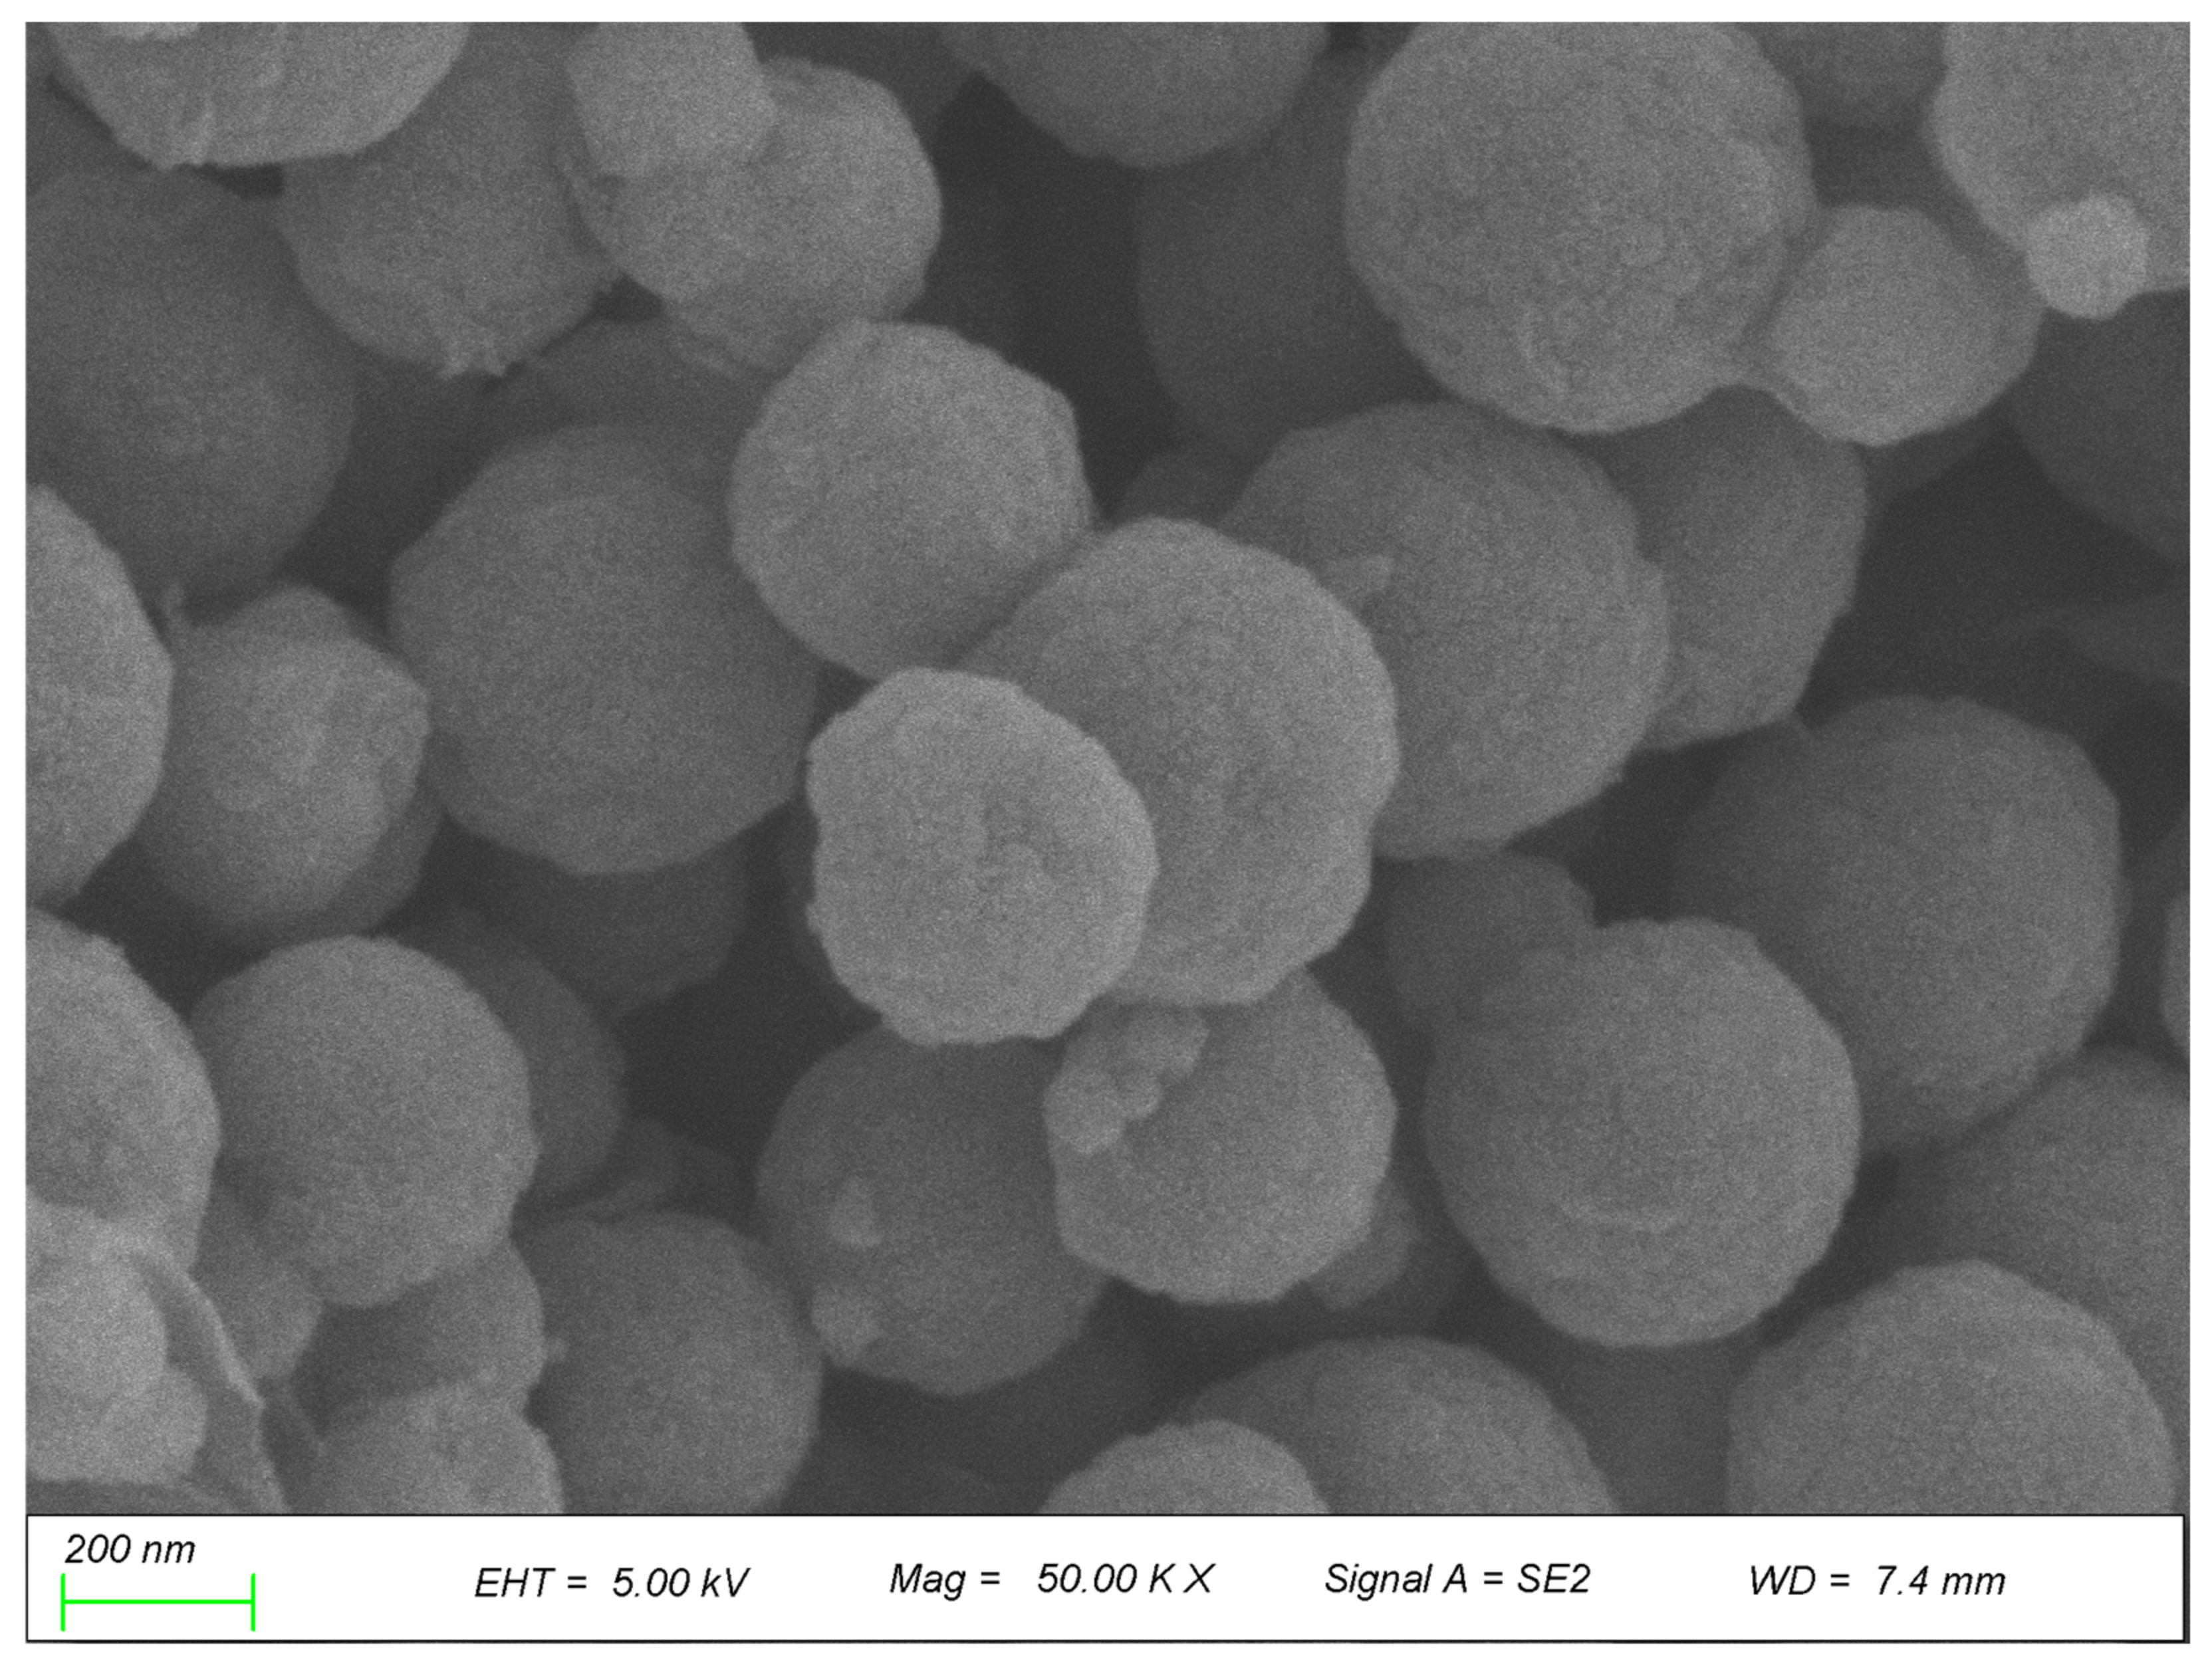
Figure 4.
(a) SEM image (at 3.0 kV), (b) EDS spectrum and elemental mass and atomic content of γ-Fe2O3/SnO2 nanoparticles.
Figure 4.
(a) SEM image (at 3.0 kV), (b) EDS spectrum and elemental mass and atomic content of γ-Fe2O3/SnO2 nanoparticles.
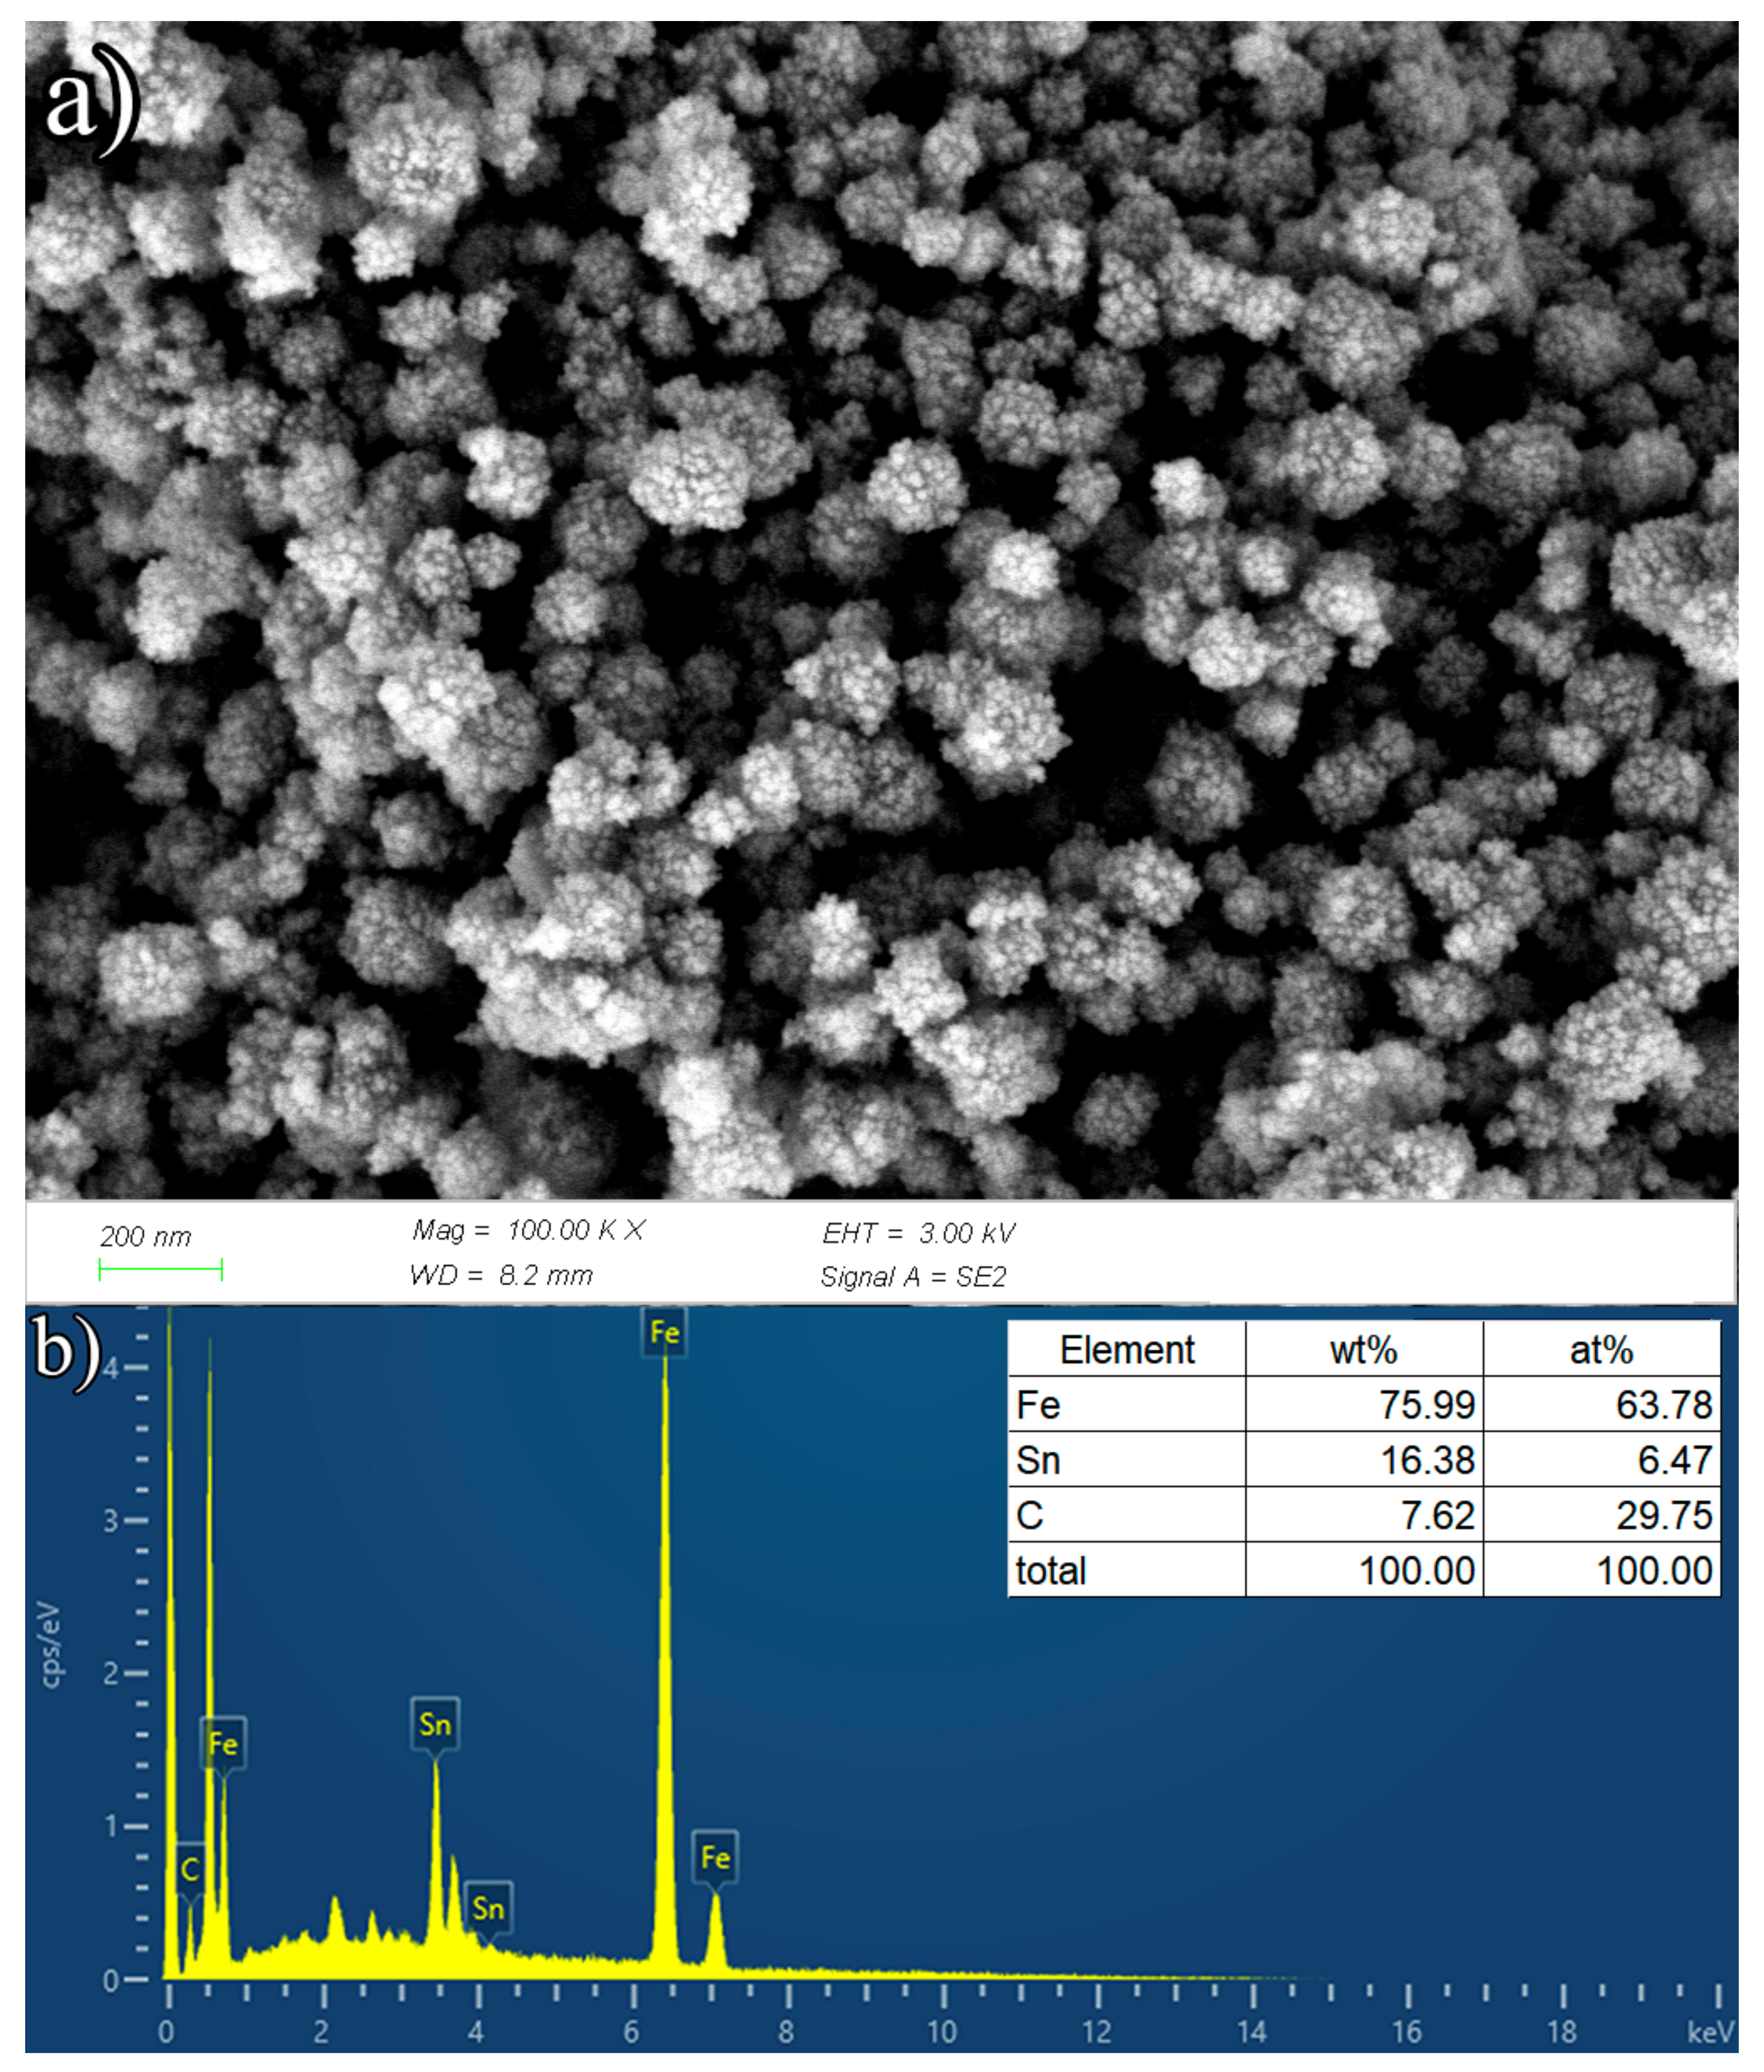
Figure 5.
SEM image of γ-Fe2O3/SnO2/RGO hybrid nanoparticles at (a) 200 nm and (b) 500 nm magnification range (at 3.0 kV).
Figure 5.
SEM image of γ-Fe2O3/SnO2/RGO hybrid nanoparticles at (a) 200 nm and (b) 500 nm magnification range (at 3.0 kV).
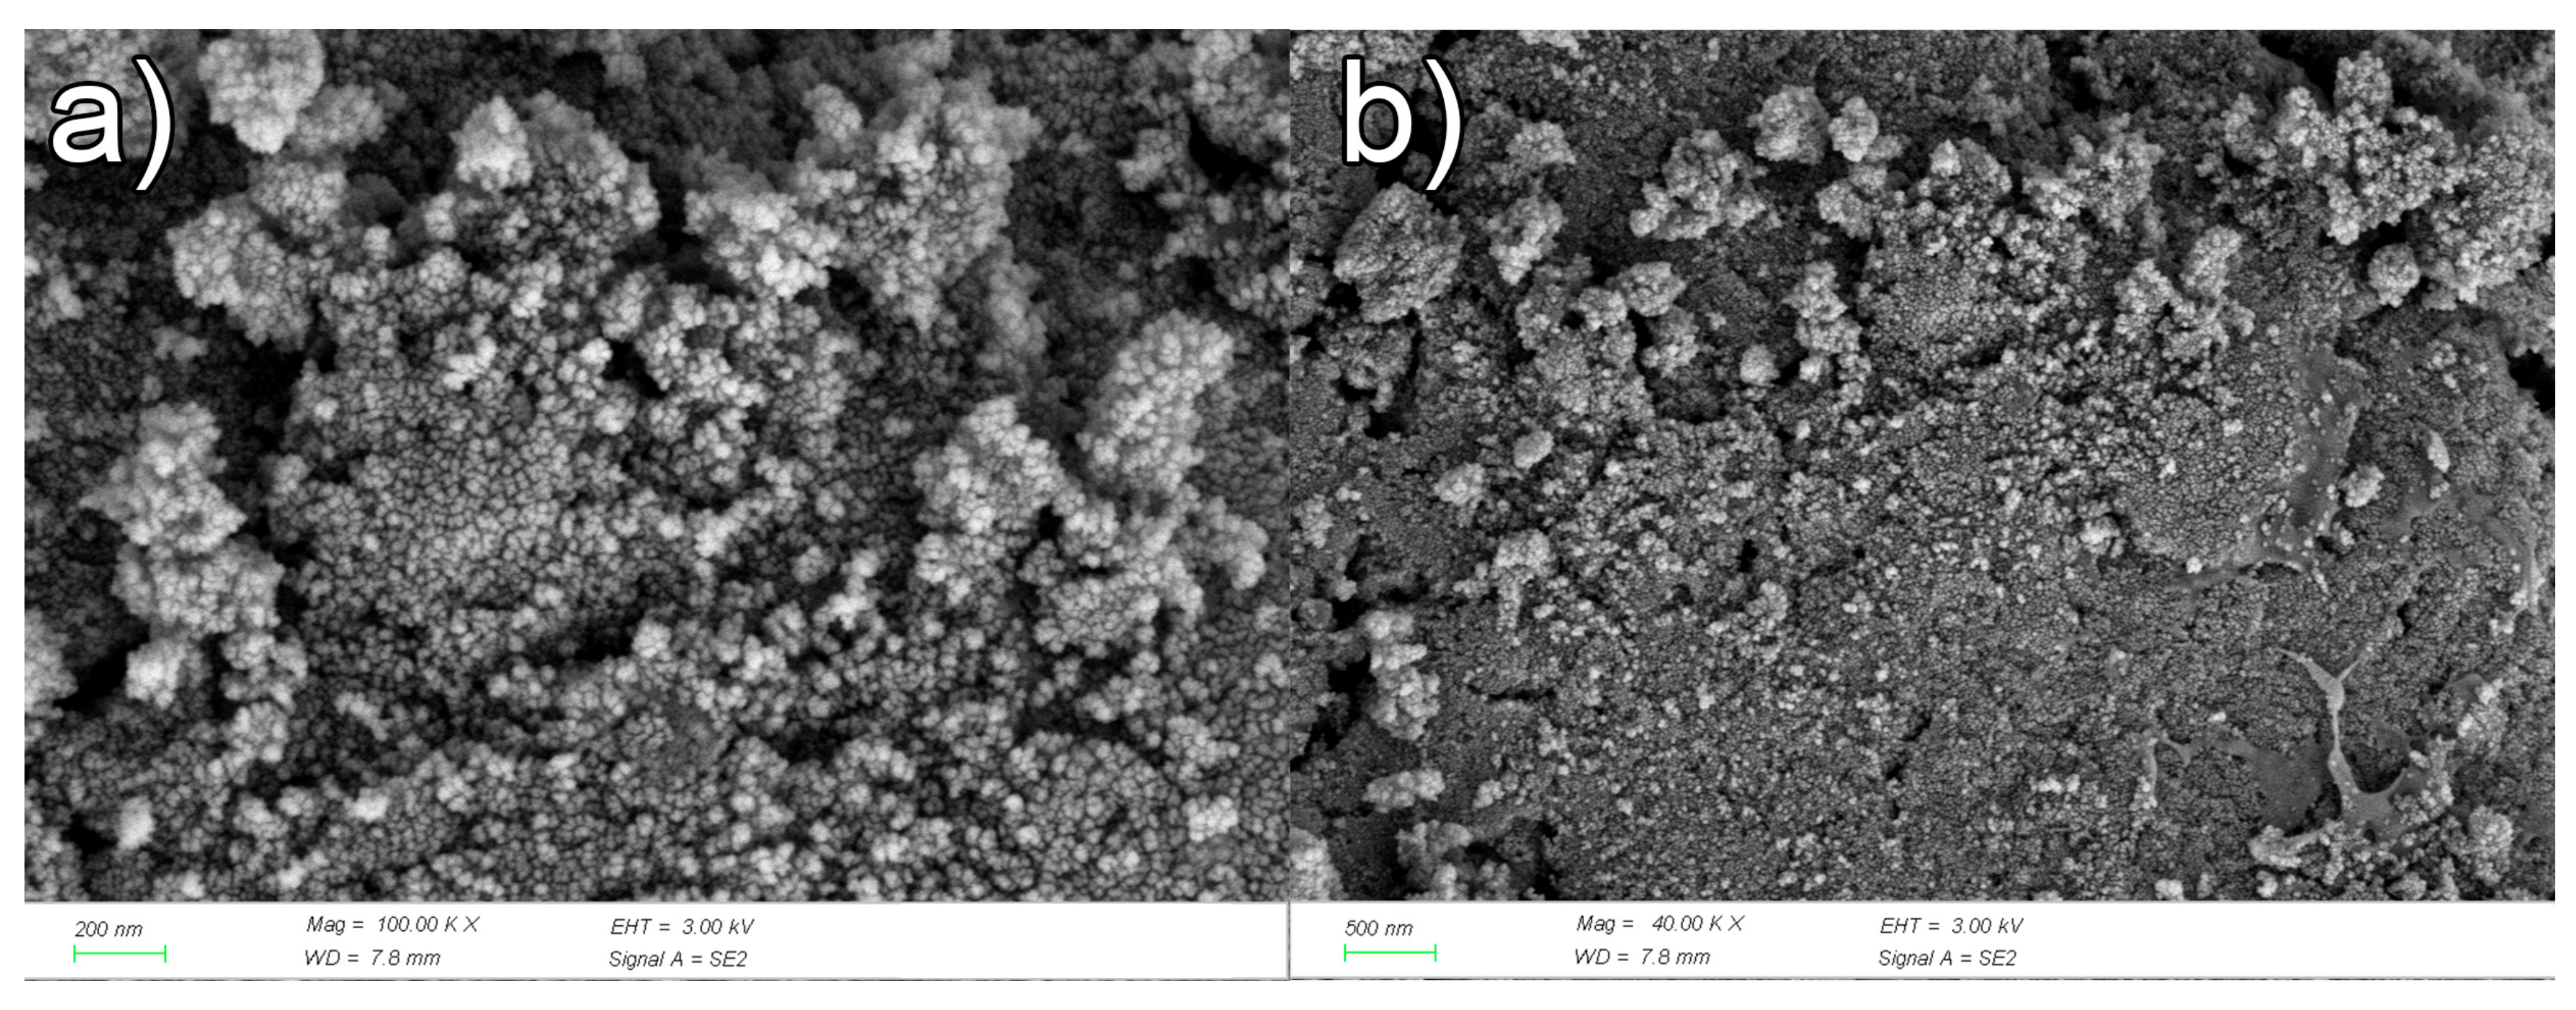
Figure 6.
EDS spectrum and elemental mass and atomic content of γ-Fe2O3/SnO2/RGO hybrid nanoparticles.
Figure 6.
EDS spectrum and elemental mass and atomic content of γ-Fe2O3/SnO2/RGO hybrid nanoparticles.
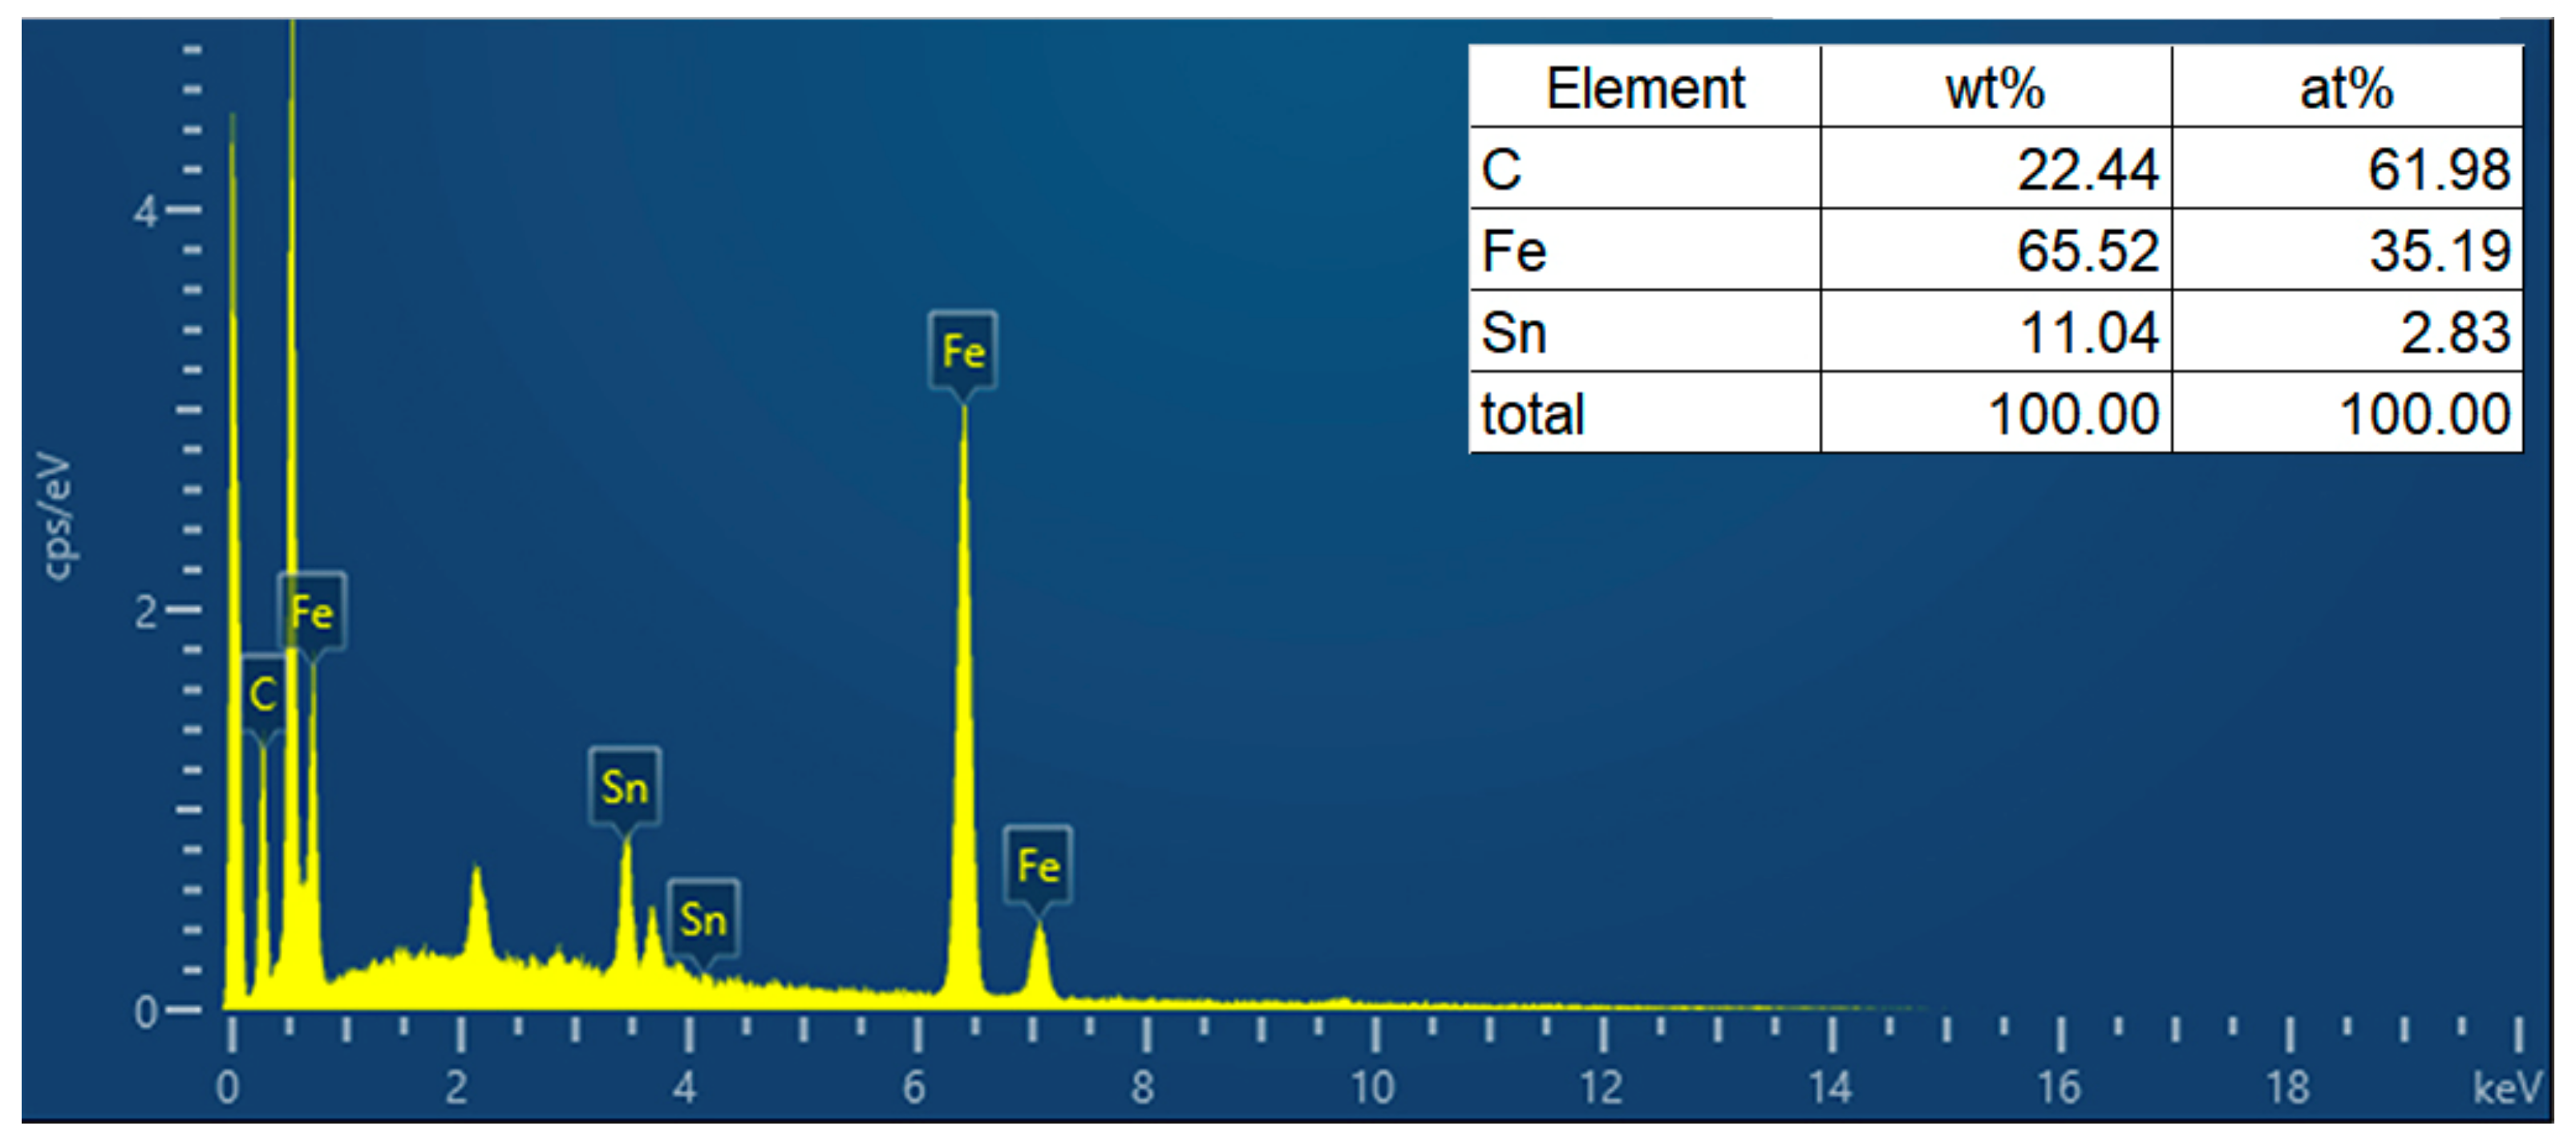
Figure 7.
EDS elemental mapping of (a) γ-Fe2O3/SnO2/RGO hybrid nanoparticles for iron, tin, and carbon atoms, (b) distribution of iron atoms, (c) distribution of tin atoms, (d) distribution of carbon atoms.
Figure 7.
EDS elemental mapping of (a) γ-Fe2O3/SnO2/RGO hybrid nanoparticles for iron, tin, and carbon atoms, (b) distribution of iron atoms, (c) distribution of tin atoms, (d) distribution of carbon atoms.
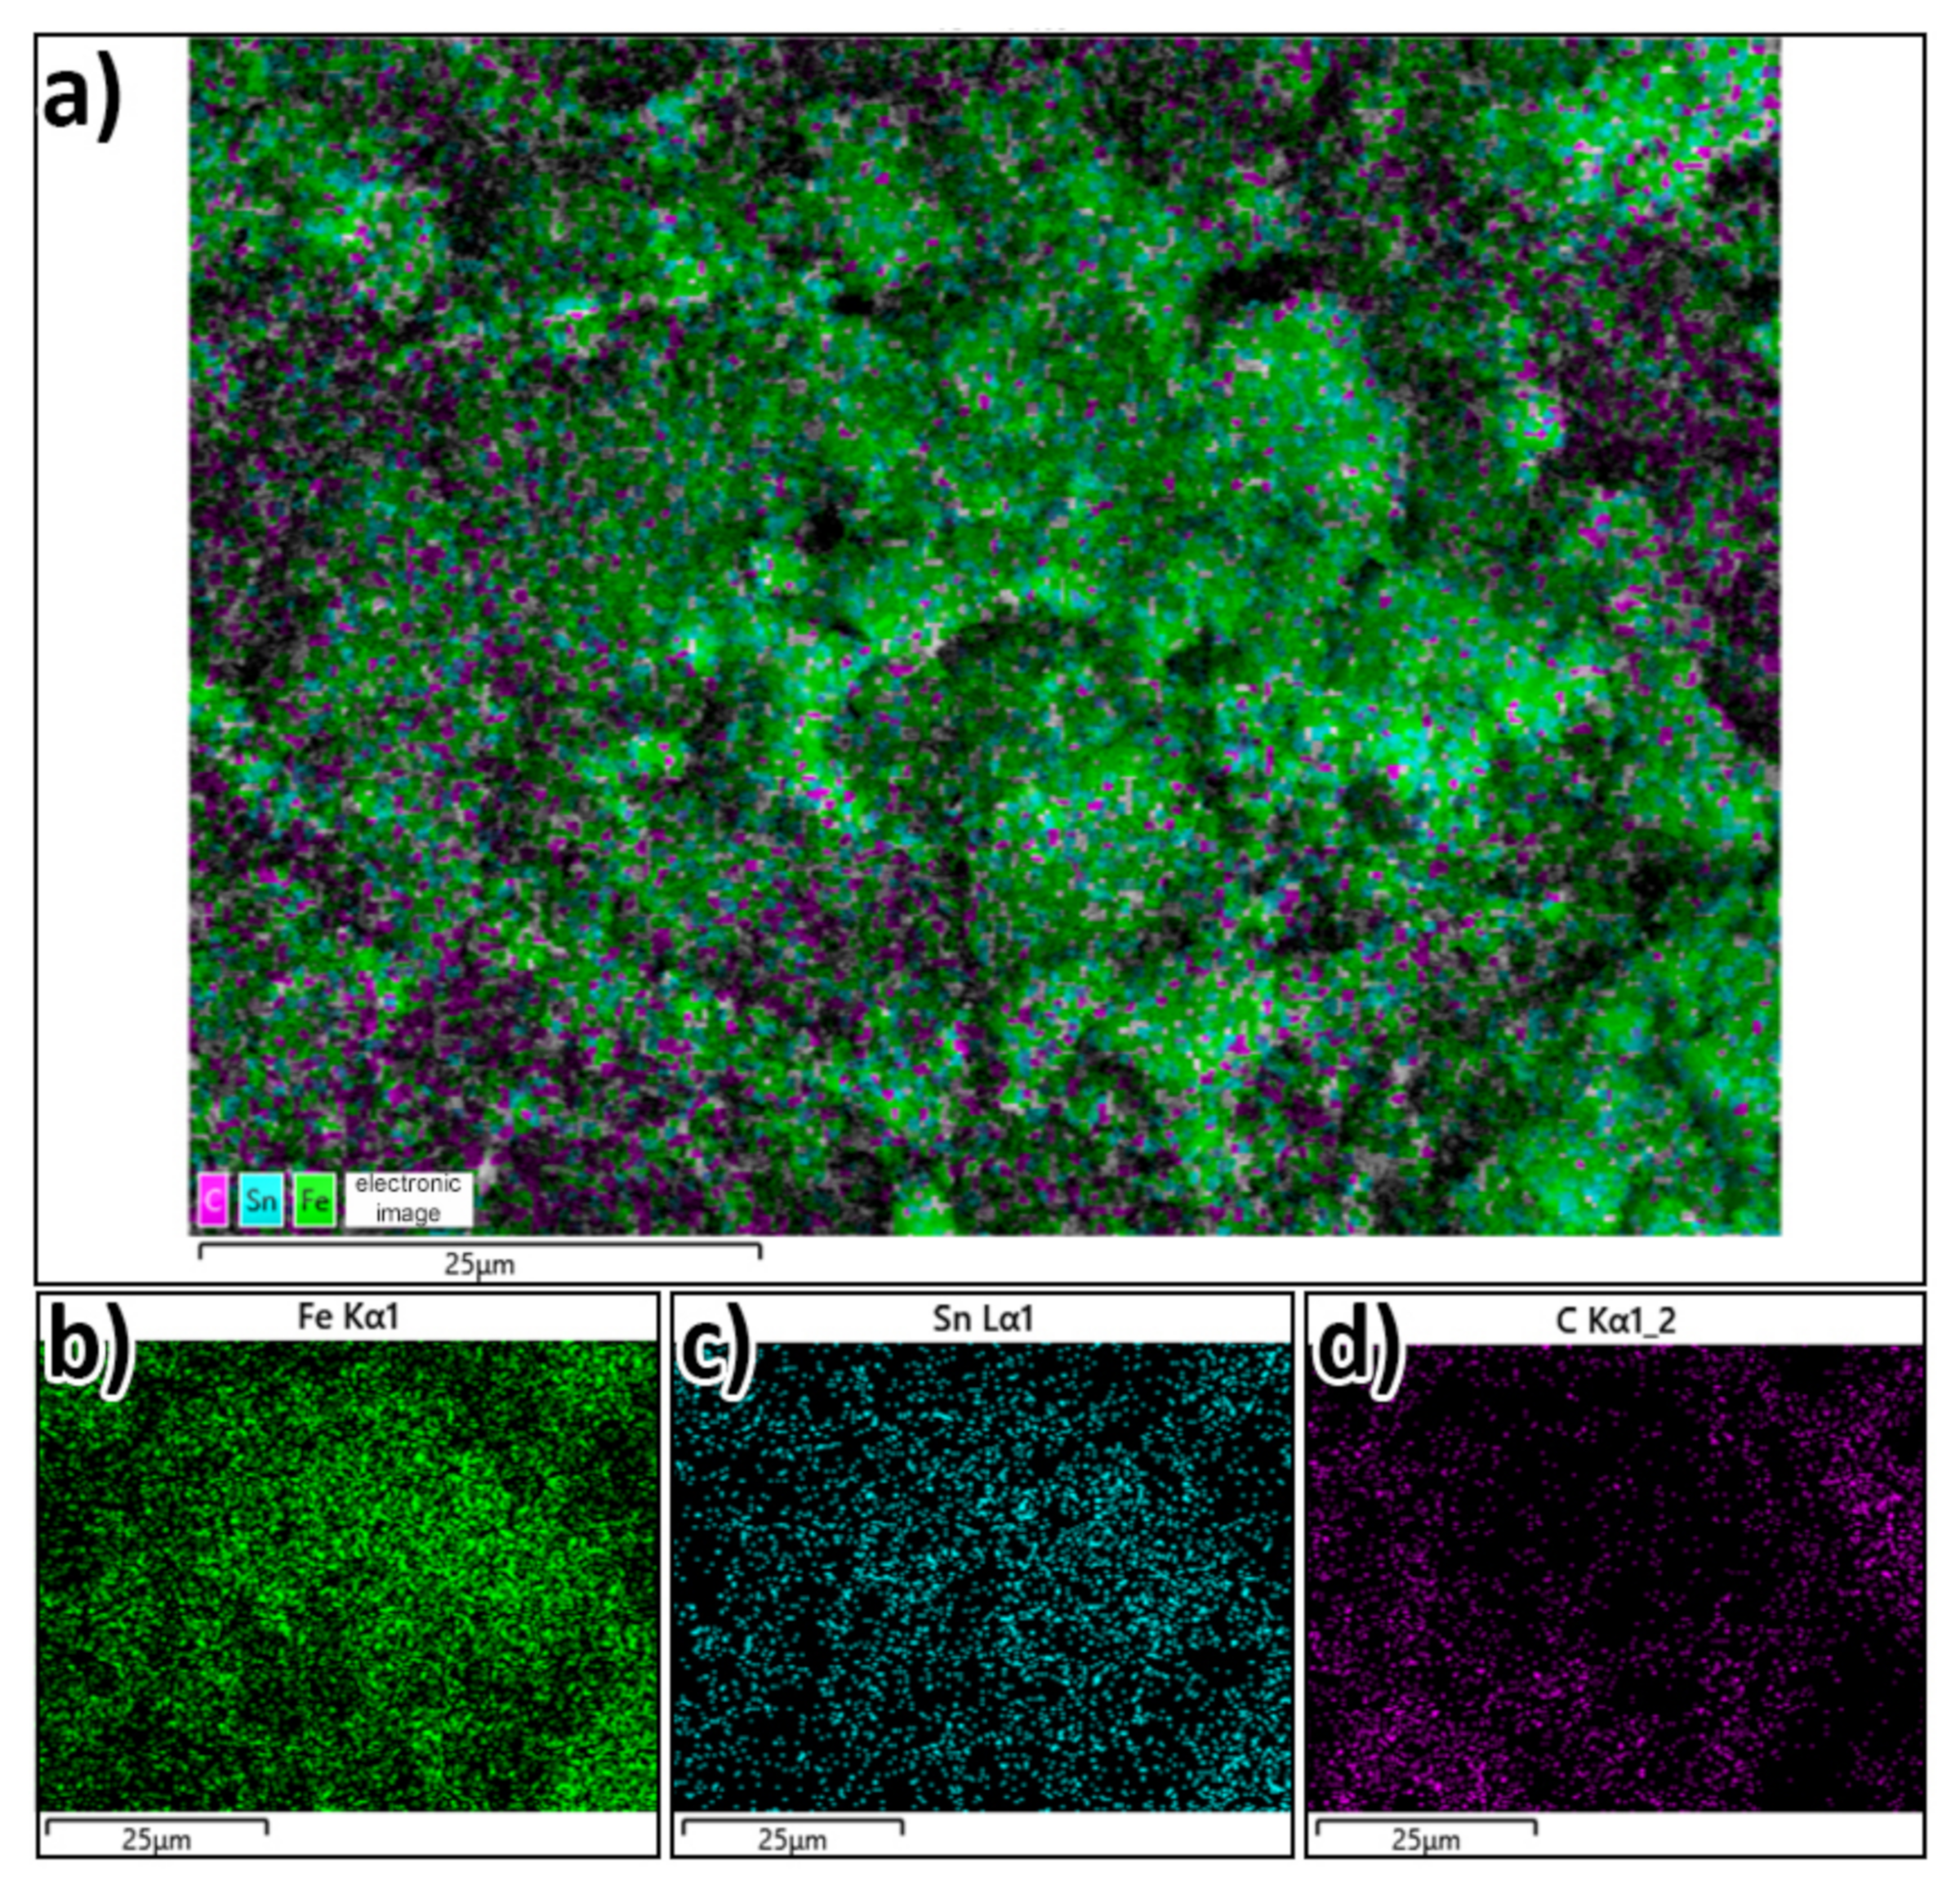
Figure 8.
U/T gas sensitivity curves for (a) formaldehyde at 200 °C, (b) ethanol at 200 °C, (c) isopropyl alcohol at 200 °C, and (d) the list of Sr, Tres, and Trec responses for three types of organic vapors at 200 °C.
Figure 8.
U/T gas sensitivity curves for (a) formaldehyde at 200 °C, (b) ethanol at 200 °C, (c) isopropyl alcohol at 200 °C, and (d) the list of Sr, Tres, and Trec responses for three types of organic vapors at 200 °C.
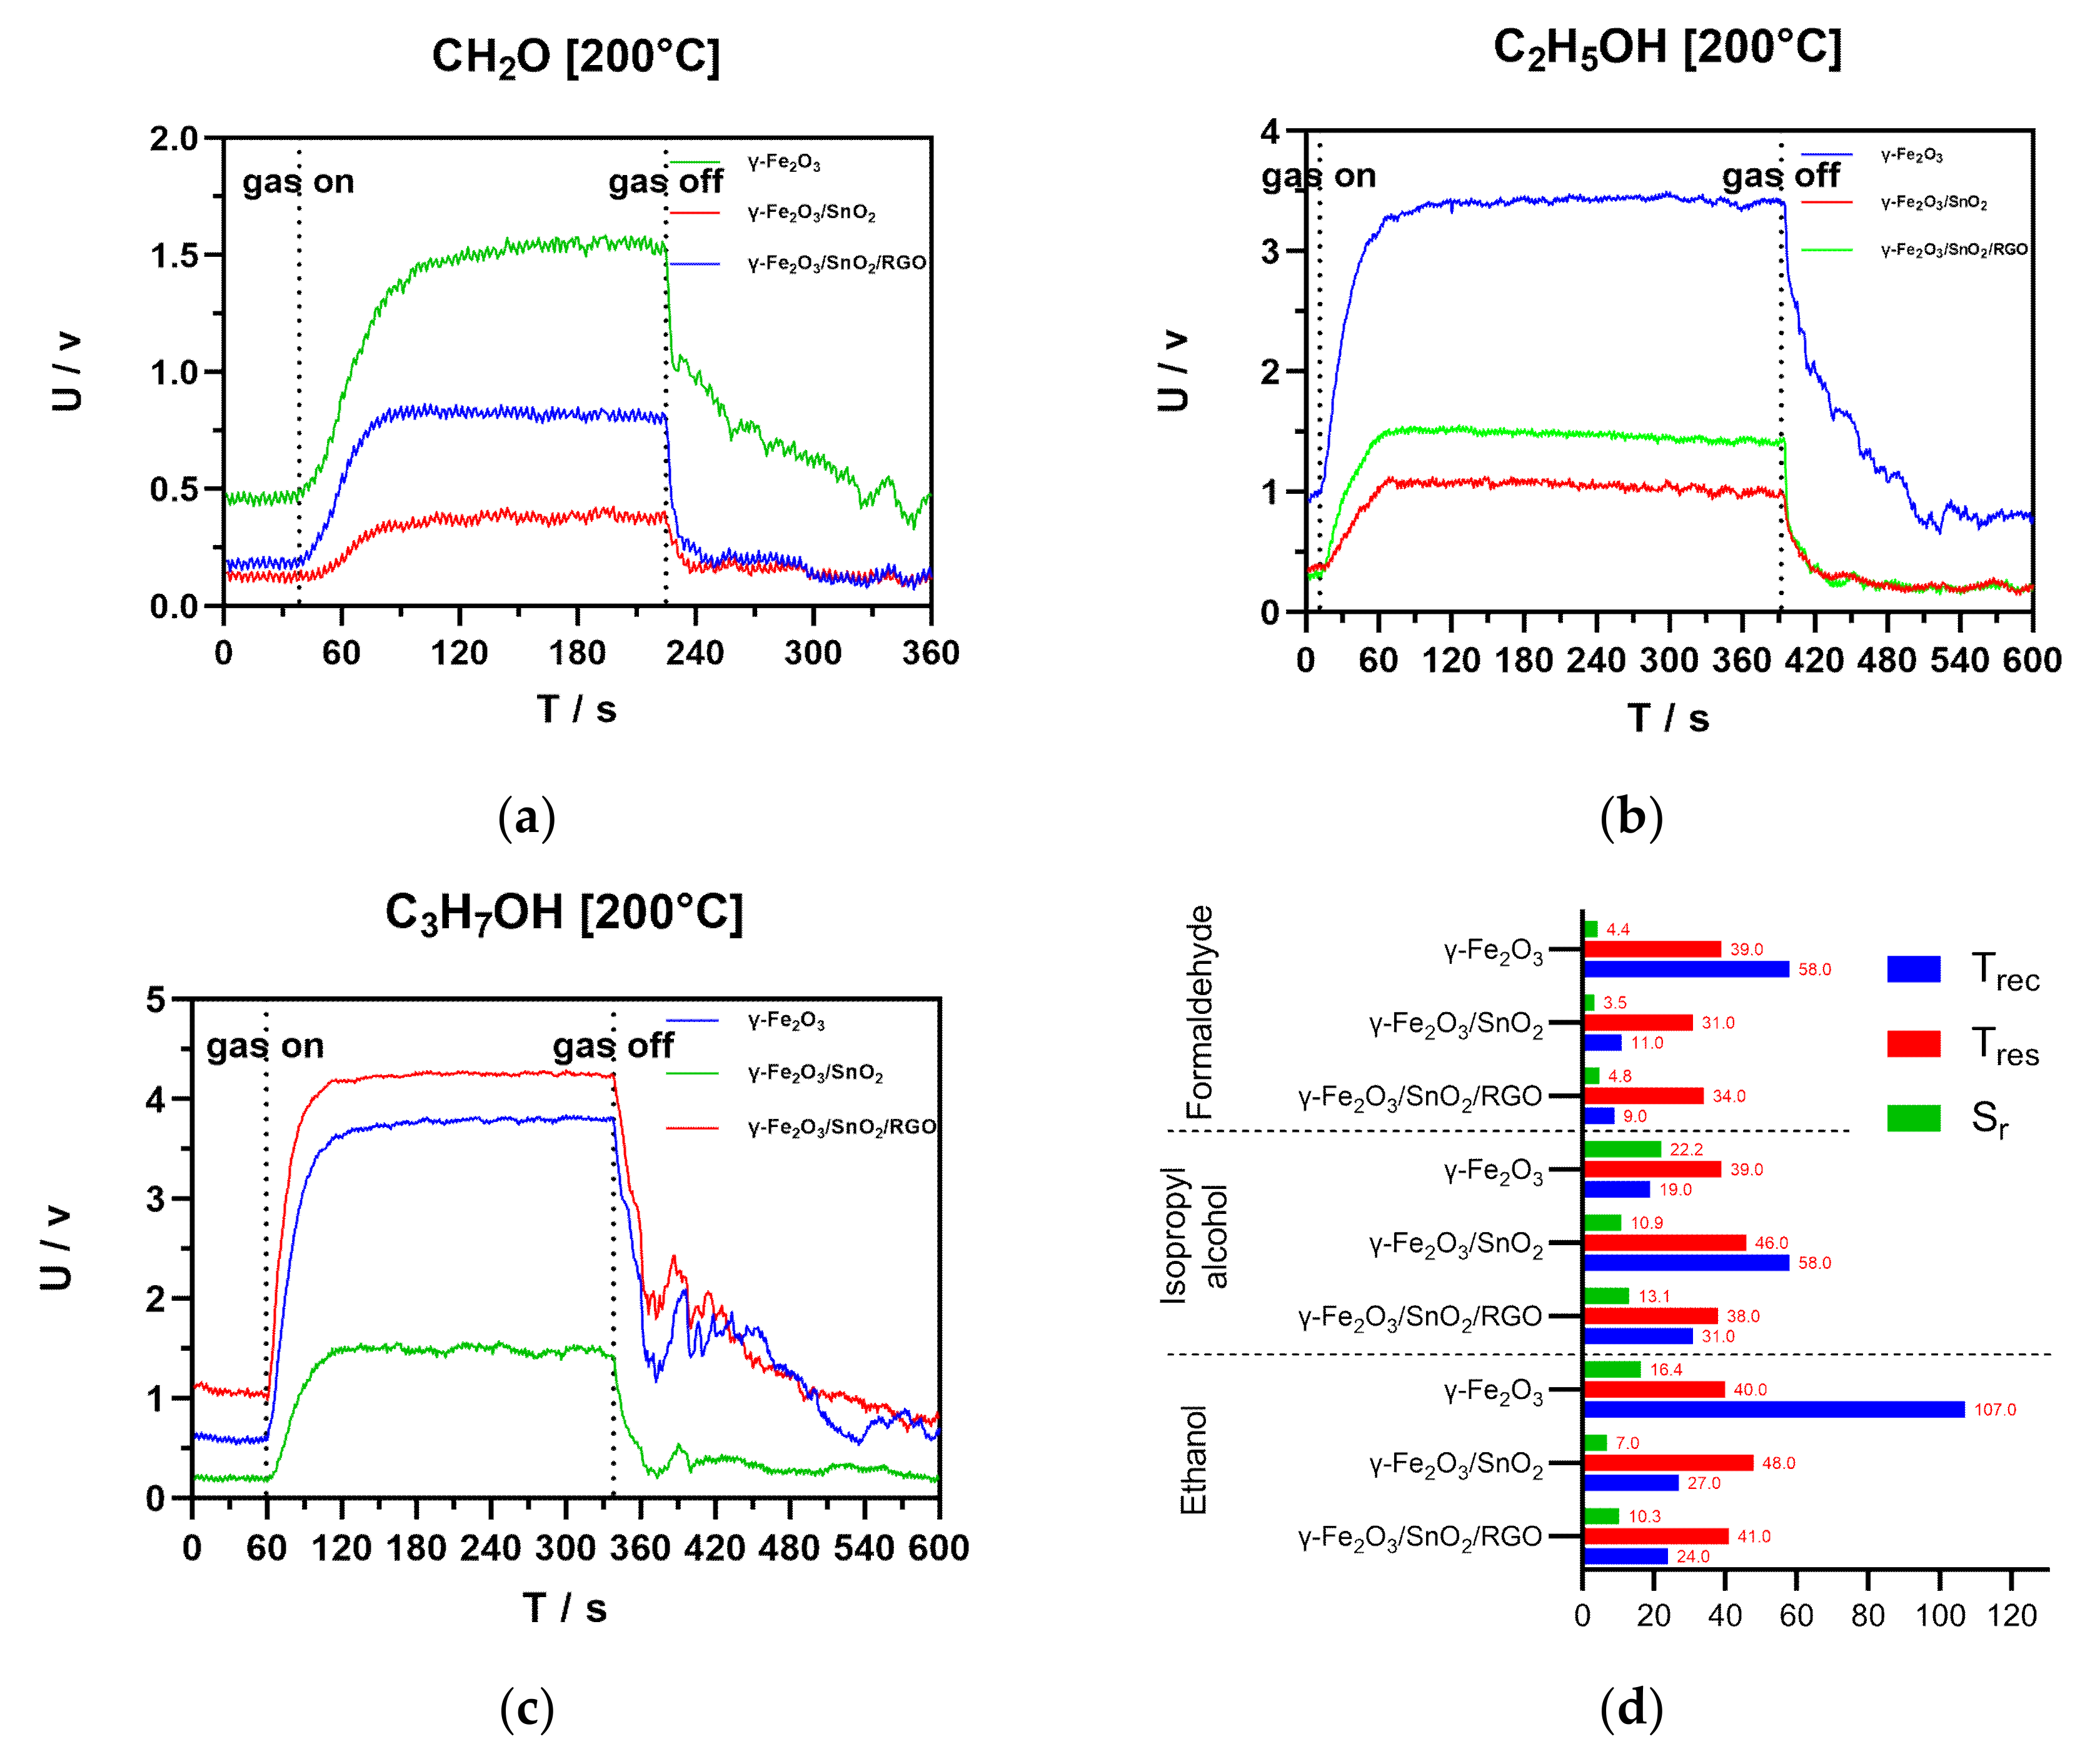
Figure 9.
U/T gas sensitivity curves for (a) H2S gas at 100 °C, (b) H2S gas at 200 °C, (c) CO gas at 300 °C, and (d) NO gas at 100 °C.
Figure 9.
U/T gas sensitivity curves for (a) H2S gas at 100 °C, (b) H2S gas at 200 °C, (c) CO gas at 300 °C, and (d) NO gas at 100 °C.
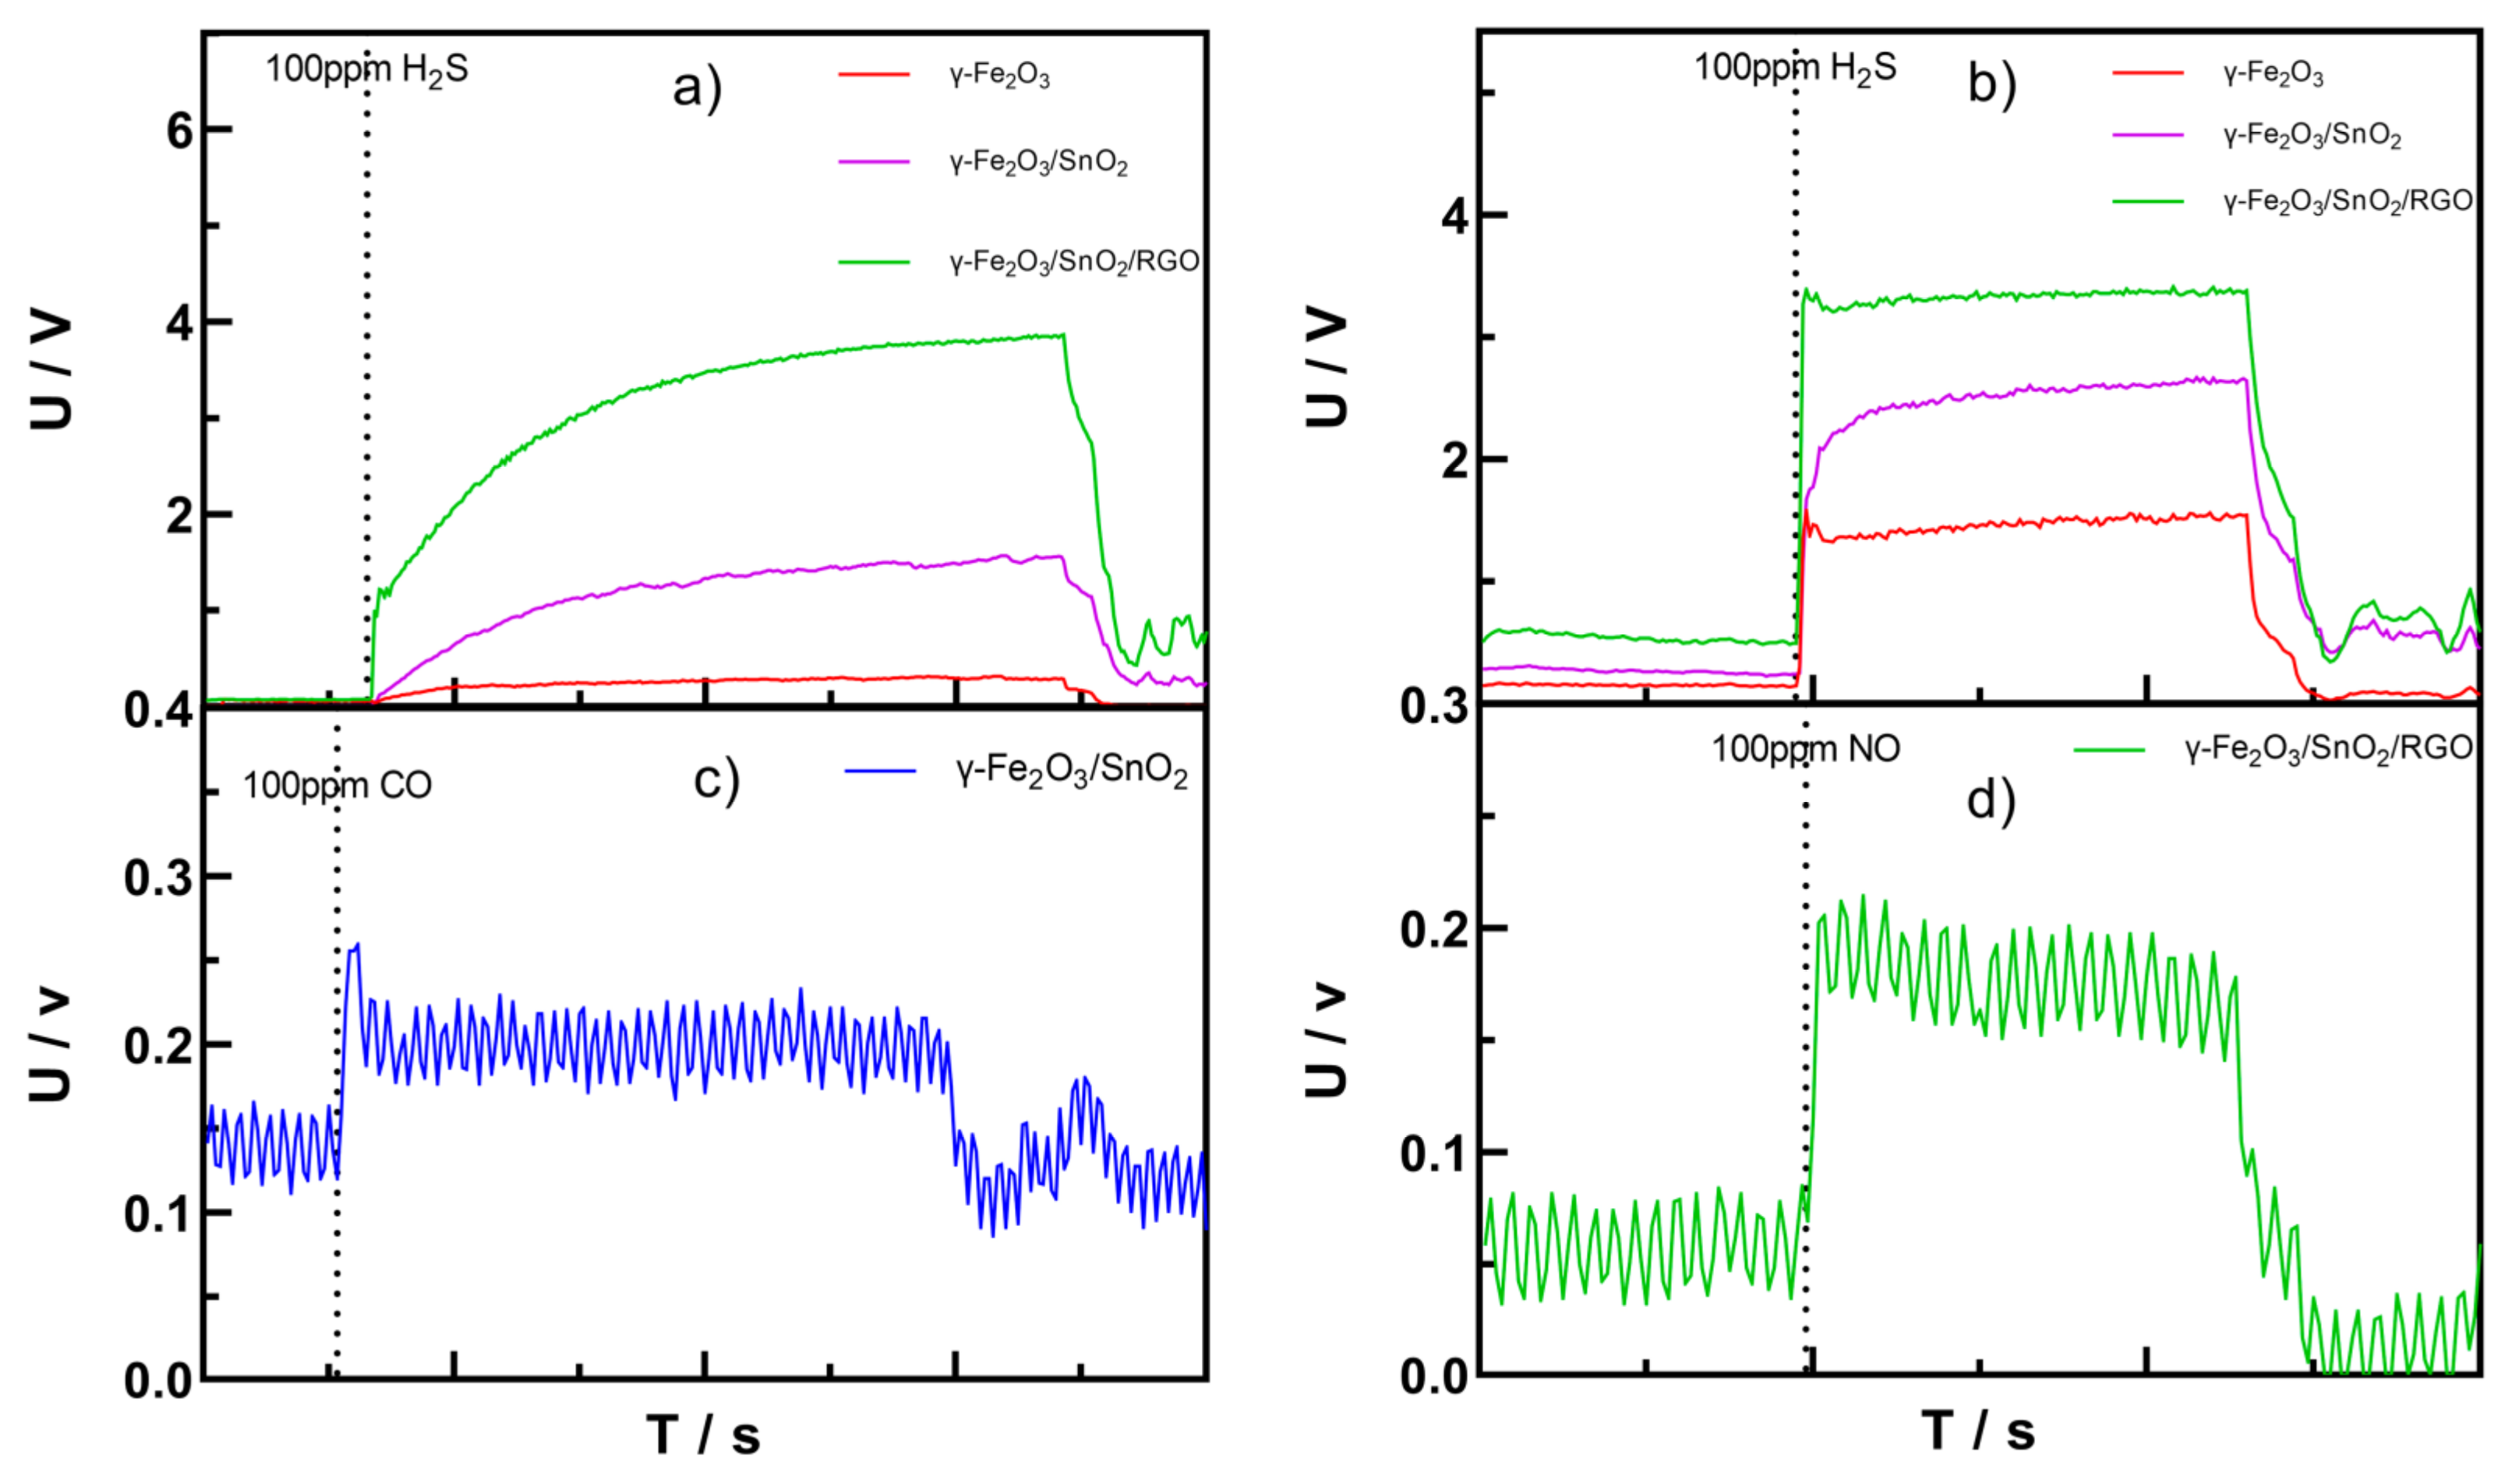
Figure 10.
U/T gas sensitivity curves of (a) γ-Fe2O3, (b) γ-Fe2O3/SnO2, and (c) γ-Fe2O3/SnO2/RGO nanoparticles as a function of H2S gas concentration at 100 °C.
Figure 10.
U/T gas sensitivity curves of (a) γ-Fe2O3, (b) γ-Fe2O3/SnO2, and (c) γ-Fe2O3/SnO2/RGO nanoparticles as a function of H2S gas concentration at 100 °C.

Figure 11.
The list of Sr, Tres, and Trec responses as a function of H2S gas concentration at 100 °C.
Figure 11.
The list of Sr, Tres, and Trec responses as a function of H2S gas concentration at 100 °C.
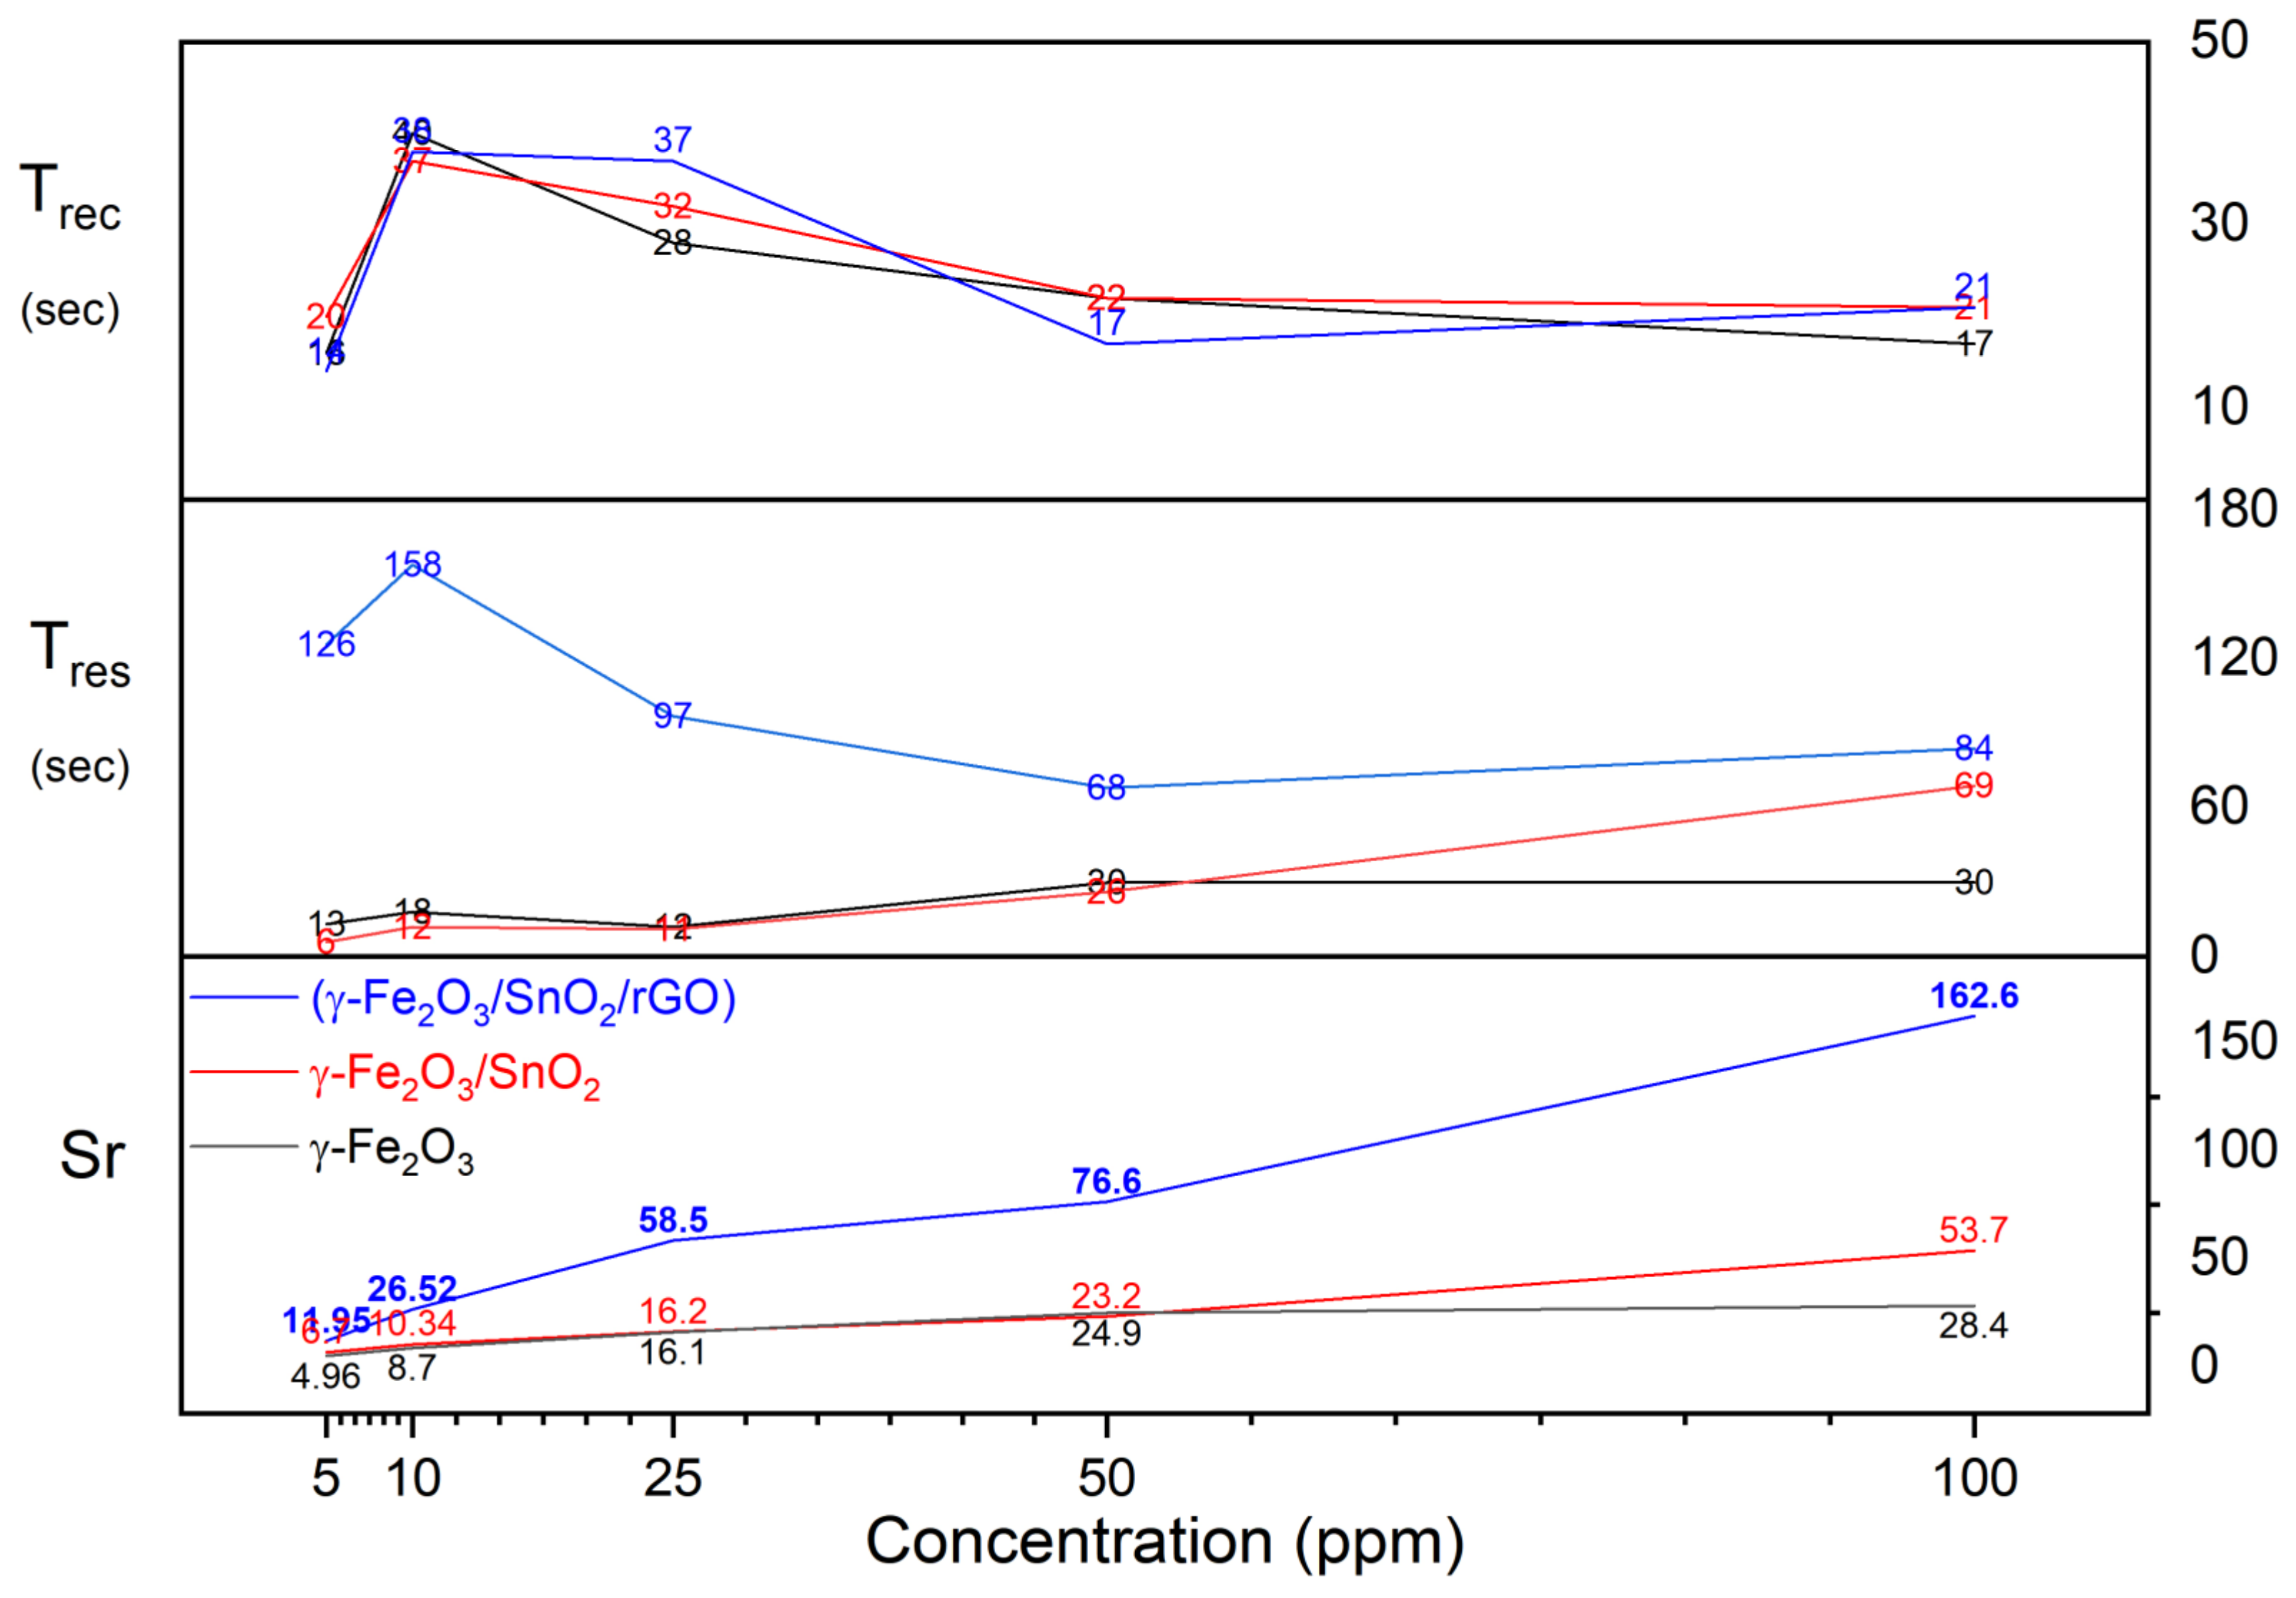
Figure 12.
The list of total Sr, Tres, and Trec responses for H2S gas-sensitivity test at 100 °C, 200 °C, and 300 °C.
Figure 12.
The list of total Sr, Tres, and Trec responses for H2S gas-sensitivity test at 100 °C, 200 °C, and 300 °C.

Table 1.
Calculated conversion list of the gas concentration to volume.
| Organic Liquids | Concentration (ppm) | Volume (μL) | |
|---|---|---|---|
| 1 | Methanol | 100 | 3.21 |
| 2 | Ethanol | 100 | 4.63 |
| 3 | Isopropyl alcohol | 100 | 6.08 |
| 4 | Formaldehyde | 100 | 2.2 |
| Gases | Concentration (ppm) | Volume (mL) | |
| 1 | CO | 100 | 1.8 |
| 2 | NO | 100 | 1.8 |
| 3 | H2S | 5 | 0.09 |
| 10 | 0.18 | ||
| 25 | 0.45 | ||
| 50 | 0.9 | ||
| 100 | 1.8 |
Table 2.
Gas-sensitivity test results for organic vapors at different temperatures.
| Gas | Compound | Temperature | Sr | Tres (s) | Trec (s) |
|---|---|---|---|---|---|
| Methanol | γ-Fe2O3 | 100 °C | - | - | - |
| γ-Fe2O3/SnO2 | - | - | - | ||
| γ-Fe2O3/SnO2/RGO | 6.4 | 15 | 14 | ||
| γ-Fe2O3 | 160 °C | 1.9 | 22 | 32 | |
| γ-Fe2O3/SnO2 | - | - | - | ||
| γ-Fe2O3/SnO2/RGO | 2.8 | 23 | 24 | ||
| γ-Fe2O3 | 200 °C | 5.3 | 18 | 34 | |
| γ-Fe2O3/SnO2 | - | - | - | ||
| γ-Fe2O3/SnO2/RGO | 7.9 | 12 | 18 | ||
| Ethanol | γ-Fe2O3 | 100 °C | - | - | - |
| γ-Fe2O3/SnO2 | - | - | - | ||
| γ-Fe2O3/SnO2/RGO | 5.3 | 19 | 16 | ||
| γ-Fe2O3 | 160 °C | 3.6 | 21 | 16 | |
| γ-Fe2O3/SnO2 | 5.0 | 25 | 11 | ||
| γ-Fe2O3/SnO2/RGO | 10.1 | 27 | 15 | ||
| γ-Fe2O3 | 200 °C | 16.4 | 40 | 107 | |
| γ-Fe2O3/SnO2 | 7.0 | 48 | 27 | ||
| γ-Fe2O3/SnO2/RGO | 10.3 | 41 | 24 | ||
| Isopropyl alcohol | γ-Fe2O3 | 100 °C | - | - | - |
| γ-Fe2O3/SnO2 | - | - | - | ||
| γ-Fe2O3/SnO2/RGO | 16.2 | 33 | 21 | ||
| γ-Fe2O3 | 160 °C | 2.56 | 38 | 15 | |
| γ-Fe2O3/SnO2 | 10.6 | 36 | 34 | ||
| γ-Fe2O3/SnO2/RGO | 5.0 | 41 | 17 | ||
| γ-Fe2O3 | 200 °C | 22.16 | 39 | 31 | |
| γ-Fe2O3/SnO2 | 10.9 | 46 | 58 | ||
| γ-Fe2O3/SnO2/RGO | 13.1 | 38 | 19 | ||
| Formaldehyde | γ-Fe2O3 | 100 °C | - | - | - |
| γ-Fe2O3/SnO2 | - | - | - | ||
| γ-Fe2O3/SnO2/RGO | 4.5 | 22 | 20 | ||
| γ-Fe2O3 | 160 °C | - | - | - | |
| γ-Fe2O3/SnO2 | - | - | - | ||
| γ-Fe2O3/SnO2/RGO | 3.9 | 50 | 15 | ||
| γ-Fe2O3 | 200 °C | 4.4 | 39 | 58 | |
| γ-Fe2O3/SnO2 | 3.5 | 31 | 11 | ||
| γ-Fe2O3/SnO2/RGO | 4.8 | 34 | 9 |
Publisher’s Note: MDPI stays neutral with regard to jurisdictional claims in published maps and institutional affiliations. |
© 2022 by the authors. Licensee MDPI, Basel, Switzerland. This article is an open access article distributed under the terms and conditions of the Creative Commons Attribution (CC BY) license (https://creativecommons.org/licenses/by/4.0/).
Share and Cite
MDPI and ACS Style
Qin, Q.; Olimov, D.; Yin, L. Semiconductor-Type Gas Sensors Based on γ-Fe2O3 Nanoparticles and Its Derivatives in Conjunction with SnO2 and Graphene. Chemosensors 2022, 10, 267. https://doi.org/10.3390/chemosensors10070267
AMA Style
Qin Q, Olimov D, Yin L. Semiconductor-Type Gas Sensors Based on γ-Fe2O3 Nanoparticles and Its Derivatives in Conjunction with SnO2 and Graphene. Chemosensors. 2022; 10(7):267. https://doi.org/10.3390/chemosensors10070267
Chicago/Turabian StyleQin, Qi, Diyor Olimov, and Li Yin. 2022. "Semiconductor-Type Gas Sensors Based on γ-Fe2O3 Nanoparticles and Its Derivatives in Conjunction with SnO2 and Graphene" Chemosensors 10, no. 7: 267. https://doi.org/10.3390/chemosensors10070267
Note that from the first issue of 2016, this journal uses article numbers instead of page numbers. See further details here.