Article

Development of a Love-Wave Biosensor Based on an Analytical Model

by
Frédéric Sarry
1,2,*,
Jeremy Bonhomme
1,2,
Mourad Oudich
1,3,
Pedro Alberto Segura Chavez
1,2,
Denis Beyssen
1,
Omar Elmazria
1,
Mohd Khairuddin Md Arshad
4 and
Paul G. Charette
2,5
1
Institut Jean Lamour, UMR CNRS 7198, Université de Lorraine, F-54000 Nancy, France
2
Laboratoire Nanotechnologies Nanosystèmes (LN2)-CNRS IRL-3463, Université de Sherbrooke, Sherbrooke, QC J1K OA5, Canada
3
Center for Acoustics and Vibration, The Pennsylvania State University, University Park, PA 16802, USA
4
Institute of Nano Electronic Engineering, Universiti Malaysia Perlis, Kangar 01000, Malaysia
5
Institut Interdisciplinaire d’Innovation Technologique (3IT), Université de Sherbrooke, Sherbrooke, QC J1K OA5, Canada
*
Author to whom correspondence should be addressed.
Chemosensors 2022, 10(2), 81; https://doi.org/10.3390/chemosensors10020081
Submission received: 24 December 2021 / Revised: 19 January 2022 / Accepted: 25 January 2022 / Published: 15 February 2022
(This article belongs to the Special Issue Selective Acoustic Wave Sensors and their Applications)

Abstract

:
The present work deals with the development of a Love-wave biosensor for the diagnosis of the modification of cell viscosity. The relevant device performance such as insertion loss, attenuation, phase velocity, and sensitivity needs to be analysed as a function of the device structure and also regarding the effect of the liquid loading. In this study, we used an analytical model based on the equation of motions for a Love wave propagating in a three-layer structure. We show that the effect of the viscous coupling leads to insertion losses and a phase shift that impact the acoustic ratio. A comparison between experimental and theoretical results showed a good agreement between the behaviours as it was observed for the phase shift vs. the insertion loss with a limited difference in values (3.11/3.09—experimental/simulation for the sensitivity to the viscosity for different insertion losses) due to the assumptions made on the model used.

1. Introduction

Biosensors have found their place in today’s society, and this has been proven with the COVID-19 pandemic, which is why the biosensors market is expected to grow at a 7.5 % compound annual growth rate (CAGR) during the forecast period of 2021–2026 [1].
In the domain of the cell, it has been shown that their mechanical properties can differentiate normal cells from cancerous cones [2]. It is therefore of prime importance to be able to detect the modification of these parameters. Typical mechanical properties of a cell include elasticity, deformability, adhesiveness, viscosity, and many others. It has been shown that infected cells have distinctive viscoelastic properties. A direct correlation was found between increasing deformability and the progression of a fibroblast cell line from a normal to a tumorigenic phenotype [3]. As an example, it could be used to compare non-tumorigenic cells, which are less deformable and more viscous than cancerous ones [4]. It has been shown that under strong deformations, the cytoskeleton behaves as a viscous-fluid-like material, and a way to study the cell material is to consider it as a Newtonian fluid [5]. Wang et al. [6] have shown the potential of using cytoplasmic viscosity in cell-type classification and cell-status evaluation in order to demonstrate abnormal cellular functions of cancer cells that alter cytoskeletons.
Several techniques are currently available in elucidating these mechanical properties such as atomic force microscopy (AFM), micropipette aspiration, and optical trapping. The interest on this multidisciplinary research field has soared thanks to the development of micro and nanotechnology [7], and surface acoustic wave devices are one of these technologies. Love surface acoustic waves (L-SAW) can access a high level of sensitivity. L-SAW is sensitive to different physical properties such as conductivity, viscosity, viscoelastic changes, or elastic stiffness of the propagation medium as well as biological properties such as mass density [8,9]. In fact, the L-SAW platform is made of a piezoelectric substrate bounded by a thin guiding layer (GL) at the surface where L-SAW that has shear horizontal polarization can propagate with a strain energy mostly confined within the GL. Consequently, for a fluid in contact with the surface of the GL, L-SAW displays high sensitivity and propagates with very low loss since the acoustic energy is weakly transferred into the fluid. Due to this huge amount of possibilities to associate different substrates, guiding layers, and sensitive layers, it is of prime importance to be able to determine what choices should be made to obtain the best acoustic response considering the intended application. For that reason, modelisations are of main importance to simulate a priori the main parameters that should be fixed. Different approaches should be considered in terms of simulation like those based on the coupling of the mode model developed by Hashimoto [10,11]. The finite element (FE) model is an accurate method to simulate our problem of dispersion of the Love wave under viscous liquid. Indeed, this method allows to take into account the complete structure with the interdigital transducers (IDTs) while offering a strong method of solving the wave equations [12].
We studied the behaviour of circulating moncoytes THP-1 cell under the influence of mechanical excitation. These cells are a human monocytic cell line derived from an acute monocytic leukemia patient. We showed that the mitochondrial activity of the stressed cells by SAW would be decreased at 2 W without death, whereas it would be exacerbated at 500 mW whatever the applied dose. The transcriptomic study highlighted the impacts of ultrasound on cell mitochondria, which even for a slight increase in their activity would cause a response to hyperoxia sufficiently controlled not to induce cell death [13]. By using L-SAW, we would like to be able to identify cytoskeletal THP-1 cell alterations by measuring the variation in the fluid viscosity due to mechanical strain.
In this article, we present an analytical method that includes the fluid loading and the viscosity to model our layered structure in Love-wave configuration. To resolve the equations, we considered the material as isotropic, and we neglected the piezoelectricity. For such an analytical approach, the IDTs were omitted due to their small thickness with respect to the wavelength [14,15]. This analytical analysis is compared to experimental results to validate its use for Love-wave sensor optimization to detect biological liquid.
The governing equations are introduced in Section 2 while considering our layered structure. The sensor sensitivity is then studied as a function of the thickness of the guiding layer. In Section 3, the L-SAW biosensor is developed. Two different structures, Z n O / Q u a r t z A T X + 90 and Z n O / L i N b O 3 36 Y X are presented with different responses. The insertion losses Δ I L and the phase shift Δ Φ are used to explain the Newtonian regime and the sensitivity. Then, the acoustic ratio Δ I L Δ Φ is introduced to present the interaction between the sensor and the sensitive layer. In the last section, we make a comparison between the experimental data and the simulation in order to understand the limitations of our model and therefore to know its application framework.

2. Analytical Model of the Love-Wave Structure

Love waves are polarized transverse waves. They present low radiation in fluids and a good sensitivity [16], so they should be used in biological applications where fluids are present. They are obtained by depositing a thin layer on top of the substrate. The shear velocity in the layer must be lower than that of the substrate to obtain the confinement of the wave.

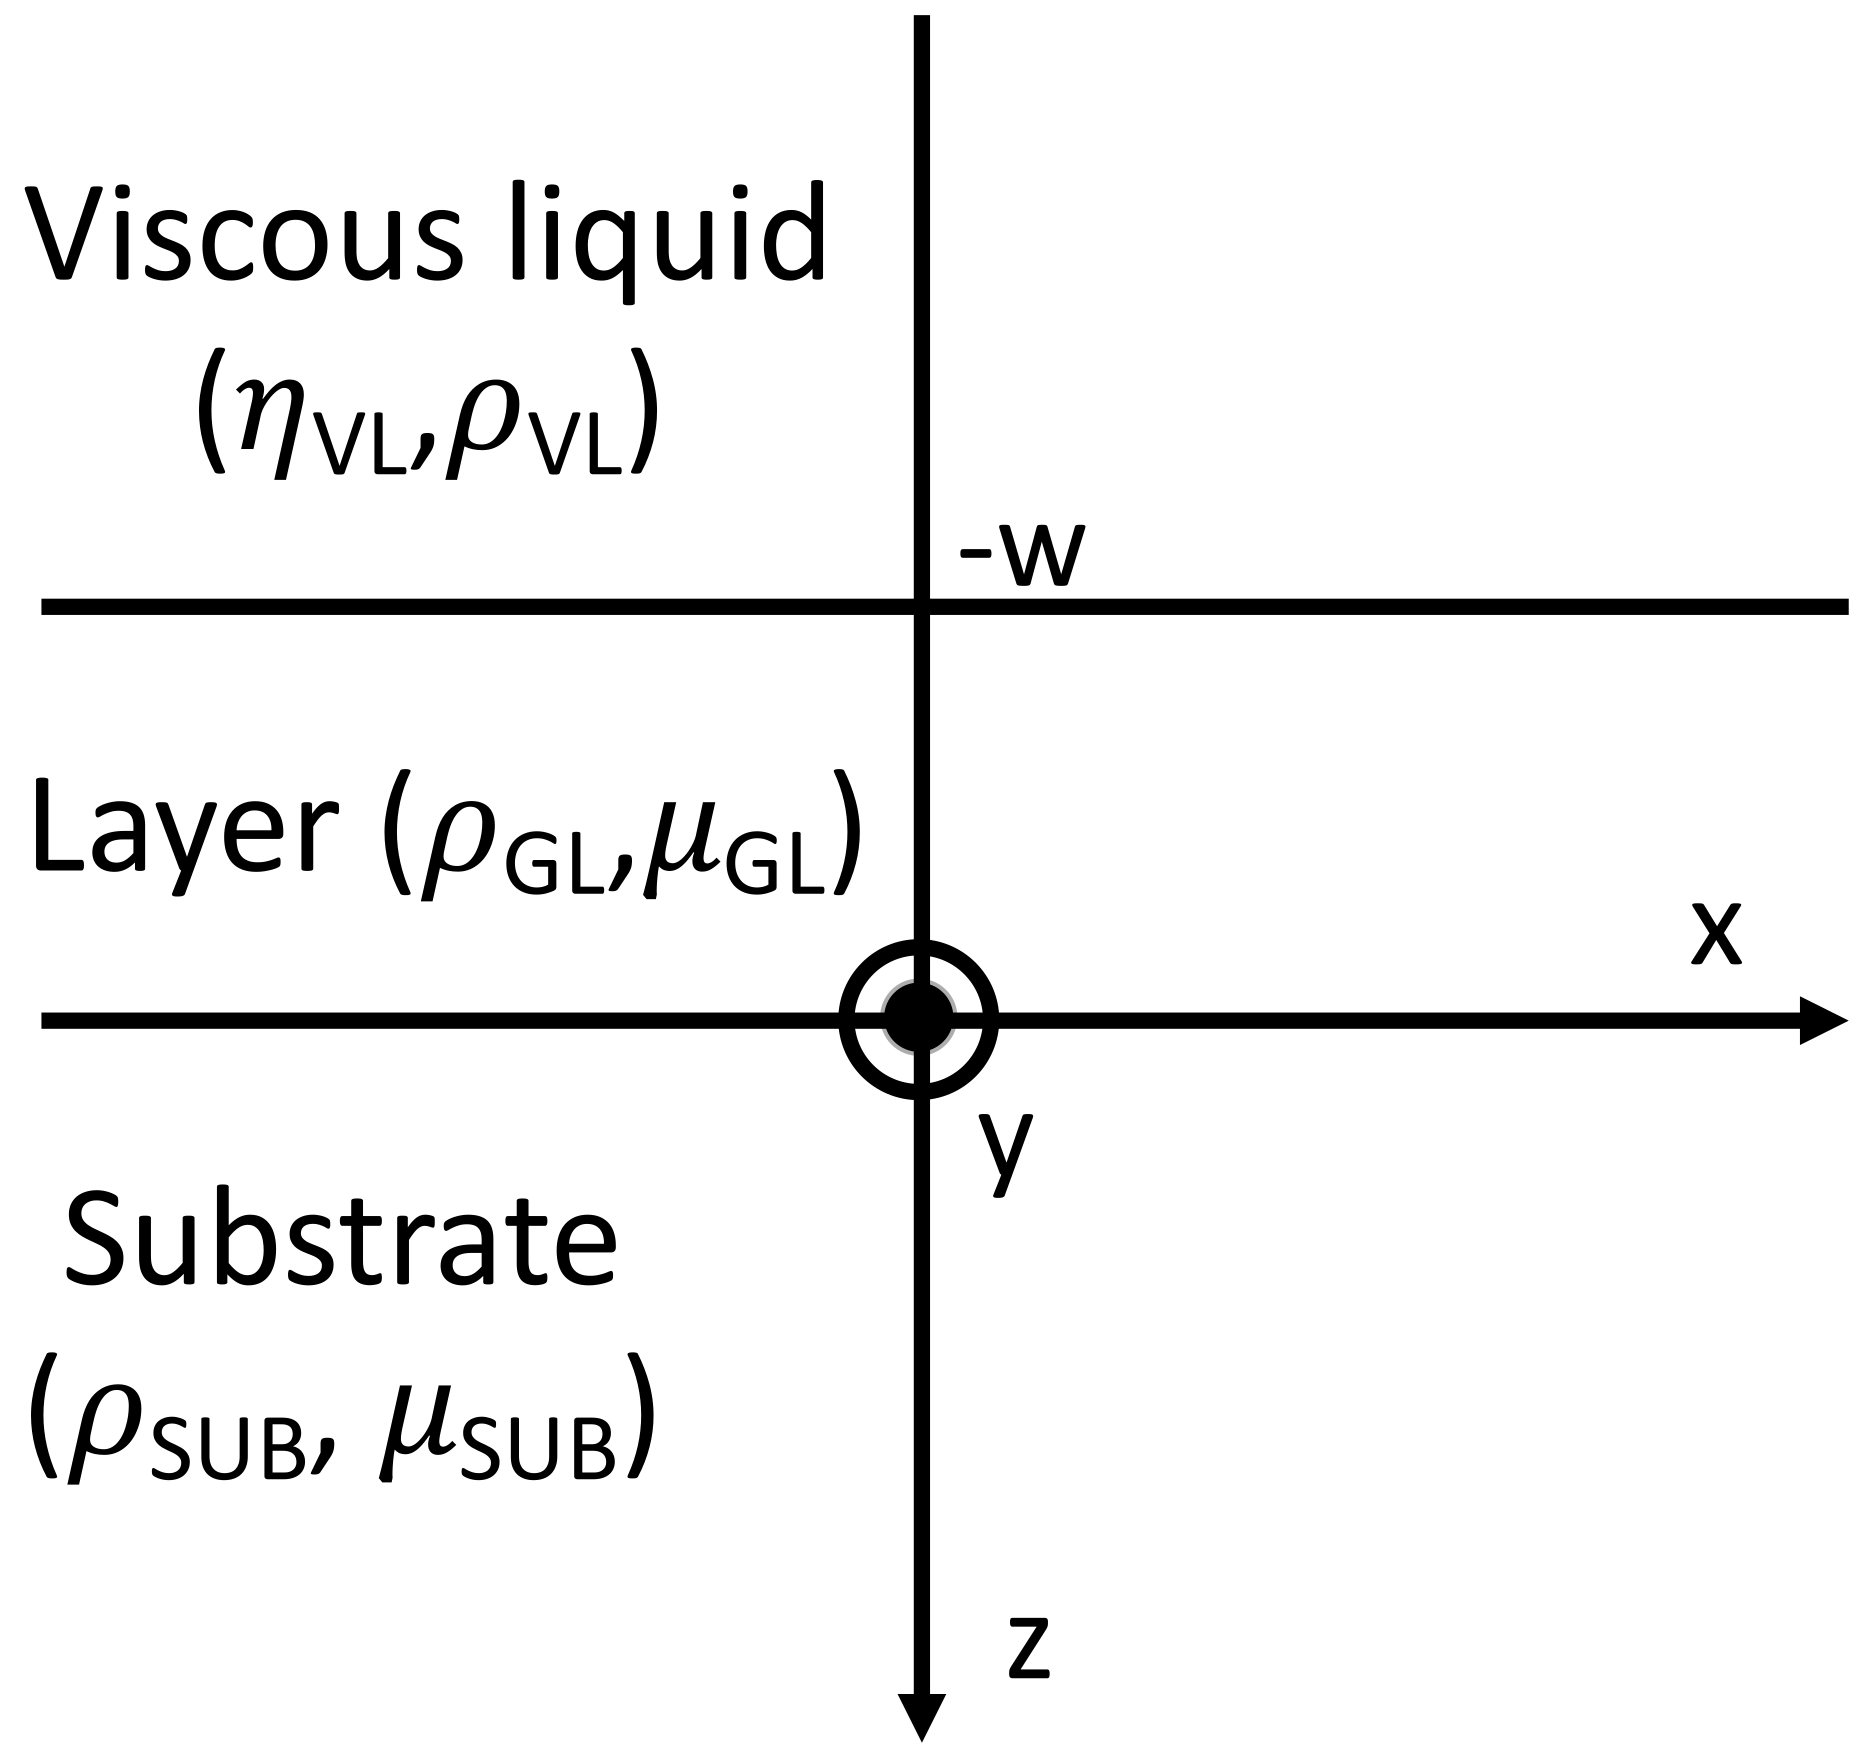
2.1. Physical Formulation of the Problem
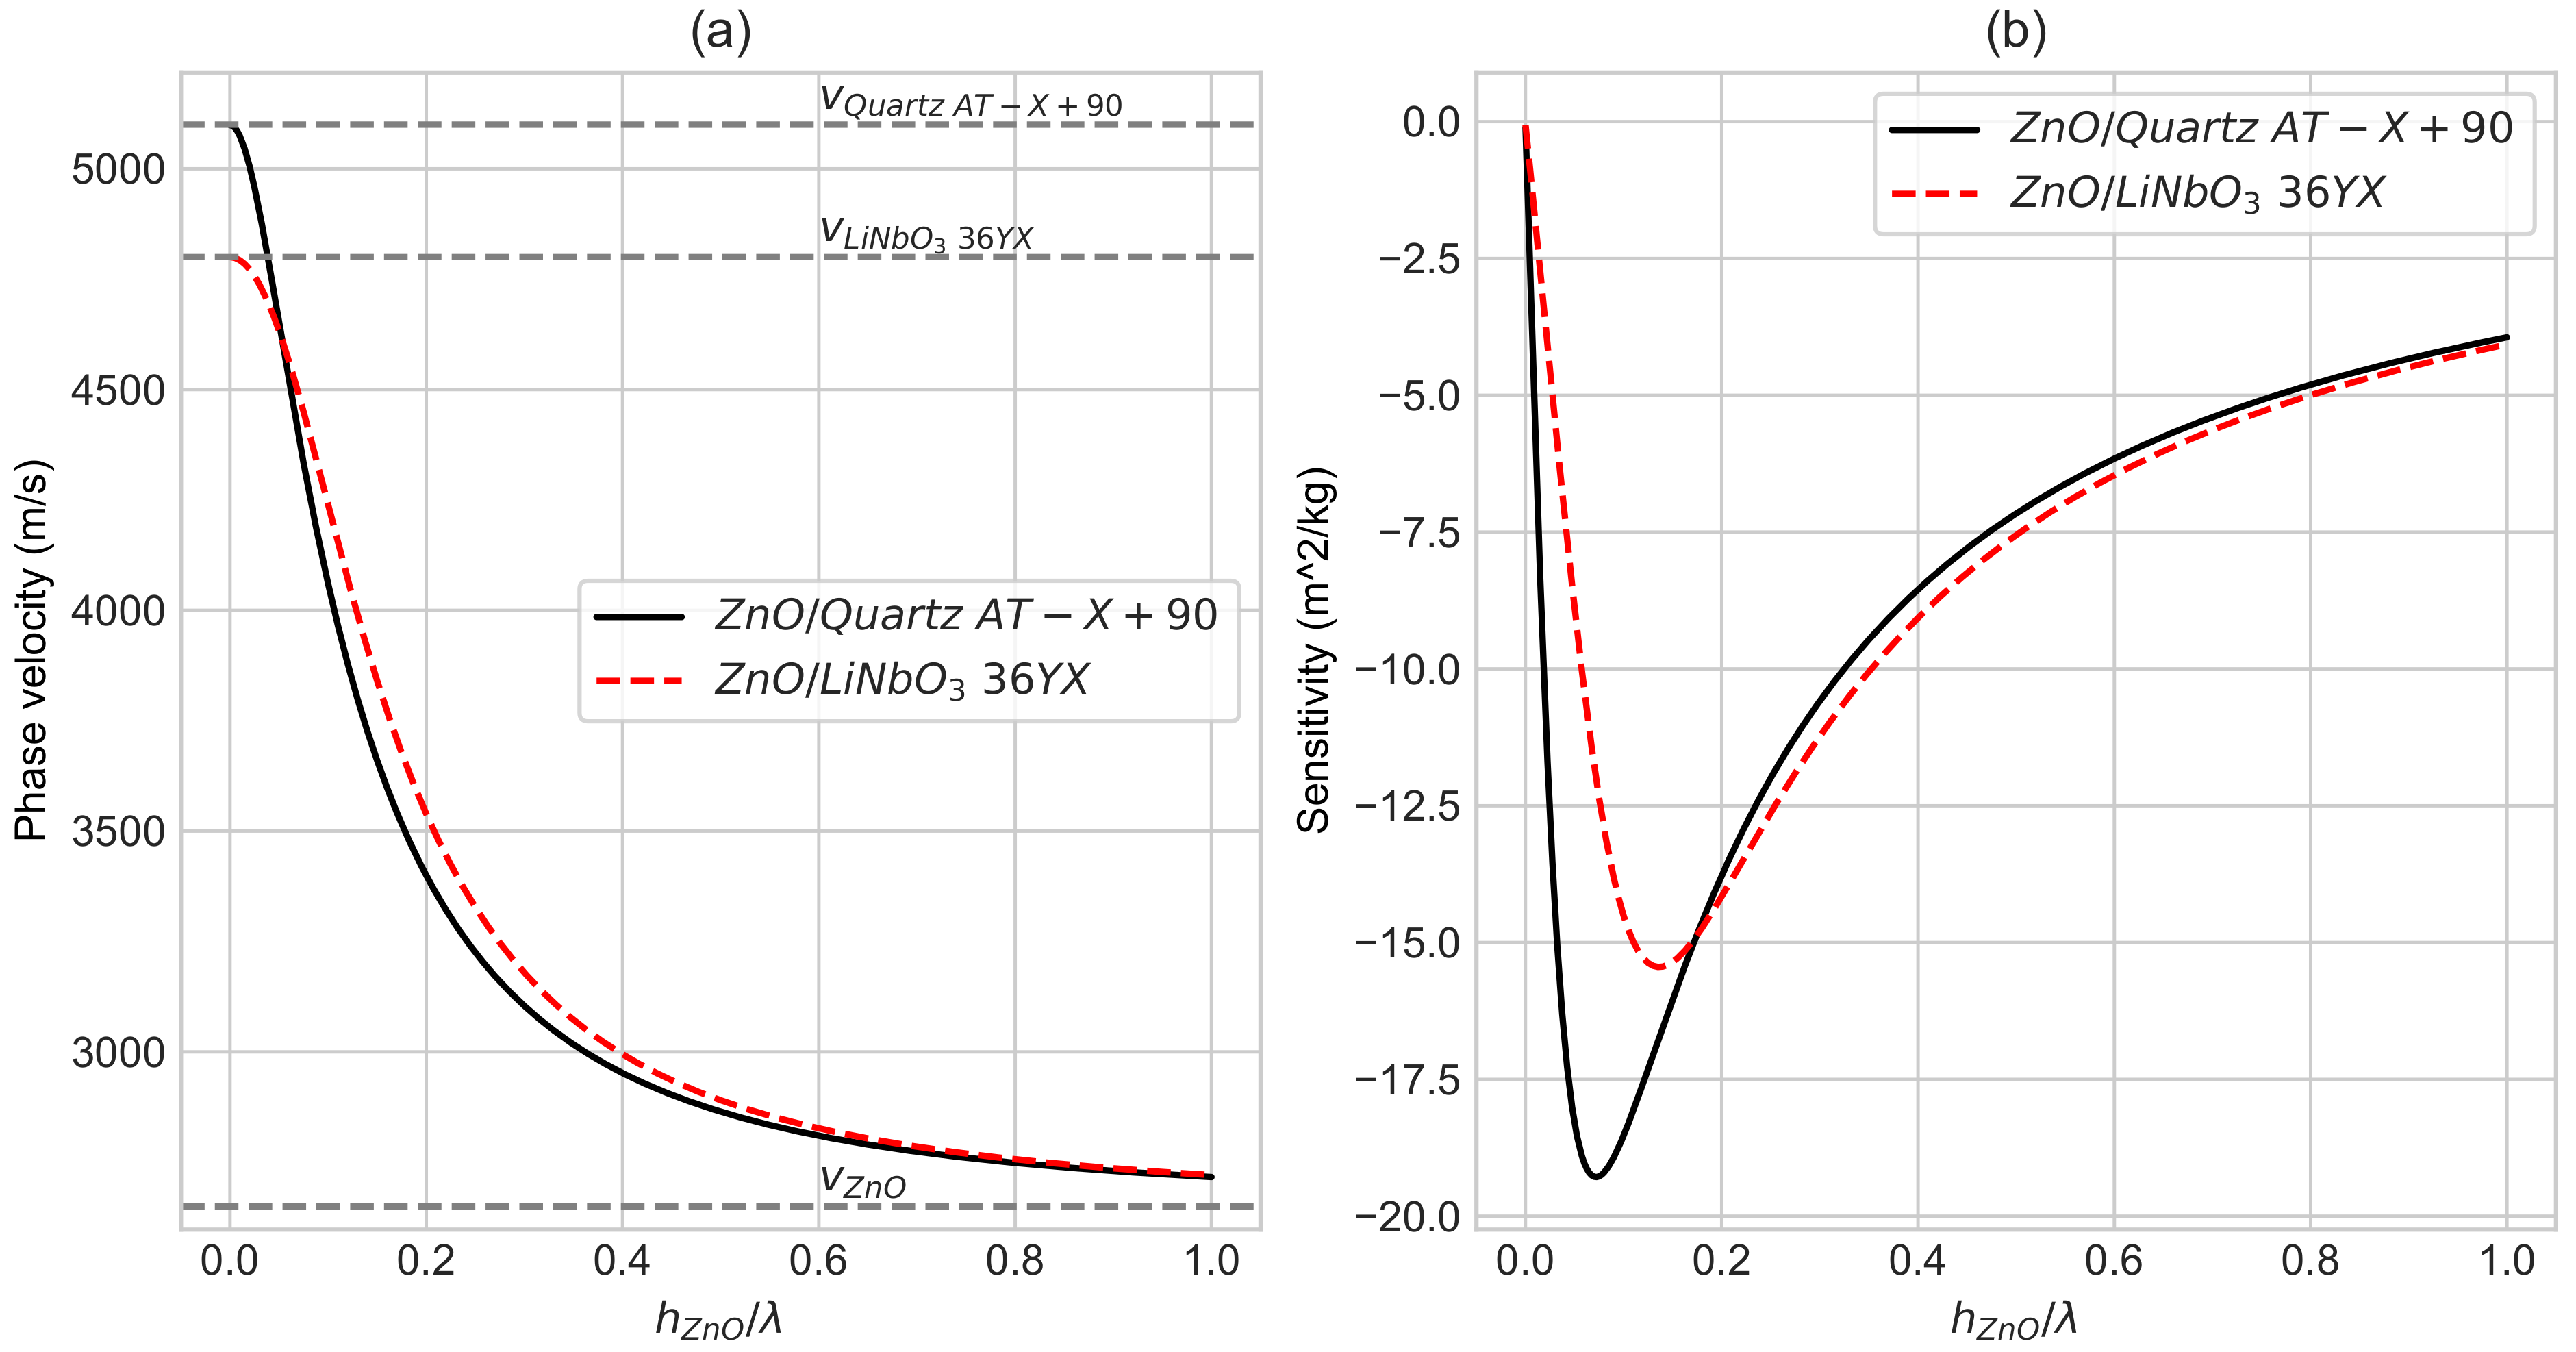
In this part, we consider the propagation of a Love wave in a system composed of a piezoelectric substrate (SUB) and a waveguiding layer (GL) on top of it and an additional viscous layer (VL). The mechanical displacement of the Love wave u y is polarized along the y-axis, perpendicular to the direction of propagation x with the waveguide surface at z = −w (Figure 1).
The substrate and the wave-guiding layer are considered to be rigidly coupled, and the equation of motion in each part should be given by:
ρ 2 u j t 2 = μ 2 u j
where ρ is the density of the material; μ is the shear modulus; and u j is the displacement field.
Considering the liquid on top of the structure, one may consider the Navier–Stokes equation under the assumption that the liquid is viscous and incompressible.
ν V L t = η V L ρ V L 2 ν V L
where ν V L is the fluid velocity and η V L the fluid viscosity.
The assumption used is that the GL and the liquid are isotropic layers. The surface wave is considered to be a pure mechanical wave without electrical properties. As the Love wave propagates in the y direction, we only solve the equation along this axis. Moreover, as the model is considered in the x-z plane, the derivatives along the y-axis cancel out. For a harmonic solution, the wave function u y can be expressed as u y = U y ( x , z ) · exp ( i ( k x ω t ) ) , where ω is the angular frequency, and k is the complex wavenumber. The shear modulus of the guiding layer is μ G L = C 44 with C 44 an elastic constant. The displacement field and the stress components T i 3 present a continuity at the interface between the GL and the substrate.
u y S U B | z = 0 = u y G L | z = 0 and T i 3 S U B | z = 0 = T i 3 G L | z = 0
u y G L t | z = w = ν y G L | z = w and T i 3 V L | z = w = T i 3 G L | z = w
From the above theoretical approach, the complex wave number k can be expressed as k = k 0 + j α where k 0 = ω ν determines the phase velocity, and α is the attenuation coefficient of the Love wave.
Based on these two parameters, it is then possible to evaluate the insertion loss shift ( Δ I L ) and the phase shift ( Δ Φ ) [18,19]:
Δ I L ( dB ) = α 1 α 0 × 20 log e × D
Δ Φ ( rad ) = ω ν 1 ω ν 0 × D
where the indices 0 and 1 are the non-perturbated and perturbated state, respectively, and D is the distance between the IDTs.
These last equations provide a relation between the experimental data (IL, Φ ) and the physical parameters of the device, which appear through the attenuation α and the phase velocity ν .

2.2. Results

Based on the theoretical approach of Campbell and Jones [16] and McHale [14,20], we determined the dispersion curve and the sensitivity of our two layer systems made of a substrate ( Q u a r t z A T or L i N b O 3 36 Y X ) and a wave-guiding layer ( Z n O ). The reduced Equation (7) to determine the mass sensitivity was obtained from Moreira et al. [21]:
S m = 1 ρ G L f 0 v G L d d z l n ( v ) z = w
where ρ G L is the density of the guiding layer, and w is its thickness.
Figure 2a shows the phase velocity calculated for a wavelength of λ = 40 μ m and for two different substrates, Q u a r t z A T X + 90 and L i N b O 3 36 Y X . Their thickness was fixed to 1 mm, and their velocities ( v S U B ) were 5100 ms 1 and 4800 ms 1 , respectively. The ZnO wave-guiding layer parameters were ρ G L = 5.665 kg m 3 and v G L = 2650 ms 1 . The horizontal axis is a dimensionless parameter of the GL thickness normalized by the wavelength λ G L . One may note that the phase velocity is between the two limit values, which are the substrate velocity and the guiding-layer velocity.
Using this theoretical approach, we determined the relative thickness of the Z n O layer to obtain the maximum sensitivity (Figure 2b). The obtained values were h / λ = 0.0725 for the Z n O / Q u a r t z A T X + 90 and h / λ = 0.135 for the Z n O / L i N b O 3 36 Y X with the phase velocity V Z n O / Q u a r t z A T X + 90 = 4364 ms 1 and V Z n O / L i N b O 3 36 Y X = 3932 ms 1 . Considering the wavelength value, the Z n O layer thicknesses were h Z n O 2.8 μ m and h Z n O 4.9 μ m, which was 86 % thicker for the second structure. These two ZnO thicknesses will be used for the experimental devices.

3. Love SAW Biosensors

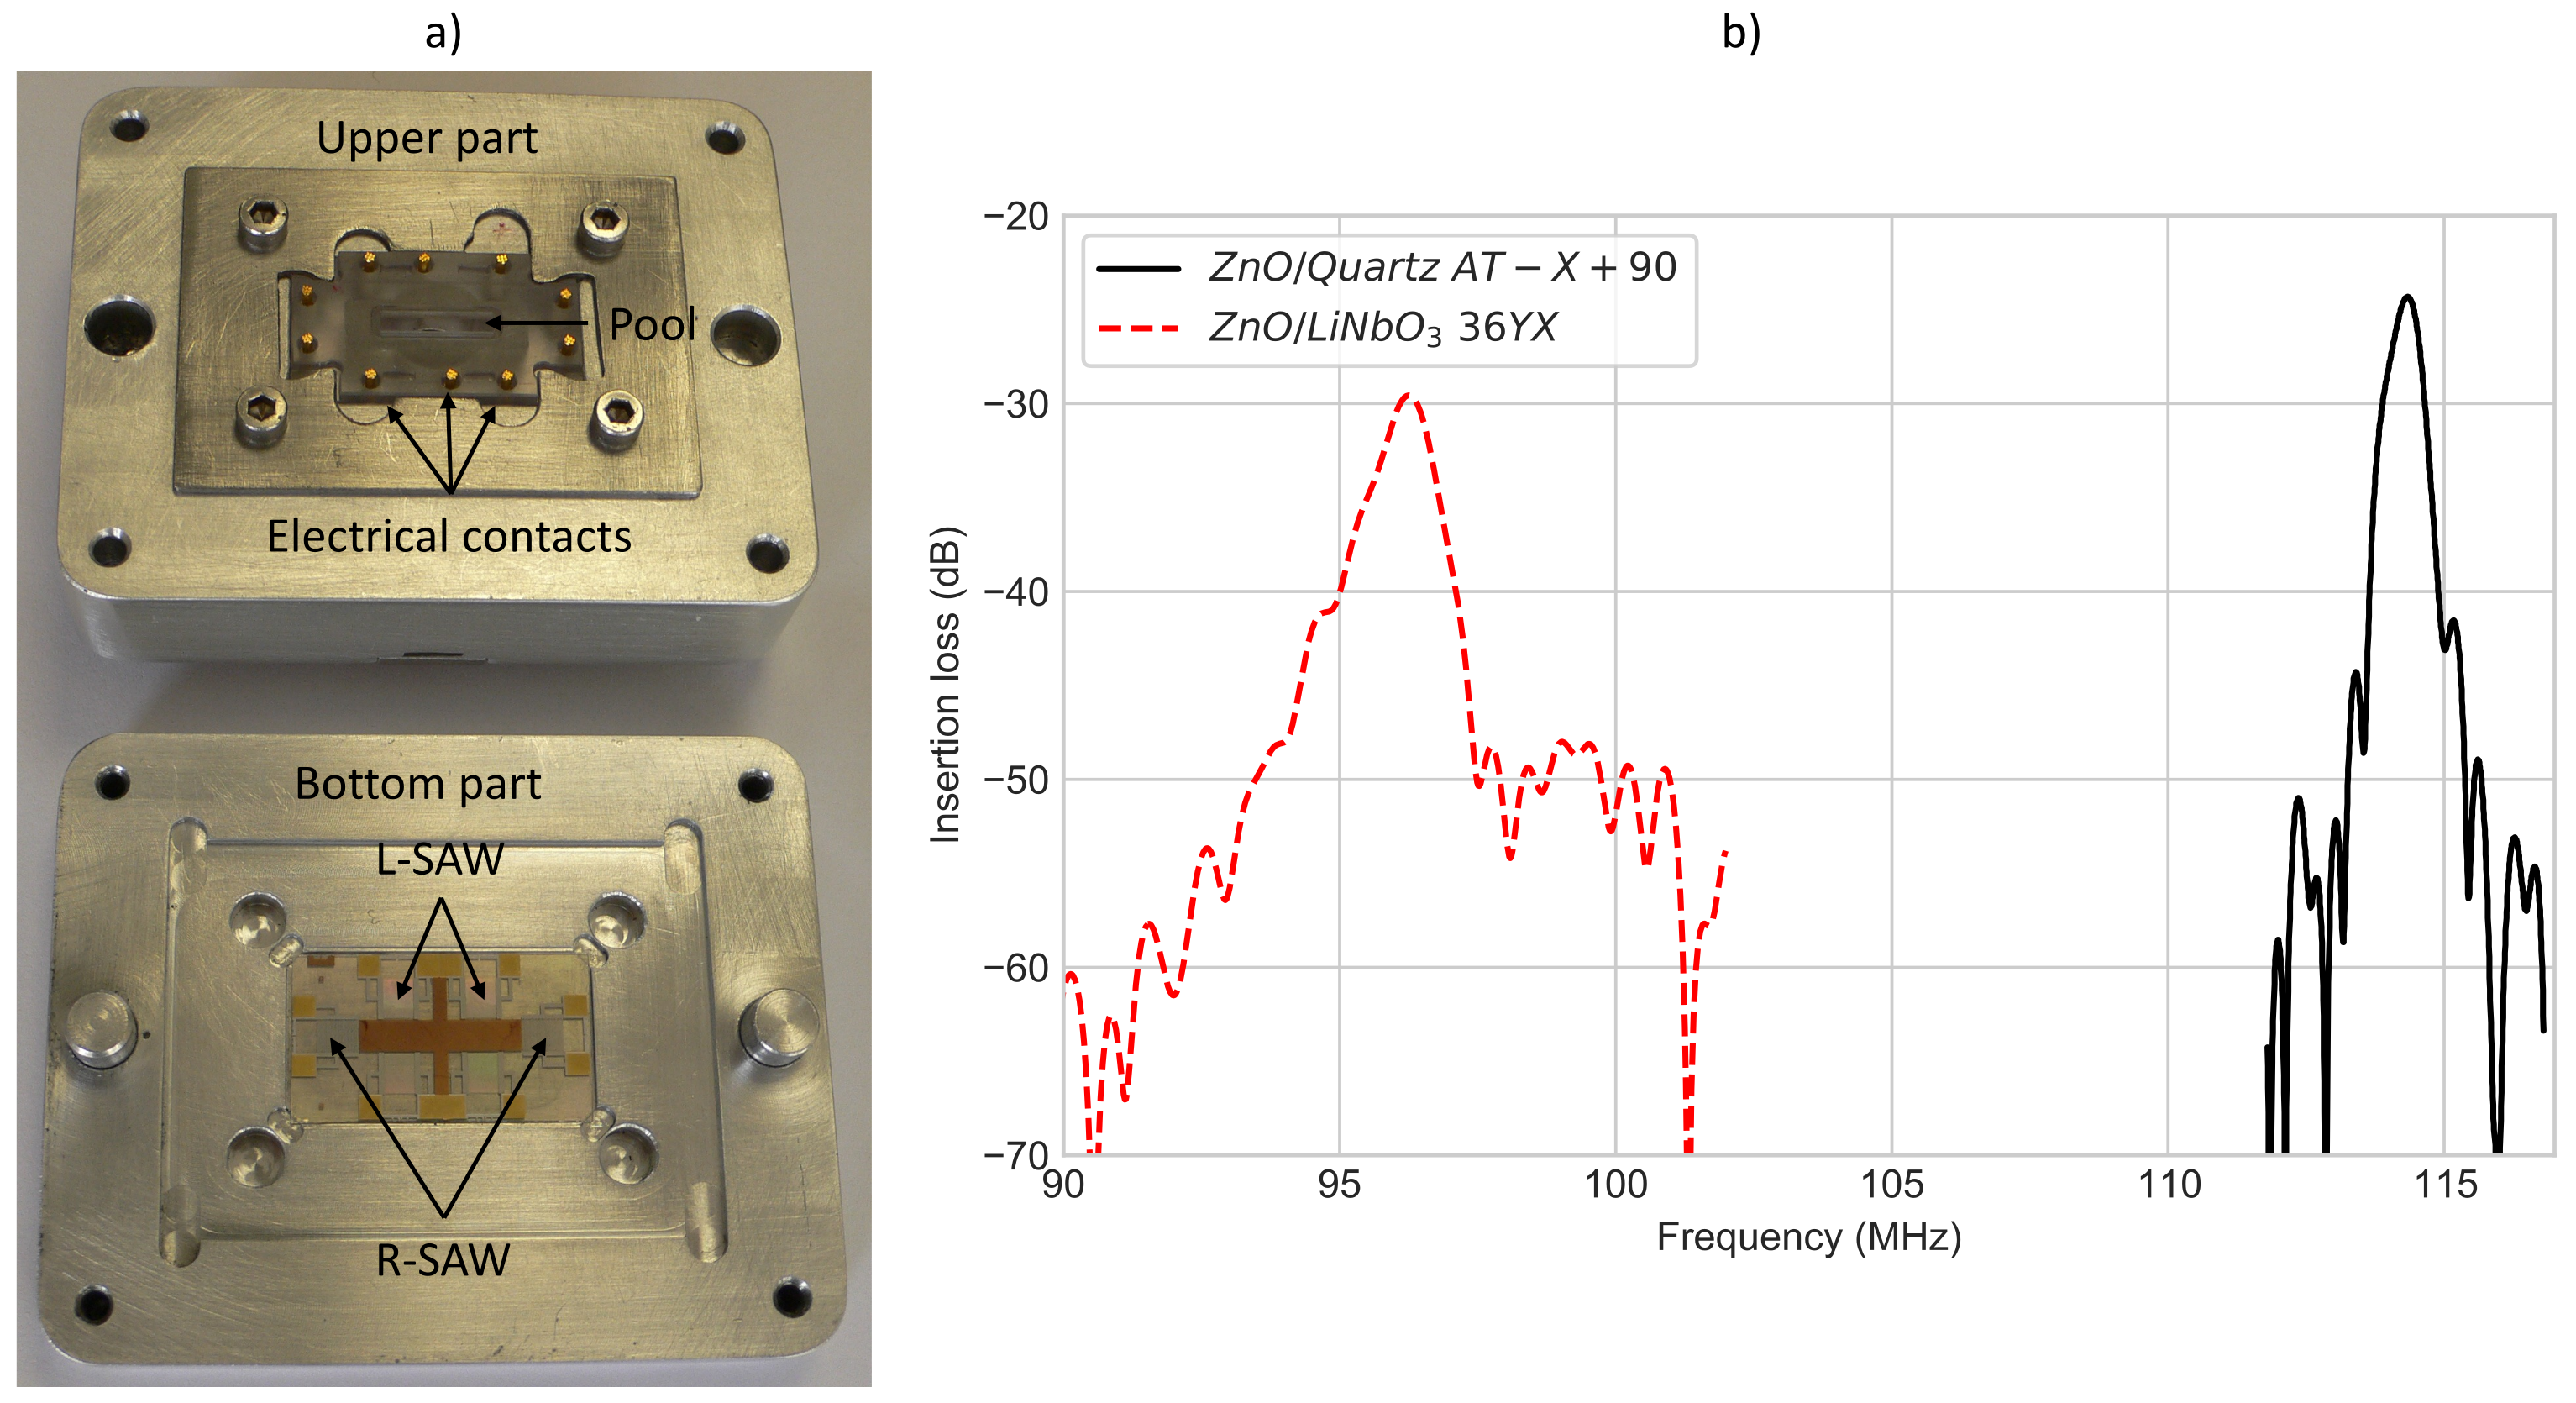
3.1. L-SAW Development

Two different structures were studied based on their temperature stability and their electromechanical coupling coefficient: Z n O / Q u a r t z A T X + 90 and Z n O / L i N b O 3 36 Y X , respectively.
Due to the relatively high velocity contrast between the ZnO guiding layer and the substrate, it is possible to generate waves with a better confinement near the surface. The P M M A guiding layer is also largely used because it has a low shear velocity of ≈1600 ms 1 . Nevertheless, PMMA is strongly attacked by acetone and lightly attacked by ethanol. Therefore, the sensor could not be cleaned with acetone nor ethanol. We could not use lift off for the deposition of the Au layer in the sensitive path as lift off requires acetone immersion. In addition, the PMMA guiding layer will generate high losses with such thickness. Furthermore, the ZnO film presents piezoelectric properties with a relatively high electromechanical coupling coefficient ( K 2 ) and a negative temperature coefficient of frequency (TCF) leading to a thermally compensated structure and a zero-power flow angle when combined with AT-cut quartz [22]. Lastly, we developed a deposition process to have a thick guiding layer with limited attenuation.
The SAW device characteristics are:
  • Q u a r t z A T and L i N b O 3 36 Y X substrates (1 mm thick)
  • Interdigital transducers (UV photolithography, 10 nm Ti + 100 nm Au, periodicity = 40 μ m), SPLIT fingers
  • ZnO GL (RF magnetron sputtering process, highly oriented c-axis, ≈2.8 μ m and ≈4.9 μ m thick, respectively)
  • Sensitive gold area on top of the GL (10 nm Ti + 50 nm Au).
  • Velocity: V Z n O / Q u a r t z A T X + 90 = 4364 ms 1 , V Z n O / L i N b O 3 36 Y X = 3932 ms 1 .
  • Operating frequency: f Z n O / Q u a r t z A T X + 90 = 114.33 MHz, f Z n O / L i N b O 3 36 Y X = 96.25 MHz.
Two different thicknesses of ZnO film were deposited by classical RF magnetron sputtering. Thicknesses up to 8 μ m of ZnO have been obtained [23]. The deposition process and the optimization of the deposition conditions for (002) textured ZnO film growth have been described elsewhere and applied for fabrication of our SAW sensors [24]. The deposition parameters are summarized in the Table 1.
Figure 3a represents the microfluidic cell with the SAW device. We observed on the bottom part of the microfluidic cell, two L-SAW dedicated to the sensing part and two Rayleigh surface acoustic wave (R-SAW) devices, which will be used to actuate the fluid (not used in this study). The SAW design is specific for the Z n O / Q u a r t z A T , where the X + 90 direction generates a Love wave, whereas the X direction is for the Rayleigh one. The Rayleigh wave generates an elliptical wave in the direction of propagation. The longitudinal component of the wave interacts with the liquid above by generating a compressional wave and thus a streaming in the liquid [25]. We also see the pool where the fluid is set (upper part) and the electrical contacts to make the measurement. The insertion loss of the transmission response (S21) for both structures Z n O / Q u a r t z A T X + 90 and Z n O / L i N b O 3 36 Y X (Figure 3b) under water were done in the microfluidic cell.

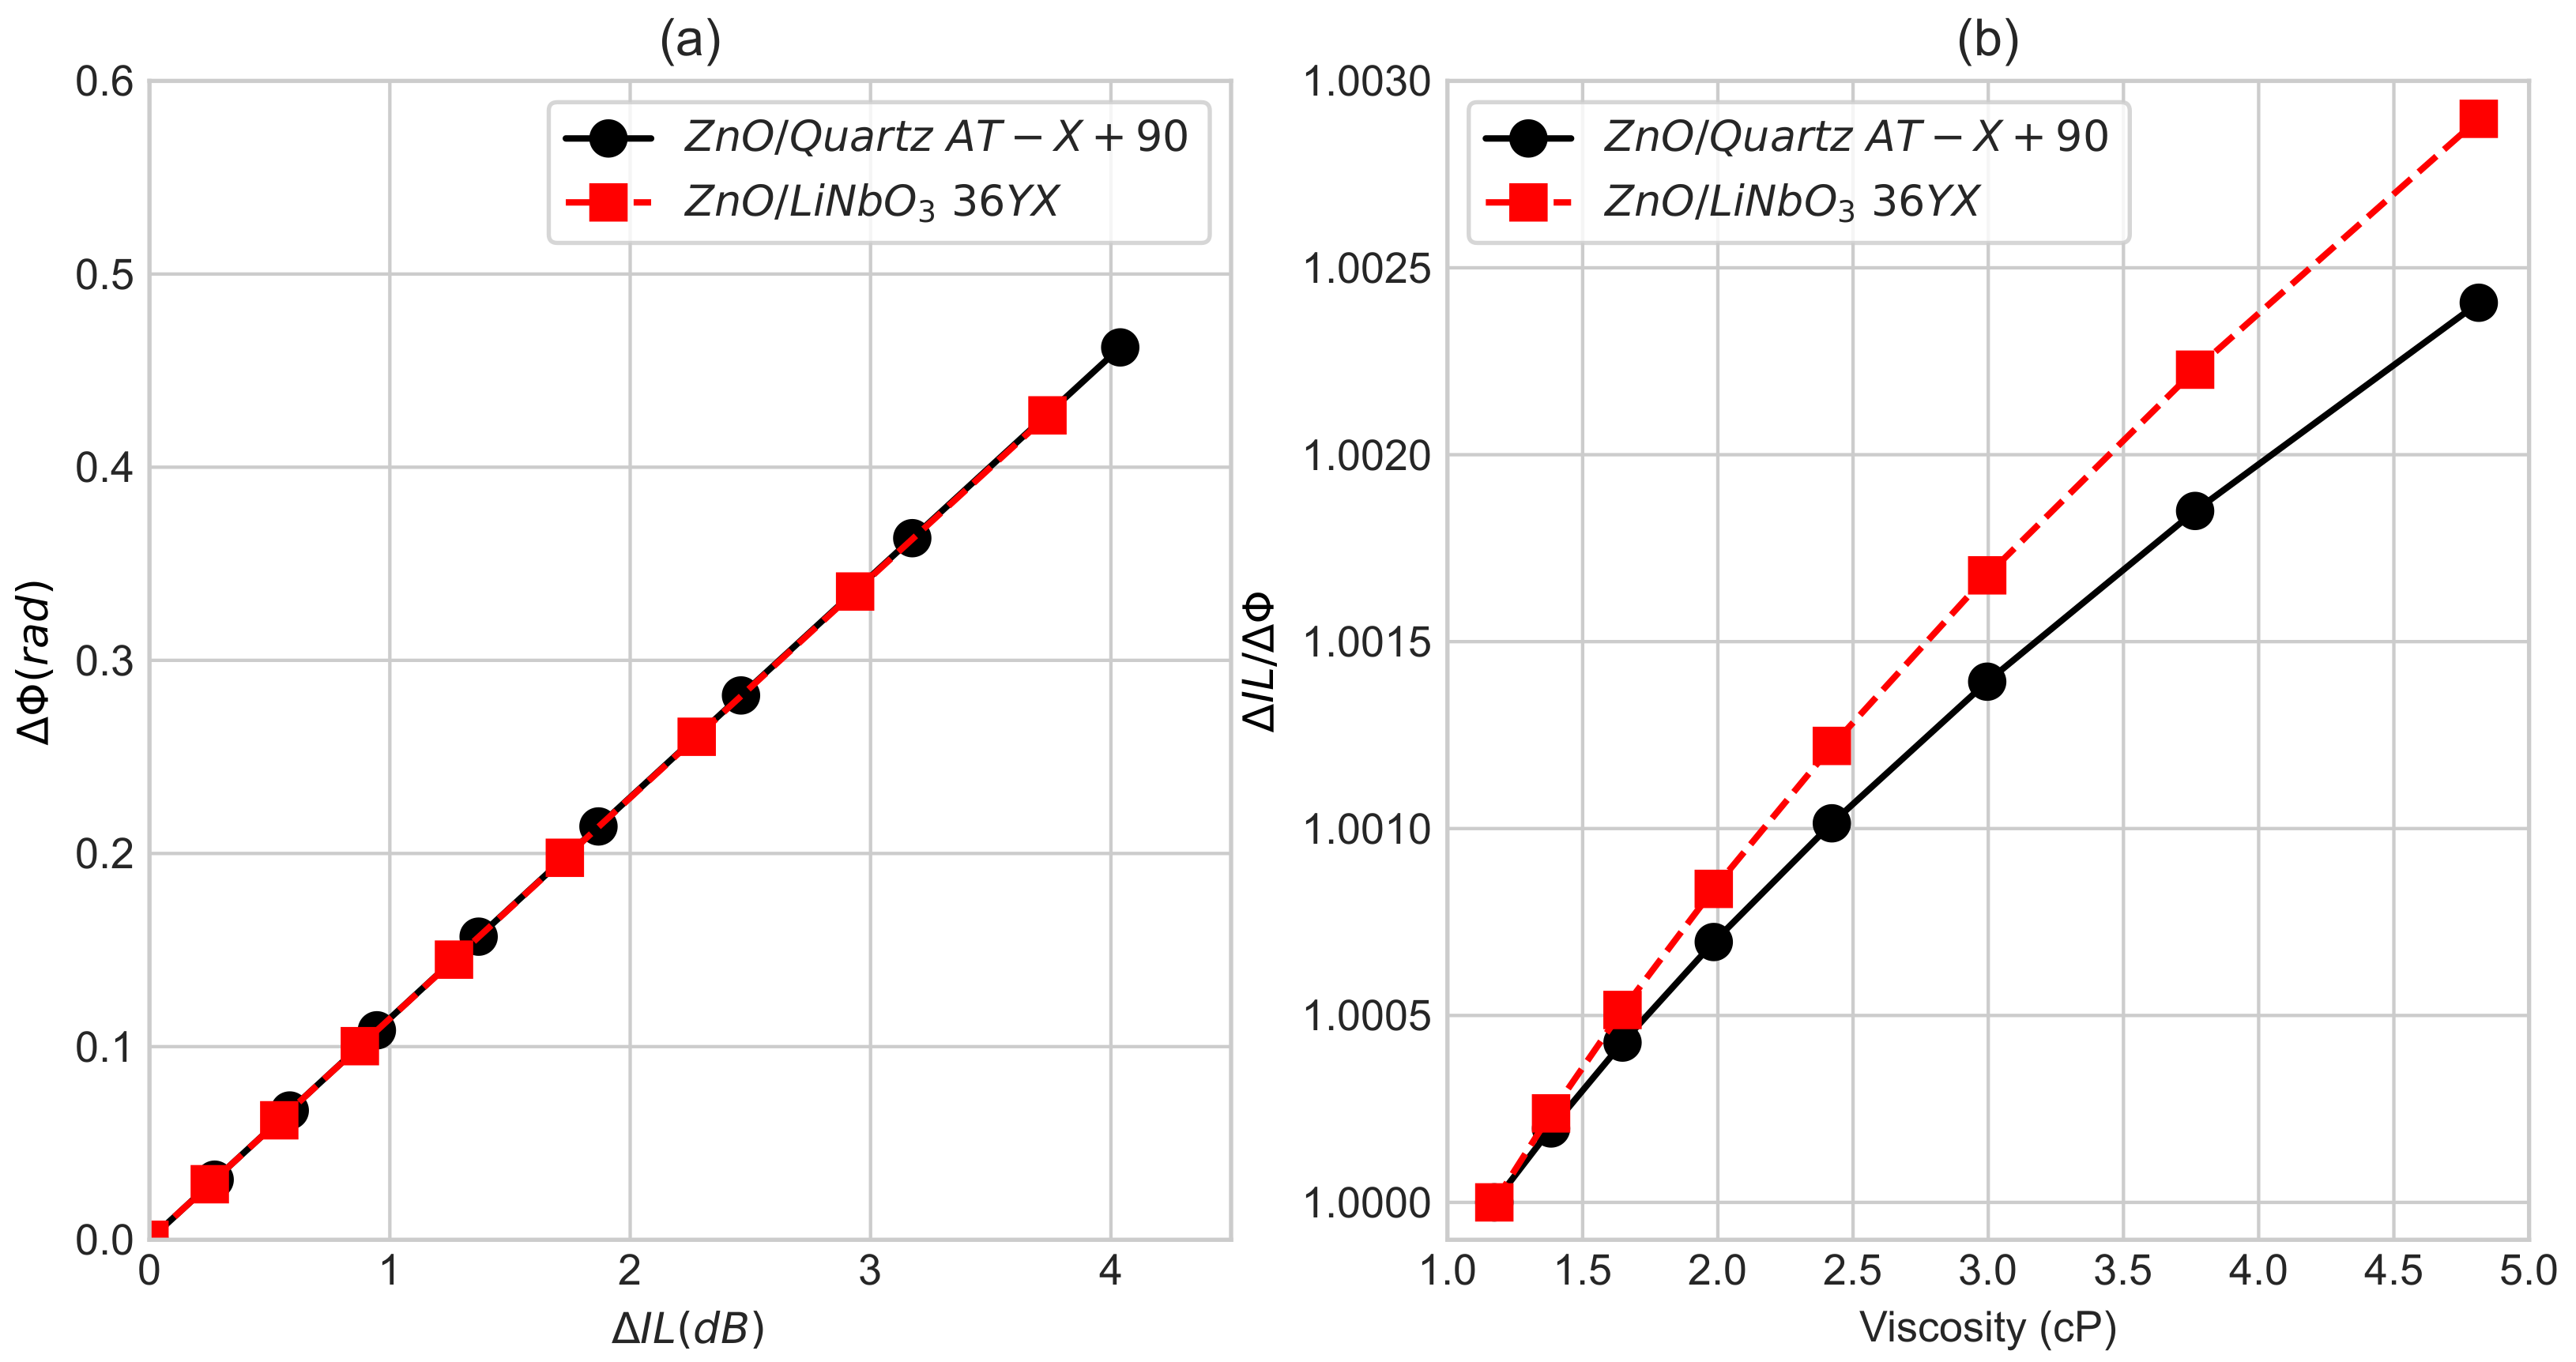
3.2. Biosensors Responses

According to the works of Wu et al. [26] and Furnis et al. [27], a cell monolayer cytoskeleton presented changes of viscosity in the range of 1 cP to 4 cP in experiments of adherent cells. The L-SAW biosensor is characterized with different aqueous glycerol solutions corresponding to (0–40% vol) of glycerol in water. Such a method is widely used and allows to calibrate the performance of SAW sensor setups [28,29,30]. In fact, the bio reactions will generate a change in fluid viscosity that should be simulated by such a mixture. Based on the theoretical approach proposed by Cheng [31], we were able to extract from the mixture above our range of viscosity (1 cP–4.25 cP). From Figure 4a, we may note that there is a linear relationship between the phase shift and the insertion losses for both structures. As it was explained by [32,33], the velocity and the attenuation of the complex wave propagation factor are proportional to the amplitude and the phase of the wave. It has been shown that both Δ I L and Δ Φ are proportional to the square root of the density ρ V L and the viscosity η V L of the liquid. This linear relationship stays linear until a critical viscosity for which the fluid behaviour changes from a Newtonian to a Maxwellian one. As it was shown by Saha et al. [34] by using the relaxation time τ = η V L / μ V L and the frequency, it is possible to know whether the film has a rigid or viscous behaviour. For Newtonian fluid, the shear stiffness ( μ V L ) effect is reduced compared to the viscous component ( ω η V L ). So, the predominant mechanism of energy dissipation is the acoustic losses.
To obtain the main features due to the contact of the biomolecule with the sensor, we will monitor the acoustic ratio. This parameter is the ratio of the amplitude shift versus the phase shift Δ I L / Δ P h a s e ( dB / rad ) [35,36,37]. Considering the value of this ratio, it is possible to determine if the interaction between the sensor and the sensitive layer is more viscous or rigid. Figure 4b shows the normalized acoustic ratio as a function of the viscosity for both structures. The normalization was made to limit the effects related to the manufacturing process (difference between thicknesses, wavelength, and…). We may note that the relative ratio for the Z n O / Q u a r t z A T X + 90 device increased from 1 to 1.67, whereas it decreased from 1 to 0.45 for the Z n O / L i N b O 3 36 Y X device. The variation was greater for the first structure (0.67), which was in good agreement with Figure 2b. These opposite behaviours should be attributed to the wave types generated by both crystal cuts. It is well known that the Z n O / Q u a r t z A T X + 90 structure will generate a pure Love wave, whereas the Z n O / L i N b O 3 36 Y X structure induces a Rayleigh wave and a Love wave simultaneously. So, the observed decrease in the acoustic ratio for the second one may be associated to R-SAW, which causes high attenuation, so high insertion losses in the liquid. The viscous effect was preponderant for the Z n O / Q u a r t z X A T + 90 , whereas it was the mass effect for the Z n O / L i N b O 3 36 Y X structure. Nevertheless, we may note that the response of both structures tends to a steady-state value as the viscosity became important.

4. Discussions

Based on the theoretical approach, we used our simulation in order to optimize the design of our Love-SAW devices. Moreover, as the loading liquid is considered to be Newtonian, it will generate perturbation on the wave. We would then determine from the phase-shift and the attenuation-shift measurements the fluid viscosity and density.
Figure 5a shows that there is a linear relation between Δ I L and Δ Φ for both structures. One may note that, as it was observed on Figure 4a, there is a linear relation between Δ Φ and Δ I L confirming the Newtonian behaviour of the fluid. Moreover, there is quite a good agreement between the experiment and the simulation as it is shown in Table 2.
So, the viscous loading gives rise to a surface perturbation that is directly connected to mechanical impedance. Both the amplitude and phase shifts should be characterized by the following equations:
Δ I L ( d B ) = S V i s c / I L · ρ V L η V L
Δ Φ ( r a d ) = S V i s c / Φ · ρ V L η V L
where S V i s c / I L and S V i s c / Φ are the sensitivity of the amplitude and the phase upon viscous loading, respectively. Such a relation remains linear until the liquid stays Newtonian.
Table 3 synthesises the different values. There was quite good agreement for the Z n O / Q u a r t z A T X + 90 amplitude sensitivity and for the Z n O / L i N b O 3 36 Y X phase sensitivity between the experimental and the simulated data. As discussed in the previous section, the Z n O / Q u a r t z A T X + 90 structure was more sensitive to the viscous effect, whereas the Z n O / L i N b O 3 36 Y X structure was more sensitive to the mass effect. This is in good agreement with the correspondence observed between simulation and experiment. As it was observed in Figure 2b, the sensitivity of the Z n O / Q u a r t z A T X + 90 device was slightly better than the other device. On the contrary, the Z n O / Q u a r t z A T X + 90 phase sensitivity was 25 % lower for the simulated data compared to the experimental one, and the Z n O / L i N b O 3 36 Y X amplitude sensitivity was 16 % higher for the simulated data compared to the experimental one. This should be attributed to a lack of precision in the developed simulation model.
Figure 5b presents the simulated acoustic ratio as it was presented in Figure 4b for the experimental data. For the Z n O / Q u a r t z A T X + 90 structure, the behaviour of both responses, experimental and simulated, have the same behaviour, but the values are far. We may note that the range of values is limited in the simulation ( 1 1.003 ) compared to the experiment ( 1 1.7 ). For both structures, the viscosity does not exceed the critical value [19] where there is a transition from the Newtonian to the Maxwellian region due to a modification from viscous to viscoelastic fluid, so the steady state value was not observed. For the Z n O / L i N b O 3 36 Y X structure, the simulated response was in complete disagreement with the experimental response.
These mistmatches on the acoustic ratio should be attributed to the assumptions made in the theoretical approach. First, the piezoelectricity was not introduced in our model. This assumption is valid for the Q u a r t z substrate ( K 2 = 1.4 % ) but not for the L i N b O 3 substrate ( K 2 = 16 % ). Moreover, for both devices, the Z n O layer adds its own piezoelectricity. Second, the Z n O / Q u a r t z A T X + 90 device presents a pure Love wave, which is not the case for the second device where part of the energy will generate a Ralyeigh wave. So, the equation taking into account such a propagation should be added to the model. These assumptions create errors on the determination of the insertion loss and the phase, both of which are involved in the acoustic ratio.

5. Conclusions

In this article, we presented two Love-SAW biosensors. The Z n O / Q u a r t z A T X + 90 and the Z n O / L i N b O 3 36 Y X structures have proven their sensitivity to viscous liquid. The observed responses show that the behaviour is in the Newtonian regime. The Z n O / Q u a r t z A T X + 90 structure is more sensitive to the viscosity, whereas the Z n O / L i N b O 3 36 Y X structure proved to be more sensitive to the mass effect. Considering the experimental responses, we showed that the Z n O / L i N b O 3 36 Y X device does not generate only a Love wave. From the simulation approach, the phase-shift versus the insertion-loss responses give a good approximation for both structures. Amplitude and phase sensitivities to viscosity were also in good agreement. For the acoustic ratio, the model is not efficient, and a complementary equation must be added.

Author Contributions

Conceptualization, P.A.S.C., J.B. and M.O.; methodology, O.E. and M.K.M.A.; software and simulation, P.A.S.C., J.B. and M.O.; microfluidic experimentation, F.S. and D.B.; writing—original draft preparation and revision, F.S.; supervision, F.S. and P.G.C. All authors have read and agreed to the published version of the manuscript.

Funding

The authors would like to thank CONACYT International scholarship, Grant 245669/440931, the CNES (Centre National d’Etudes Spatiales) and the PHC HIBISCUS (Partenariats Hubert Curien—projet N° 45730QK) for financial support.

Institutional Review Board Statement

Not applicable.

Informed Consent Statement

Not applicable.

Conflicts of Interest

The authors declare no conflict of interest.

References

  1. Biosensors Market. Available online: https://www.marketsandmarkets.com/Market-Reports/biosensors-market-798.html (accessed on 17 January 2022).
  2. El Kaffas, A.; Bekah, D.; Rui, M.; Kumaradas, J.C.; Kolios, M.C. Investigating Longitudinal Changes in the Mechanical Properties of MCF-7 Cells Exposed to Paclitaxol Using Particle Tracking Microrheology. Phys. Med. Biol. 2013, 58, 923–936. [Google Scholar] [CrossRef] [PubMed] [Green Version]
  3. Darling, E.M.; Zauscher, S.; Block, J.A.; Guilak, F. A Thin-Layer Model for Viscoelastic, Stress-Relaxation Testing of Cells Using Atomic Force Microscopy: Do Cell Properties Reflect Metastatic Potential? Biophys. J. 2007, 92, 1784–1791. [Google Scholar] [CrossRef] [Green Version]
  4. Rebelo, L.M.; de Sousa, J.S.; Mendes Filho, J.; Radmacher, M. Comparison of the Viscoelastic Properties of Cells from Different Kidney Cancer Phenotypes Measured with Atomic Force Microscopy. Nanotechnology 2013, 24, 055102. [Google Scholar] [CrossRef] [PubMed]
  5. Plaza, G.R.; Marí, N.; Gálvez, B.G.; Bernal, A.; Guinea, G.V.; Daza, R.; Pérez-Rigueiro, J.; Solanas, C.; Elices, M. Simple Measurement of the Apparent Viscosity of a Cell from Only One Picture: Application to Cardiac Stem Cells. Phys. Rev. E 2014, 90, 052715. [Google Scholar] [CrossRef] [PubMed]
  6. Wang, K.; Sun, X.H.; Zhang, Y.; Zhang, T.; Zheng, Y.; Wei, Y.C.; Zhao, P.; Chen, D.Y.; Wu, H.A.; Wang, W.H.; et al. Characterization of Cytoplasmic Viscosity of Hundreds of Single Tumour Cells Based on Micropipette Aspiration. R. Soc. Open Sci. 2019, 6, 181707. [Google Scholar] [CrossRef] [PubMed] [Green Version]
  7. Nikhil, B.; Pawan, J.; Nello, F.; Pedro, E. Introduction to Biosensors. Essays Biochem. 2016, 60, 1–8. [Google Scholar]
  8. Kuo, P.L.; Charng, C.C.; Wu, P.C.; Li, P.C. Shear-Wave Elasticity Measurements of Three-Dimensional Cell Cultures for Mechanobiology. J. Cell Sci. 2017, 130, 292–302. [Google Scholar] [CrossRef] [Green Version]
  9. Mitsakakis, K.; Tsortos, A.; Gizeli, E. Quantitative Determination of Protein Molecular Weight with an Acoustic Sensor; Significance of Specific versus Non-Specific Binding. Analyst 2014, 139, 3918–3925. [Google Scholar] [CrossRef]
  10. Hashimoto, K.Y. Surface Acoustic Wave Devices in Telecommunications; Springer: Berlin/Heidelberg, Germany, 2000. [Google Scholar]
  11. Aubert, T.; Sarry, F.; Elmazria, O.; Assouar, B.; Bouvot, L.; Nicolay, P. High Temperature Pt/LGS SAW Sensor: From Theory to Experiment. Sensors 2011, 2011, 1632–1635. [Google Scholar]
  12. Bonhomme, J.; Oudich, M.; Segura Chavez, P.A.; Bellaredj, M.L.F.; Bryche, J.F.; Beyssen, D.; Charette, P.G.; Sarry, F. Numerical Characterization of Love Waves Dispersion in Viscoelastic Guiding-Layer under Viscous Fluid. J. Appl. Phys. 2020, 128, 154502. [Google Scholar] [CrossRef]
  13. Gigodot, A. Stimulation Cellulaire de Monocytes THP-1 par Ondes Élastiques de Surface—Cytotoxicité et Transcriptomique; Technical Report; Université Technologique de Compiègne: Compiègne, France, 2021. [Google Scholar]
  14. McHale, G.; Newton, M.I.; Martin, F. Theoretical Mass, Liquid, and Polymer Sensitivity of Acoustic Wave Sensors with Viscoelastic Guiding Layers. J. Appl. Phys. 2003, 93, 675–690. [Google Scholar] [CrossRef]
  15. Kiełczynski, P.; Szalewski, M.; Balcerzak, A.; Wieja, K. Dispersion Curves of Love Waves in Elastic Waveguides Loaded with a Newtonian Liquid Layer of Finite Thickness. Arch. Acoust. 2020, 45, 19–27. [Google Scholar]
  16. Campbell, J.; Jones, W. A Method for Estimating Optimal Crystal Cuts and Propagation Directions for Excitation of Piezoelectric Surface Waves. IEEE Trans. Sonics Ultrason. 1968, 15, 209–217. [Google Scholar] [CrossRef]
  17. Sarry, F.; Segura Chavez, P.A.; Bonhomme, J.; Olive, L.; Beyssen, D.; Oudich, M.; Charette, P.G. Love wave biosensor to diagnose modification of cell viscoelasticy. Sensors 2011, 2019, 1–4. [Google Scholar]
  18. Weiss, M.; Welsch, W.; Schickfus, M.; Hunklinger, S. Viscoelastic Behavior of Antibody Films on a Shear Horizontal Acoustic Surface Wave Sensor. Anal. Chem. 1998, 70, 2881–2887. [Google Scholar] [CrossRef] [PubMed]
  19. Mitsakakis, K.; Tsortos, A.; Kondoh, J.; Gizeli, E. Parametric Study of SH-SAW Device Response to Various Types of Surface Perturbations. Sens. Actuator Chem. 2009, 138, 408–416. [Google Scholar] [CrossRef]
  20. Auld, B.A. Acoustic Fields and Waves in Solids; Wiley: New York, NY, USA, 1973. [Google Scholar]
  21. Moreira, F.; Sarry, F.; Nicolas-Debarnot, D.; Elmazria, O.; Poncin-Epaillard, F. PANI/ZnO/Quartz Structure for Love Wave Gas Sensor. Eur. Phys. J. Appl. Phys. 2009, 47, 12702. [Google Scholar] [CrossRef] [Green Version]
  22. Kadota, M. Surface Acoustic Wave Characteristics of a ZnO/Quartz Substrate Structure Having a Large Electromechanical Coupling Factor and a Small Temperature Coefficient. Jpn. J. Appl. Phys. 1997, 36, 3076. [Google Scholar] [CrossRef]
  23. Mengue, P.; Hage-Ali, S.; Zhgoon, S.; Paulmier, B.; Floer, C.; Bartoli, F.; Elmazria, O. Direct Integration of SAW Resonators on Industrial Metal for Structural Health Monitoring Applications. Smart Mater. Struct. 2021, 30, 125009. [Google Scholar] [CrossRef]
  24. Talbi, A.; Sarry, F.; Le Brizoual, L.; Elmazria, O.; Alnot, P. Sezawa Mode SAW Pressure Sensors Based on ZnO/Si Structure. IEEE Trans. Ultrason. Ferroelectr. Freq. Control. 2004, 51, 1421–1426. [Google Scholar] [CrossRef]
  25. Roux-Marchand, T.; Beyssen, D.; Sarry, F.; Elmazria, O. Temperature uniformity of microdroplet heated by Rayleigh Surface Acoustic Wave in view of biological reaction. In Proceedings of the 2013 IEEE International Ultrasonics Symposium (IUS), Prague, Czech Republic, 21–25 July 2013; pp. 1885–1888. [Google Scholar]
  26. Wu, H.; Xiong, X.; Zu, H.; Wang, J.H.C.; Wang, Q.M. Theoretical Analysis of a Love Wave Biosensor in Liquid with a Viscoelastic Wave Guiding Layer. J. Appl. Phys. 2017, 121, 054501. [Google Scholar] [CrossRef]
  27. Furniss, J.; Qin, L.; Ng, S.; Voiculescu, I.; Li, F. Love Mode Surface Acoustic Wave and Impedance Sensors for Water Toxicity Sensing. Environ. Prog. Sustain. Energy 2018, 37, 172–179. [Google Scholar] [CrossRef]
  28. Ricco, A.J.; Martin, S.J. Acoustic Wave Viscosity Sensor. Appl. Phys. Lett. 1987, 50, 1474–1476. [Google Scholar] [CrossRef]
  29. Nomura, T.; Saitoh, A.; Horikoshi, Y. Measurement of acoustic properties of liquid using liquid flow SH-SAW sensor system. Sens. Actuator Chem. 2001, 76, 69–73. [Google Scholar] [CrossRef]
  30. Goto, M.; Yatsuda, H.; Kondoh, J. Numerical Analysis of Viscosity Effect on Shear Horizontal Surface Acoustic Wave for Biosensor Application. IEEJ Trans. Sens. Micromach. 2016, 136, 1–5. [Google Scholar] [CrossRef]
  31. Cheng, N.S. Formula for the Viscosity of a Glycerol-Water Mixture. Ind. Eng. Chem. Res. 2008, 47, 3285–3288. [Google Scholar] [CrossRef]
  32. Jakoby, B.; Vellekoop, M.J. Viscosity Sensing Using a Love-Wave Device. Sens. Actuators Phys. 1998, 68, 275–281. [Google Scholar] [CrossRef]
  33. Mitsakakis, K.; Tserepi, A.; Gizeli, E. Integration of Microfluidics with a Love Wave Sensor for the Fabrication of a Multisample Analytical Microdevice. J. Microelectromech. Syst. 2008, 17, 1010–1019. [Google Scholar] [CrossRef]
  34. Saha, K.; Bender, F.; Rasmusson, A.; Gizeli, E. Probing the Viscoelasticity and Mass of a Surface-Bound Protein Layer with an Acoustic Waveguide Device. Langmuir 2003, 19, 1304–1311. [Google Scholar] [CrossRef]
  35. Francis, L.A.; Friedt, J.M.; Zhou, C.; Bertrand, P. In Situ Evaluation of Density, Viscosity, and Thickness of Adsorbed Soft Layers by Combined Surface Acoustic Wave and Surface Plasmon Resonance. Anal. Chem. 2006, 78, 4200–4209. [Google Scholar] [CrossRef] [Green Version]
  36. Saitakis, M.; Tsortos, A.; Gizeli, E. Probing the Interaction of a Membrane Receptor with a Surface-Attached Ligand Using Whole Cells on Acoustic Biosensors. Biosens. Bioelectron. 2010, 25, 1688–1693. [Google Scholar] [CrossRef] [PubMed]
  37. Tsortos, A.; Papadakis, G.; Mitsakakis, K.; Melzak, K.A.; Gizeli, E. Quantitative Determination of Size and Shape of Surface-Bound DNA Using an Acoustic Wave Sensor. Biophys. J. 2008, 94, 2706–2715. [Google Scholar] [CrossRef] [PubMed] [Green Version]
Figure 1. Scheme of the Love-wave structure with the 3 stacks [17].
Chemosensors 10 00081 g001
Figure 2. Theoretical calculated phase velocity (a) and mass sensitivity (b) for the first Love mode as a function of normalized guiding-layer thickness.
Chemosensors 10 00081 g002
Figure 3. Microfluidic cell and Z n O / Q u a r t z A T X + 90 structure (a); insertion loss of the transmission response (S21) observed with fluid (water) interaction for both L-SAW devices (b).
Chemosensors 10 00081 g003
Figure 4. Experimental phase shift vs. insertion loss for different fluid viscosity (a) and relative acoustic ratio as a function of the viscosity (b) for both structures.
Chemosensors 10 00081 g004
Figure 5. Theoretical phase shift vs. insertion loss for different fluid viscosity [ 0.9 c P 4.2 c P ] (a) and relative acoustic ratio as a function of the viscosity (b) for both structures.
Chemosensors 10 00081 g005
Table 1. Summary of ZnO sputtering parameters, adapt from [23].
TargetZnO ( 4 inch)
Gases8 sccm O 2
8 sccm A r
Temperature170 C
Target power150 W R F
Total pressure 3 × 10 3 mbar
Table 2. Linear-regression results for both Z n O / Q u a r t z A T X + 90 and Z n O / L i N b O 3 36 Y X structures obtained on experimental and simulated data.
ZnO / Quartz AT X + 90 ZnO / LiNbO 3 36 YX
Experimental Δ Φ = 0.15 · Δ I L + 0.02 , R 2 = 0.99 Δ Φ = 0.15 · Δ I L 0.01 , R 2 = 0.99
Simulation Δ Φ = 0.12 · Δ I L + 0.001 , R 2 = 0.99 Δ Φ = 0.12 · Δ I L + 0.001 , R 2 = 0.99
Table 3. Amplitude and phase sensitivities for both Z n O / Q u a r t z A T X + 90 and Z n O / L i N b O 3 36 Y X structures obtained on experimental and simulated data.
ZnO / Quartz AT X + 90 ZnO / LiNbO 3 36 YX
Experimental ( S V i s c / I L ; S V i s c / Φ )(3.11; 0.47)(2.41; 0.35)
Simulation ( S V i s c / I L ; S V i s c / Φ )(3.09; 0.35)(2.86; 0.32)
Publisher’s Note: MDPI stays neutral with regard to jurisdictional claims in published maps and institutional affiliations.

