Article

Nitrogen-Doped Graphene-Based Sensor for Electrochemical Detection of Piroxicam, a NSAID Drug for COVID-19 Patients

National Institute for Research and Development of Isotopic and Molecular Technologies, Donat Street, 67-103, 400293 Cluj-Napoca, Romania
*
Authors to whom correspondence should be addressed.
Chemosensors 2022, 10(2), 47; https://doi.org/10.3390/chemosensors10020047
Submission received: 21 December 2021 / Revised: 21 January 2022 / Accepted: 25 January 2022 / Published: 27 January 2022
(This article belongs to the Special Issue Nanotechnology-Based Bio(sensors): In COVID-19 Outbreak)

Abstract

:
Nitrogen-doped graphene (NGr) was synthesized by the hydrothermal method using urea as a reducing and doping agent for graphene oxide (GO). The crystalline structure of GO was revealed by the XRD intense peak recorded at 2θ = 11.4°, indicating that the interlayer distance within the structure was large (d = 0.77 nm), and the number of layers (n) was 9. Further, the transformation of GO in NGr also led to the decrease in the interlayer distance and number of layers (d = 0.387 nm; n = 3). As indicated by elemental analysis, the concentration of nitrogen in the NGr sample was 6 wt%. Next, the comparison between the performance of bare GC and the graphene-modified electrode (NGr/GC) towards piroxicam (PIR) detection was studied. Significant differences were observed between the two electrodes. Hence, in the case of bare GC, the oxidation signal of PIR was very broad and appeared at a high potential (+0.7 V). In contrast, the signal recorded with the NGr/GC electrode was significantly higher (four times) and shifted towards lower potentials (+0.54 V), proving the electro-catalytic effect of nitrogen-doped graphene. The NGr/GC electrode was also tested for its ability to detect piroxicam in pharmaceutical drugs (Flamexin), giving excellent recoveries.

1. Introduction

Piroxicam or 4-hydroxy-2-methyl-3-(pyrid-2-yl-carbamoyl)-2H-1,2-benzothiazine 1,1-dioxide and piroxicam-β-cyclodextrin (piroxicam betadex) are oxicam derivative NSAIDs usually used as effective analgesic and anti-inflammatory agents in rheumatoid arthritis, osteoarthritis, ankylosing spondylitis, acute pain in musculoskeletal disorders and acute gout [1]. They have been shown to be effective analgesic agents in fracture, dental, postoperative and postpartum pain.
Mostafa et al. [2] published a paper about Food and Drug Administration (FDA)-approved drugs, commonly prescribed to relieve respiratory symptoms, against SARS-CoV-2, the viral causative agent of the COVID-19 pandemic. The conclusion was that piroxicam should be prescribed in combination with azithromycin for COVID-19 patients.
Vineet [3] described the role of piroxicam in controlling fever in COVID-19. This anti-inflammatory drug is capable of controlling cytokine storm and rapidly improves oxygen saturation in over 90% of patients, and the effect of a single tablet lasts for over 24 h [4,5]. It does not have unwanted cardiovascular or central nervous effects.
Health complications such as gastrointestinal, liver and kidney damage appear as a result of improper use [6]. Piroxicam and its biotransformation products are excreted in urine and feces. This drug can be found in aquatic environments as residues. Based on this, the development of selective and simple analytical methods for piroxicam determination is important to help in preventing undesirable effects in the environment and on human health. Piroxicam has been determined in tablets, plasma, saliva or urine samples, rivers as residues originating from production processes and human biological fluids using spectral [7], crystal [8], titrimetric [9], spectrophotometric [10,11,12], spectrofluorometric [13], chemiluminescence [14] and electrophoresis [15] techniques, as well as chromatographic methods, such as thin-layer chromatography [16,17], high-performance liquid chromatography [18], liquid chromatography/mass spectrometry [19] and gas chromatography/mass spectrometry [1].
Electrochemical techniques are less time consuming, fast and inexpensive to determine piroxicam in various matrices. Electrochemical monitoring of piroxicam is based on its electro-oxidation on simple glassy carbon electrodes [20] or electrodes modified with nanoparticles, such as multiwalled carbon nanotubes [21], carbon nanoparticles [22], boehmite nanoparticles [23], ZnO-Pd/CNT nanocomposites [24], Pt doped NiO nanoparticles/MWCNT nanocomposites [25], copper nanoparticles [26] or mediators that improve the sensibility and selectivity for this analyte (PEDOT/PSS) [27], such as molecular-imprinted polymers [28] and graphene oxide [29,30].
In recent years, due to its unique electronic structure and stable chemical properties, heteroatom-doped graphene has triggered much interest in potential applications in electroanalysis [31]. Among other heteroatoms inserted into graphene, nitrogen doping arises due to the close atomic radius between nitrogen and carbon. Nitrogen doping introduces a substantial number of defects into the graphene structure, providing more reactive sites on its surface, which influences its electrochemical properties [32,33].
In the present work, a nitrogen-doped graphene-modified glassy carbon electrode NGr/GC was developed for the investigation of the electrochemical behavior of piroxicam in pharmaceutical samples. A considerable enhancement in the response of piroxicam on the surface of the modified electrode was described compared with the unmodified electrode.

2. Materials and Methods

2.1. Chemicals

Sulfuric acid (H2SO4) was purchased from AdraChim SRL (Bucharest, Romania). Potassium persulfate (K2S2O8), sodium nitrate (NaNO3), potassium permanganate (K2MnO4) and hydrogen peroxide (H2O2) were acquired from Fluka (Kandel, Germany). Phosphorus pentoxide (P2O5) was acquired from Sigma-Aldrich (Darmstadt, Germany).
For the preparation of sodium acetate buffers, we employed sodium acetate (CH3COONa) (Reactivul București, Romania) and acetic acid (CH3COOH) (Chemical Company, Romania), while for phosphate buffer solutions, we employed sodium phosphate monobasic (NaH2PO4) and sodium phosphate dibasic (Na2HPO4·12H2O), both from VWR-Chemicals, Belgium.
Potassium ferrocyanide (K4[Fe(CN)6]) (Sigma-Aldrich, Sternheim, Germany), potassium chloride (KCl) (Sigma-Aldrich, Sternheim, Germany), piroxicam (C15H13N3O4S) (Sigma-Aldrich, Sternheim, Germany) and dimethylformamide (HCON(CH3)2) (DMF; JTBaker, HPLC grade, Sternheim, Germany) were used without further purification. Double-distilled water produced with FistreemCyclon equipment was employed to prepare all electrolyte solutions.

2.2. Materials

Graphene oxide (GO) was prepared from synthetic graphite powder (Sigma-Aldrich, <20 μm), using a pre-oxidation step in a modified Hummers’ method, as previously presented [34]. In brief, for the pre-oxidation step, graphite (9.2 g) was added to a warm solution (80 °C) of concentrated H2SO4 (16 mL), K2S2O8 (5 g) and P2O5 (5 g). The mixture was next heated to 100 °C and left to cool for 5 h. Then, 300 mL of H2O was added to dilute the mixture. The suspension was filtered, washed until neutral pH was achieved and dried at ambient temperature. Next, to a suspension of pre-oxidized graphite powder (5 g) and NaNO3 (2.26 g) in H2SO4 (86 mL) cooled in an ice-water bath, 11.4 g of KMnO4 was added. The temperature was kept below 5 °C. The next day, the mixture was heated to 35 °C and kept for 1 h and 45 min at this temperature. The suspension was diluted with 150 mL of H2O, and the temperature was raised to 100 °C. After 2 h, 100 mL of H2O was added. The reaction was stopped with H2O2 (30%) until gas development was no longer observed. The mixture was filtered and washed with diluted HCl solution (1%; 250 mL). The obtained product was suspended in bi-distilled water and dialyzed for 5 days. After that, the sample was exfoliated by ultrasound (1 h). The final material was obtained by lyophilization.
The NGr sample was synthesized by the hydrothermal method using urea as a reducing and doping agent for GO, as reported earlier [35] (Figure 1). Briefly, 2 g of urea was added to 150 mL aqueous dispersion of GO, previously treated by ultrasound for 30 min. The mixture was further sonicated for 10 min, then transferred into an autoclave and placed in the oven at 160 °C for 8 h. The black product formed after reaction was washed with distilled water and dried by lyophilization.
Thermally reduced graphene oxide (TRGO) was prepared and investigated in detail (X-ray diffraction (XRD), transmission electron microscopy (TEM), Fourier transform infrared (FTIR) spectroscopy, UV–Vis spectroscopy, thermogravimetric analysis (TGA), Raman and X-ray photoelectron spectroscopy (XPS)), as previously described [36]. Briefly, 200 mg of GO was placed in a quartz boat, and then placed in a temperature-controlled oven. GO was reduced by keeping it at 300 °C for 5 min. The heating rate was 10 °C/min. Argon gas was flown into the oven during the entire reduction process (flow rate of 0.1 L/min).
The modified electrodes (NGr/GC; TRGO/GC) were fabricated by drop-casting on the GC surface 10 µL of graphene, previously dispersed in DMF (2 mg/mL). The modified electrodes were kept at room temperature for 24 h, and after that, they were used in electrochemical studies.

2.3. Instruments

The morphological and structural characterization of the sample was performed using scanning transmission electron microscopy (STEM) with energy-dispersive spectroscopy (EDS) (SU-8230 STEM system, Hitachi, Japan), X-ray powder diffraction (Bruker D8 Advance Diffractometer, Germany), elemental analysis (with a FLASH EA 1112 elemental analyzer (Parma, Italy)), UV–vis spectroscopy (with a Specord 250 PLUS spectrophotometer (Analytik Jena, Germany) and Fourier transform infrared spectroscopy (with a Bruker Tensor II spectrometer (Karlsruhe, Germany)).
Linear sweep voltammetry (LSV) measurements were recorded with an Autolab PGSTAT-302N (MetrohmAutolab B.V., Utrecht, The Netherlands) potentiostat/galvanostat instrument. Measurements were generally conducted in a three-electrode cell containing the working electrode (either glassy carbon (GC) or GC electrode modified with the graphene samples (NGr/GC; TRGO/GC)); a large-area platinum foil (2 cm2), which served as the counter electrode, and an Ag/AgCl electrode (3 M KCl) used as the reference electrode.

3. Results

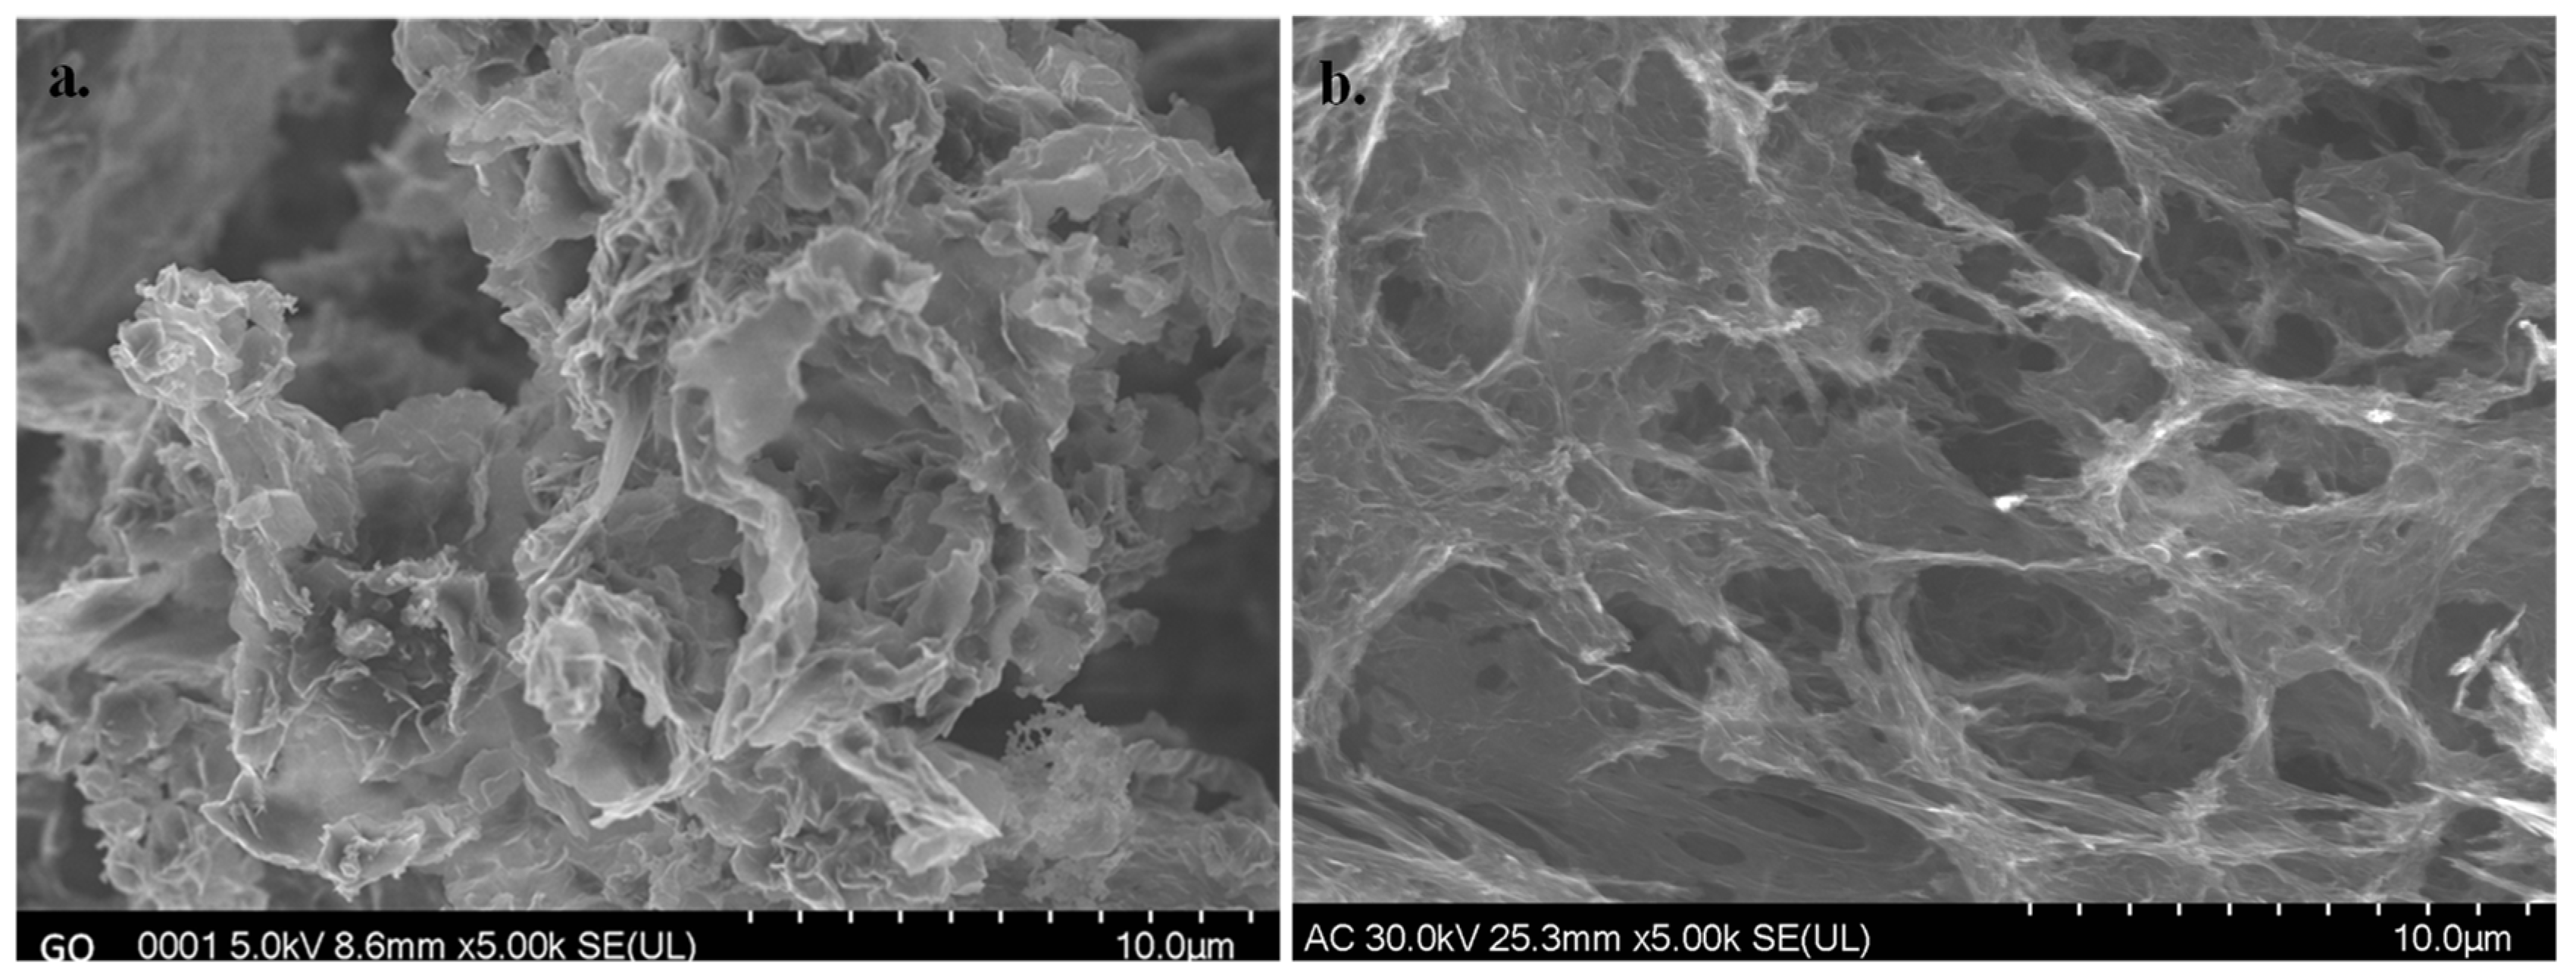
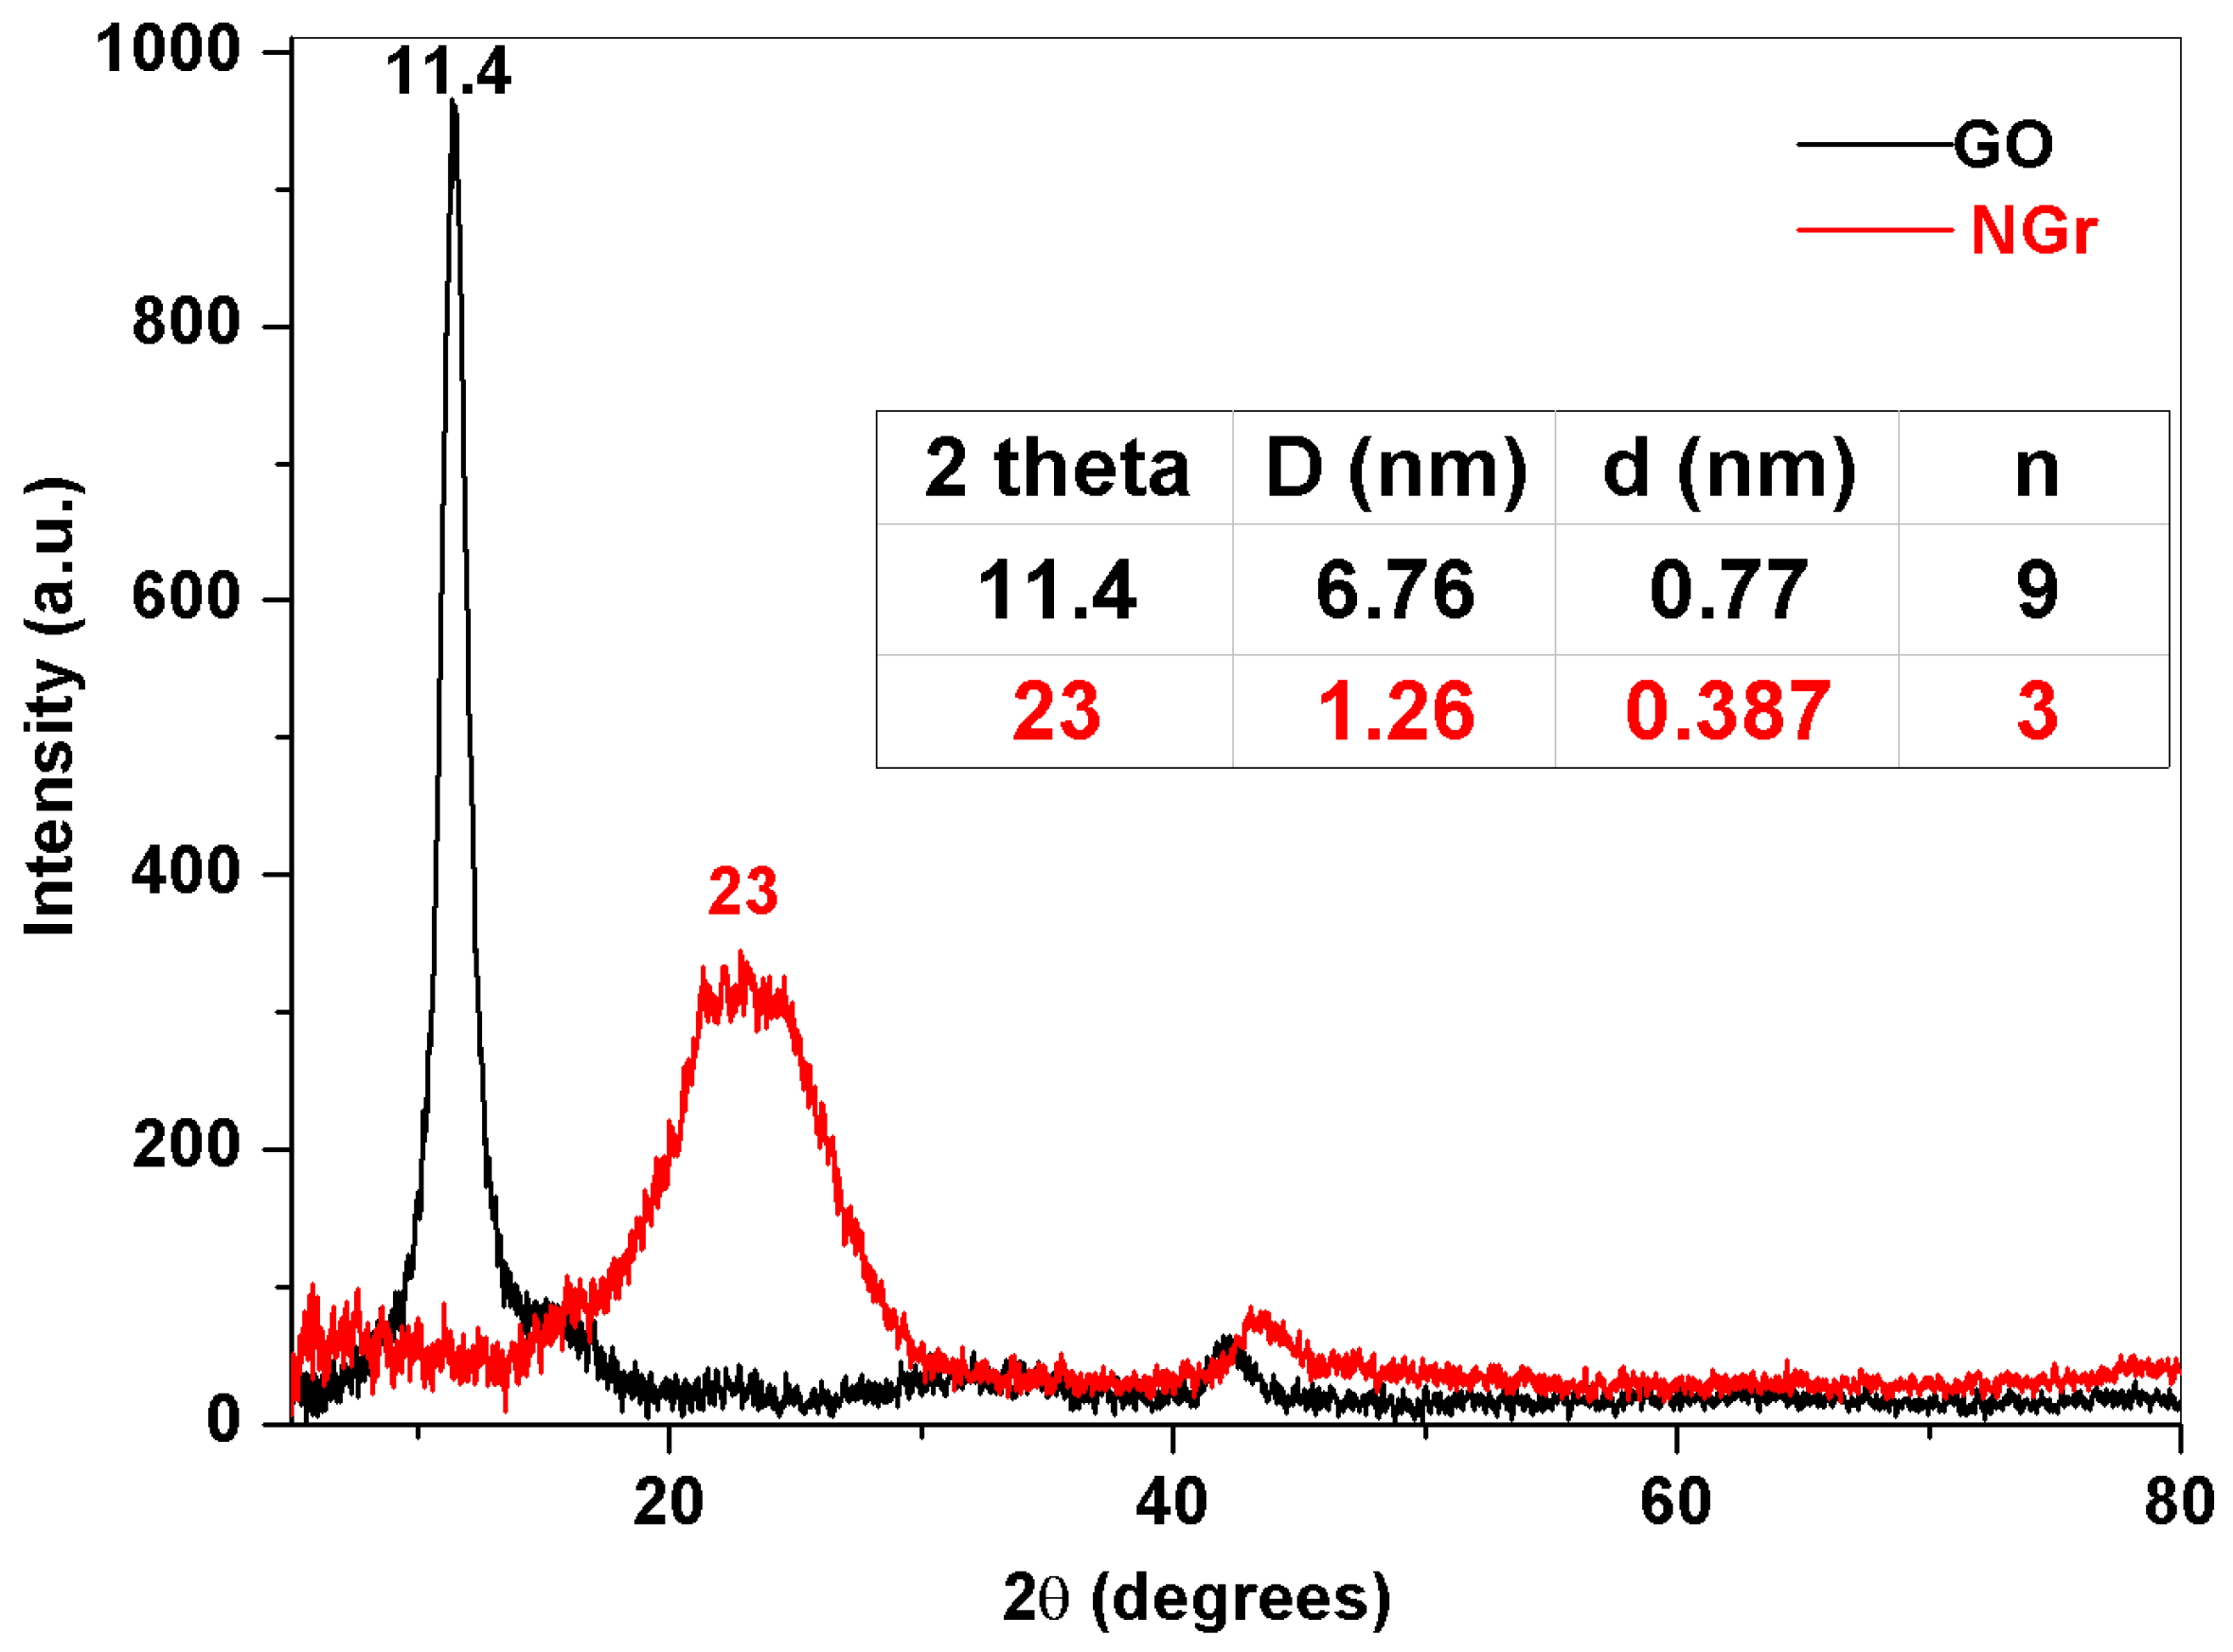
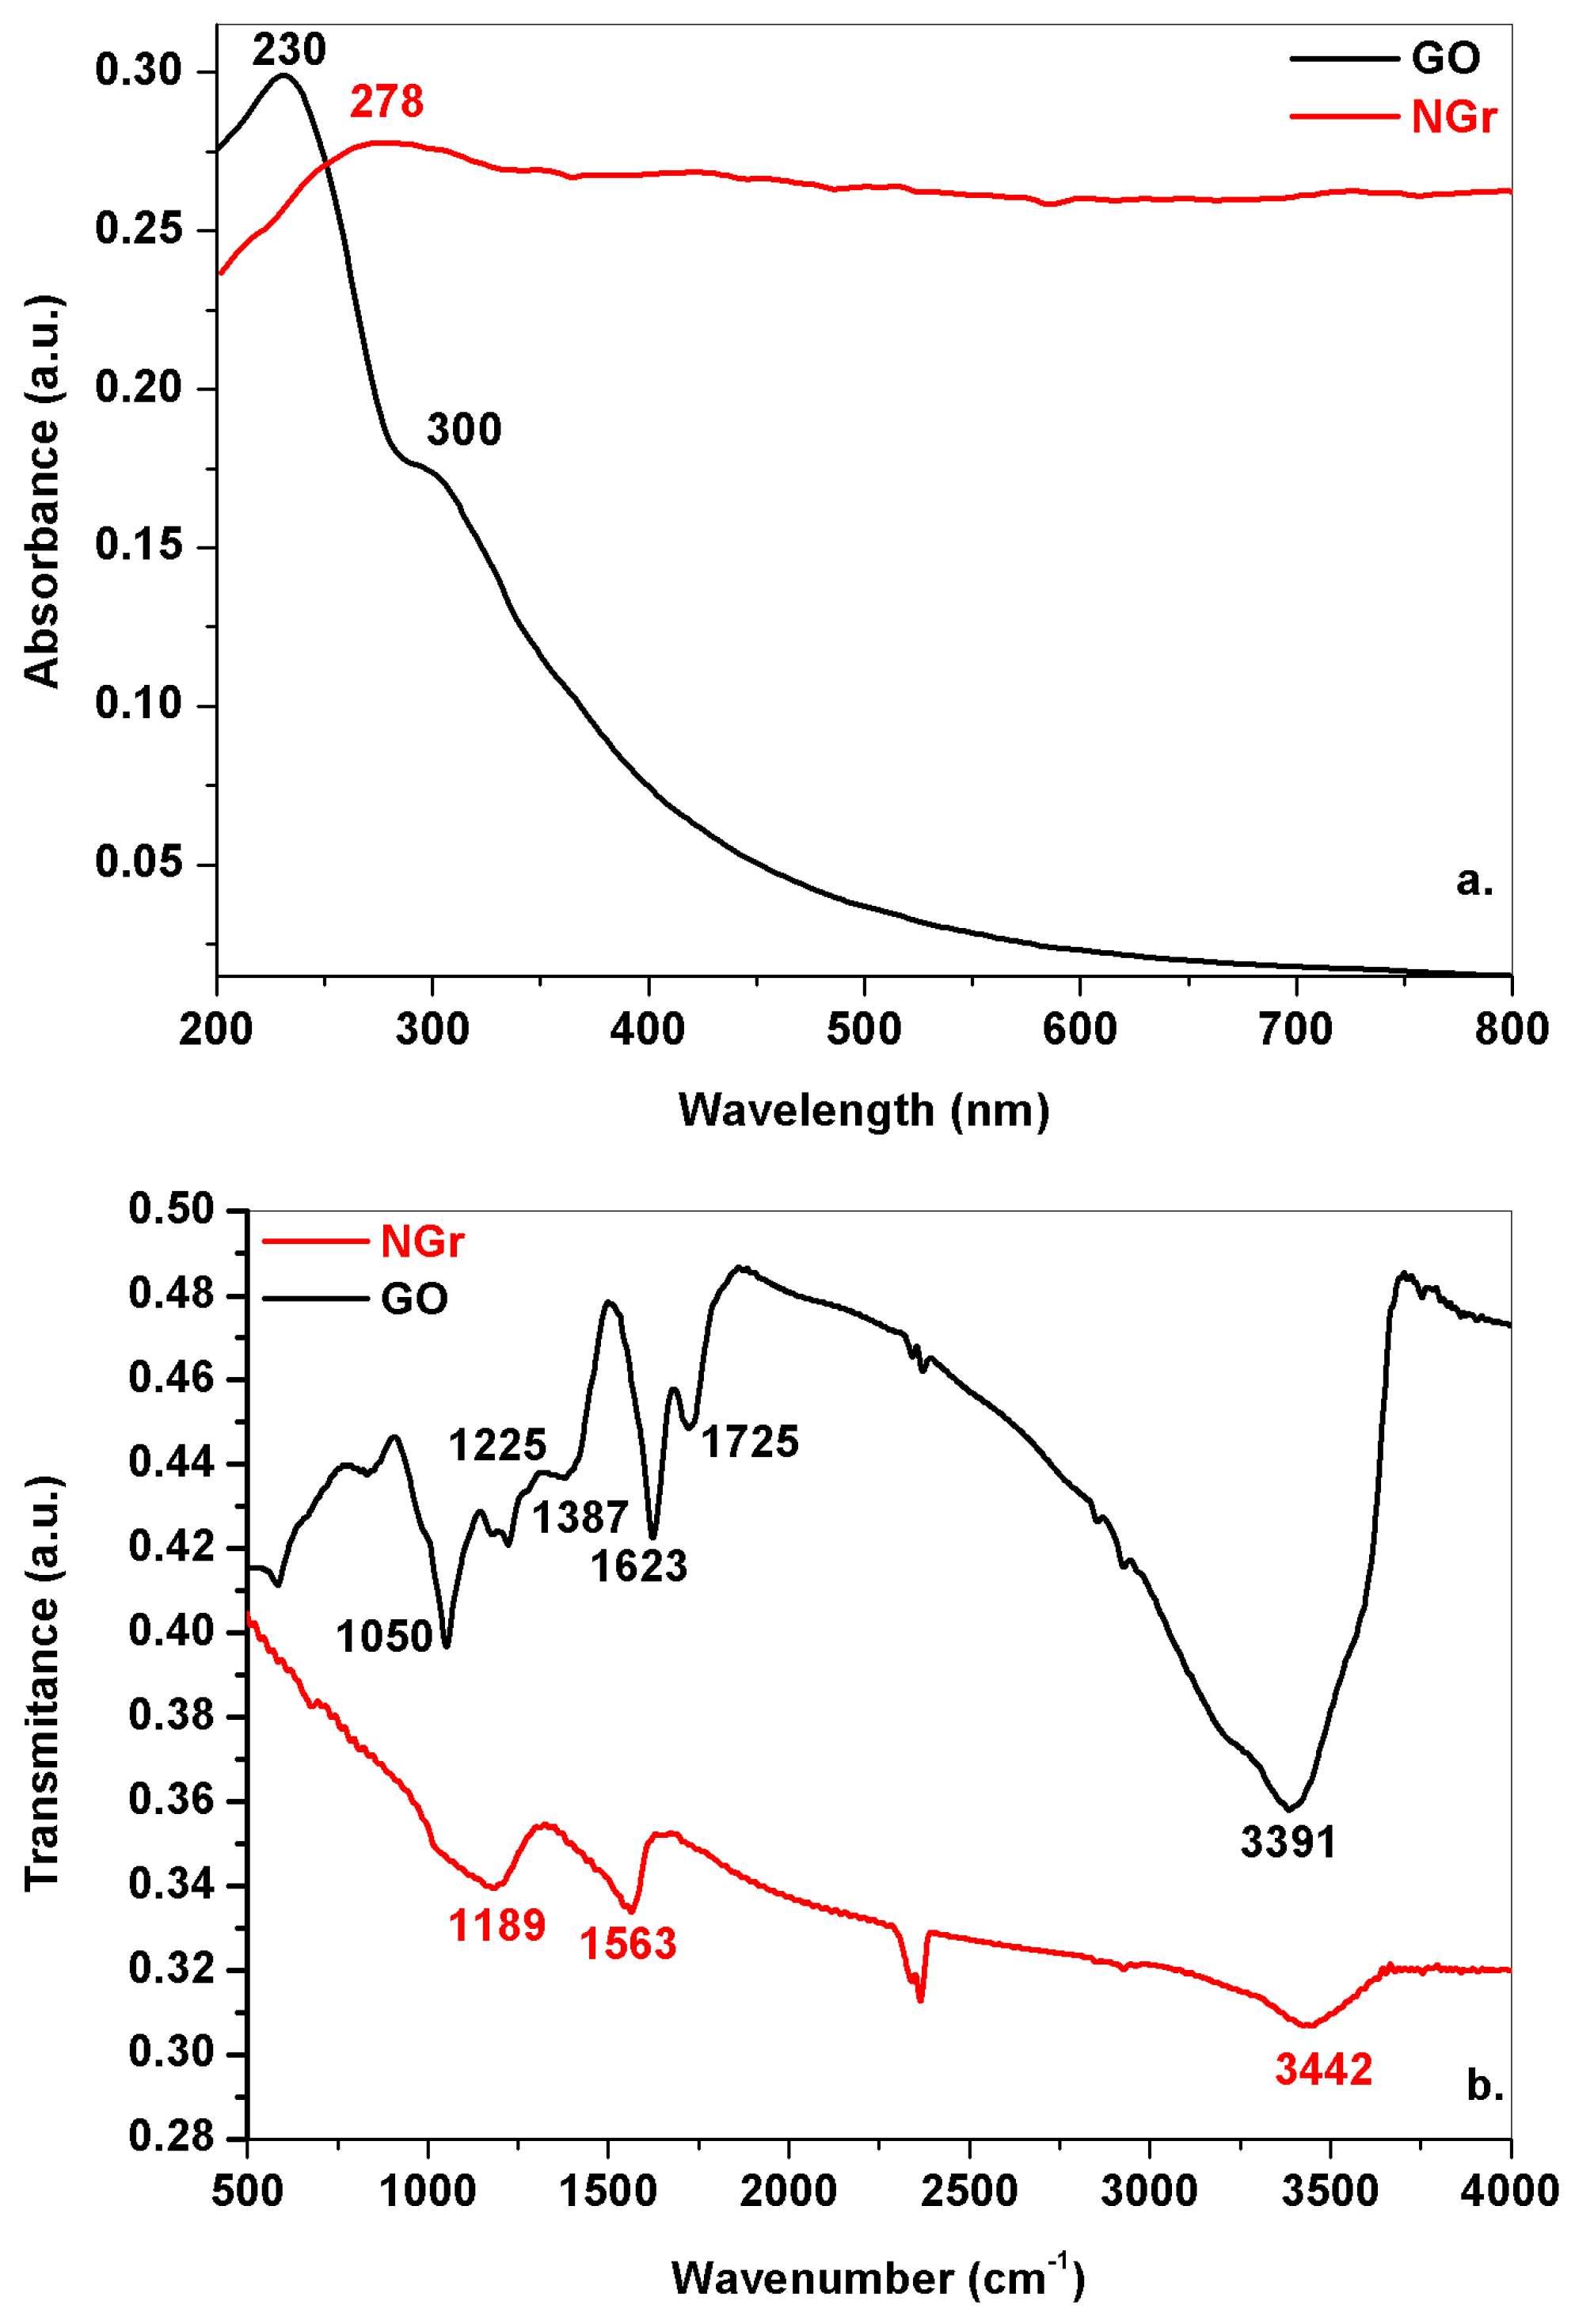
3.1. Morphological and Structural Characterization of GO and NGr Samples

The morphology of GO and nitrogen-doped graphene samples was investigated by SEM (Figure 2). The scanning electron microscopy micrographs of graphene oxide (Figure 2a) reveal thin and crumpled layers, randomly aggregated. In contrast, the N-doped graphene material (Figure 2b) exhibits a smoother surface due to the removal of oxygen-containing groups, as well as many cavities or holes, which were formed during the doping process [37].
The doping of graphene with nitrogen was further proved by scanning electron microscopy with energy-dispersive X-ray analysis, SEM/EDX (Figure 3). The mapping images show uniform coverage of the carbon material with nitrogen atoms.
The elemental composition of graphene oxide and nitrogen-doped graphene was further investigated by elemental analysis. The results proved the presence of nitrogen atoms in the NGr sample, and the chemical composition (wt%) for both GO and NGr is presented in Table 1. It can be observed that the reduction in GO with urea was accompanied by an increase in the carbon content and a strong decrease in oxygen. Approximately 6 wt% of nitrogen appeared in the nitrogen-doped graphene sample.
The products formed at each stage, i.e., GO and NGr, were also monitored by XRD (Figure 4). The crystalline structure of GO was revealed by the intense peak recorded at 2θ = 11.4°, indicating that the interlayer distance (d) within the structure is very large (d = 0.77 nm), and the number of layers (n) is 9. Further, the transformation of GO in NGr (broad peak at 2θ = 23° corresponding to the arrangement of (0 0 2) planes) also led to the decrease in the interlayer distance and number of layers (d = 0.387 nm; number of layers = 3). The calculation of the average number of graphene layers (n), the interlayer spacing (d) and the crystallite size (D) [38,39,40] can be found in the Supplementary Material.
The two samples were further investigated by UV–Vis absorption spectroscopy (Figure 5a) and FTIR spectroscopy (Figure 5b). The UV–Vis spectrum of GO exhibited a strong absorption peak at 230 nm, corresponding to the π−π* transition of electrons within C=C bonds and a broad shoulder at 300 nm due to n−π* transitions within C=O bonds [41]. After GO reduction and nitrogen doping, the π−π* transition band shifted to 278 nm, and the 300 nm band completely disappeared, proving the removal of the oxygen-containing groups from GO layers.
The FTIR spectrum of GO is in agreement with the UV–Vis analysis and demonstrates the abundance of different oxygen-containing groups: C–O (at 1050 cm1), C–OH (at 1387 cm1), C=O in carboxylic acid and carbonyl moieties (at 1623 and 1725 cm1) and OH in water molecules (broad band around 3390 cm1). The intensity of the peaks was significantly reduced or even disappeared when nitrogen was doped into the graphene sheets (NGr sample), indicating the deoxygenation of graphene oxide. The bands located at 1189 and 1563 cm−1 are assigned to the stretching vibrations of C–N and C=C, respectively [42].

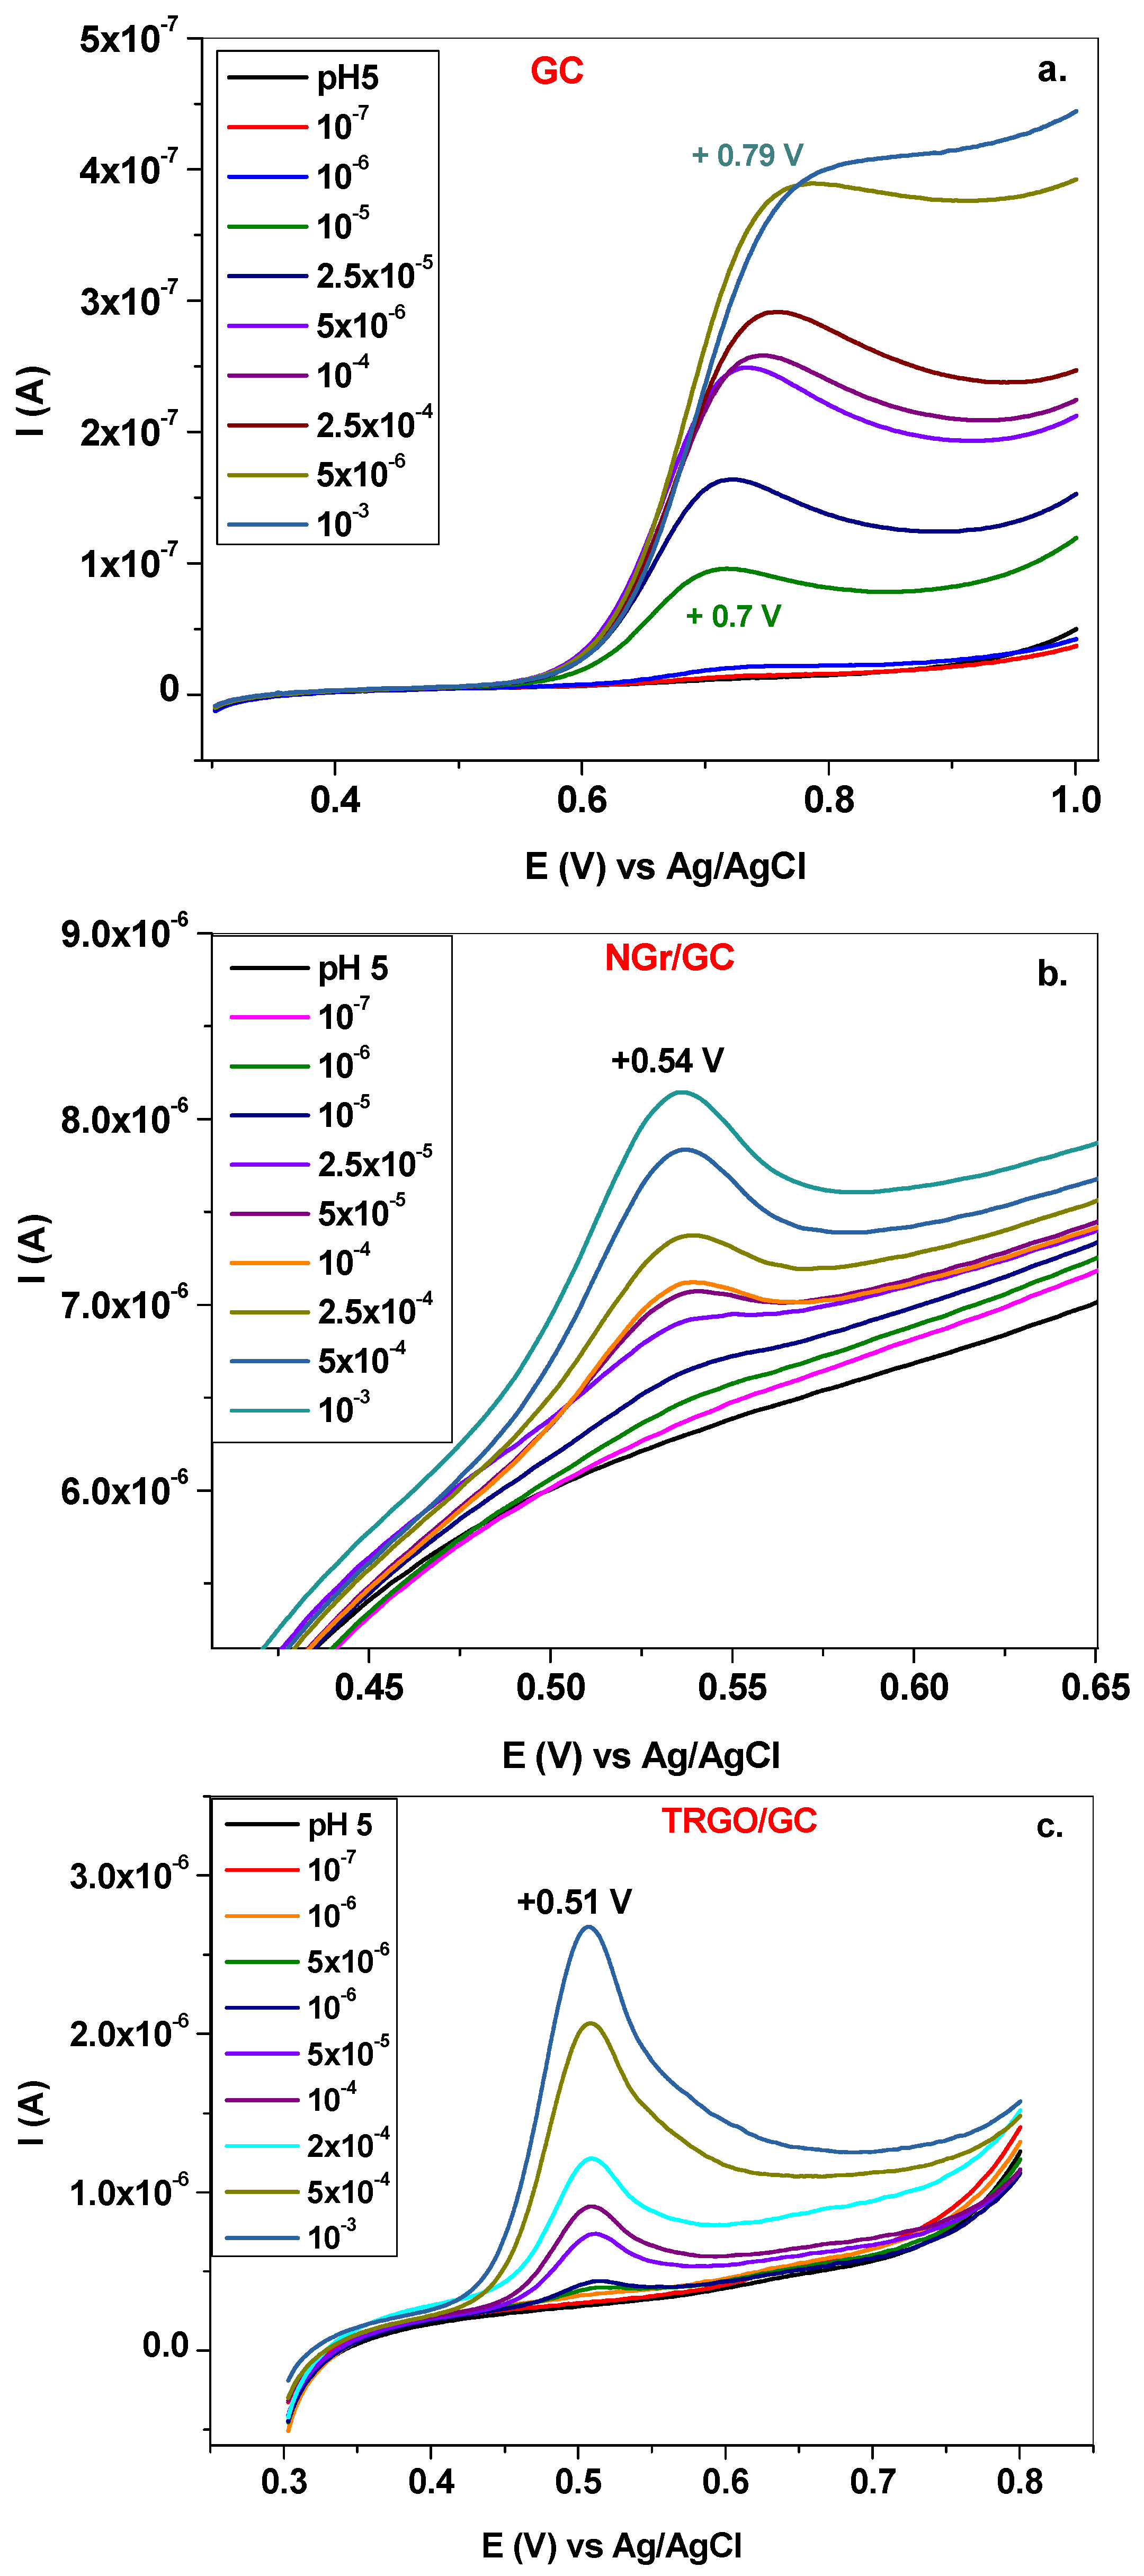
3.2. Electrochemical Studies

Before starting the experiments for piroxicam electrochemical detection, the peak signal of piroxicam versus the volume of graphene deposited on top of the GC electrode was also tested. The optimum peak signal recorded in 104 M piroxicam was obtained at 10 µL (2 mg/mL graphene in DMF) (see Figure S1). Next, the optimum pH value of the electrolyte solution was determined due to the fact that this affects both the peak current and peak potential of piroxicam. Figure 6a shows the LSVs (10 mV/s scanning rate) recorded with the NGr/GC electrode in electrolyte solutions of various pH values (3.5–7), each containing 104 M piroxicam. One can observe that the peak current has the highest value in the slightly acidic solution (pH 5; Figure 6b), being in good agreement with the pKa value of the enolic group in piroxicam (pKa = 5.46) [43,44].
The variation of the anodic peak potential (Epa) is linear with the pH (Figure 6c) and follows the linear equation: y = 0.713 − 0.029 V × pH. The slope of the equation is equal to 29 mV/pH, indicating that two electrons per proton in stoichiometry are involved in the redox process, in good agreement with a previous paper [45]. Based on the above results, the electrolyte with a pH of 5.0 was employed for subsequent experiments.
The comparison between the performance of bare GC and the graphene-modified electrodes (NGr/GC; TRGO/GC) is shown in Figure 7a–c. Significant differences can be observed related to the anodic peak potential and peak current of the three electrodes. Hence, in the case of bare GC the oxidation signal of PIR was very broad and appeared at a high potential of +0.7 V. Moreover, this value increased with PIR concentration (up to +0.79 V), indicating a strong interaction between the molecules in solution and GC surface. In contrast, the signal recorded with the NGr/GC electrode was significantly higher and shifted towards lower potentials (+0.54 V), proving the electro-catalytic effect of the nitrogen-doped graphene sample. In the case of the TRGO/GC electrode, the peak potential was even lower (+0.51 V) due to the high conductivity of the reduced graphene sample.
The main interaction between the NGr surface and the aromatic rings of piroxicam molecules is the π–π stacking interaction. In our previous paper [35], we showed that nitrogen-doped graphene synthesized by the hydrothermal method has larger amounts of pyridinic-N and pyrrolic-N in comparison with graphitic-N. Pyrrolic-N and pyridinic-N can form hydrogen bonds with C=O, -OH groups of piroxicam, while the amide group is involved in the electro-oxidation process [45]. Since the TRGO sample lacks nitrogen atoms, the predominant interaction with piroxicam is the π–π stacking interaction.
The calibration plots obtained with the three electrodes are presented in Figure 8a–c. In these figures, Ipa represents the mean value from three successive measurements. Between measurements, the electrodes were immersed in water for 30 min, then cycled in pH 5 acetate buffer until no signal was observed (50 cycles; 50 mV/s; see Figure S2 in Supplementary Material). It is important to emphasize that in the case of the NGr/GC electrode (Figure 8a), two linear ranges were observed with different slopes: one from 106 to 5 × 10⁵ M (slope of 9.2 mA/M) and the second from 104 to 103 M (slope of 0.5 mA/M). Such behavior may be due to the π–π stacking interaction between the aromatic ring of piroxicam and the graphene layers, which leads to the attachment of molecules to the surface of the electrode. As expected, such attachment is predominant within the higher concentration range (104–103 M). In the case of the bare GC electrode (Figure 8b), the calibration plot has a linear range from 107 to 104 M (slope of 2.5 mA/M) and a clear saturation region above 104 M, indicating an even stronger interaction between the flat GC surface and piroxicam molecules. For the TRGO/GC-modified electrode (Figure 8c), the first linear range is from 106 to 5 × 10⁵ M (slope of 5.1 mA/M) and the second from 104 to 103 M (slope of 1.73 mA/M). The comparison between the three electrodes within the lower concentration range of piroxicam (106–5 × 10⁵ M) can be seen in Figure 8d.
The electrode with the best electro-catalytic activity towards piroxicam detection, NGr/GC, was next tested in the presence of various interfering species, such as ascorbic acid (AA), dopamine (DA) and uric acid (UR). As can be seen in Figure 9a, DA (blue) and UR (pink) gave clear oxidation signals at potentials lower than that of piroxicam (+0.25 V and +0.4 V, respectively), while AA (black) oxidation appeared as a very broad shoulder, around +0.2 V. When PIR was mixed with the interfering species (105 M each; Figure 9b, blue curve), its oxidation signal increased from 5.34 × 10⁷ A to 5.69 × 10⁷ A (6.5% increase).
The NGr/GC electrode was also tested for its ability to detect piroxicam in pharmaceutical drug solutions (Flamexin tablet and powder for oral solution; ChiesiFarmaceuticiSpA, Parma, Italy). Each tablet contained 20 mg of piroxicam betadex along with the following additives: lactose monohydrate, crospovidone, colloidal silicon hydroxide, pregelatinized starch and magnesium stearate. The Flamexin powder for oral solution contained the same amount of piroxicam betadex (20 mg), as well as sorbitol, lemon flavor, aspartame and colloidal silicon dioxide anhydrous. Piroxicam betadex has a more rapid onset of therapeutic effect due to its enhanced solubility.
The following procedure was applied for piroxicam detection in pharmaceutical drugs. One tablet (or powder) was dissolved in 50 mL of acetate buffer (pH 5), which gave a concentration of 1.2 × 10³ M piroxicam. This solution was further diluted to 2.4 × 10⁵ M (100 µL piroxicam solution of 1.2 × 10³ M + 4.9 mL of acetate buffer pH 5). This was considered as the unknown concentration (Cx) that has to be determined. Next, three volumes of piroxicam solution (103 M) (e.g., 50, 100 and 150 µL) were added to three beakers each containing Cx (in each beaker was a final volume of 5 mL). The anodic peak current (Ipa) corresponding to each concentration was then plotted versus the piroxicam concentration, allowing us to determine Cx, as can be seen in Figure 10a,b. From the obtained calibration plots (Figure 10a,b), the piroxicam concentration from the commercial powder and tablet was found to be 2.36 × 10⁵ M (98.4% recovery) and 2.57 × 10⁵ M (107% recovery), respectively. This clearly proved the performance of the NGr electrode and its applicability in real sample detection.
A comparison with other modified electrodes is presented in Table 2.

4. Conclusions

Nitrogen-doped graphene (NGr) was synthesized from graphene oxide (GO) by the hydrothermal method. The SEM micrograph of graphene oxide revealed thin and crumpled layers, randomly aggregated. In contrast, the N-doped graphene material exhibited a smoother surface but also many cavities or holes, which were formed during the doping process. The composition of graphene oxide and nitrogen-doped graphene was further analyzed by elemental analysis. Approximately 6 wt% of nitrogen appeared in the nitrogen-doped graphene sample. After NGr synthesis, the material was deposited onto the surface of a clean glassy carbon electrode and used for piroxicam detection. The calibration plots obtained with bare GC and graphene-modified electrodes (NGr/GC; TRGO/GC) revealed that in the case of the NGr/GC electrode, two linear ranges were observed with different slopes: one from 106 to 5 × 10⁵ M (slope of 9.2 mA/M) and the second from 104 to 103 M (slope of 0.5 mA/M). Such behavior was attributed to the π–π stacking interaction between the aromatic ring of piroxicam and the graphene layers, which led to the attachment of molecules to the surface of the electrode. As expected, such attachment was predominant within the higher concentration range (104–103 M). In the case of the bare electrode, the calibration plot had a linear range from 107 to 104 M (slope of 2.5 mA/M) and a clear saturation region above 104 M, indicating an even stronger interaction between the flat GC surface and piroxicam molecules. For the TRGO/GC-modified electrode, the first linear range was from 106 to 5 × 10⁵ M (slope of 5.1 mA/M) and the second from 104 to 103 M (slope of 1.73 mA/M).

Supplementary Materials

The following supporting information can be downloaded at: https://www.mdpi.com/article/10.3390/chemosensors10020047/s1, Figure S1: Optimization of volume of NGr sample deposited on top of GC electrode; Figure S2: Cleaning procedure of NGr/GC electrode in pH 5 acetate buffer; 50 cycles; 50 mV/s scanning rate.

Author Contributions

C.V. and F.P. performed the electrochemical measurements, interpreted the results and wrote the original draft, A.C. investigated the morphological characteristics of the samples (SEM/EDX), A.T. measured the XRD spectra, M.C. synthesized the graphene samples and wrote the original draft, and S.P. wrote and reviewed the final manuscript. All authors have read and agreed to the published version of the manuscript.

Funding

This work was supported by a grant of the Ministry of Research, Innovation and Digitization, CNCS/CCCDI–UEFISCDI, Project Number PN-III-P4-ID-PCCF-2016-0006, within the PNCDI III and through the Nucleu Programme, supported by MCID, project no PN19 35 01 02/2019.

Institutional Review Board Statement

Not applicable.

Informed Consent Statement

Not applicable.

Data Availability Statement

Data will be provided upon reasonable request to the corresponding authors.

Acknowledgments

The authors are grateful to Emese Gal for Elemental Analysis.

Conflicts of Interest

The authors declare no conflict of interest.

References

  1. Mostafa, G.A.E.; Al-Dosseri, A.S.; Al-Badr, A.A. Piroxicam. Profiles Drug Subst. Excip. Relat. Methodol. 2020, 45, 199–474. [Google Scholar] [PubMed]
  2. Mostafa, A.; Kandeil, A.; Elshaier, Y.A.M.M.; Kutkat, O.; Moatasim, Y.; Rashad, A.A.; Shehata, M.; Gomaa, M.R.; Mahrous, N.; Mahmoud, S.H.; et al. Fda-approved drugs with potent in vitro antiviral activity against severe acute respiratory syndrome coronavirus 2. Pharmaceuticals 2020, 13, 443. [Google Scholar] [CrossRef] [PubMed]
  3. Vineet, K.; Jain, V.; Deb, A.; Yadav, A. Role of Piroxicam in Controlling Fever in COVID 19—An Observational Case Series Study. Indian J. Appl. Res. 2021, 24–25. [Google Scholar] [CrossRef]
  4. Prakash, L.; Jain, A.D.; Dhar, S.; Jamal, S. Effect of Sublingual Piroxicam on Hypoxia in Cytokine Storm Induced COVID 19 Pneumonia-Descriptive Study of Clinicians’ Experiences in 2003 Consecutive Cases. Acta Sci. Orthop. 2021, 4, 2581–8635. [Google Scholar]
  5. Peter, A.E.; Sandeep, B.V.; Rao, B.G.; Kalpana, V.L. Calming the Storm: Natural Immunosuppressants as Adjuvants to Target the Cytokine Storm in COVID-19. Front. Pharmacol. 2021, 11, 1–22. [Google Scholar] [CrossRef]
  6. Macdougall, L.G.; Rothberg, A.D. Piroxicam poisoning in a 2-year-old child. S. Afr. Med. J. 1984, 66, 31–33. [Google Scholar]
  7. Liu, W.; Wang, W.D.; Waang, W.; Bai, S.; Dybowski, C. Influence of structure on the spectroscopic properties of the polymorphs of piroxicam. J. Phys. Chem. B 2010, 114, 16641–16649. [Google Scholar] [CrossRef]
  8. Mishnev, A.; Kiselovs, G. New crystalline forms of piroxicam. Z. Für Nat. B. 2013, 68, 168–174. [Google Scholar] [CrossRef] [Green Version]
  9. Rele, R.V.; Sawant, S.A. A validated simple titrimetric method for the quantitative determination of piroxicam from pharmaceutical dosages. Anal. Chem. Indian J. 2013, 13, 69–76. [Google Scholar]
  10. Amin, A.S. Spectrophotometric determination of piroxicam and tenoxicam in pharmaceutical formulations using alizarin. J. Pharm. Biomed. Anal. 2002, 29, 729–736. [Google Scholar] [CrossRef]
  11. Mandrescu, M.; Spac, A.F. Dorneanu, Spectrophotometric determination of piroxicam using ferric ferricyanide as reagent. Rev. Med.-Chir. Soc. Med. Nat. 2009, 113, 2009. [Google Scholar]
  12. Gölcü, A.; Çeşme, M. A Simple and Validated Spectrophotometric Method for Determination of Piroxicam in Dosage Forms and Biological Fluids. J. Sci. Eng. Res. 2017, 4, 210–217. [Google Scholar]
  13. Zeeb, M.; Tayebi Jamil, P.; Berenjian, A.; Ganjali, M.R.; Talei Bavil Olyai, M.R. Quantitative analysis of piroxicam using temperature-controlled ionic liquid dispersive liquid phase microextraction followed by stopped-flow injection spectrofluorimetry. DARU J. Pharm. Sci. 2013, 21, 2–9. [Google Scholar] [CrossRef] [PubMed] [Green Version]
  14. Yu, F.; Zhang, Y.; Chen, F.; Chen, L. Chemiluminescence method for the determination of piroxicam by the enhancement of the tris-(4,7-diphenyl-1,10- Phenanthrolinedisulphonic acid) ruthenium(II) (RuBPS)-cerium(IV) system and its application. Luminescence 2009, 24, 50–54. [Google Scholar] [CrossRef] [PubMed]
  15. Otarola, J.; Lista, A.G.; Fernández Band, B.; Garrido, M. Capillary electrophoresis to determine entrapment efficiency of a nanostructured lipid carrier loaded with piroxicam. J. Pharm. Anal. 2015, 5, 70–73. [Google Scholar] [CrossRef] [PubMed] [Green Version]
  16. Starek, M.; Krzek, J.; Rotkegel, P. TLC determination of piroxicam, tenoxicam, celecoxib and rofecoxib in biological material. J. Anal. Chem. 2015, 70, 351–359. [Google Scholar] [CrossRef]
  17. Dragomiroiu, G.T.A.B.; Popa, D.E.; Velescu, B.Ș.; Andrieș, A.; Ordeanu, V.; Crenguța, A. Synthesis, characterization and microbiological activity evaluation of novel hard gelatine capsules with cefaclor and piroxicam. Farmacia 2016, 64, 887–895. [Google Scholar]
  18. Spac, A.F.; Miftode, A.M.; Asaftei, I.V.; Sandu, I. Quality by Design (QbD) approach to develop and validate a HPLC method for piroxicam from serum. Rev. Chim. 2018, 69, 2167–2171. [Google Scholar] [CrossRef]
  19. Calvo, A.M.; Santos, G.M.; Dionísio, T.J.; Marques, M.P.; Brozoski, D.T.; Lanchote, V.L.; Fernandes, M.H.R.; Faria, F.A.C.; Santos, C.F. Quantification of piroxicam and 5’-hydroxypiroxicam in human plasma and saliva using liquid chromatography-tandem mass spectrometry following oral administration. J. Pharm. Biomed. Anal. 2016, 120, 212–220. [Google Scholar] [CrossRef]
  20. Torriero, A.A.J.; Tonn, C.E.; Sereno, L.; Raba, J. Electrooxidation mechanism of non-steroidal anti-inflammatory drug piroxicam at glassy carbon electrode. J. Electroanal. Chem. 2006, 588, 218–225. [Google Scholar] [CrossRef]
  21. Abbaspour, A.; Mirzajani, R. Electrochemical monitoring of piroxicam in different pharmaceutical forms with multi-walled carbon nanotubes paste electrode. J. Pharm. Biomed. Anal. 2007, 44, 41–48. [Google Scholar] [CrossRef] [PubMed]
  22. Shahrokhian, S.; Jokar, E.; Ghalkhani, M. Electrochemical determination of piroxicam on the surface of pyrolytic graphite electrode modified with a film of carbon nanoparticle-chitosan. Microchim. Acta 2010, 170, 141–146. [Google Scholar] [CrossRef]
  23. Gholivand, M.B.; Malekzadeh, G.; Derakhshan, A.A. Boehmite nano particle modified carbon paste electrode for determination of piroxicam. Sens. Actuators B: Chem. 2014, 201, 378–386. [Google Scholar] [CrossRef]
  24. Karimi-Maleh, H.; Sheikhshoaie, I.; Samadzadeh, A. Simultaneous electrochemical determination of levodopa and piroxicam using a glassy carbon electrode modified with a ZnO-Pd/CNT nanocomposite. RSC Adv. 2018, 8, 26707–26712. [Google Scholar] [CrossRef] [Green Version]
  25. Dehdashti, A.; Babaei, A. Highly Sensitive Electrochemical Sensor Based on Pt Doped NiO Nanoparticles/MWCNTs Nanocomposite Modified Electrode for Simultaneous Sensing of Piroxicam and Amlodipine. Electroanalysis 2020, 32, 1017–1024. [Google Scholar] [CrossRef]
  26. Feizollahi, A.; Rafati, A.A.; Assari, P.; Joghani, R.A. Simple and Fast Determination of Piroxicam in Pharmaceutical and Real Samples Using Glassy Carbon Electrode Modified with Copper Nano-particles. J. Electrochem. Soc. 2020, 167, 067521. [Google Scholar] [CrossRef]
  27. Wong, A.; Santos, A.M.; Fatibello-filho, O.S.C. Determination of piroxicam and nimesulide using an electrochemical sensor based on reduced graphene oxide and PEDOT: PSS. J. Electroanal. Chem. 2017, 799, 547–555. [Google Scholar] [CrossRef]
  28. Bagher, M.; Karimian, N. Development of piroxicam sensor based on molecular imprinted polymer-modified carbon paste electrode. Mater. Sci. Eng. C 2011, 31, 1844–1851. [Google Scholar]
  29. Dhanalakshmi, N.; Priya, T.; Thennarasu, S.; Sivanesan, S.; Thinakaran, N. Synthesis and electrochemical properties of environmental free L-glutathione grafted graphene oxide/ZnO nanocomposite for highly selective piroxicam sensing. J. Pharm. Anal. 2021, 11, 48–56. [Google Scholar] [CrossRef]
  30. Santos, A.M.; Wong, A.; Vicentini, F.C.; Fatibello-Filho, O. Simultaneous voltammetric sensing of levodopa, piroxicam, ofloxacin and methocarbamol using a carbon paste electrode modified with graphite oxide and β-cyclodextrin. Microchim. Acta 2019, 186, 174. [Google Scholar] [CrossRef]
  31. Kaushal, S. Heteroatom-doped graphene as sensing materials. RSC Adv. 2020, 10, 28608–28629. [Google Scholar] [CrossRef]
  32. Talukder, N.; Wang, Y.; Babu, B.; Soo, E. Nitrogen-doped graphene nanomaterials for electrochemical catalysis/reactions: A review on chemical structures and stability. Carbon 2021, 185, 198–214. [Google Scholar] [CrossRef]
  33. Wang, Y.; Shao, Y.; Matson, D.W.; Li, J.; Lin, Y. Nitrogen-Doped Graphene and Its Application in Electrochemical Biosensing. ACS Nano 2010, 4, 1790–1798. [Google Scholar] [CrossRef] [PubMed]
  34. Pogacean, F.; Socaci, C.; Pruneanu, S.; Biris, A.R.; Coros, M.; Magerusan, L.; Katona, G.; Turcu, R.; Borodi, G. Graphene based nanomaterials as chemical sensors for hydrogen peroxide—A comparison study of their intrinsic peroxidase catalytic behavior. Sens. Actuators B Chem. 2015, 213, 474–483. [Google Scholar] [CrossRef]
  35. Coros, M.; Varodi, C.; Pogacean, F.; Gal, E.; Pruneanu, S.M. Nitrogen-doped graphene: The influence of doping level on the charge-transfer resistance and apparent heterogeneous electron transfer rate. Sensors 2020, 20, 1815. [Google Scholar] [CrossRef] [Green Version]
  36. Coros, M.; Pogacean, F.; Turza, A.; Dan, M.; Berghian-Grosan, C.; Pana, I.O.; Pruneanu, S. Green synthesis, characterization and potential application of reduced graphene oxide. Physica E 2020, 119, 113971. [Google Scholar] [CrossRef]
  37. Nxumalo, E.N.; Mamba, B.B.; Kuvarega, A.T.; Mhlanga, S.D.; Yokwana, K.; Khenfouch, M.; Ray, S.C. Facile Synthesis of Nitrogen Doped Graphene Oxide from Graphite Flakes and Powders: A Comparison of Their Surface Chemistry. J. Nanosci. Nanotechnol. 2018, 18, 5470–5484. [Google Scholar]
  38. Razeghi, M.; Pircheraghi, G. TPU/graphene nanocomposites: Effect of graphene functionality on the morphology of separated hard domains in thermoplastic polyurethane. Polymer 2018, 148, 169–180. [Google Scholar] [CrossRef]
  39. Udayabhaskar, R.; Mangalaraja, R.V.; Pandiyarajan, T.; Karthikeyan, B.; Mansilla, H.D.; Contreras, D. Spectroscopic investigation on graphene-copper nanocomposites with strong UV emission and high catalytic activity. Carbon 2017, 124, 256–262. [Google Scholar] [CrossRef]
  40. Balzar, D. X-ray diffraction line broadening: Modeling and applications to high-Tc superconductors. J. Res. Natl. Inst. Stand. Technol. 1993, 98, 321. [Google Scholar] [CrossRef]
  41. Cushing, S.K.; Li, M.; Huang, F.; Wu, N. Origin of strong excitation wavelength dependent fluorescence of graphene oxide. ACS Nano 2014, 8, 1002–1013. [Google Scholar] [CrossRef] [PubMed]
  42. Du, D.; Li, P.; Ouyang, J. Nitrogen-doped reduced graphene oxide prepared by simultaneous thermal reduction and nitrogen doping of graphene oxide in air and its application as an electrocatalyst. ACS Appl. Mater. Interfaces 2015, 7, 26952–26958. [Google Scholar] [CrossRef] [PubMed]
  43. Altomare, A. Solid-state properties of pharmaceutical materials. Crystallogr. Rev. 2019, 26, 115–116. [Google Scholar] [CrossRef]
  44. Demiralay, E.Ç.; Yılmaz, H. Potentiometric pKa determination of piroxicam and tenoxicam in acetonitrile-water binary mixtures. SDU J. Sci. (E-J.) 2012, 7, 34–44. [Google Scholar]
  45. Shaikh, T.; Uddin, S.; Talpur, F.N.; Khaskeli, A.R.; Agheem, M.H.; Shah, M.R.; Sherazi, T.H.; Siddiqui, S. Ultrasensitive Determination of Piroxicam at Diflunisal-Derived Gold Nanoparticle-Modified Glassy Carbon Electrode. J. Electron. Mater. 2017, 46, 10. [Google Scholar] [CrossRef]
  46. Asadpour-Zeynali, K.; Majidi, M.R.; Zarifi, M. Carbon ceramic electrode incorporated with zeolite ZSM-5 for determination of Piroxicam. Cent. Eur. J. Chem. 2010, 8, 155–162. [Google Scholar] [CrossRef] [Green Version]
Figure 1. Schematic representation of NGr sample preparation using the hydrothermal method.
Chemosensors 10 00047 g001
Figure 2. SEM images of GO (a) and NGr (b) samples.
Chemosensors 10 00047 g002
Figure 3. SEM image of the NGr sample (a); elemental maps of C, N and O in the sample (be).
Chemosensors 10 00047 g003
Figure 4. XRD pattern of GO (black) and NGr (red) samples. Inset: structural parameters (D; d; n) calculated from the corresponding pattern of each sample.
Chemosensors 10 00047 g004
Figure 5. UV–Vis absorption spectra of the two samples: GO (black) and NGr (red) (a); FTIR spectra of GO (black) and NGr (red) (b).
Chemosensors 10 00047 g005
Figure 6. LSVs recorded with NGr/GC electrode in electrolyte solutions of various pH values (3.5–7), each containing 104 M piroxicam; 10 mV/s scanning rate. Inset: chemical structure of piroxicam (a); variation of anodic peak current (Ipa) with solution pH (b); variation of the anodic peak potential (Epa) with solution pH (c).
Chemosensors 10 00047 g006
Figure 7. LSVs recorded in pH 5 acetate solutions containing various concentrations of piroxicam, from 107 to 104 M with GC electrode (a) NGr/GC (b) and TRGO/GC (c); 10 mV/s scanning rate.
Chemosensors 10 00047 g007
Figure 8. Calibration plots for piroxicam obtained with NGr/GC (a) bare GC (b) and TRGO/GC (c); comparison between the GC, NGr/GC and TRGO/GC electrodes within the lower concentration range: 106–5 × 10⁵ M in pH 5 acetate (d). Ipa represents the mean value from three measurements, recorded with the same electrode.
Chemosensors 10 00047 g008aChemosensors 10 00047 g008b
Figure 9. LSVs recorded with NGr/GC electrode in pH 5 solutions containing the following analytes: ascorbic acid (104 M), piroxicam (104 M), dopamine (104 M), and uric acid (104 M) (a); LSVs recorded with NGr/GC electrode in pH 5 solution containing mixed analytes: 104 M PIR + 105 M AA + 105 M DA + 105 M UR (b); 10 mV/s scanning rate.
Chemosensors 10 00047 g009
Figure 10. Standard addition plots obtained for piroxicam detection in pharmaceutical drugs: Flamexin powder for oral solution (a); Flamexin tablet (b).
Chemosensors 10 00047 g010
Table 1. Elemental analysis of GO and NGr samples.
Samplewt%
CNHO
GO52.76-1.7645.48
NGr79.755.861.5412.85
Table 2. Comparison of the present work with other modified electrodes.
ElectrodeInvestigated SamplesLinear Range
in Laboratory Solution/M
LOD/MRef.
CNTPEPharmaceutical samples4.5 × 10−7–1.5 × 10−53 × 10−7[21]
CNP-CS-PGEHuman blood plasma, capsule5 × 10−8–5 × 10−52.5 × 10−8[22]
BNP–CPBlood serum, capsule, gel5 × 10−10–1 × 10−71.1 × 10−8[23]
GCE/ZnO–Pd/CNTsBlood serum, water, tablets1 × 10−7–9 × 10−54 × 10−8[24]
Pt- NiO/MWCNTs/GCEHuman urine and serum6 × 10−7–3.2 × 10−46.1 × 10−8[25]
rGO-PEDOT/GCERiver water and pharmaceutical samples8.7 × 10−7–2.6 × 10−51.0 × 10−7[27]
glutathione-GO/ZnO/GCEBlood serum, water, tablets1 × 10−7–5 × 10−41.8 × 10−9[29]
CD-GrO/CPESynthetic urine, river water1 × 10−6–1.5 × 10−51.05 × 10−7[30]
CCZMEPharmaceutical samples2 × 10−7–5.01 × 10−52.9 × 10−7[46]
NGr/GCPharmaceutical samples1 × 10−6–5 × 10−53.03 × 10−7This work
CNTPE—multiwalled carbon nanotubes paste electrode; rGO-PEDOT/GCE—reduced graphene oxide (rGO) and poly(3,4-ethylenedioxythiophene)- poly(styrenesulfonate) (PEDOT/PSS); Pt-NiO/MWCNTs/GCE—platinum (Pt)-doped nickel oxide (NiO) nanoparticles and multiwalled carbon nanotube (MWCNT)-modified glassy carbon electrode; BNP–CP—boehmite nanoparticles-modified carbon paste; glutathione-GO/ZnO—glutathione grafted graphene oxide/ZnO nanocomposite; GCE—glassy carbon electrode; CD-GrO/CPE—carbon paste electrode (CPE) modified with graphite oxide (GrO) and β-cyclodextrin (CD); CNP-CS-PGE—plain pyrolytic graphite electrode modified with chitosan-doped carbon nanoparticle; CCZME—carbon ceramic zeolite-modified electrode.
Publisher’s Note: MDPI stays neutral with regard to jurisdictional claims in published maps and institutional affiliations.

