
Introducing Graphene–Indium Oxide Electrochemical Sensor for Detecting Ethanol in Aqueous Samples with CCD-RSM Optimization


Faculty of Science and Technology, Bournemouth University, Fern Barrow, Poole BH12 5BB, UK
*
Author to whom correspondence should be addressed.
Chemosensors 2022, 10(2), 42; https://doi.org/10.3390/chemosensors10020042
Submission received: 14 December 2021
/
Revised: 18 January 2022
/
Accepted: 20 January 2022
/
Published: 24 January 2022
(This article belongs to the Special Issue Recent Advances in Biosensors for Healthcare Applications)
Abstract
:There is significant demand for portable sensors that can deliver selective and sensitive measurement of ethanol on-site. Such sensors have application across many industries, including clinical and forensic work as well as agricultural and environmental analysis. Here, we report a new graphene–indium oxide electrochemical sensor for the determination of ethanol in aqueous samples. Graphene layers were functionalised by anchoring In2O3 to its surface and the developed composite was used as a selective electrochemical sensor for sensing ethanol through cyclic voltammetry. The detection limit of the sensor was 0.068 mol/L and it showed a linear response to increasing ethanol in the environment up to 1.2 mol/L. The most significant parameters involved and their interactions in the response of the sensor and optimization procedures were studied using a four-factor central composite design (CCD) combined with response surface modelling (RSM). The sensor was applied in the detection of ethanol in authentic samples.
1. Introduction
There are numerous techniques for the measurement of ethanol, including chromatographic techniques such as high-performance liquid chromatography (HPLC) [1,2] and gas chromatography (GC) [3,4]; spectroscopic techniques including Fourier transform near infrared (FT-NIR) and Raman spectroscopy [5,6,7]; and sensor technologies including semiconductor metal-oxide-based sensors [8,9,10,11,12], biosensors and immunosensors based on enzymes and antibodies [13,14,15]. The chromatographic techniques suffer from lack of portability, complicated preparation, time consumption and response to various compounds (lack of selectivity) [13]. Biosensors offer high selectivity, yet they suffer from poor stability, high costs, critical operational conditions such as limited working temperature and complicated fabrication procedure [16]. Spectroscopy methods may not always respond well to real samples [7] or may need different preparation procedures for different real samples [17]. Previously reported metal-oxide-based sensors have been used for detecting volatile alcohols; however, because of their sensing mechanism, which is based on changing resistance of the sensor, they might also respond to any other compound that affects their resistance [9,18,19,20]. Due to the importance of alcohol measurements for clinical, biomedical, environmental, forensic, chemistry and food studies [21,22,23,24,25,26], there is always a demand for portable sensors with relatively fast, sensitive, and selective response that can work in different media.
Over time, graphene has proved to be a good candidate for developing sensors and biosensors by offering large surface area, high electrical and thermal conductivity, mechanical strength, and flexibility [27,28,29]. These characteristics along with its reasonable cost, draw the attention of various sensor development industries where among commercially available sensors, glucose, lactate, glutamate, creatinine and cholesterol sensors have been developed [30,31]. Despite the fact that graphene can work as a base material or substrate, there is always a need for further modification to tune its properties and make it more selective toward specific analytes [32]; among previously studied functionalisation methods, various coatings, doping, using molecular imprinted polymers and trying to form a direct bond to another bio-organic molecule have been attempted [33,34,35,36,37,38].
While semiconducting metal oxide sensors are currently one of the most studied groups of gas sensors [39], few papers have suggested the sensory applications of metal oxides in aqueous samples [40,41,42]. Some studies suggested that not only is indium oxide sensitive to ethanol vapours [43], but its gas sensitivity can also be enhanced significantly when it is used in composites along with other materials such as metals oxides [44], transition metal dichalcogenides [45] or different doped metals [46,47]. Previous studies on developing and utilizing a composition of indium to graphene used synthesis methods including hydrothermal reaction [48], direct laser writing (DLW) [49], chemical vapor deposition (CVD) [50,51] to grow graphene over an indium tin oxide electrode; however, those methods suffer from problems such as complicated operation, time consumption and difficult pre-synthesis [49]. Gunasekaran and his co-workers suggested the direct electrochemical reduction in graphene oxide on the surface of indium tin oxide-coated glass electrode [52] and Lei et al., suggested using ascorbic acid to reduce the graphene oxide in the presence of previously synthesised In2O3 nanoparticles [53]. Here, we investigate the application of indium oxide nanoparticles directly bonded on the graphene layers for sensing trace amounts of ethanol in aqueous samples.
In order to optimize the developed sensor, design in response surface methodology was employed. The technique assists with optimization of the outcome response though analysing the results of a set of specific and advanced modelled experiments. Basic experiments showed that the developed electrode can work as an ethanol senor, but to study the magnitude of ethanol effects on the response of the sensor and to study the possible effects of other variables including diffusion effects (can be monitored by changing the rate of scan), binder and aging on the sensor simultaneously, regular central composite design (CCD) with five levels were applied for each factor [54,55]. The effects of important variables including scanning rate, ethanol concentration, amount of binder and age of the sensor on the function of the sensor were investigated and optimized through central composite design (CCD) combined with response surface methodology (RSM). This method allowed the study of the interactions of all variables simultaneously, which not only offers less treatment time and cost benefit, but increases the accuracy and precision of the results [56]. The optimizations other than specifying the best reaction setups, have enabled us to develop a durable and long-lasting sensor which can accurately and precisely detect ethanol in aqueous solutions at very low concentrations.
2. Experimental
2.1. Materials
All chemicals were purchased from Fisher Scientific, UK, and were analytical reagent grade. All aqueous solutions were prepared using double distilled water. RVFM A3 copper sheet with 0.1 mm thickness was used as the substrate for the sensor. While using pure reagents, oxygen removed from the samples to minimize its interference with the electrochemical experiments. Beer (about 5% alcohol; made of barley malt, rice and hops) and American-style whisky (about 35% alcohol; made of corn, barley, rye and natural honey) were used as real industrial samples.
2.2. Instrumentation
IviumStat.h (Ivium Technologies, Eindhoven, The Netherlands) was used as a potentiostat for cyclic voltametric measurements in a 1.5 mL cell with a triple-electrode configuration at room temperature and controlled by Iviumsoft. The counter electrode was platinum and the reference electrode was made of Ag/AgCl, which was developed by heating a thin silver wire (0.8 mm diameter) in a container filled with KCl at 300 °C for 24 h. The developed sensor made contact with the samples through a hole (12 mm diameter) at the bottom of the cell. Fourier-transform infrared (FTIR) spectra were recorded on Platinum ATR–Alpha II FTIR spectrophotometer (Bruker, Billerica, MA, USA). Scanning electron microscopy (SEM) measurements were carried out using a JEOL (Tokyo, Japan) JSM-6010 tungsten cathode scanning electron microscope. A U500H Ultrasonic Bath (Ultrawave, Cardiff, UK) used for sonication and Jeio Tech’s OV-11 vacuum oven (Daejeon, Korea) was used to dry printed sensors. Design Expert software version 11 (Stat-Ease, MN, USA) was used to design experiments and analyze the data. X-ray photoelectron spectroscopy (XPS) analyses were performed using ThermoFisher Scientific Instruments (East Grinstead, UK) K-Alpha+ spectrometer, where XPS spectra were acquired using a monochromated Al Kα X-ray source (hν = 1486.6 eV).
2.3. Synthesis Procedure
Jagannadham also suggested that there is reduction in graphene oxide in the presence of indium, and added a suspension of graphene oxide inside indium foil and applied annealing over the folded foils [57]. Graphene oxide–Nafion–In2O3 printed mixture for sensing humidity is another example of an indium–graphene combination, where each part is synthesised separately and mixed together for casting an electrode [58].
The use of metal and acid mixtures for reducing graphene oxide, because of its fast and efficient reduction abilities, has garnered much attention in recent years [59]. The general mechanism is still unclear, but two of the suggested mechanisms are rapid electron transfer between graphene oxide and metals and production of hydrogen to work as the active reducing agent [59]. The common factor among previously studied metals–acid reduction procedures, such as aluminium [60], iron [61] or zinc [62,63], was that the reduction of graphene oxide never happened in the absence of acids. On the other hand, indium is known for its ability as reducing agent in organic synthesis [64,65].
Here, we used a simple reduction and functionalisation method after developing graphene oxide through modified Hummer’s method to reduce freshly exfoliated graphene oxide layers and then functionalise graphene with indium oxide in a follow up step. Briefly, the modified Hummer’s method is employed to turn graphite into graphene oxide [66,67], though at the final stages a simple treatment with a solution of indium and sulfuric acid eliminated the oxygen bonds on the surface of graphene oxide to forms reduced graphene oxide; then, a second batch of indium reagent formed indium oxide along with a direct bond to the surface of graphene.
The procedure started with the addition of 90 mL sulfuric acid to 2.5 g graphite. Then, 2.3 g NaNO3 was added to the mixture and left to react, before transferring the container into an ice bath. Next, 12.5 g KMnO4 was slowly added to the solution while it was in the 0 °C bath, to produce a dark-green mixture. The mixture was diluted further with 500 mL water. Finally, 15 mL H2O2 (30%) was added to the mixture dropwise. The graphene oxide can be obtained by washing and purifying sample through multiple centrifugations at this point and can be dried either by freeze dryer or by normal heating.
To reduce the oxygen functional groups and improve the conductivity of graphene sample [29], a solution of 1 g indium acetate dissolved in diluted sulfuric acid solution (200 mL H2O: 8 mL H2SO4), prepared separately and slowly, was added to the graphene oxide and left to stir at room temperature (pH~1.5). Then, 10 mL diluted hydrogen peroxide (10%) was added and left to stir for 12 h. Finally, 500 mL of water was added to the mixture to dilute further. The purification was carried out by washing with water with the help of centrifuge, until the pH reached neutral (pH~7).
In order to functionalise the reduced graphene oxide, first 1 g indium acetate followed by 10 mL H2O2 (30%) were added to the developed mixture and left to stir for more than 12 h while the temperature of the mixture increased and maintained at about 45 °C. The final product was processed in a similar way to previous ones and washed with water through multiple centrifugations until the pH of the sample reached neutral; then it was dried at 65 °C.
2.4. Electrode Fabrication
Initially, a composite was prepared by mixing dried graphene–In2O3 (80 mg) with polyethylene terephthalate (PET, 5, 7.5, 10, 12.5, 15 wt%) and a 2.5 mL dimethylformamide solution (DMF 2:1 water) in an agate mortar to obtain a homogeneous ink. This was manually printed over a thin layer of copper, where polyimide tapes were used to form a temperature tolerant frame and prepare the copper into distinct sections. It was left to dry inside a vacuum oven at 80 °C for two hours and then at 130 °C for 22 h. After removal of the polyimide tape, the electrodes are separated for further study. The final dried printed electrodes had on average approximately 9.23 mg composite per 1 cm2.
2.5. Experimental Design and Data Analysis
The simultaneous optimization technique which was used (CCD under response surface methodology, RSM), is a package of experimental design, modelling, and optimization, which provides relatively fewer combinations of variables for studying complex response function [54,56,68,69]. Here, CCD in the form of a 24 full-factorial design was used to develop mathematical equations to provide quantitative evaluation of the sensors’ behaviour by changing different variables. Ethanol concentration, scanning rate, amount of binder and age of the sensor—the key parameters affecting the resulting electrical current—were studied in this evaluation.
Table 1 shows a five-level CCD which was applied to study the effects of listed variables on an electrical current, which resulted in 30 runs for the optimization process. Table 2 shows the design matrix and the results of the central composite full factorial design, where reproducibility and errors were investigated using its central points. Factorial points (2k points, k = 4 factors) help with estimating first-order and two-factor interactions, while axial points (2k points, k = 4 factors) estimate pure quadratic effects.
3. Results and Discussion
3.1. Characterization
The surface composition of the developed graphene-In2O3 composite on an area of approximately 400 µm in diameter of the sample was analysed by XPS and results illustrated in Figure 1. C 1s XPS spectrum of the sample (Figure 1a) contains three peaks at 285.01, 286.99 and 287.71 eV which represent sp2 carbon (graphene), C-O-In and C=O bonds, respectively [48,70,71,72]. It was suggested that the generation of a C-O-In bond can change carbon rings’ π* orbitals structure and cause a decreased peak in the range of 285–286 eV [48,73].
Figure 1b shows that in the In 3d region of the XPS spectra, two main peaks at 445.6 and 453.13 eV represent In 3d5/2 and In 3d3/2; these represent both C-In3+ and the presence of indium–carbon bonds [74]. At the same time, both of those peaks are in a +3 oxidation state of indium and can overlap with In–O bonds in In2O3 [75]. The indium–oxygen bond can also be found in the O 1s spectrum (Figure 1c) at 530.32 eV [76,77,78] along with the O-H bond at 532.26 eV and the O-C at 533.28 eV in that region [75,79,80]. A closer look at XPS results suggests that indium oxide developed on the surface of graphene, possibly anchored to the graphene through both In–C and In–O–C bonds.
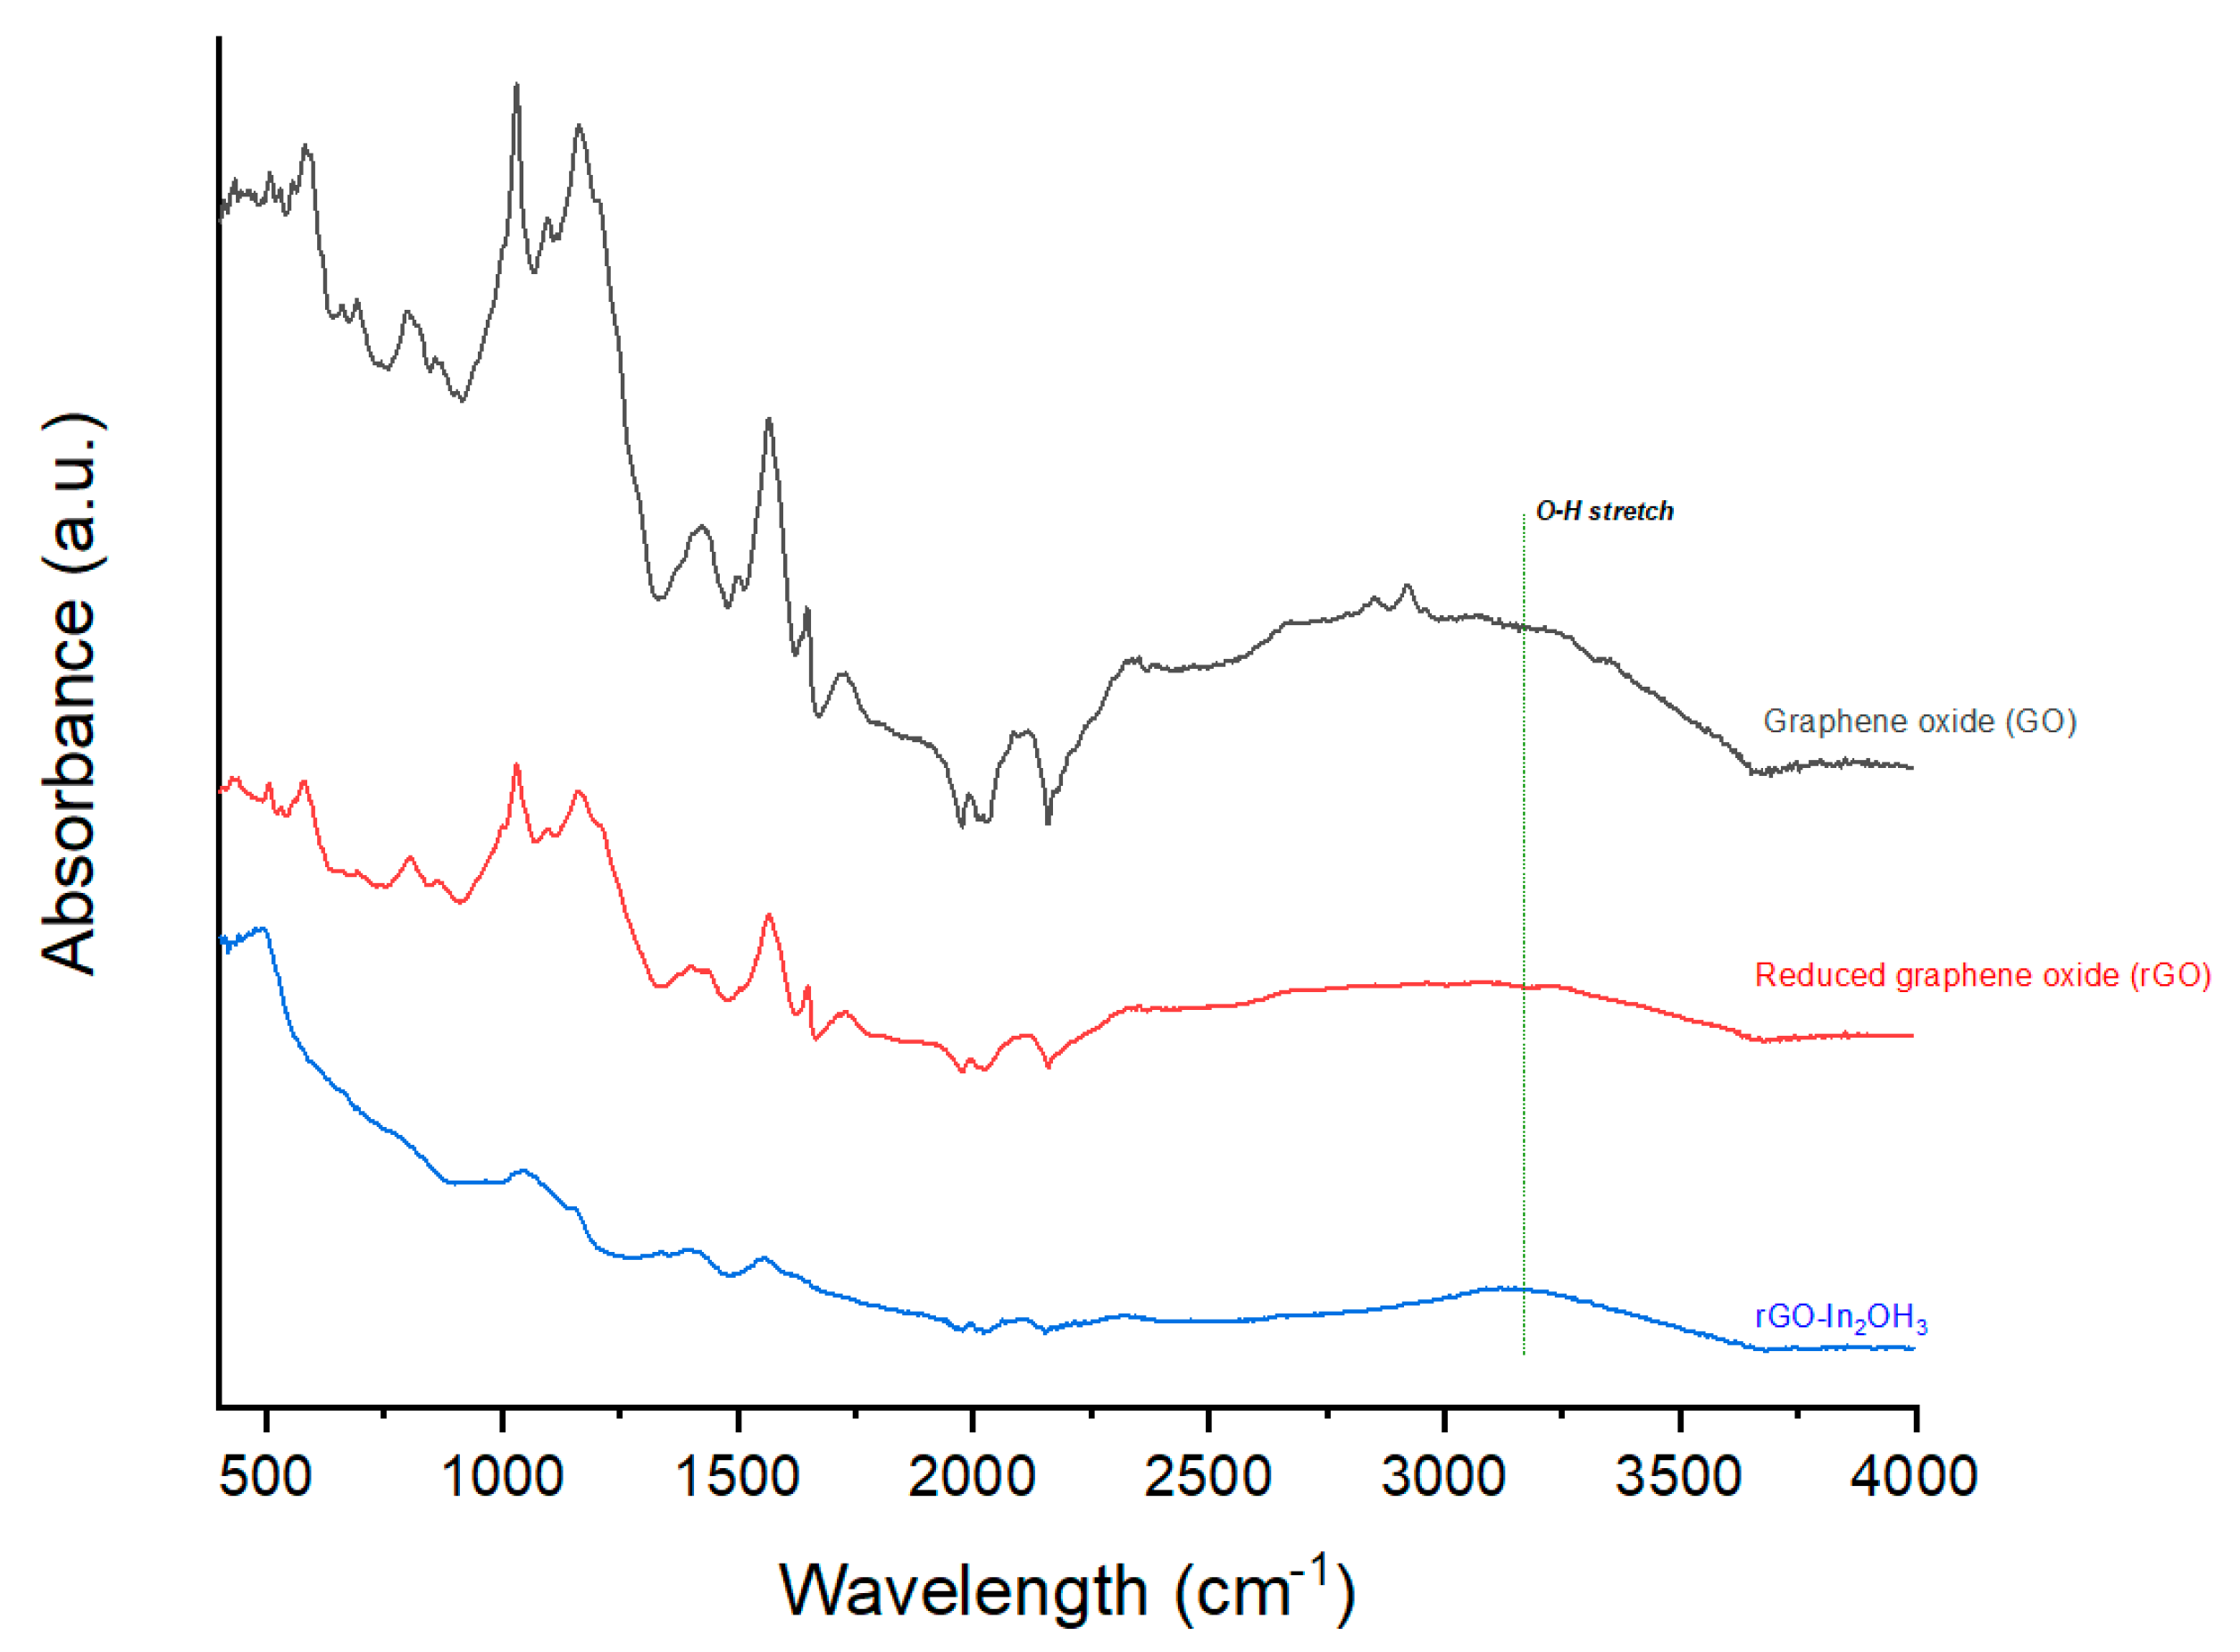
A comparison of the FTIR spectrum of graphene oxide with reduced graphene oxide (Figure 2) demonstrates the noticeable reduction in the intensity of oxygen functional groups, mainly the broad O-H stretching at 3168.58 cm−1, which confirms the successful reduction [81,82,83]. During the functionalisation procedure, the addition of hydrogen peroxide to the mixture indium and graphene not only helped with the development In2O3 from indium acetate among graphene layers, but also resulted in the generation and addition of extra alcoholic groups to the surface of graphene and led to the re-appearance of the hydroxyl stretching peak. The FTIR spectrum of the functionalised sample shows a slight increase in the alcoholic peaks, which could have been caused by hydrogen peroxide during the functionalization process, in which some -OH groups were attached to the graphene.
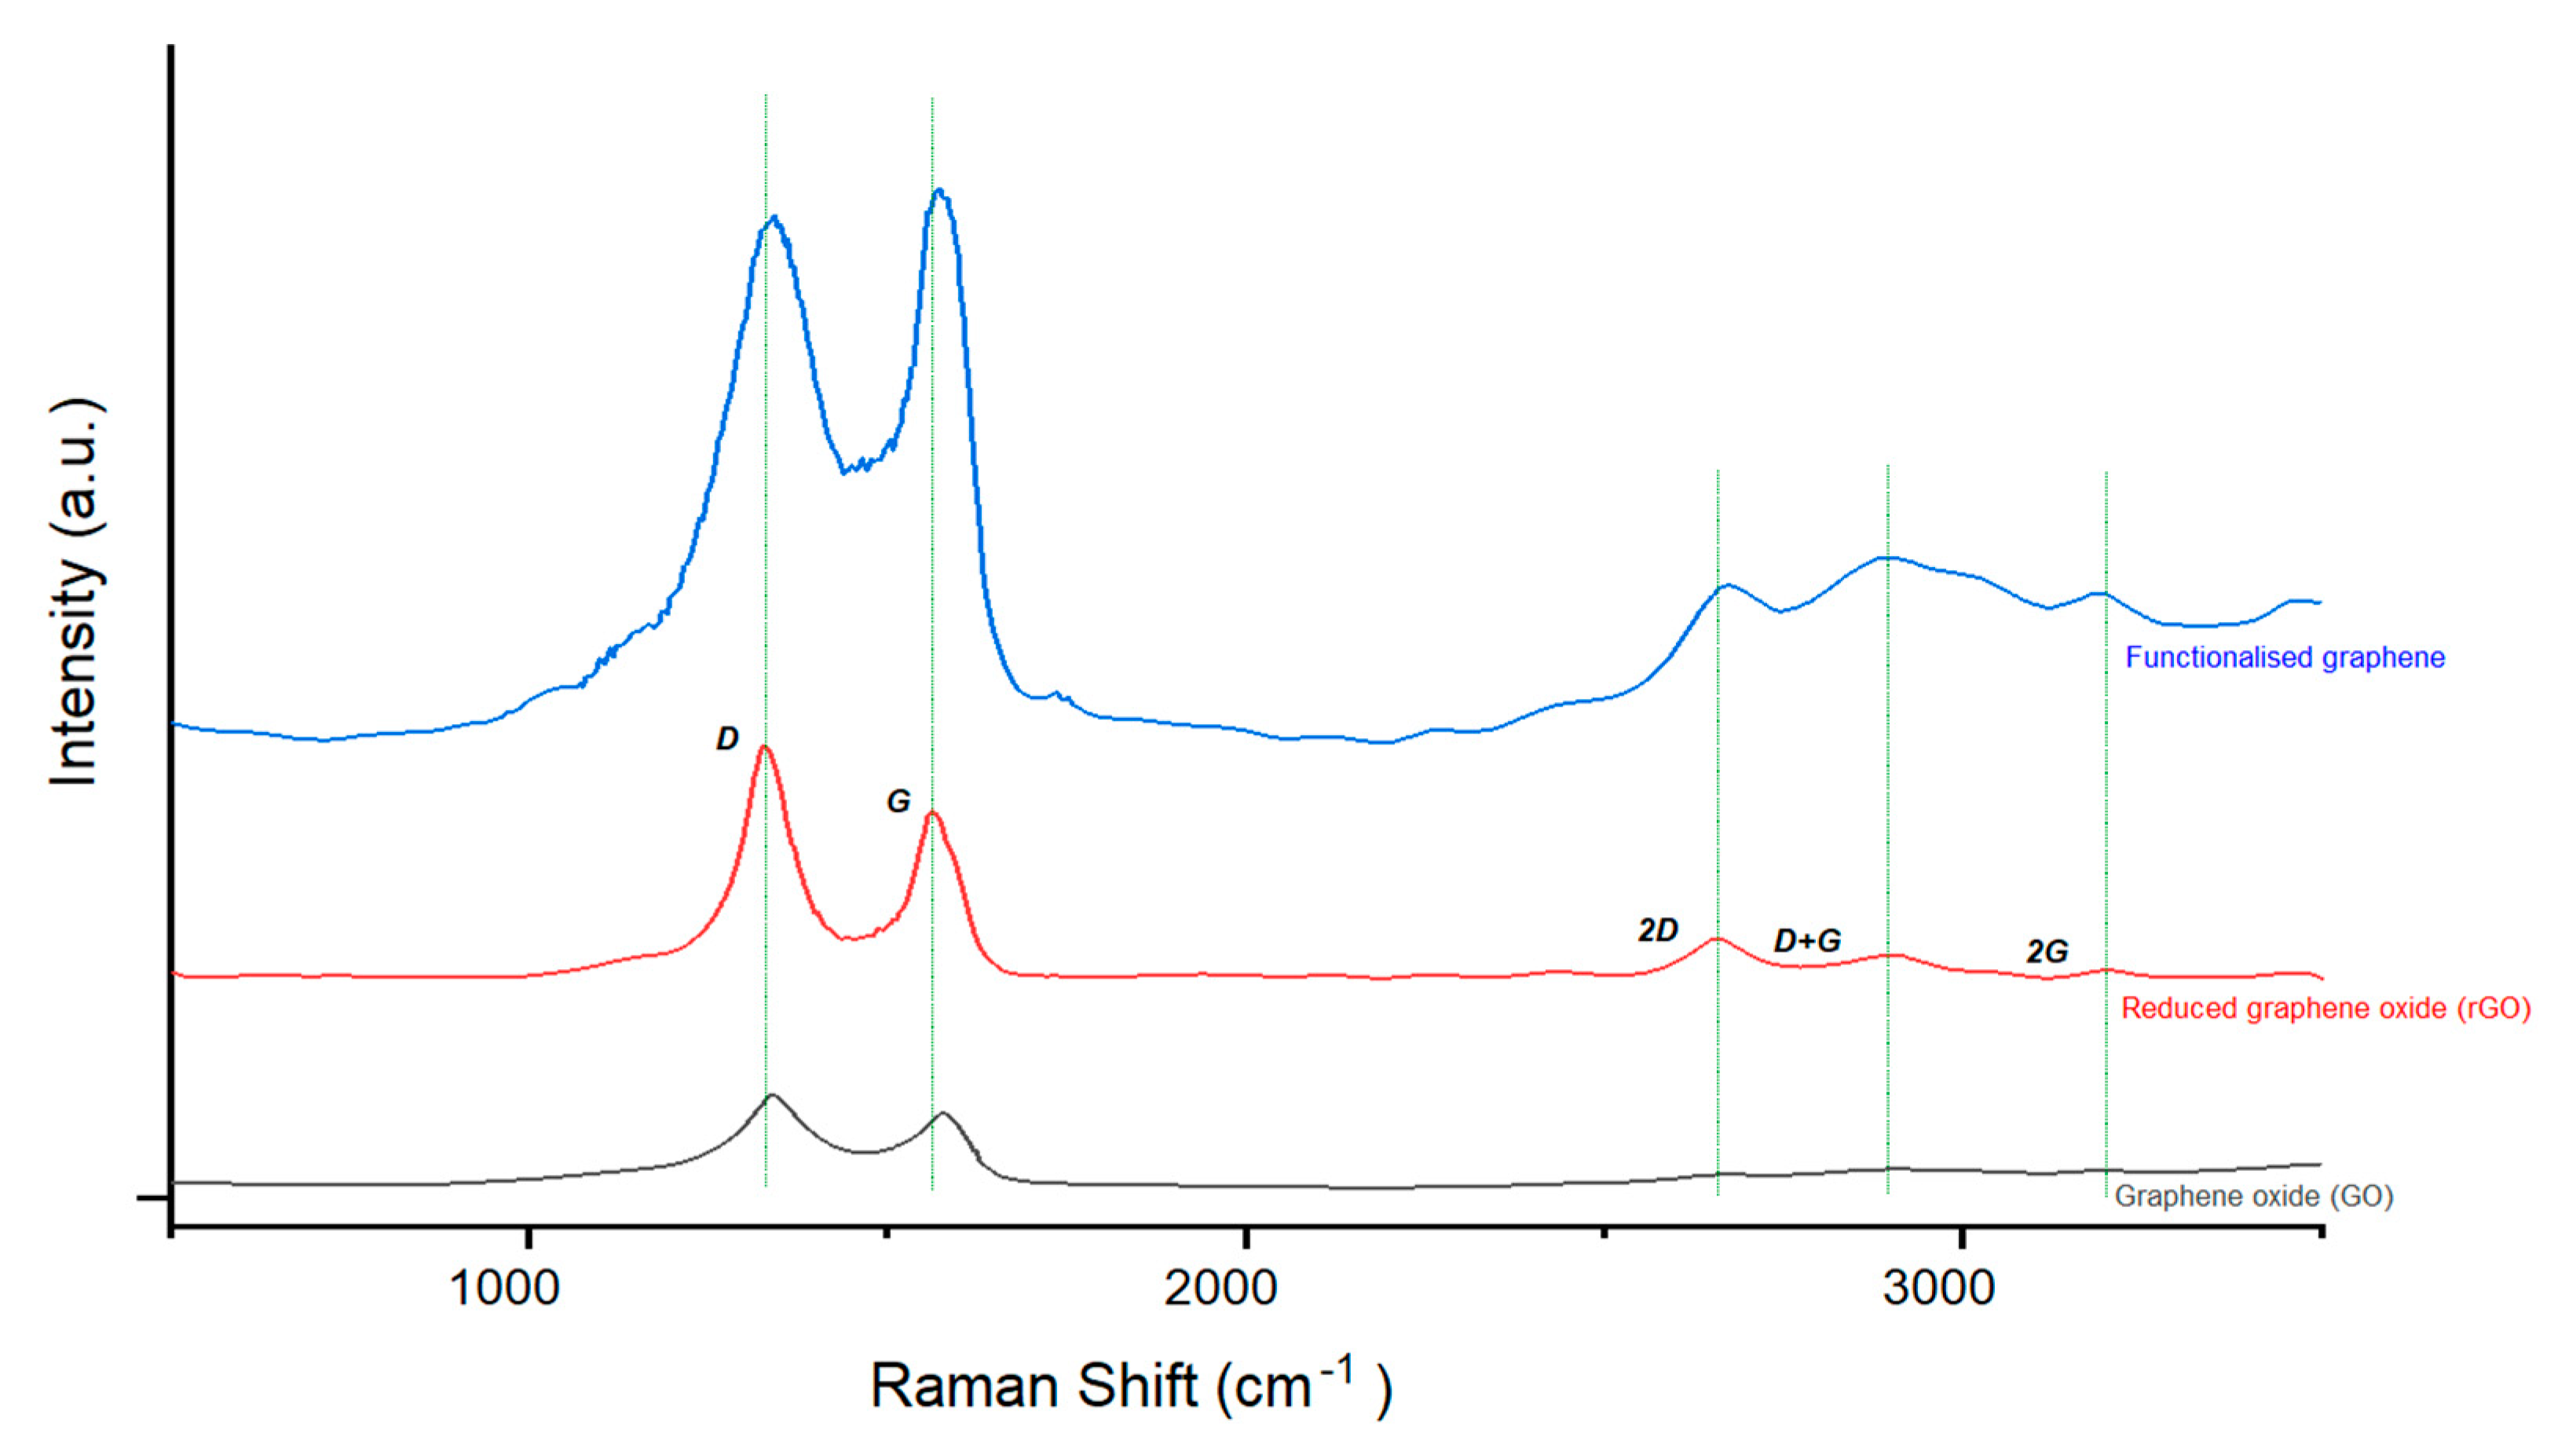
The Raman spectra were obtained with a 50× magnification objective, allowing us to focus the laser spot properly on the surface of the graphene-based samples; the results are shown in Figure 3. The G band, which appeared around 1576 cm−1 for studied samples, represents the C=C bond [84,85,86], while the D band, which its intensity is associated with the number of defects in the graphene plane, appeared at about 1337 cm−1 in our samples [85,87]. In the wavelengths above 2300 cm−1, the second-order bands were present for rGO and rGO–In2O3 samples. The 2D band, which appeared at approximately 2670 cm−1, is the overtone of the D band activated by a double-resonance process which was similar to the D band, but does not require the presence of defects like the D band to fulfil the momentum conservation law and will be visible for any sp2 carbons including graphene [88,89]. The remaining two highlighted bands in Figure 3 are the D + G bands at about 2896 cm−1, which is the combined overtone of both the D band and G band, and the 2G band at 3188 cm−1 which, similarly, is the overtone of the G band [90,91]. After functionalisation, the intensity of the G band increased, and peaks also have been slightly shifted compared to the pure rGO, which shows the structural changes on the surface of graphene. The intensity ratio of the D and G bands (ID/IG) for developed graphene oxide, reduced graphene oxide, and functionalised graphene are 1.24, 1.67 and 1.19, respectively. A higher ID/IG ratio ensured that there were more defects on graphene [92]. The ratio I2D/IG is dependent on the number of graphene layers. Ratios above 1 represented bilayer and monolayer graphene, while an I2D/IG ratio lower than 1 demonstrated multilayer graphene [93,94,95]. The I2D/IG ratio for reduced graphene oxide before and after functionalisation was found to be 0.36 and 0.64, respectively, where both show multilayer graphene structure.
While SEM analysis can be used to determine the morphology, dispersion and size of the nanoparticles, EDS can deliver qualitative analysis, which can provide information about the elemental composition of our samples. Figure 4a shows the typical graphene oxide 2D morphology. After the first treatment with indium and acidic solution (Figure 4b), reduction caused graphene layers to aggregate on top of each other. Figure 4c clearly shows indium oxide nanoparticles completely covered graphene layers through a successful functionalisation. EDS also shows how a first treatment with indium and acidic solution helped with increasing the C/O ratio and eliminating other impurities; it also confirms that indium did not remain on the graphene after the reduction procedure (Figure 4b). The EDS graph in Figure 4c confirms the presence of indium on the surface along with a spike in the amount of oxygen found on the surface, which could have been caused mainly by In2O3 and partially by the addition of few alcohol groups to the graphene itself, as previously discussed with FTIR graphs.
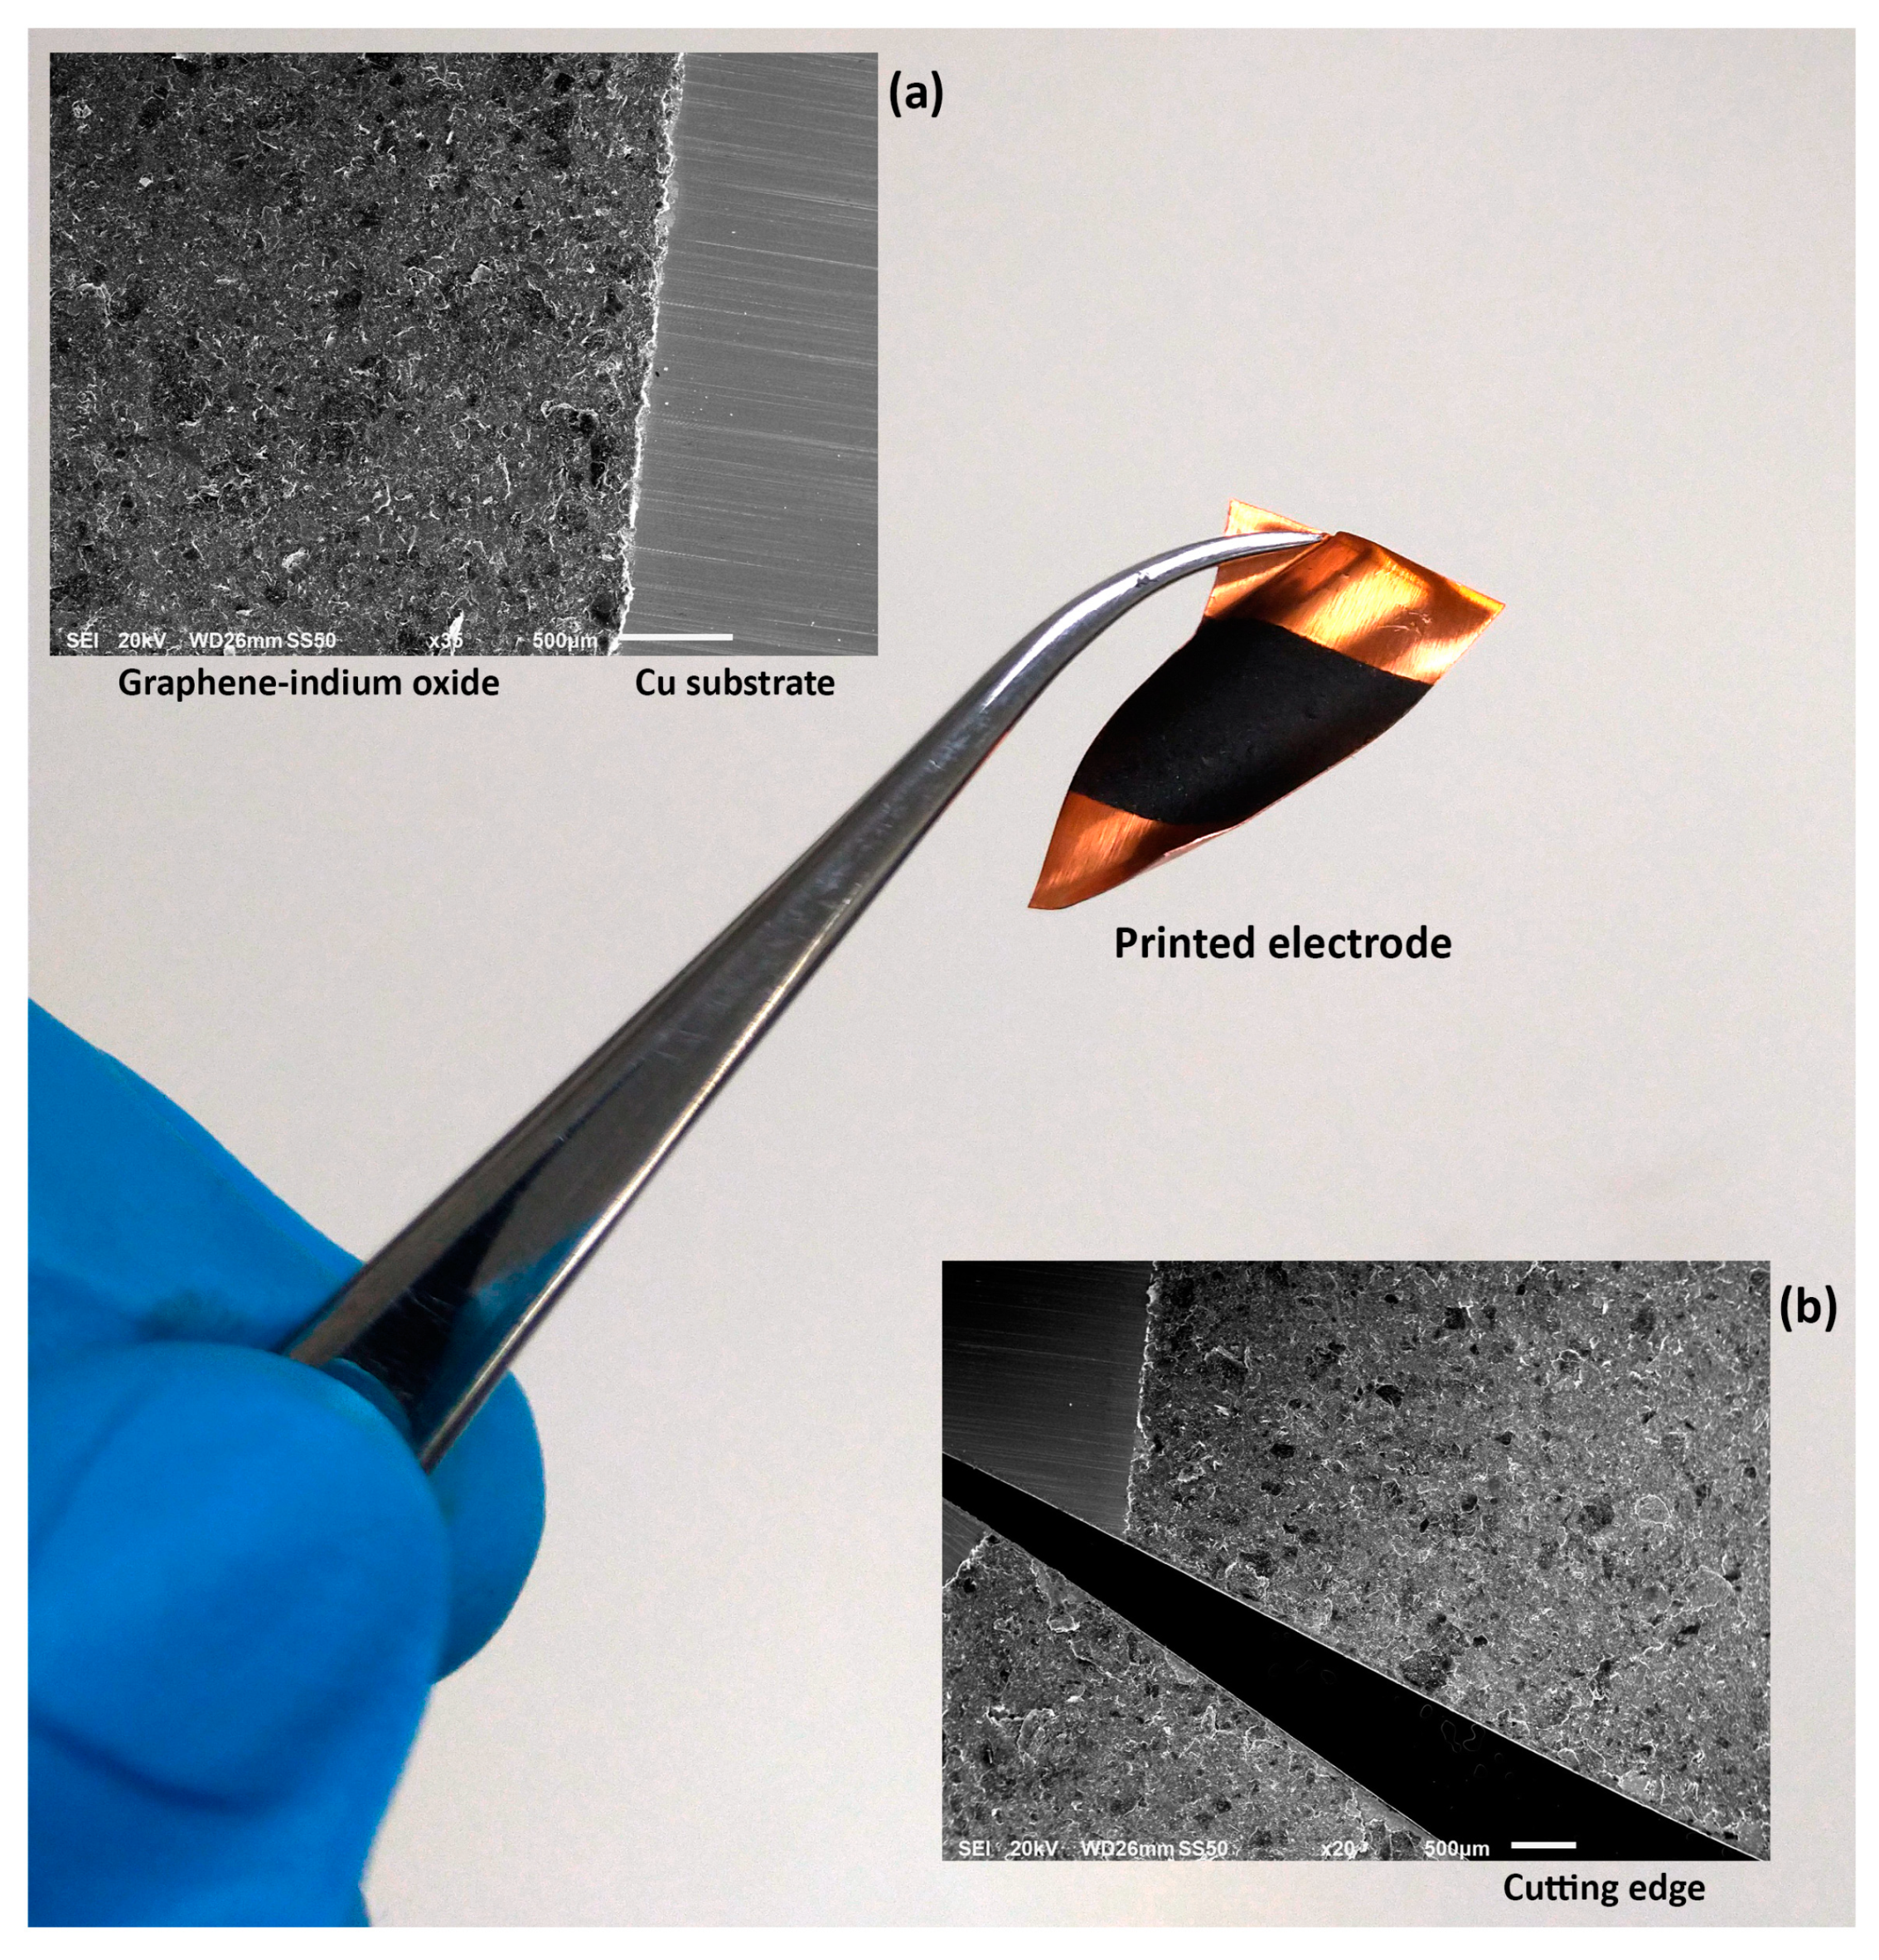
SEM images in Figure 5 studied the surface of the printed electrodes on the copper substrate. It illustrates how well the printed sensor can hold its structure after experiencing mechanical tensions (cutting and bending) where the printed composite did not show any significant change after going through multiple mechanical tests.
Cyclic voltammetry measurements (CVs) were obtained for the electrochemical sensor in pure water and various ethanol standards (concentrations ranged from 0.1 mol/L to 1.4 mol/L). The potential range used for all solutions was from −1.50 to +1.50 V vs. Ag/AgCl at a various scan rate between 10 and 130 mV/s (E step: 10 mV). For each one of the measurements reported in this paper, a new electrode was used. Scans showed an oxidation peak at the presence of ethanol. The significance of ethanol affects the response of the electrode and the intensity of the mentioned peak; the importance of other possible variables was studied using RSM.
3.2. Optimization of Sensor Efficiency Using Response Surface Methodology
The optimization of sensor efficiency was accomplished using response surface methodology. Analysing the variances (ANOVA) in the standard response surface design (i.e., CCD), was conducted on Design Expert 11.0 software to study effective parameters in the performance of an electrochemical sensor. A quadratic model was selected for this study, which offers the highest order polynomial where the additional terms are significant, and the model was not aliased. The ANOVA results in Table 3 provide information on the importance of each variable. The model F-value of 6.11 implies the model is significant and there is only a 0.09% chance that an F-value this large could occur due to noise, while p-values less than 0.05 indicate the significance of model terms [96,97] (here, B, A2, and B2 are significant terms). Values greater than 0.10 indicate the model terms are not significant. If there are many insignificant model terms (not counting those required to support hierarchy), model reduction may improve the model.
The Lack of Fit (LoF) F-value of 1.30 implies the LoF is not significant relative to the pure error and its p-value of about 0.43 confirms the suitability of the model for well-fitting of the experimental data and shows that other interactions are not significant with respect to the pure error.
The high values of R2 (0.86) and adjusted R2 (0.72) obtained from this design and modelling illustrate the high correlation between the recorded and the predicted response values. An equation is provided for sensor response, based on the data analysis (Equation (1)), that can be used to make predictions about the response for given levels of each factor.
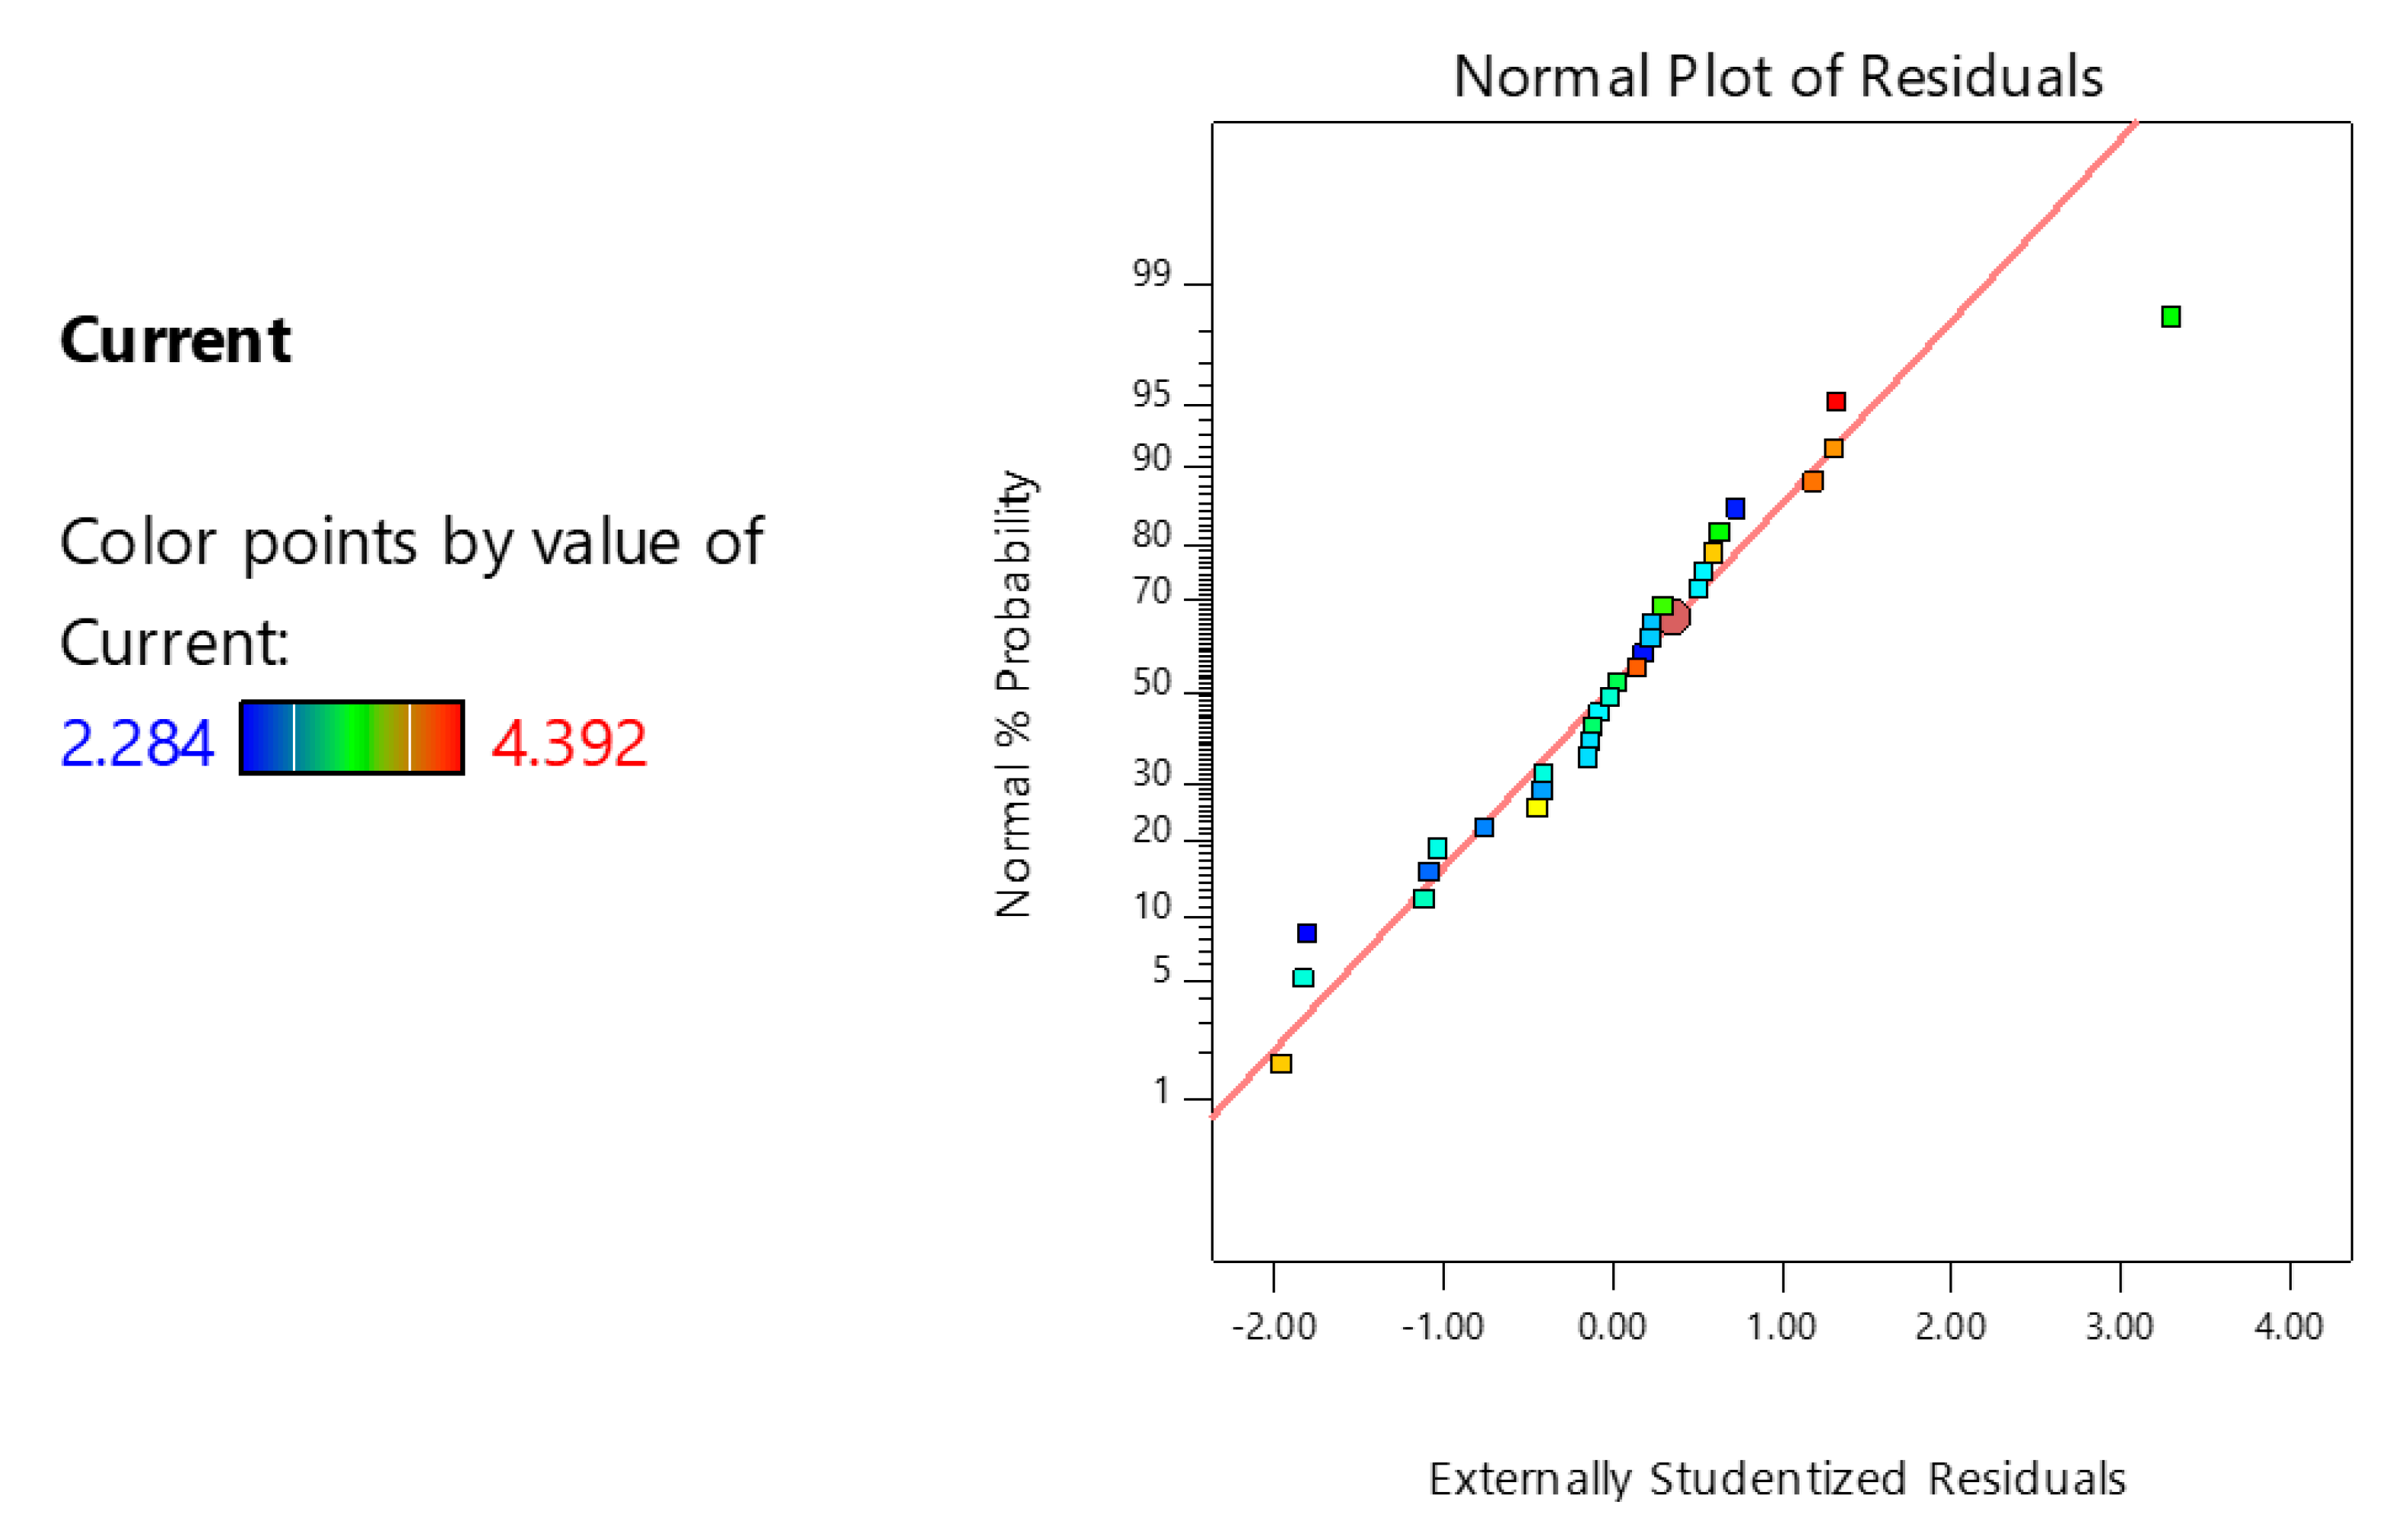
Normal probability plots assess the distribution of the data and indicate whether the residuals (difference between experimental and predicted value from regression) follow a normal distribution (the straight line) or not [97,98]. The normal probability plot in Figure 6 shows a satisfactory normal distribution where there are almost no serious violation of the predictions plotted, which suggests that the data are distributed normally.
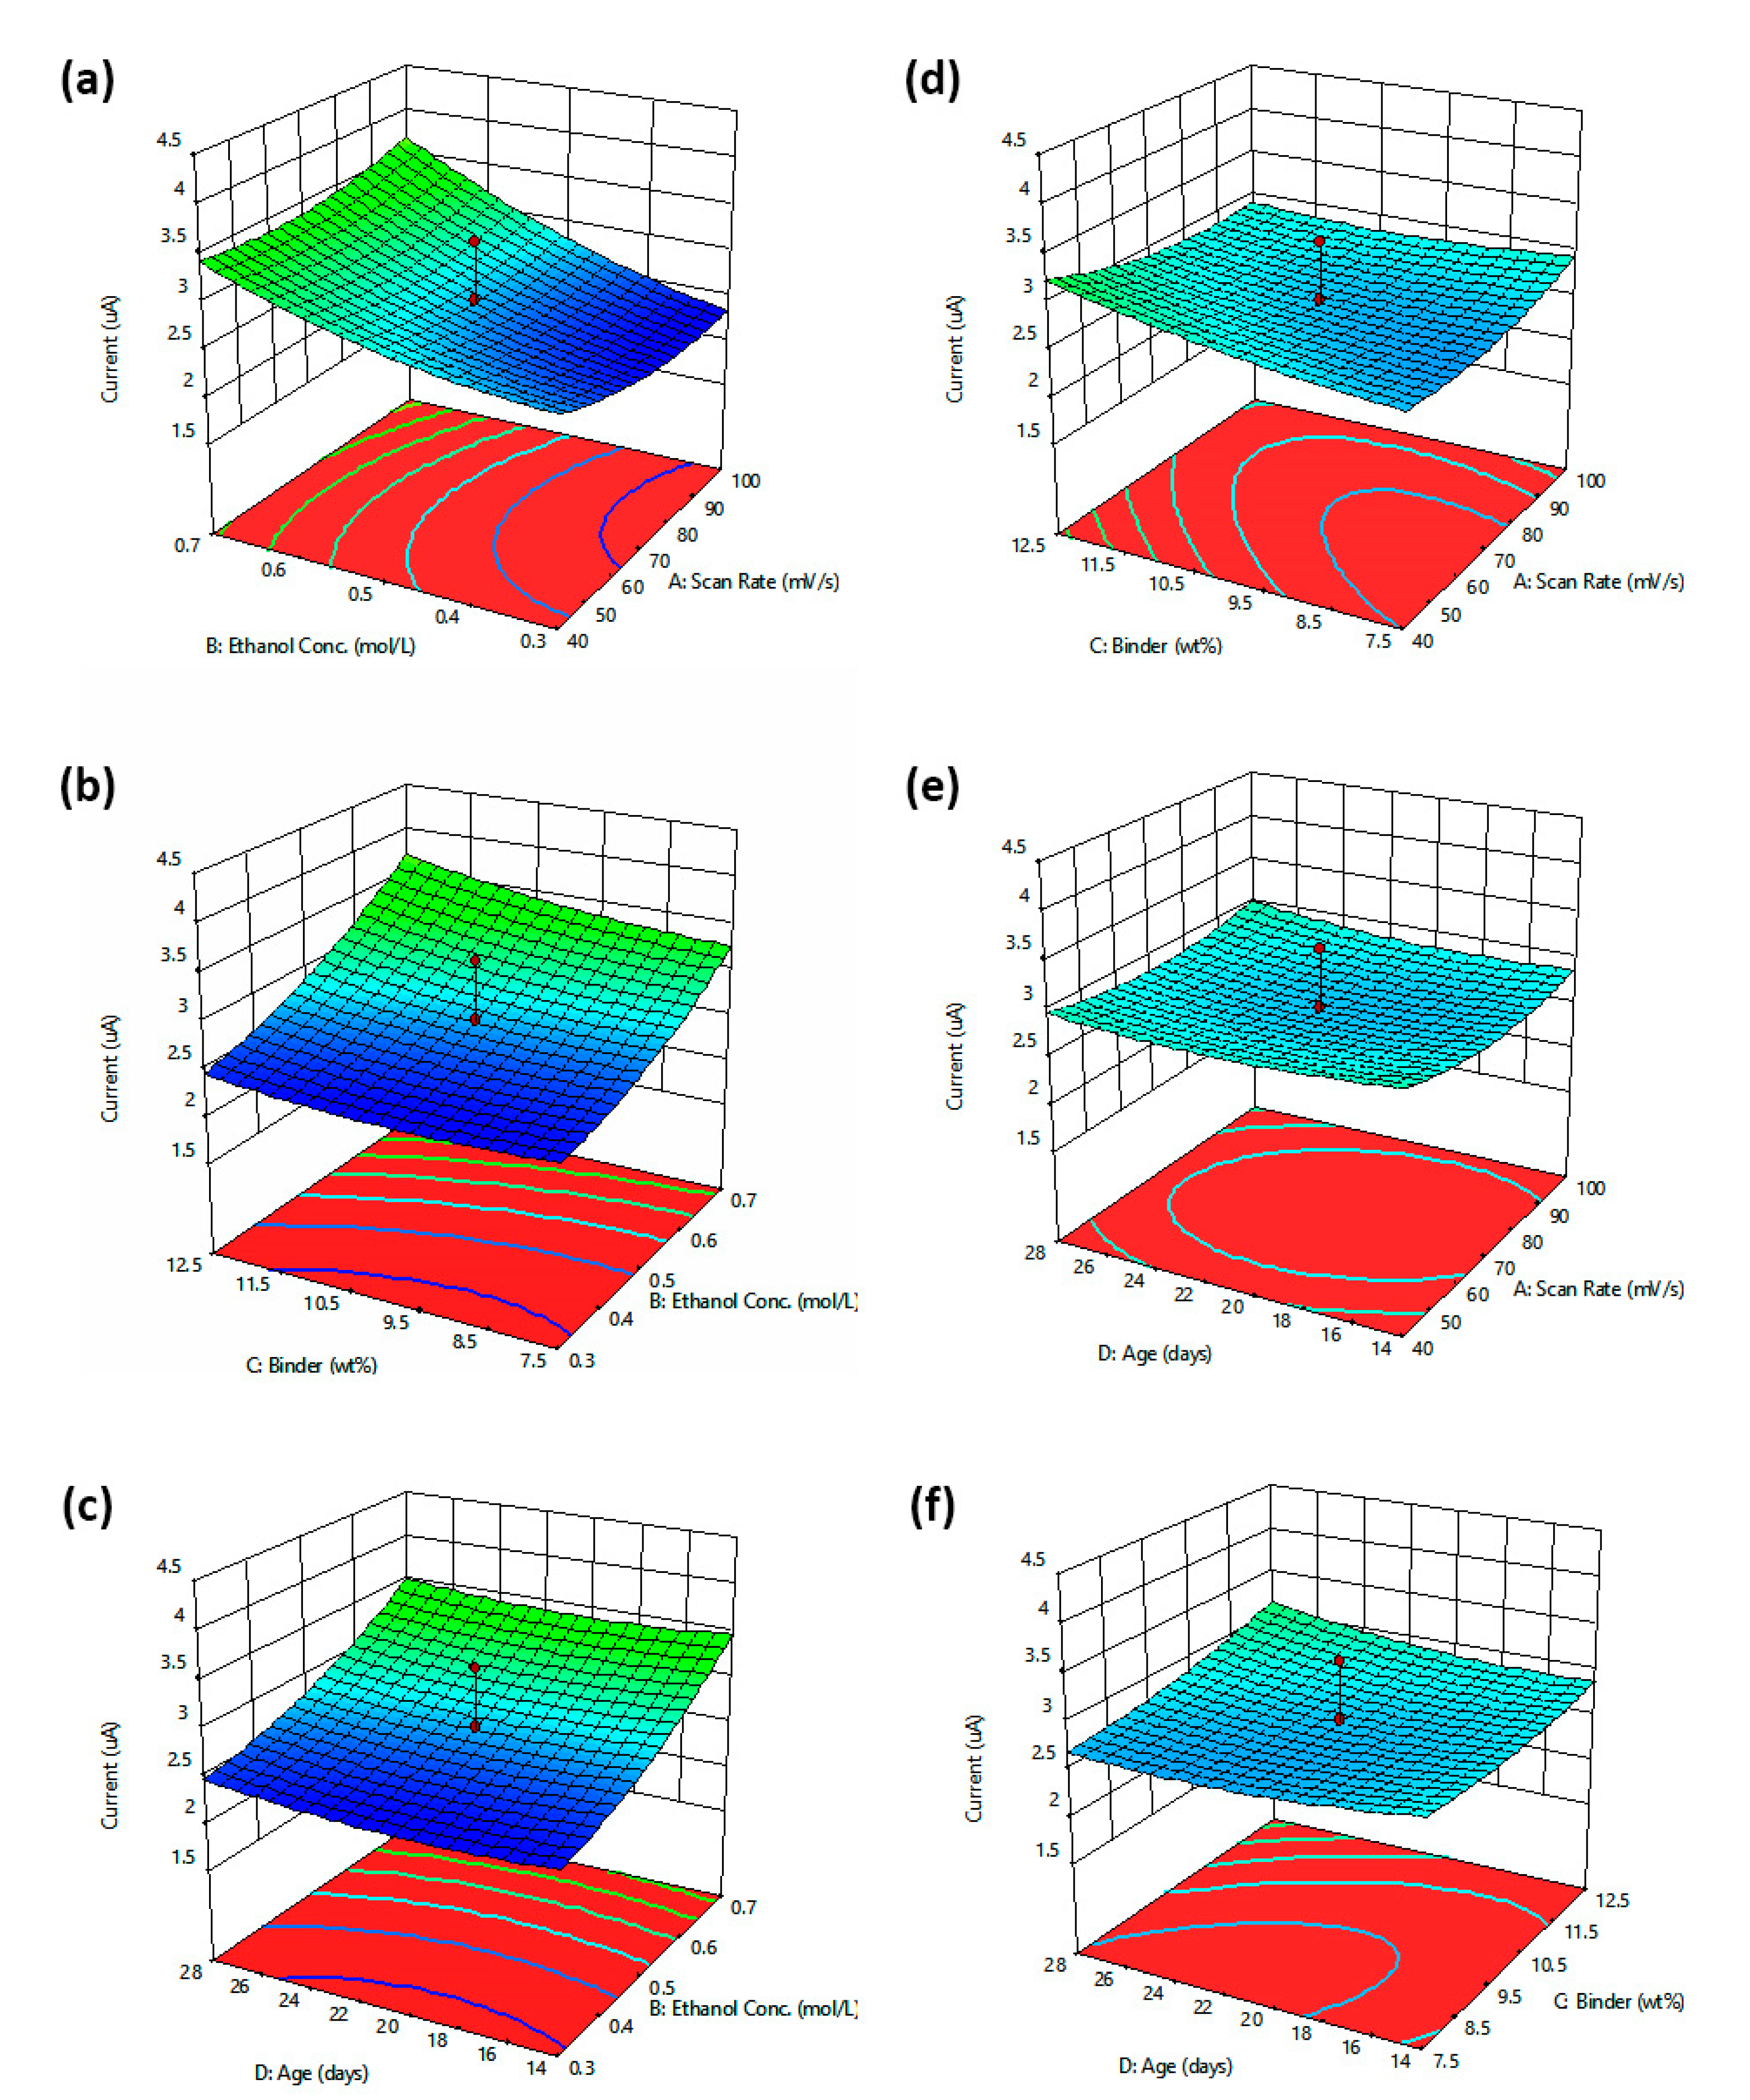
The ANOVA was then plotted in 3D graphs which leads to a surface response, corresponding to a sensor response and can be used to predict optimum points. Figure 7 outlines the relevant fitted response surfaces for the design and plots the current versus other variables. Curvatures is a sign of interactions among variables and, as seen in Figure 7, the most important variable that significantly affects the electrodes produced current is the concentration of ethanol. However, other variables could also change the strength and magnitude of sensor’s response at a certain ethanol concentration; for instance, from Figure 7a, it can be seen that for low concentrations of ethanol, a slower scan rate will generate a stronger response (current), while for higher concentrations, faster scan rates will generate more electrical current at a specific potential. Figure 7b shows that, despite the low effects of binder on the response, slightly higher amounts of binder can help with generating a stronger response. By checking the Figure 7c, the sensor seems to be indifferent to aging and produced signal at a certain concentration of ethanol. Figure 7d–f are close to flat panel, which means the interaction of other variables with each other are lower; in Figure 7d, we can see that for a lower amount of binder, the faster scan rate will respond better (it is stronger and generates more electrical current), while the electrode with higher amounts of binder will respond better at slower scans. Figure 7e shows that there are almost no significant interactions between aging and scan rate. As can be seen in Figure 7f, older electrodes with a higher amount of binder will respond better than electrodes with the same age that had less binder in their composite, which alluded to the effects of binder on extending the expiry date of the sensor.
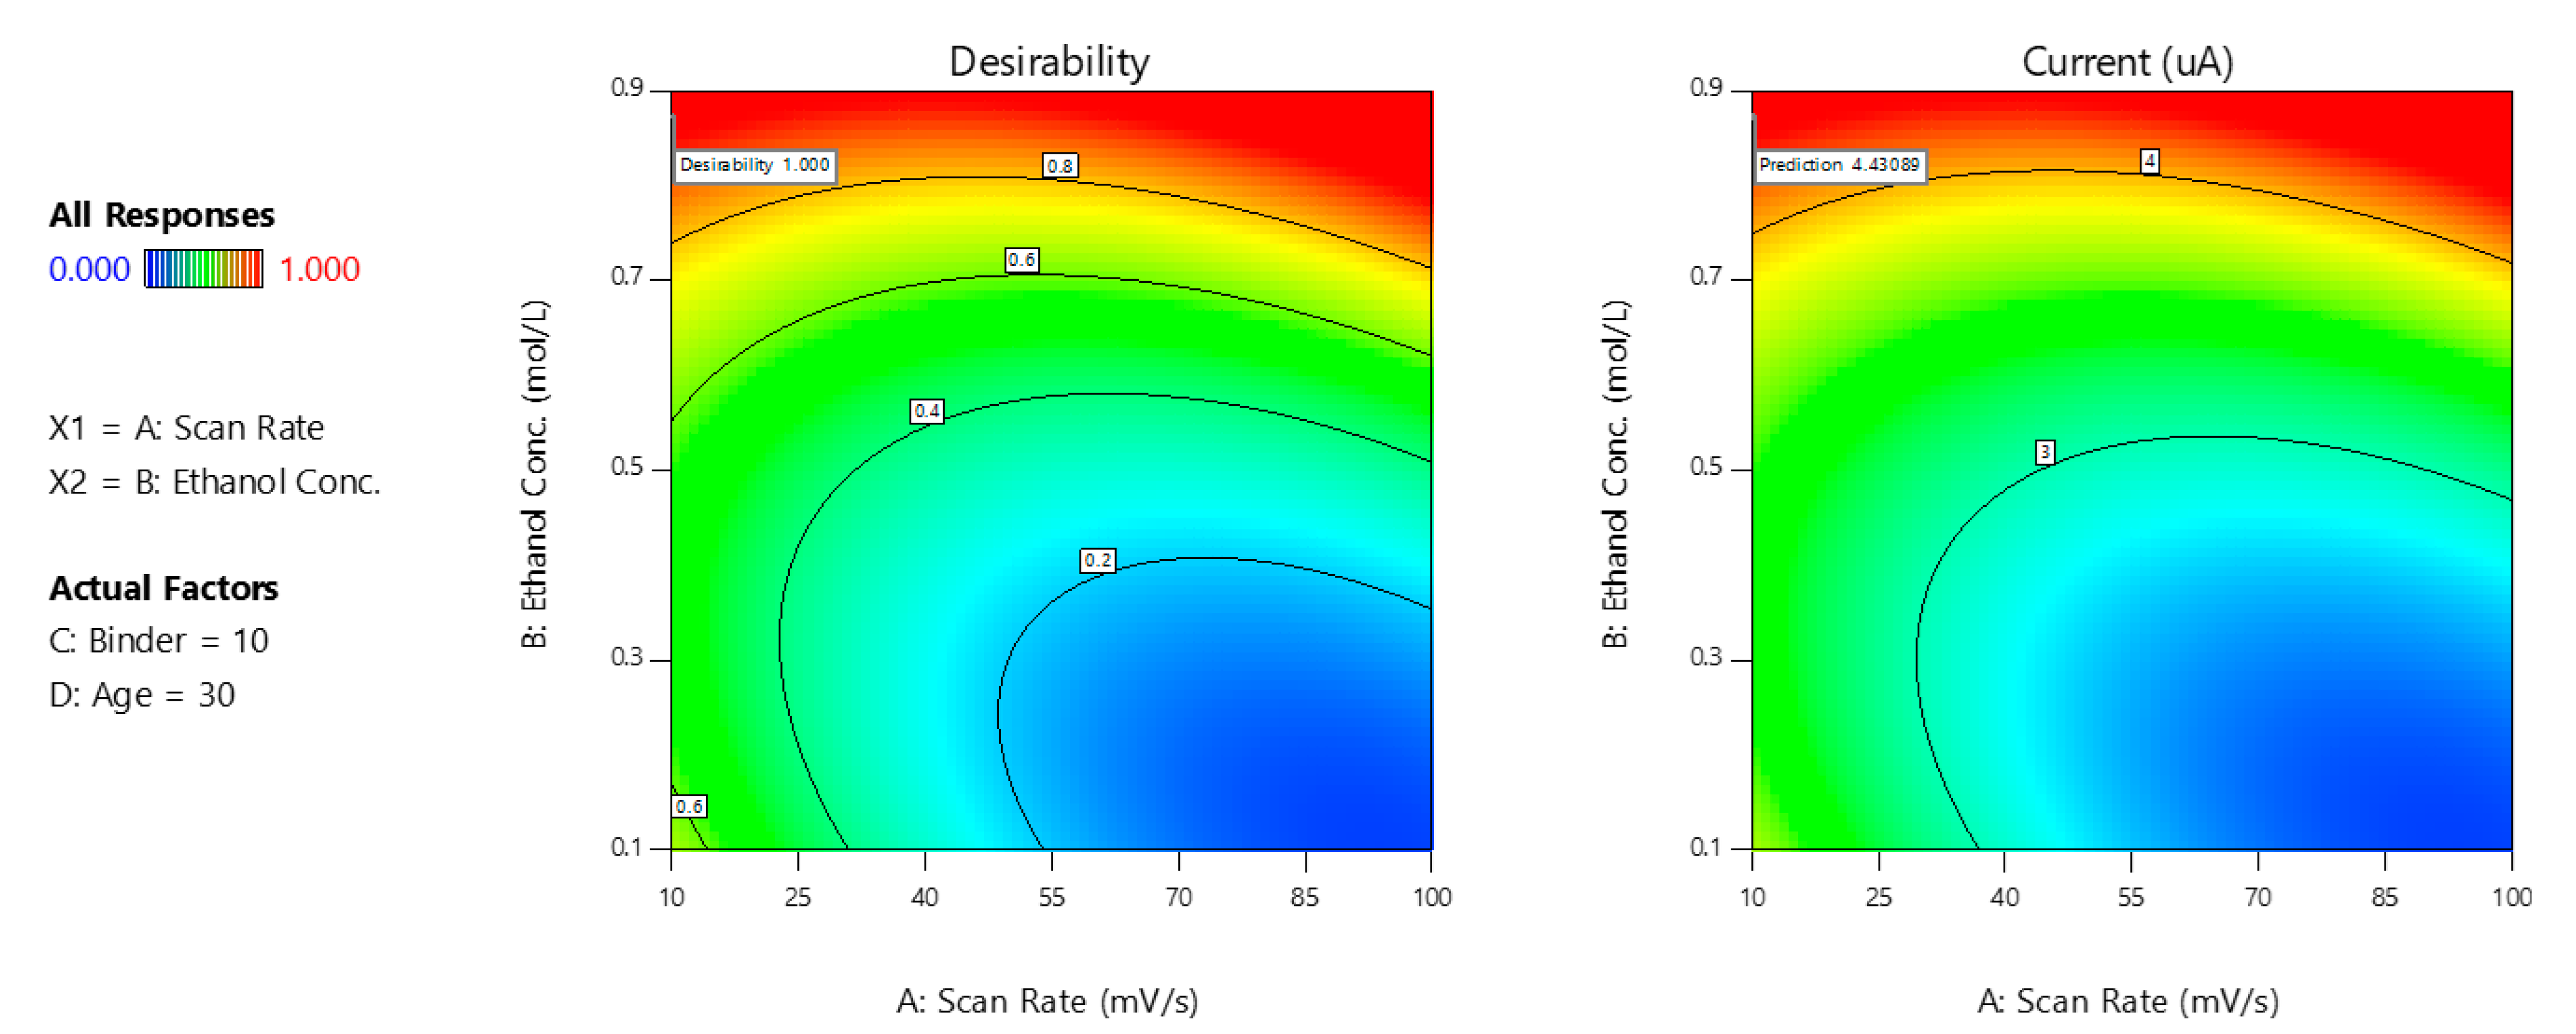
When considering optimization, the desirability scale is from 0.0 (undesirable) to 1.0 (very desirable) and the optimization profile of the same software was used to obtain solutions. The solution was selected that offers highest desirability level for one-month-old electrodes, with 10 wt% binder in them and scan rate and ethanol levels within the study range (Table 1) that will produce maximum current (Figure 8).
From the contour plot (Figure 8), we can see for electrodes with a certain age (30 days) and fixed amount of binder (10 wt%), the desirability increases by decreasing the scan rate for low concentrations and by doing fast scans for higher ethanol concentration. Due to the specific effects of scan rate on the produced current at different concentrations, a scan rate of 50 mV/s was selected for all further study, which is the fastest rate that can generate reasonably high current for the studied range of ethanol concentrations.
3.3. Post Analysis and Analytical Figures of Merit
The point prediction method from the confirmation profile of the software was applied to help with the model’s “well prediction” verification. In this method, a test point inside the model with specific variable and conditions set to that point will be selected. Then, the response of the sensor at those specific conditions will be recorded multiple times and compared with the predicted response; the outcome results at that specific point show the level of reliability of the suggested quadratic model. A scan rate of 100 mV/s, ethanol concentration of 0.5 mol/L, 10 wt% PET and 14 days age for the sensor were selected as a single combination of factors for “confirmation location”, where the average current responses of three runs at that location is compared to the prediction interval for a sample. Table 4 shows the resulting information in the confirmation table, where the confidence is 95% and it can be seen that all of the measured responses and also their mean is within the quadratic model prediction intervals which confirms the model.
The closeness of the experimental results with the predicted result by the quadratic model, as explained in Table 4, proves the model was able to adjust well and take into account possible errors with the help of centre points (space type). Other than measuring possible errors, centre points also help with the development of a modelling system that generates reproducible results; the accurate model and reproducibility of the sensor can be confirmed when the average of the experimental response of the sensor matches the average of the predicted response by the model.
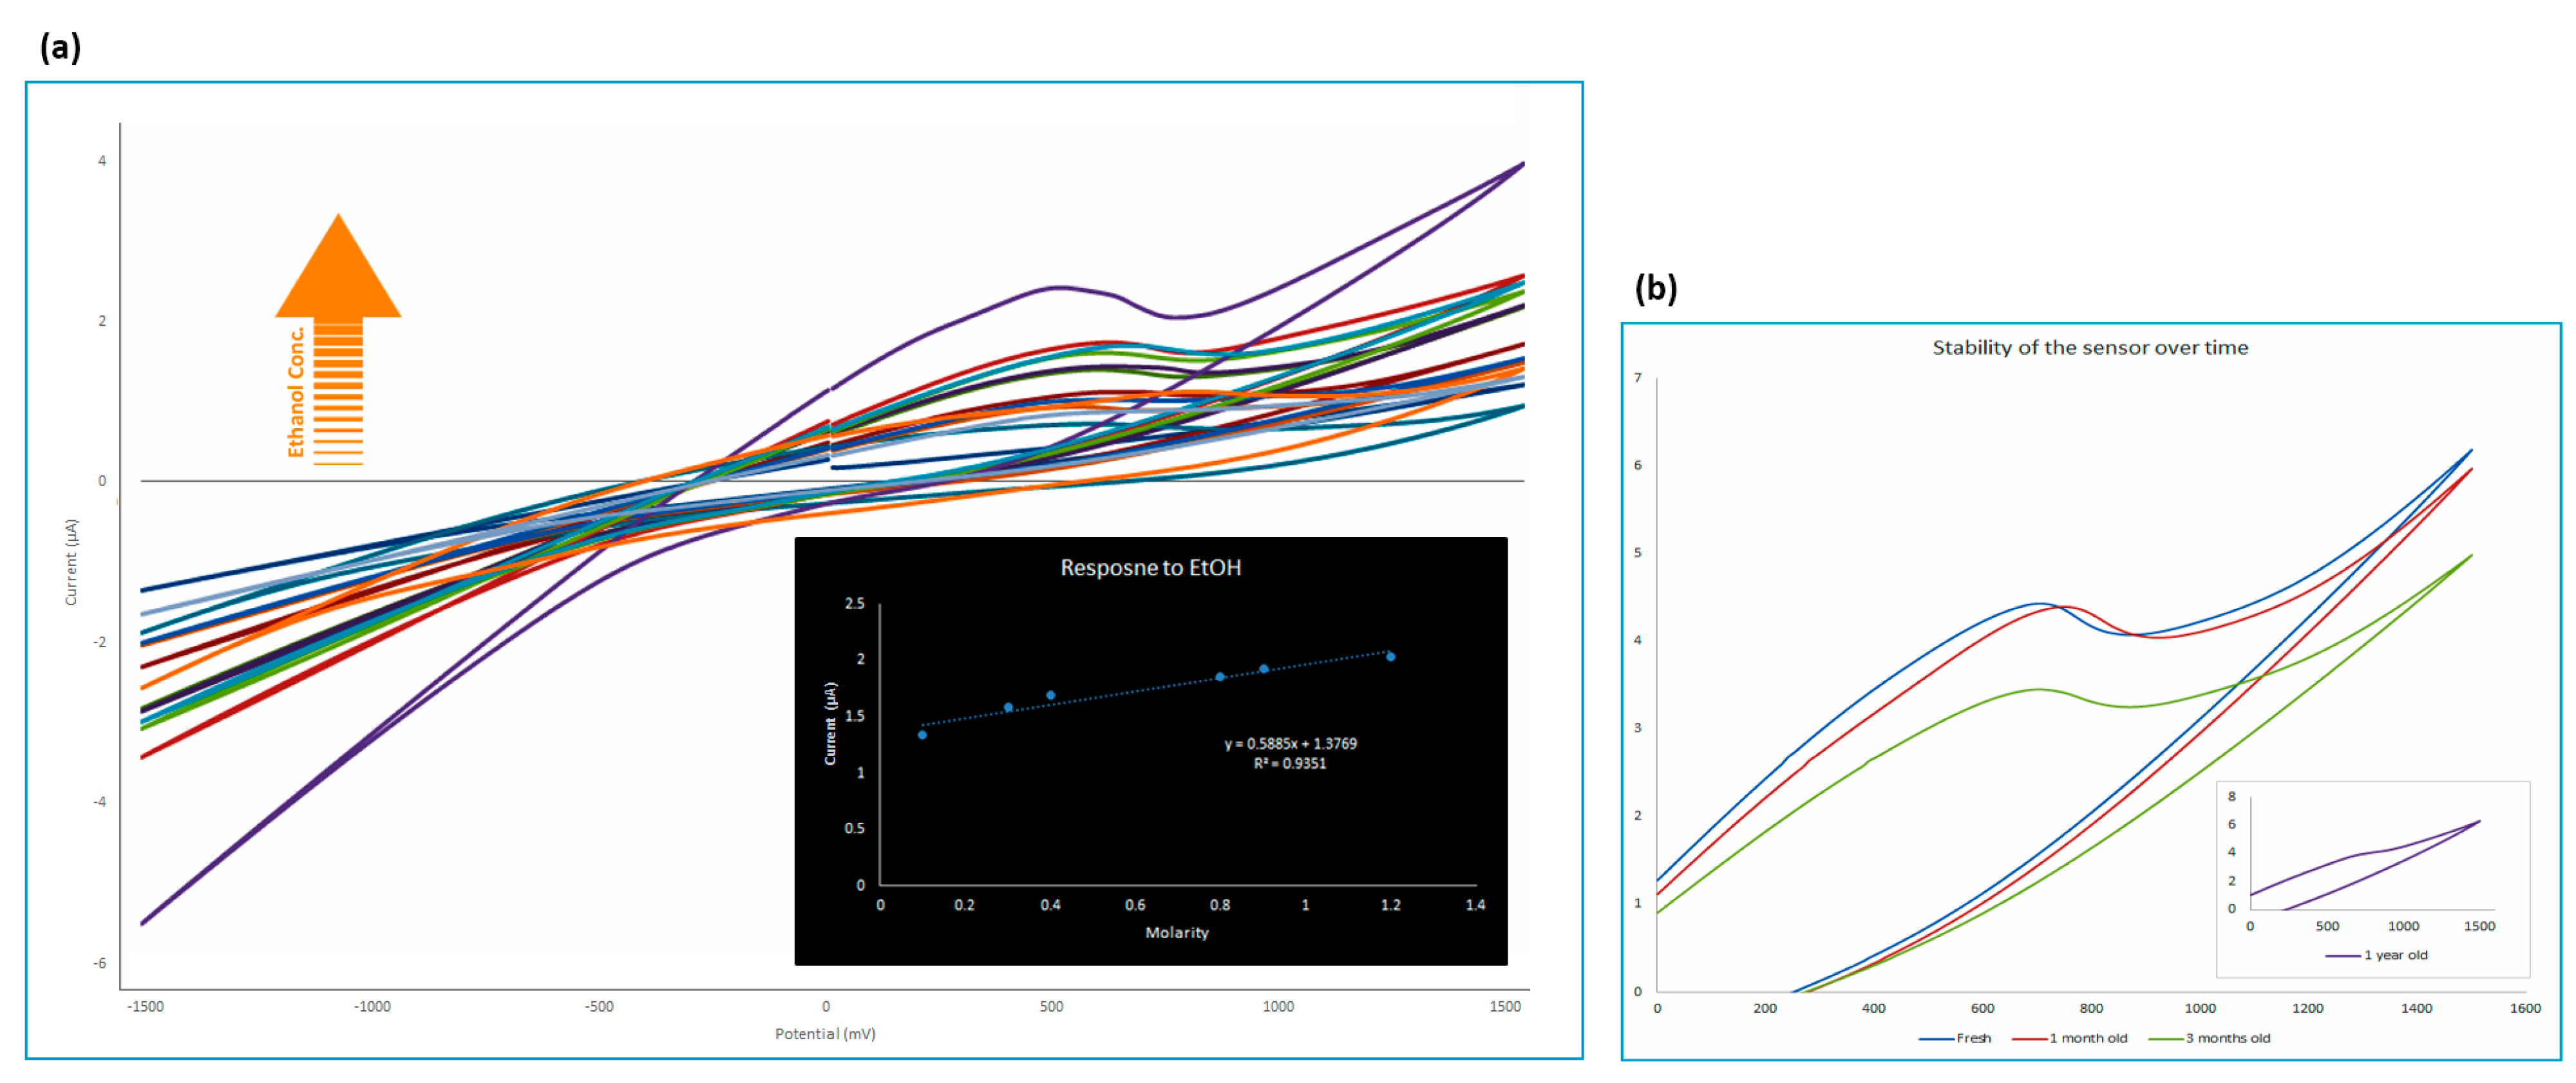
With the confidence that the developed electrode is sensitive to a range of ethanol levels, standard solutions with different concentrations of ethanol were prepared and the linear range of the sensor was found to be from 0.1 mol/L to 1.2 mol/L (Figure 9a). The limit of detection (LoD) of the sensor was calculated to be 0.068 mol/L based on 3Sb/m [99] (where m = 0.5885 is the slope of the calibration curve and Sb = 0.0196 is the standard deviation of three blank measurements); taking into account the standard deviation minimizes the possible effects of instability of the generated signal. The stability of the sensor was investigated over a 12-month period via repeat measurements of an ethanol standard at a fixed concentration. The data are shown in Figure 9b, which shows that the sensor will maintain its ability to generate a significant oxidation peak for at least 3 months; however, after several months, it slowly loses its ability to generate a significant and measurable oxidation peak.
3.4. Mechanism of Reaction
In order to investigate the mechanism of sensing response of pure rGO to ethanol compared with the graphene–In2O3 sensor, where in the presence of ethanol the oxidation peak appeared only for the latter sample. Indium proved that it has the potential to form a larger structure despite its limited bonding capacities [100]; one of the possible mechanisms of sensing that we are suggesting here is based on this potential, which could cause a catalytic interaction between indium oxide and alcohols as follows:
In2O3 + OH− ⇌ In2O3(OH) + e−
RCH2OH + In2O3 ⇌ In2O3(RCH2OH)ads
In2O3(RCH2OH)ads + In2O3(OH) → In2O3 + In2O3(R*CHOH)ads + H2O
In2O3(R*CHOH)ads + In2O3(OH) → In2O3 + In2O3(RCOH)ads + H2O
2In2O3(OH) → 2In2O3 + 2OH* → ½O2 + H2O
Or it could follow a slightly different mechanism:
In2O3 + OH− ⇌ In2O3(OH) + e−
R′CH2OH + In2O3(OH) → In2O3(OH)(R′CH2OH)ads
In2O3OH(R′CH2OH)ads + In2O3OH → In2O3 + In2O3OH(R′*CHOH)ads + H2O
In2O3OH(R′*CHOH)ads + In2O3OH → In2O3 + In2O3OH(R′COH)ads + H2O
3.5. Selectivity of the Sensor and Real Sample Analysis
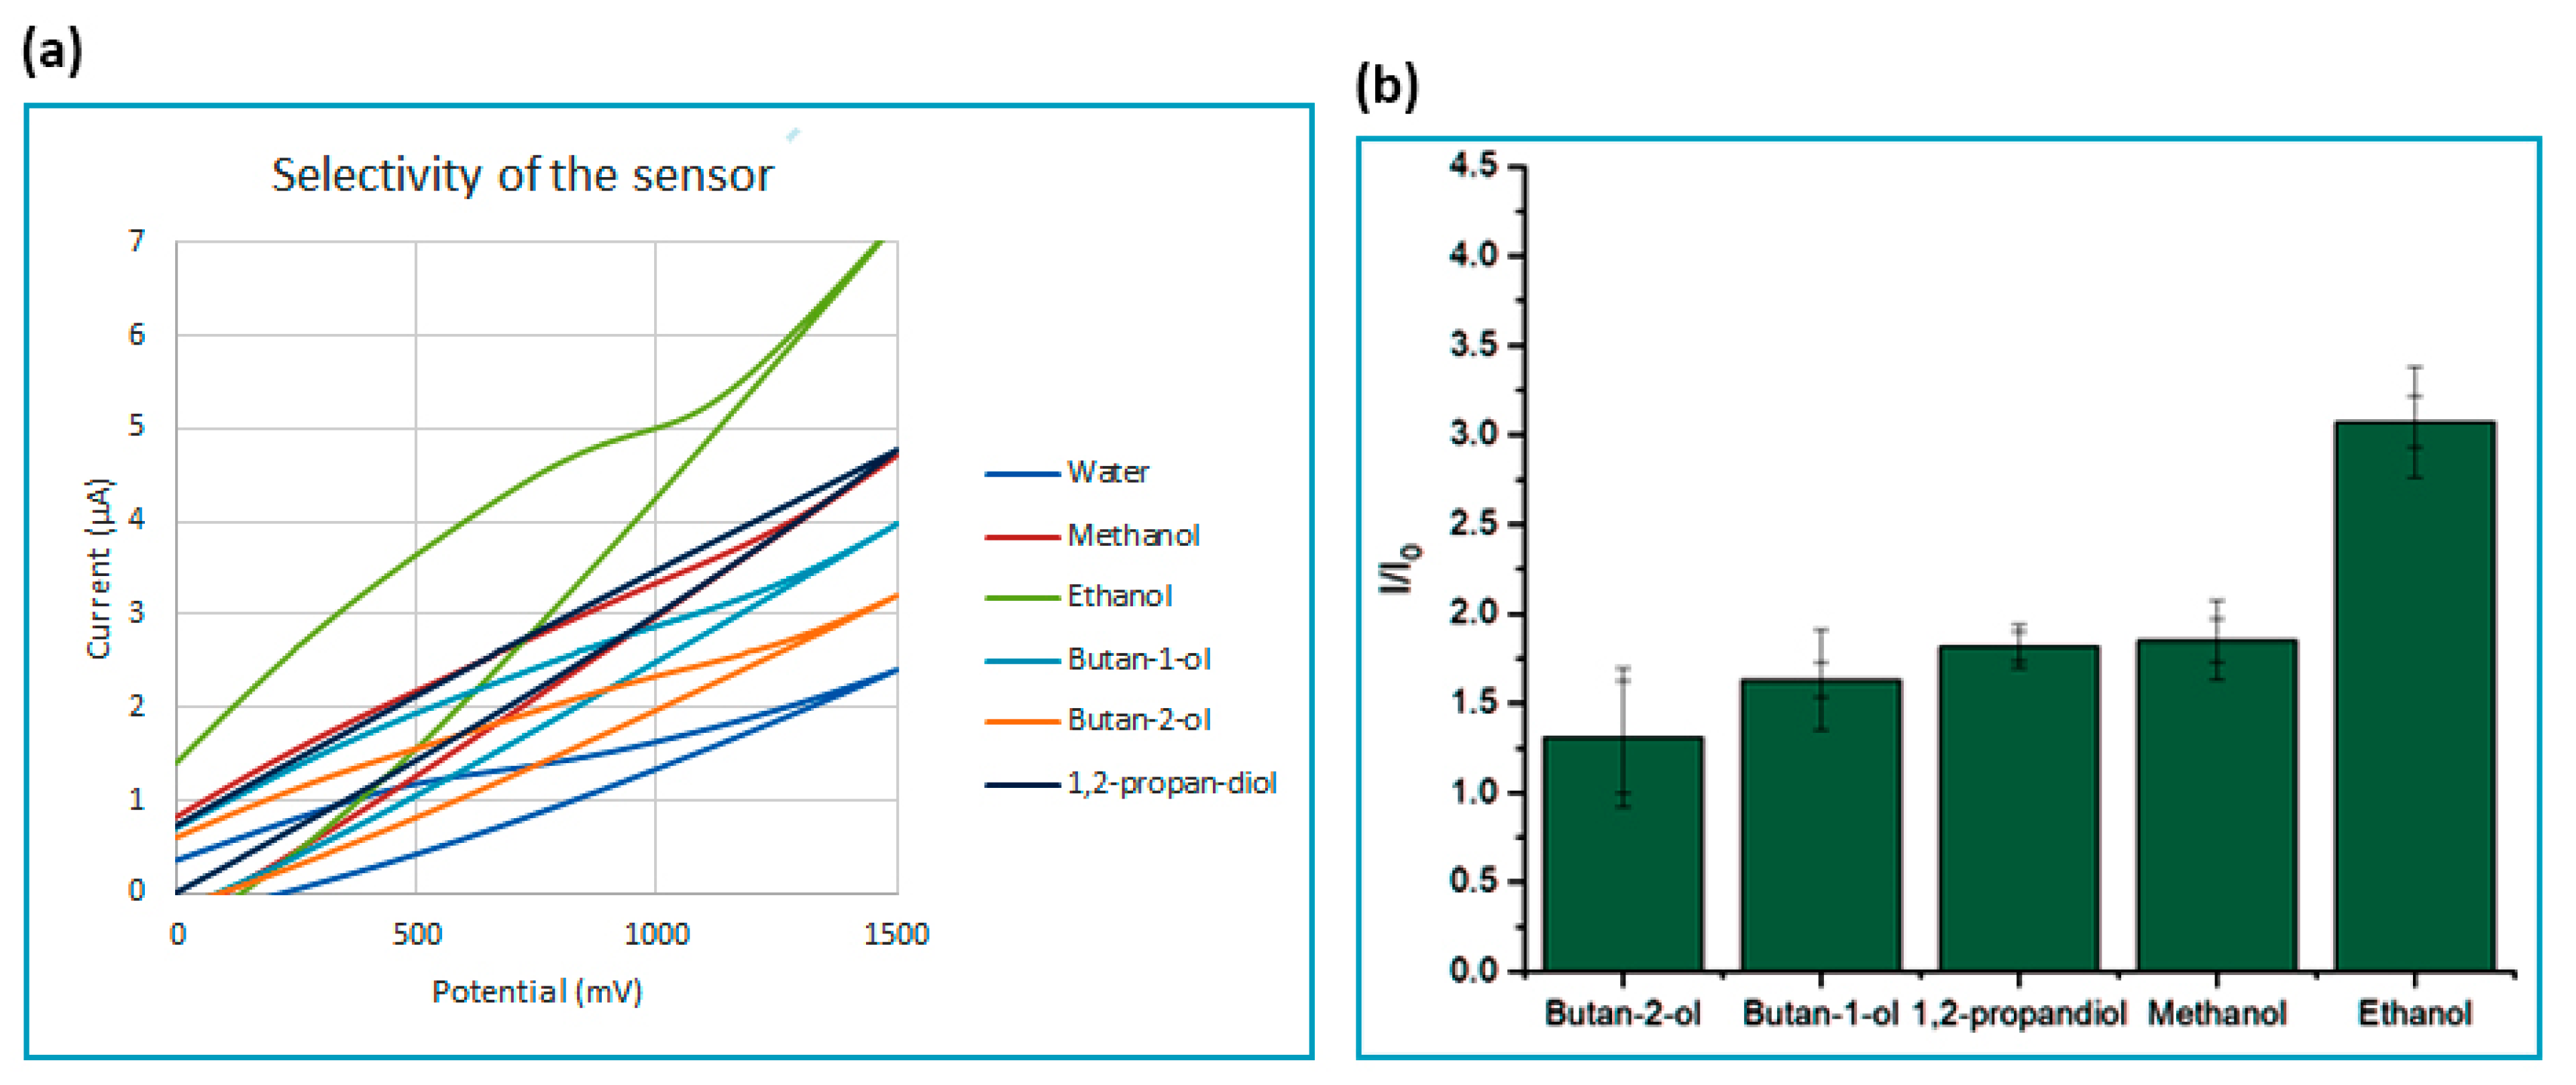
Regarding the selectivity of the developed sensor, the response of the electrode against the same concentration of different alcohols was measured. Figure 10a shows that the oxidation peak only appears in the presence of ethanol, while the other tested alcohols do not show any peaks and the sensor treats them almost the same as water. The results in Figure 10b show how the applied electrochemical sensor offers a response to ethanol that is almost double that of the other tested alcohols.
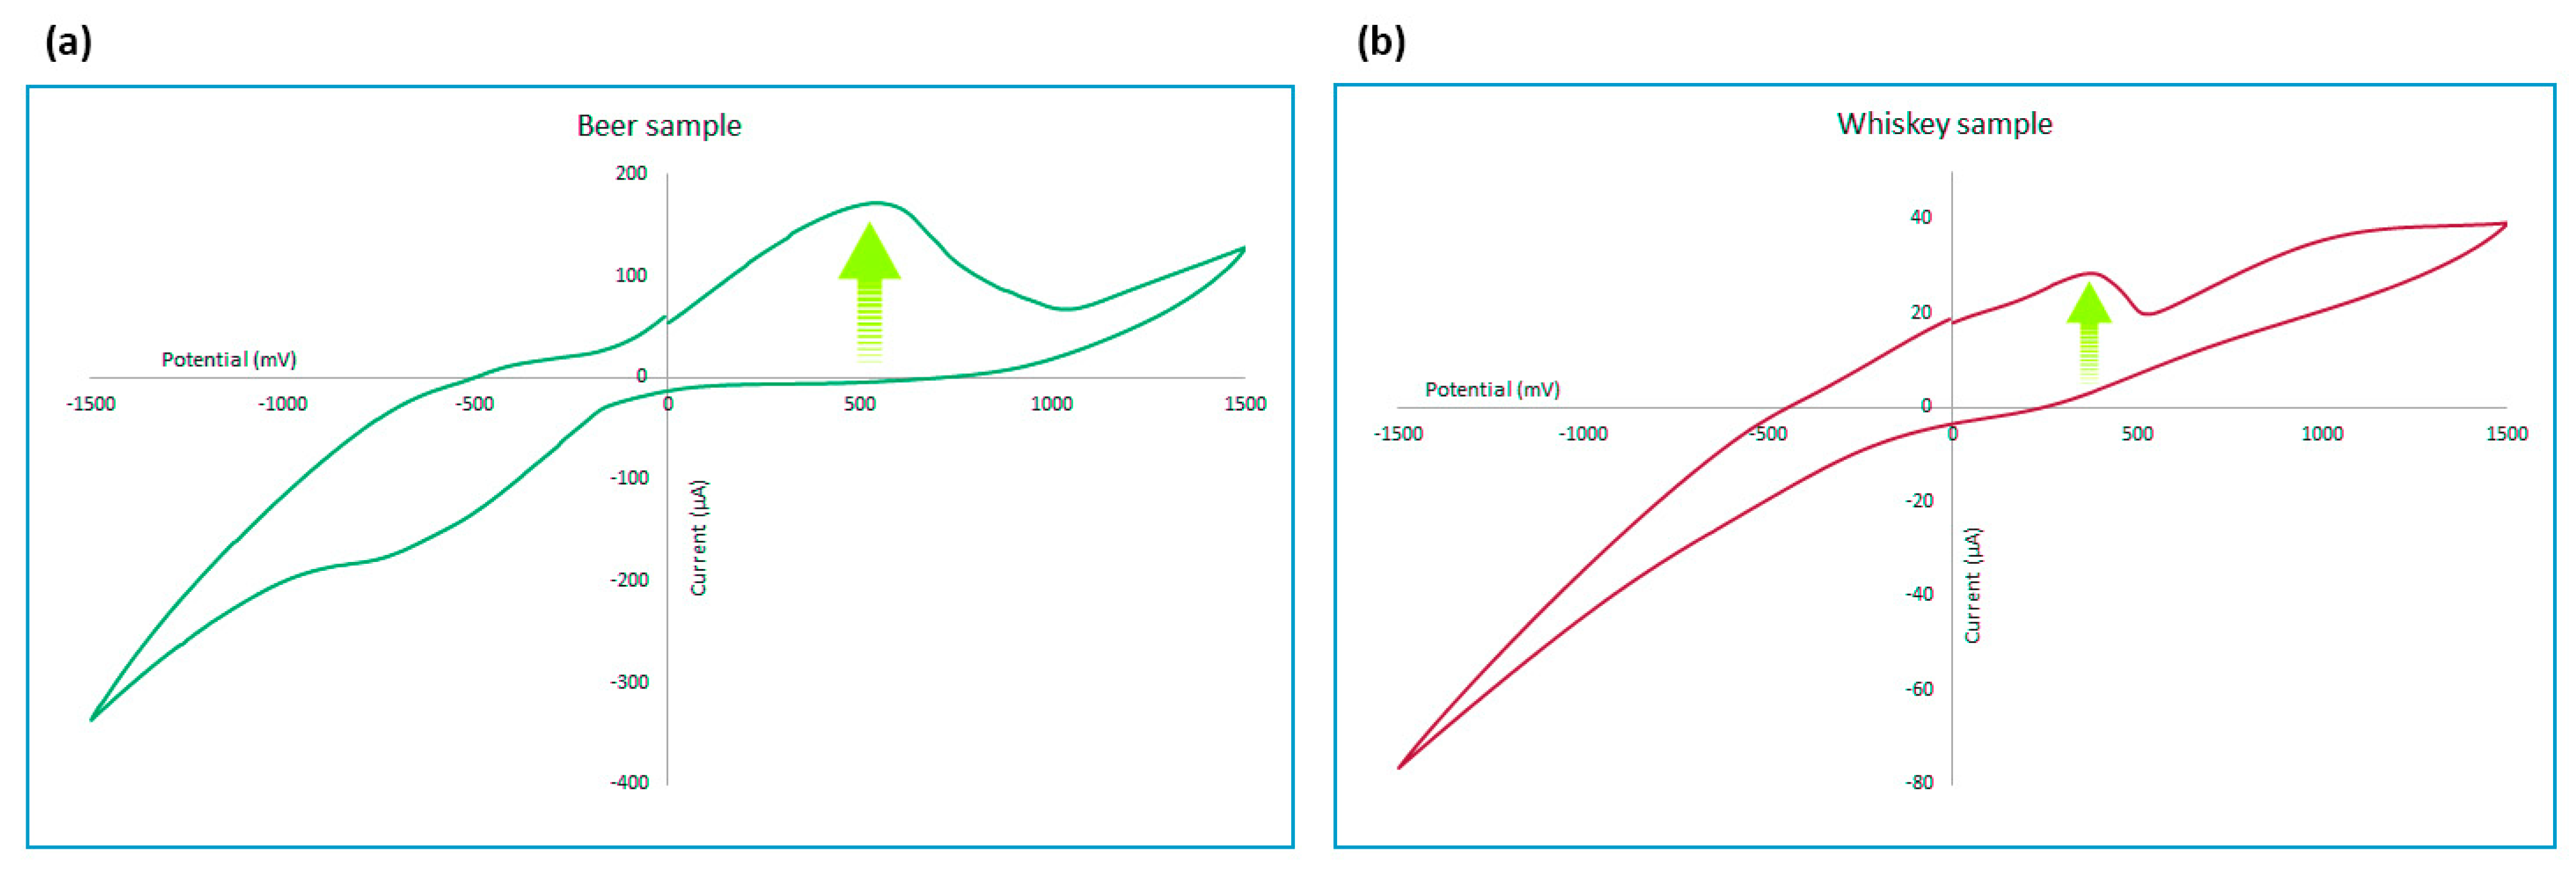
To establish validity, the fabricated electrochemical sensor based on graphene–In2O3 was applied to detect ethanol in authentic sample. Beer and whisky samples were selected for this study to monitor the behaviour of the proposed sensor in real samples, where 1.5 mL of the sample was directly and without any preparation transferred to the cell. As shown in Figure 11, an obvious response in the form of a significant oxidation peak appeared close to the same potential demonstrated in ethanol standard solutions was triggered. This proved the sensitivity and selectivity of the developed electrochemical sensor towards ethanol and its applications in detecting ethanol in complex aqueous samples. The difference between the shape of the graph, intensity, and small shifts in the oxidation peak location for each real sample in comparison with previously tested standards occurs due to the differences between the electrolyte, as some matrices can offer better conductivity by being saturated with more ions compared to other samples. That is why the ethanol oxidation peak for beer is much higher than standards, as the standards only contain water and ethanol. The tested whisky sample was instead saturated with sugar (honey), which does not dissociate into ions when dissolved in water and is a non-electrolyte. However, it is important to note that the sensor can be tuned based on the real sample matrix, by preparing standards diluted in a similar matrix to that of the real sample and recalibrate based on that. Here, we demonstrate the selectivity and sensitivity of the sensor to ethanol and show the generation of an oxidation peak at almost the exact location that it appeared for standards.
4. Conclusions
In this work, reduced graphene oxide was simply reduced by adding indium and acid, and the developed rGO was functionalized with indium oxide through a straightforward procedure. While most of the previous studies suggested metal oxide sensors detect ethanol in volatile vapours by monitoring the changes in the resistance of the sensor, indium-oxide-functionalized graphene showed application for sensing ethanol in aqueous media using cyclic voltammetry. A response surface modelling analysis based on the CCD approach was applied to evaluate, predict, and optimize the electrochemical sensor. The individual and interaction effects of four variables, including ethanol concentration, scan rate, amount of binder and age of the electrode were modelled and optimized. The electrochemical results show good performance towards ethanol oxidation between 0.1 and 1.2 mol/L concentrations with a detection limit of 0.068 mol/L. This graphene–In2O3 electrode offers several substantial advantages, such as the simplicity of synthesis and printing, low cost, and strong stability, which make it a good choice for the detection of ethanol in a range of samples.
Author Contributions
Conceptualization, R.B. and R.P.; methodology, R.B.; software, R.B. and R.P.; validation, R.B. and R.P.; formal analysis, R.B.; investigation, R.B. and R.P.; resources, R.B. and R.P.; data curation, R.B. and R.P.; writing—original draft preparation, R.B.; writing—review and editing, R.B. and R.P.; visualization, R.B. and R.P.; supervision, R.P.; project administration, R.B. and R.P.; funding acquisition, R.P. All authors have read and agreed to the published version of the manuscript.
Funding
Surescreen Diagnostics. Ref: 10757.
Acknowledgments
We wish to express our warmest thanks to Amor Abdelkader from Department of Engineering, University of Cambridge, UK, for his guidance on studying our graphene-based sensor with cyclic voltammetry. Additionally, a very special thanks to Steven Hinder from Department of Mechanical Engineering Sciences, University of Surrey, UK, for kindly supporting us by providing the XPS results of the sample.
Conflicts of Interest
The authors declare no conflict of interest.
References
- Yarita, T.; Nakajima, R.; Otsuka, S.; Ihara, T.; Takatsu, A.; Shibukawa, M. Determination of ethanol in alcoholic beverages by high-performance liquid chromatography–flame ionization detection using pure water as mobile phase. J. Chromatogr. A 2002, 976, 387–391. [Google Scholar] [CrossRef]
- Vonach, R.; Lendl, B.; Kellner, R. High-performance liquid chromatography with real-time Fourier-transform infrared detection for the determination of carbohydrates, alcohols and organic acids in wines. J. Chromatogr. A 1998, 824, 159–167. [Google Scholar] [CrossRef]
- Wang, M.-L.; Choong, Y.-M.; Su, N.-W.; Lee, M.-H. A rapid method for determination of ethanol in alcoholic beverages using capillary gas chromatography. J. Food Drug Anal. 2003, 11, 133–140. [Google Scholar] [CrossRef]
- Apers, S.; Van Meenen, E.; Pieters, L.; Vlietinck, A.J. Quality control of liquid herbal drug preparations: Ethanol content and test on methanol and 2-propanol. J. Pharm. Biomed. Anal. 2003, 33, 529–537. [Google Scholar] [CrossRef]
- Mendes, L.S.; Oliveira, F.C.; Suarez, P.A.; Rubim, J.C. Determination of ethanol in fuel ethanol and beverages by Fourier transform (FT)-near infrared and FT-Raman spectrometries. Anal. Chim. Acta 2003, 493, 219–231. [Google Scholar] [CrossRef]
- Tipparat, P.; Lapanantnoppakhun, S.; Jakmunee, J.; Grudpan, K. Determination of ethanol in liquor by near-infrared spectrophotometry with flow injection. Talanta 2001, 53, 1199–1204. [Google Scholar] [CrossRef]
- Boyaci, I.H.; Genis, H.E.; Guven, B.; Tamer, U.; Alper, N. A novel method for quantification of ethanol and methanol in distilled alcoholic beverages using Raman spectroscopy. J. Raman Spectrosc. 2012, 43, 1171–1176. [Google Scholar] [CrossRef]
- Thangamani, G.J.; Deshmukh, K.; Chidambaram, K.; Ahamed, M.B.; Sadasivuni, K.K.; Ponnamma, D.; Faisal, M.; Nambiraj, N.A.; Pasha, S.K.K. Influence of CuO nanoparticles and graphene nanoplatelets on the sensing behaviour of poly(vinyl alcohol) nanocomposites for the detection of ethanol and propanol vapors. J. Mater. Sci. Mater. Electron. 2018, 29, 5186–5205. [Google Scholar] [CrossRef]
- Liang, S.; Zhu, J.; Ding, J.; Bi, H.; Yao, P.; Han, Q.; Wang, X. Deposition of cocoon-like ZnO on graphene sheets for improving gas-sensing properties to ethanol. Appl. Surf. Sci. 2015, 357, 1593–1600. [Google Scholar] [CrossRef]
- Cao, J.; Xu, Y.; Sui, L.; Zhang, X.; Gao, S.; Cheng, X.; Zhao, H.; Huo, L. Highly selective low-temperature triethylamine sensor based on Ag/Cr2O3 mesoporous microspheres. Sens. Actuators B Chem. 2015, 220, 910–918. [Google Scholar] [CrossRef]
- Yin, Z.; Sun, Z.; Wu, J.; Liu, R.; Zhang, S.; Qian, Y.; Min, Y. Facile synthesis of hexagonal single-crystalline ZnCo2O4 nanosheet arrays assembled by mesoporous nanosheets as electrodes for high-performance electrochemical capacitors and gas sensors. Appl. Surf. Sci. 2018, 457, 1103–1109. [Google Scholar] [CrossRef]
- Tan, J.; Dun, M.; Li, L.; Zhao, J.; Tan, W.; Lin, Z.; Huang, X. Synthesis of hollow and hollowed-out Co3O4 microspheres assembled by porous ultrathin nanosheets for ethanol gas sensors: Responding and recovering in one second. Sens. Actuators B Chem. 2017, 249, 44–52. [Google Scholar] [CrossRef]
- Kitagawa, Y.; Kitabatake, K.; Suda, M.; Muramatsu, H.; Ataka, T.; Mori, A.; Tamiya, E.; Karube, I. Amperometric detection of alcohol in beer using a flow cell and immobilized alcohol dehydrogenase. Anal. Chem. 1991, 63, 2391–2393. [Google Scholar] [CrossRef]
- Aydoğdu Tığ, G. Highly sensitive amperometric biosensor for determination of NADH and ethanol based on Au-Ag nanoparticles/poly(L-Cysteine)/reduced graphene oxide nanocomposite. Talanta 2017, 175, 382–389. [Google Scholar] [CrossRef] [PubMed]
- Alam, F.; Jalal, A.H.; Pala, N. Selective Detection of Alcohol Through Ethyl-glucuronide (EtG) Immunosensor Based on 2D Zinc Oxide Nanostructures. IEEE Sens. J. 2019, 19, 3984–3992. [Google Scholar] [CrossRef]
- Luo, J.; Jiang, S.; Zhang, H.; Jiang, J.; Liu, X. A novel non-enzymatic glucose sensor based on Cu nanoparticle modified graphene sheets electrode. Anal. Chim. Acta 2012, 709, 47–53. [Google Scholar] [CrossRef]
- Lachenmeier, D.W.; Godelmann, R.; Steiner, M.; Ansay, B.; Weigel, J.; Krieg, G. Rapid and mobile determination of alcoholic strength in wine, beer and spirits using a flow-through infrared sensor. Chem. Cent. J. 2010, 4, 5. [Google Scholar] [CrossRef] [Green Version]
- Wei, S.; Wang, S.; Zhang, Y.; Zhou, M. Different morphologies of ZnO and their ethanol sensing property. Sens. Actuators B Chem. 2014, 192, 480–487. [Google Scholar] [CrossRef]
- Rothschild, A.; Tuller, H.L. Gas sensors: New materials and processing approaches. J. Electroceram. 2006, 17, 1005–1012. [Google Scholar] [CrossRef]
- Tian, Y.; Li, J.; Xiong, H.; Dai, J. Controlled synthesis of ZnO hollow microspheres via precursor-template method and its gas sensing property. Appl. Surf. Sci. 2012, 258, 8431–8438. [Google Scholar] [CrossRef]
- Xu, X.; Li, C.; Pei, K.; Zhao, K.; Zhao, Z.K.; Li, H. Ionic liquids used as QCM coating materials for the detection of alcohols. Sens. Actuators B Chem. 2008, 134, 258–265. [Google Scholar] [CrossRef]
- de Lacy Costello, B.; Ewen, R.; Gunson, H.; Ratcliffe, N.M.; Spencer-Phillips, P.T.N. The development of a sensor system for the early detection of soft rot in stored potato tubers. Meas. Sci. Technol. 2000, 11, 1685. [Google Scholar] [CrossRef]
- Zeng, W.; Liu, T.; Wang, Z. UV light activation of TiO2-doped SnO2 thick film for sensing ethanol at room temperature. Mater. Trans. 2010, 51, 243. [Google Scholar] [CrossRef] [Green Version]
- Ho, J.-J.; Fang, Y.; Wu, K.; Hsieh, W.; Chen, C.; Chen, G.; Ju, M.-S.; Lin, J.-J.; Hwang, S.B. High sensitivity ethanol gas sensor integrated with a solid-state heater and thermal isolation improvement structure for legal drink-drive limit detecting. Sens. Actuators B Chem. 1998, 50, 227–233. [Google Scholar] [CrossRef]
- Yazıcı, A.; Dalbul, N.; Altındal, A.; Salih, B.; Bekaroğlu, Ö. Ethanol sensing property of novel phthalocyanines substituted with 3, 4-dihydroxy-3-cyclobuten-1, 2-dione. Sens. Actuators B Chem. 2014, 202, 14–22. [Google Scholar] [CrossRef]
- Tomassetti, M.; Angeloni, R.; Marchiandi, S.; Castrucci, M.; Sammartino, M.; Campanella, L. Direct Methanol (or Ethanol) Fuel Cell as Enzymatic or Non-Enzymatic Device, Used to Check Ethanol in Several Pharmaceutical and Forensic Samples. Sensors 2018, 18, 3596. [Google Scholar] [CrossRef] [Green Version]
- Shao, Y.; Wang, J.; Wu, H.; Liu, J.; Aksay, I.A.; Lin, Y. Graphene based electrochemical sensors and biosensors: A review. Electroanalysis 2010, 22, 1027–1036. [Google Scholar] [CrossRef]
- Kochmann, S.; Hirsch, T.; Wolfbeis, O.S. Graphenes in chemical sensors and biosensors. TrAC Trends Anal. Chem. 2012, 39, 87–113. [Google Scholar] [CrossRef]
- Boroujerdi, R.; Abdelkader, A.; Paul, R. State of the Art in Alcohol Sensing with 2D Materials. Nano-Micro Lett. 2020, 12, 33. [Google Scholar] [CrossRef] [Green Version]
- Arduini, F.; Micheli, L.; Moscone, D.; Palleschi, G.; Piermarini, S.; Ricci, F.; Volpe, G. Electrochemical biosensors based on nanomodified screen-printed electrodes: Recent applications in clinical analysis. TrAC Trends Anal. Chem. 2016, 79, 114–126. [Google Scholar] [CrossRef] [Green Version]
- Bahadır, E.B.; Sezgintürk, M.K. Applications of commercial biosensors in clinical, food, environmental, and biothreat/biowarfare analyses. Anal. Biochem. 2015, 478, 107–120. [Google Scholar] [CrossRef] [PubMed]
- Mao, H.Y.; Lu, Y.H.; Lin, J.D.; Zhong, S.; Wee, A.T.S.; Chen, W. Manipulating the electronic and chemical properties of graphene via molecular functionalization. Prog. Surf. Sci. 2013, 88, 132–159. [Google Scholar] [CrossRef]
- Teymourian, H.; Salimi, A.; Khezrian, S. Fe3O4 magnetic nanoparticles/reduced graphene oxide nanosheets as a novel electrochemical and bioeletrochemical sensing platform. Biosens. Bioelectron. 2013, 49, 1–8. [Google Scholar] [CrossRef] [PubMed] [Green Version]
- Sheng, Z.-H.; Zheng, X.-Q.; Xu, J.-Y.; Bao, W.-J.; Wang, F.-B.; Xia, X.-H. Electrochemical sensor based on nitrogen doped graphene: Simultaneous determination of ascorbic acid, dopamine and uric acid. Biosens. Bioelectron. 2012, 34, 125–131. [Google Scholar] [CrossRef]
- Antiochia, R.; Gorton, L. A new osmium-polymer modified screen-printed graphene electrode for fructose detection. Sensors Actuators B Chem. 2014, 195, 287–293. [Google Scholar] [CrossRef]
- Ruecha, N.; Rangkupan, R.; Rodthongkum, N.; Chailapakul, O. Novel paper-based cholesterol biosensor using graphene/polyvinylpyrrolidone/polyaniline nanocomposite. Biosens. Bioelectron. 2014, 52, 13–19. [Google Scholar] [CrossRef]
- Song, Y.; Luo, Y.; Zhu, C.; Li, H.; Du, D.; Lin, Y. Recent advances in electrochemical biosensors based on graphene two-dimensional nanomaterials. Biosens. Bioelectron. 2016, 76, 195–212. [Google Scholar] [CrossRef]
- Hashemzadeh, H.; Raissi, H. Covalent organic framework as smart and high efficient carrier for anticancer drug delivery: A DFT calculations and molecular dynamics simulation study. J. Phys. D Appl. Phys. 2018, 51, 345401. [Google Scholar] [CrossRef]
- Wang, C.; Yin, L.; Zhang, L.; Xiang, D.; Gao, R. Metal oxide gas sensors: Sensitivity and influencing factors. Sensors 2010, 10, 2088–2106. [Google Scholar] [CrossRef] [Green Version]
- Al-Rekabi, S.H.; Al-Wahib, A.; Sharba, M.J. The Use of Nanocomposite Au/Fe2H2O4-GO Based on Surface Plasmon Resonance to Detect Toxic Arsenic(V) in Aqueous Solution. IOP Conf. Ser. Mater. Sci. Eng. 2019, 518, 052006. [Google Scholar] [CrossRef]
- Singh, P.; Mabdullah, M.; Sagadevan, S.; Kaur, C.; Ikram, S. Highly sensitive ethanol sensor based on TiO2 nanoparticles and its photocatalyst activity. Optik 2019, 182, 512–518. [Google Scholar] [CrossRef]
- Acharyya, D.; Bhattacharyya, P. Alcohol sensing performance of ZnO hexagonal nanotubes at low temperatures: A qualitative understanding. Sens. Actuators B Chem. 2016, 228, 373–386. [Google Scholar] [CrossRef]
- Sun, X.; Hao, H.; Ji, H.; Li, X.; Cai, S.; Zheng, C. Nanocasting synthesis of In2O3 with appropriate mesostructured ordering and enhanced gas-sensing property. ACS Appl. Mater. Interfaces 2013, 6, 401–409. [Google Scholar] [CrossRef] [PubMed]
- de Lacy Costello, B.P.J.; Ewen, R.J.; Ratcliffe, N.M.; Sivanand, P.S. Thick film organic vapour sensors based on binary mixtures of metal oxides. Sens. Actuators B Chem. 2003, 92, 159–166. [Google Scholar] [CrossRef]
- Liu, X.; Jiang, L.; Jiang, X.; Tian, X.; Huang, Y.; Hou, P.; Zhang, S.; Xu, X. Design of superior ethanol gas sensor based on indium oxide/molybdenum disulfide nanocomposite via hydrothermal route. Appl. Surf. Sci. 2018, 447, 49–56. [Google Scholar] [CrossRef]
- Chen, X.; Deng, N.; Zhang, X.; Yang, Y.; Li, J.; Hong, B.; Fang, J.; Xu, J.; Jin, D.; Peng, X.; et al. Preparation of Fe-doped In2O3 gas sensing semiconductor by one-step impregnation with enhanced ethanol sensing. Chem. Phys. Lett. 2019, 722, 96–103. [Google Scholar] [CrossRef]
- Chen, X.; Deng, N.; Zhang, X.; Li, J.; Yang, Y.; Hong, B.; Jin, D.; Peng, X.; Wang, X.; Ge, H.; et al. Cerium-doped indium oxide nanosphere arrays with enhanced ethanol-sensing properties. J. Nanopart. Res. 2019, 21, 77. [Google Scholar] [CrossRef]
- Zhang, Z.; Ahmad, F.; Zhao, W.; Yan, W.; Zhang, W.; Huang, H.; Ma, C.; Zeng, J. Enhanced Electrocatalytic Reduction of CO2 via Chemical Coupling between Indium Oxide and Reduced Graphene Oxide. Nano Lett. 2019, 19, 4029–4034. [Google Scholar] [CrossRef]
- Hong, Q.; Yang, L.; Ge, L.; Liu, Z.; Li, F. Direct-laser-writing of three-dimensional porous graphene frameworks on indium-tin oxide for sensitive electrochemical biosensing. Analyst 2018, 143, 3327–3334. [Google Scholar] [CrossRef]
- Kim, I.H.; Kim, D.; Yin, M.Y.; Han, J.H.; Kwon, S.J.; Cho, E.S. Characteristics of graphene embedded indium tin oxide (ITO-graphene-ITO) transparent conductive films. Mol. Cryst. Liq. Cryst. 2018, 676, 95–104. [Google Scholar] [CrossRef]
- Chandni, U.; Henriksen, E.A.; Eisenstein, J. Transport in indium-decorated graphene. Phys. Rev. B 2015, 91, 245402. [Google Scholar] [CrossRef] [Green Version]
- Yang, J.; Strickler, J.R.; Gunasekaran, S. Indium tin oxide-coated glass modified with reduced graphene oxide sheets and gold nanoparticles as disposable working electrodes for dopamine sensing in meat samples. Nanoscale 2012, 4, 4594–4602. [Google Scholar] [CrossRef] [PubMed]
- Qin, S.; Liu, D.; Lei, W.; Chen, Y. Synthesis of an indium oxide nanoparticle embedded graphene three-dimensional architecture for enhanced lithium-ion storage. J. Mater. Chem. A 2015, 3, 18238–18243. [Google Scholar] [CrossRef]
- Parsaee, Z.; Karachi, N.; Abrishamifar, S.M.; Kahkha, M.R.R.; Razavi, R. Silver-choline chloride modified graphene oxide: Novel nano-bioelectrochemical sensor for celecoxib detection and CCD-RSM model. Ultrason. Sonochem. 2018, 45, 106–115. [Google Scholar] [CrossRef]
- Bahrani, S.; Razmi, Z.; Ghaedi, M.; Asfaram, A.; Javadian, H. Ultrasound-accelerated synthesis of gold nanoparticles modified choline chloride functionalized graphene oxide as a novel sensitive bioelectrochemical sensor: Optimized meloxicam detection using CCD-RSM design and application for human plasma sample. Ultrason. Sonochem. 2018, 42, 776–786. [Google Scholar] [CrossRef]
- Khani, R.; Ghiamati, E.; Boroujerdi, R.; Rezaeifard, A.; Zaryabi, M.H. A new and highly selective turn-on fluorescent sensor with fast response time for the monitoring of cadmium ions in cosmetic, and health product samples. Spectrochim. Acta Part A Mol. Biomol. Spectrosc. 2016, 163, 120–126. [Google Scholar] [CrossRef]
- Jagannadham, K. Thermal conductivity of indium–graphene and indium-gallium–graphene composites. J. Electron. Mater. 2011, 40, 25–34. [Google Scholar] [CrossRef]
- Zhang, D.; Wang, M.; Yang, Z. Facile fabrication of graphene oxide/Nafion/indium oxide for humidity sensing with highly sensitive capacitance response. Sens. Actuators B Chem. 2019, 292, 187–195. [Google Scholar] [CrossRef]
- Chua, C.K.; Pumera, M. Chemical reduction of graphene oxide: A synthetic chemistry viewpoint. Chem. Soc. Rev. 2014, 43, 291–312. [Google Scholar] [CrossRef]
- Fan, Z.; Wang, K.; Wei, T.; Yan, J.; Song, L.; Shao, B. An environmentally friendly and efficient route for the reduction of graphene oxide by aluminum powder. Carbon 2010, 48, 1686–1689. [Google Scholar] [CrossRef]
- Fan, Z.J.; Kai, W.; Yan, J.; Wei, T.; Zhi, L.J.; Feng, J.; Ren, Y.M.; Song, L.P.; Wei, F. Facile synthesis of graphene nanosheets via fe reduction of exfoliated graphite oxide. ACS Nano 2011, 5, 191–198. [Google Scholar] [CrossRef] [PubMed]
- Liu, P.; Huang, Y.; Wang, L. A facile synthesis of reduced graphene oxide with Zn powder under acidic condition. Mater. Lett. 2013, 91, 125–128. [Google Scholar] [CrossRef]
- Dey, R.S.; Hajra, S.; Sahu, R.K.; Raj, C.R.; Panigrahi, M.K. A rapid room temperature chemical route for the synthesis of graphene: Metal-mediated reduction of graphene oxide. Chem. Commun. 2012, 48, 1787–1789. [Google Scholar] [CrossRef] [PubMed]
- Pitts, M.R.; Harrison, J.R.; Moody, C.J. Perkin Transactions 1. Indium metal as a reducing agent in organic synthesis. J. Chem. Soc. 2001, 9, 955–977. [Google Scholar]
- Moody, C.J.; Pitts, M.R. Indium as a reducing agent: Reduction of aromatic nitro groups. Synlett 1998, 1998, 1028. [Google Scholar] [CrossRef]
- Hummers, W.S., Jr.; Offeman, R.E. Preparation of Graphitic Oxide. J. Am. Chem. Soc. 1958, 80, 1339. [Google Scholar] [CrossRef]
- Shao, G.; Lu, Y.; Wu, F.; Yang, C.; Zeng, F.; Wu, Q. Graphene oxide: The mechanisms of oxidation and exfoliation. J. Mater. Sci. 2012, 47, 4400–4409. [Google Scholar] [CrossRef]
- Asfaram, A.; Ghaedi, M.; Goudarzi, A.; Rajabi, M. Response surface methodology approach for optimization of simultaneous dye and metal ion ultrasound-assisted adsorption onto Mn doped Fe3O4-NPs loaded on AC: Kinetic and isothermal studies. Dalton Trans. 2015, 44, 14707–14723. [Google Scholar] [CrossRef]
- Kicsi, A.; Cojocaru, C.; Macoveanu, M.; Bilba, D.J. Response surface methodology applied for zinc removal from aqueous solutions using sphagnum peat moss as sorbent. J. Environ. Prot. Ecol. 2010, 11, 614–622. [Google Scholar]
- Johra, F.T.; Lee, J.-W.; Jung, W.-G. Facile and safe graphene preparation on solution based platform. J. Ind. Eng. Chem. 2014, 20, 2883–2887. [Google Scholar] [CrossRef]
- Morais, A.; Alves, J.P.C.; Lima, F.A.S.; Lira-Cantu, M.; Nogueira, A.F. Enhanced photovoltaic performance of inverted hybrid bulk-heterojunction solar cells using TiO2/reduced graphene oxide films as electron transport layers. J. Photonics Energy 2015, 5, 057408. [Google Scholar] [CrossRef]
- Moreira, V.R.; Lebron, Y.A.R.; da Silva, M.M.; de Souza Santos, L.V.; Jacob, R.S.; de Vasconcelos, C.K.B.; Viana, M.M. Graphene oxide in the remediation of norfloxacin from aqueous matrix: Simultaneous adsorption and degradation process. Environ. Sci. Pollut. Res. 2020, 27, 34513–34528. [Google Scholar] [CrossRef] [PubMed]
- Feng, K.; Zhong, J.; Zhao, B.; Zhang, H.; Xu, L.; Sun, X.; Lee, S.T. CuxCo1−xO nanoparticles on graphene oxide as a synergistic catalyst for high-efficiency hydrolysis of ammonia–borane. Angew. Chem. Int. Ed. 2016, 55, 11950–11954. [Google Scholar] [CrossRef]
- Jeon, I.Y.; Kim, S.W.; Shin, S.H.; Jung, S.M.; Baek, J.B. Forming indium-carbon (In–C) bonds at the edges of graphitic nanoplatelets. Mater. Today Adv. 2020, 6, 100030. [Google Scholar] [CrossRef]
- Khan, G.G.; Ghosh, S.; Sarkar, A.; Mandal, G.; Mukherjee, G.D.; Manju, U.; Banu, N.; Dev, B.N. Defect engineered d 0 ferromagnetism in tin-doped indium oxide nanostructures and nanocrystalline thin-films. J. Appl. Phys. 2015, 118, 074303. [Google Scholar] [CrossRef]
- Hoch, L.B.; Wood, T.E.; O’Brien, P.G.; Liao, K.; Reyes, L.M.; Mims, C.A.; Ozin, G.A. The Rational Design of a Single-Component Photocatalyst for Gas-Phase CO2 Reduction Using Both UV and Visible Light. Adv. Sci. 2014, 1, 1400013. [Google Scholar] [CrossRef] [PubMed]
- Chang, W.-C.; Kuo, C.-H.; Juan, C.-C.; Lee, P.-J.; Chueh, Y.-L.; Lin, S.-J. Sn-doped In2O3 nanowires: Enhancement of electrical field emission by a selective area growth. Nanoscale Res. Lett. 2012, 7, 1–7. [Google Scholar] [CrossRef] [Green Version]
- Loh, J.Y.; Ye, Y.; Kherani, N.P. Reactor based XPS and other in-situ studies on the Effect of Substitution of Bismuth for Indium in Defect Laden Indium Oxide Hydroxide BizIn2−zO3−x(OH)y on the Photocatalytic Hydrogenation of Carbon Dioxide. arXiv 2019, arXiv:1904.07347. [Google Scholar]
- Rani, J.; Lim, J.; Oh, J.; Kim, D.; Lee, D.; Kim, J.-W.; Shin, H.S.; Kim, J.H.; Jun, S.C. Substrate and buffer layer effect on the structural and optical properties of graphene oxide thin films. RSC Adv. 2013, 3, 5926–5936. [Google Scholar] [CrossRef]
- Gupta, B.; Kumar, N.; Panda, K.; Kanan, V.; Joshi, S.; Visoly-Fisher, I. Role of oxygen functional groups in reduced graphene oxide for lubrication. Sci. Rep. 2017, 7, 1–14. [Google Scholar] [CrossRef]
- Ciszewski, M.; Mianowski, A.; Nawrat, G.; Szatkowski, P. Reduced graphene oxide supported antimony species for high-performance supercapacitor electrodes. ISRN Electrochem. 2014, 2014, 1–7. [Google Scholar] [CrossRef]
- Larkin, P. Infrared and Raman Spectroscopy: Principles and Spectral Interpretation; Elsevier: Amsterdam, The Netherlands, 2017. [Google Scholar]
- Andrijanto, E.; Shoelarta, S.; Subiyanto, G.; Rifki, S. Facile synthesis of graphene from graphite using ascorbic acid as reducing agent. AIP Conf. Proc. 2016, 1725, 020003. [Google Scholar]
- Reich, S.; Thomsen, C. Raman spectroscopy of graphite. Philos. Trans. R. Soc. Lond. Ser. A Math. Phys. Eng. Sci. 2004, 362, 2271–2288. [Google Scholar] [CrossRef] [PubMed]
- Malard, L.M.; Pimenta, M.A.; Dresselhaus, G.; Dresselhaus, M.S. Raman spectroscopy in graphene. Phys. Rep. 2009, 473, 51–87. [Google Scholar] [CrossRef]
- Ferreira, E.M.; Moutinho, M.V.; Stavale, F.; Lucchese, M.M.; Capaz, R.B.; Achete, C.A.; Jorio, A. Evolution of the Raman spectra from single-, few-, and many-layer graphene with increasing disorder. Phys. Rev. B 2010, 82, 125429. [Google Scholar] [CrossRef] [Green Version]
- Cançado, L.G.; Jorio, A.; Ferreira, E.M.; Stavale, F.; Achete, C.A.; Capaz, R.B.; Moutinho, M.V.O.; Lombardo, A.; Kulmala, T.; Ferrari, A.C. Quantifying defects in graphene via Raman spectroscopy at different excitation energies. Nano Lett. 2011, 11, 3190–3196. [Google Scholar] [CrossRef] [Green Version]
- Ferrari, A.C.; Meyer, J.C.; Scardaci, V.; Casiraghi, C.; Lazzeri, M.; Mauri, F.; Piscanec, S.; Jiang, D.; Novoselov, K.S.; Roth, S.; et al. Raman spectrum of graphene and graphene layers. Phys. Rev. Lett. 2006, 97, 187401. [Google Scholar] [CrossRef] [Green Version]
- Ma, B.; Rodriguez, R.D.; Ruban, A.; Pavlov, S.; Sheremet, E. The correlation between electrical conductivity and second-order Raman modes of laser-reduced graphene oxide. Phys. Chem. Chem. Phys. 2019, 21, 10125–10134. [Google Scholar] [CrossRef]
- Vollebregt, S.; Ishihara, R.; Tichelaar, F.; Hou, Y.; Beenakker, C.I.M. Influence of the growth temperature on the first and second-order Raman band ratios and widths of carbon nanotubes and fibers. Carbon 2012, 50, 3542–3554. [Google Scholar] [CrossRef]
- Krishnamoorthy, K.; Veerapandian, M.; Yun, K.; Kim, S.-J. The chemical and structural analysis of graphene oxide with different degrees of oxidation. Carbon 2013, 53, 38–49. [Google Scholar] [CrossRef]
- Palaniselvam, T.; Aiyappa, H.B.; Kurungot, S. An efficient oxygen reduction electrocatalyst from graphene by simultaneously generating pores and nitrogen doped active sites. J. Mater. Chem. 2012, 22, 23799–23805. [Google Scholar] [CrossRef]
- Le, H.D.; Ngo, T.T.T.; Le, D.Q.; Nguyen, X.N.; Phan, N.M. Synthesis of multi-layer graphene films on copper tape by atmospheric pressure chemical vapor deposition method. Adv. Nat. Sci. Nanosci. Nanotechnol. 2013, 4, 035012. [Google Scholar]
- Reina, A.; Jia, X.; Ho, J.; Nezich, D.; Son, H.; Bulovic, V.; Dresselhaus, M.S.; Kong, J. Large area, few-layer graphene films on arbitrary substrates by chemical vapor deposition. Nano Lett. 2009, 9, 30–35. [Google Scholar] [CrossRef]
- Dong, X.; Wang, P.; Fang, W.; Su, C.-Y.; Chen, Y.-H.; Li, L.-J.; Huang, W.; Chen, P. Growth of large-sized graphene thin-films by liquid precursor-based chemical vapor deposition under atmospheric pressure. Carbon 2011, 49, 3672–3678. [Google Scholar] [CrossRef]
- Yetilmezsoy, K.; Saral, A. Stochastic modeling approaches based on neural network and linear–nonlinear regression techniques for the determination of single droplet collection efficiency of countercurrent spray towers. Environ. Modeling Assess. 2007, 12, 13–26. [Google Scholar] [CrossRef]
- Yetilmezsoy, K.; Demirel, S.; Vanderbei, R.J. Response surface modeling of Pb(II) removal from aqueous solution by Pistacia vera L.: Box–Behnken experimental design. J. Hazard. Mater. 2009, 171, 551–562. [Google Scholar] [CrossRef]
- Liu, H.-L.; Lan, Y.-W.; Cheng, Y.-C. Optimal production of sulphuric acid by Thiobacillus thiooxidans using response surface methodology. Process Biochem. 2004, 39, 1953–1961. [Google Scholar] [CrossRef]
- Radoi, A.; Compagnone, D.; Devic, E.; Palleschi, G. Low potential detection of NADH with Prussian Blue bulk modified screen-printed electrodes and recombinant NADH oxidase from Thermus thermophilus. Sens. Actuators B Chem. 2007, 121, 501–506. [Google Scholar] [CrossRef]
- Thauern, H.; Glaum, R. Synthesis, Crystal Structure Determination and Vibrational Spectra of Indium(II) Indium(III) Oxidephosphate, (In2)4+(In3+)2O2(PO4)2. Z. Für Anorg. Und Allg. Chem. 2004, 630, 2463–2467. [Google Scholar] [CrossRef]
Figure 1.
XPS spectra of (a) C 1s, (b) In 3d and (c) O 1s.

Figure 2.
FTIR spectra of graphene oxide, reduced graphene oxide and indium-functionalized graphene.
Figure 2.
FTIR spectra of graphene oxide, reduced graphene oxide and indium-functionalized graphene.

Figure 3.
Raman spectra of graphene oxide, reduced graphene oxide and indium-functionalized rGO.

Figure 4.
SEM and EDS results of samples separated in 3 rows: (a) graphene oxide, (b) developed reduced graphene oxide and (c) In2O3 functionalised graphene. All scale bars are 50 μm.
Figure 4.
SEM and EDS results of samples separated in 3 rows: (a) graphene oxide, (b) developed reduced graphene oxide and (c) In2O3 functionalised graphene. All scale bars are 50 μm.

Figure 5.
Surface of the printed electrode. before (a) and after (b) applying multiple mechanical tensions including bending and cutting. Both SEM scale bars are 500 μm.
Figure 5.
Surface of the printed electrode. before (a) and after (b) applying multiple mechanical tensions including bending and cutting. Both SEM scale bars are 500 μm.

Figure 6.
Normal probability plot for residuals.

Figure 7.
The 3D response surface plots for electrical current versus various variables. Graphs studies the simultaneous effects of (a) scanrate (mV/s) and ethanol concentration (mol/L), (b) binder (wt%) and ethanol concentration (mol/L), (c) age (days) and ethanol concentration (mol/L), (d) binder (wt%) and scanrate (mV/s), (e) age (days) and scanrate (mV/s), (f) age (days) and binder (wt%), on the current (μA) at the oxidation peak potential.

Figure 8.
Contour plot: representation of the response plotted against combinations of factors.

Figure 9.
Graph (a) shows electrical response of the sensor against different concentrations of ethanol in optimum conditions and the linear range. Graph (b) represents the stability of the sensor over 12 months; the sensor performs well for at least 3 months, and after 12 months its ability to generate a significant oxidation peak in the presence of the same concentration of ethanol reduces.

Figure 10.
Response of the graphene–indium oxide sensor to various alcohols. While (a) shows only ethanol has an oxidation peak at the presence of the sensor, (b) measures the response in terms of numbers; I is the recorded current at the response potential of the sensor (0.5 mol/L concentration of different alcohols) and I0 is the response of the sensor against blank (water) at the same study potential.

Figure 11.
Response of the graphene–indium oxide sensor to (a) beer and (b) whisky as authentic samples.
Figure 11.
Response of the graphene–indium oxide sensor to (a) beer and (b) whisky as authentic samples.


Table 1.
Experimental factors and levels in the central composite design.
| Notation | Factor | Unit | Range and Levels | ||||
|---|---|---|---|---|---|---|---|
| −α | −1 | 0 | +1 | +α | |||
| A | Scan Rate | mV/s | 10 | 40 | 70 | 100 | 130 |
| B | Ethanol Concentration | mol/L | 0.1 | 0.3 | 0.5 | 0.7 | 0.9 |
| C | Amount of Binder | wt% | 5 | 7.5 | 10 | 12.5 | 15 |
| D | Age of the Sensor | days | 7 | 14 | 21 | 28 | 35 |
Table 2.
Design matrix and the results of the central composite full factorial design.
| Run | A | B | C | D | Response (Current) | Space Type |
|---|---|---|---|---|---|---|
| 1 | 100 | 0.3 | 12.5 | 14 | 2.335 | Factorial |
| 2 | 100 | 0.3 | 7.5 | 14 | 2.613 | Factorial |
| 3 | 40 | 0.7 | 12.5 | 14 | 3.859 | Factorial |
| 4 | 40 | 0.3 | 12.5 | 28 | 2.981 | Factorial |
| 5 | 40 | 0.7 | 12.5 | 28 | 4.392 | Factorial |
| 6 | 100 | 0.7 | 12.5 | 28 | 4.196 | Factorial |
| 7 | 40 | 0.3 | 7.5 | 14 | 2.798 | Factorial |
| 8 | 70 | 0.5 | 10 | 21 | 2.284 | Centre |
| 9 | 100 | 0.7 | 12.5 | 14 | 3.975 | Factorial |
| 10 | 100 | 0.3 | 7.5 | 28 | 2.786 | Factorial |
| 11 | 40 | 0.7 | 7.5 | 28 | 3.177 | Factorial |
| 12 | 40 | 0.7 | 7.5 | 14 | 3.513 | Factorial |
| 13 | 70 | 0.5 | 10 | 21 | 2.742 | Centre |
| 14 | 70 | 0.5 | 10 | 21 | 2.556 | Centre |
| 15 | 70 | 0.5 | 10 | 21 | 2.747 | Centre |
| 16 | 40 | 0.3 | 7.5 | 28 | 2.688 | Factorial |
| 17 | 40 | 0.3 | 12.5 | 14 | 2.893 | Factorial |
| 18 | 100 | 0.7 | 7.5 | 28 | 4.087 | Factorial |
| 19 | 100 | 0.3 | 12.5 | 28 | 2.795 | Factorial |
| 20 | 100 | 0.7 | 7.5 | 14 | 4.157 | Factorial |
| 21 | 70 | 0.5 | 5 | 21 | 2.501 | Axial |
| 22 | 70 | 0.5 | 10 | 21 | 2.705 | Centre |
| 23 | 70 | 0.9 | 10 | 21 | 3.976 | Axial |
| 24 | 130 | 0.5 | 10 | 21 | 2.905 | Axial |
| 25 | 10 | 0.5 | 10 | 21 | 3.435 | Axial |
| 26 | 70 | 0.5 | 10 | 7 | 2.934 | Axial |
| 27 | 70 | 0.5 | 10 | 35 | 2.876 | Axial |
| 28 | 70 | 0.5 | 10 | 21 | 3.371 | Centre |
| 29 | 70 | 0.5 | 15 | 21 | 3.231 | Axial |
| 30 | 70 | 0.1 | 10 | 21 | 2.356 | Axial |
Table 3.
The ANOVA results of CCD for graphene–indium oxide electrode.
| Source | Sum of Squares | Degree of Freedom | Mean Square | F-Value | p-Value | |
|---|---|---|---|---|---|---|
| Model | 9.46 | 14 | 0.6757 | 6.11 | 0.0009 | Significant |
| A | 0.0072 | 1 | 0.0072 | 0.0656 | 0.8016 | |
| B | 6.73 | 1 | 6.73 | 60.88 | <0.0001 | |
| C | 0.3919 | 1 | 0.3919 | 3.55 | 0.0806 | |
| D | 0.0296 | 1 | 0.0296 | 0.2680 | 0.6128 | |
| AB | 0.3321 | 1 | 0.3321 | 3.01 | 0.1050 | |
| AC | 0.3280 | 1 | 0.3280 | 2.97 | 0.1069 | |
| AD | 0.0232 | 1 | 0.0232 | 0.2098 | 0.6540 | |
| BC | 0.1171 | 1 | 0.1171 | 1.06 | 0.3207 | |
| BD | 0.0043 | 1 | 0.0043 | 0.0391 | 0.8460 | |
| CD | 0.1691 | 1 | 0.1691 | 1.53 | 0.2364 | |
| A2 | 0.6946 | 1 | 0.6946 | 6.29 | 0.0251 | |
| B2 | 0.6859 | 1 | 0.6859 | 6.21 | 0.0259 | |
| C2 | 0.1896 | 1 | 0.1896 | 1.72 | 0.2114 | |
| D2 | 0.2366 | 1 | 0.2366 | 2.14 | 0.1654 | |
| Residual | 1.55 | 14 | 0.1105 | |||
| Lack of Fit | 1.18 | 10 | 0.1183 | 1.30 | 0.4310 | Not significant |
| Pure Error | 0.3641 | 4 | 0.0910 | |||
| Cor Total a | 11.16 | 29 |
a Totals of all information corrected for the mean.
Table 4.
Model confirmation results.
| Response Type | Predicted Mean | Predicted Median | Number of Runs | SE Pred a | 95% PI b Low | Data Mean | 95% PI b High |
|---|---|---|---|---|---|---|---|
| Current (µA) | 2.87068 | 2.87068 | 3 | 0.250235 | 2.33397 | 2.99267 | 3.40738 |
a SE Pred: standard deviation associated with the prediction of observations. b PI: prediction interval.
Publisher’s Note: MDPI stays neutral with regard to jurisdictional claims in published maps and institutional affiliations. |
© 2022 by the authors. Licensee MDPI, Basel, Switzerland. This article is an open access article distributed under the terms and conditions of the Creative Commons Attribution (CC BY) license (https://creativecommons.org/licenses/by/4.0/).
Share and Cite
MDPI and ACS Style
Boroujerdi, R.; Paul, R. Introducing Graphene–Indium Oxide Electrochemical Sensor for Detecting Ethanol in Aqueous Samples with CCD-RSM Optimization. Chemosensors 2022, 10, 42. https://doi.org/10.3390/chemosensors10020042
AMA Style
Boroujerdi R, Paul R. Introducing Graphene–Indium Oxide Electrochemical Sensor for Detecting Ethanol in Aqueous Samples with CCD-RSM Optimization. Chemosensors. 2022; 10(2):42. https://doi.org/10.3390/chemosensors10020042
Chicago/Turabian StyleBoroujerdi, Ramin, and Richard Paul. 2022. "Introducing Graphene–Indium Oxide Electrochemical Sensor for Detecting Ethanol in Aqueous Samples with CCD-RSM Optimization" Chemosensors 10, no. 2: 42. https://doi.org/10.3390/chemosensors10020042
Note that from the first issue of 2016, this journal uses article numbers instead of page numbers. See further details here.