
Detection of Carbon Content from Pulverized Coal Using LIBS Coupled with DSC-PLS Method


School of Electrical and Control Engineering, North China University of Technology, Beijing 100144, China
*
Author to whom correspondence should be addressed.
Chemosensors 2022, 10(11), 490; https://doi.org/10.3390/chemosensors10110490
Submission received: 18 October 2022
/
Revised: 14 November 2022
/
Accepted: 15 November 2022
/
Published: 17 November 2022
(This article belongs to the Special Issue Chemometrics for Analytical Chemistry)
Abstract
:The dust from pulverized coal weakens the acquired signal and increases the analysis difficulty for the quantitative analysis of the carbon content of pulverized coal when using laser-induced breakdown spectroscopy (LIBS). Moreover, there is a serious matrix effect and a self-absorption phenomenon. To improve the analysis accuracy, the DSC-PLS (double spectral correction-partial-least-squares) method was proposed to predict the carbon content of pulverized coal. Initially, the LIBS signal was corrected twice using P-operation-assisted adaptive iterative-weighted penalized-least-squares (P-airPLS), plasma temperature compensation, and spectral normalization algorithms. The goodness of fit of the carbon element was improved from nonlinearity to above 0.948. The modified signal was then used to establish DCS-PLS models for predicting unknown samples. In comparison to the conventional PLS model, the DSC-PLS method proposed in this paper significantly improves the ability to predict carbon content. The prediction error of the developed method was dropped from an average of 4.66% to about 0.41%, with the goodness of fit R2 of around 0.991.
1. Introduction
Coal is considered one of the most abundant fossil fuels on Earth and it is the primary source of energy for coal-fired power plants. Coal with inappropriate properties could pose a serious safety risk during the boiler combustion process and produce substantial pollution. To evaluate the efficacy of a coal processing method and determine whether or not it is improving efficiency, the detection of coal composition is essential [1,2]. Methods such as X-ray fluorescence (XRF) and prompt gamma neutron activation analysis (PGNAA) have recently been used for coal analysis and measurements [3,4,5,6]. However, these methods can exert radiation hazards and are very expensive, so an alternative analysis method that is simultaneously safe and cost-effective is highly desired.
Because of its rapid analysis and accurate evaluation of multiple elements simultaneously [7,8], LIBS technology has found widespread use in a variety of fields in recent years, including coal, alloys, jewelry, geology, petroleum, and medicinal materials [9,10,11,12,13,14]. Because of the complexity of the coal structure and the existence of various matrix effects, LIBS technology is rarely used to examine organic elements, such as carbon in coal. Rather, calorific value, ash content, and other characteristics are typically analyzed [15,16,17]. Furthermore, the laser pulse energy is relatively high during the experiment, and striking the pulverized coal produces dust, which causes significant interference with the collected LIBS signal. As a result, the pulverized coal must be compressed before the experiment [18,19], or the experiments must be carried out using a special instrument to launch the pulverized coal from top to bottom, thus generating a pulverized coal flow [20]. However, some coal samples have low cohesiveness, making pressing difficult, and the pulverized coal flow becomes expensive. Therefore, it is necessary to use an appropriate algorithm to perform spectral corrections on the LIBS signal. To reduce the matrix effect, Li et al. combined a support-vector machine and a partial-least-squares method, which greatly improved the measurement accuracy [21]. Yao et al. proposed an internal standard method based on carbon atomic lines and CN and C2 molecular lines, which improved the matrix effect significantly [22]. Zhao et al. used laser-induced fluorescence-assisted LIBS to resonantly excite the CN radicals at the plasmon center, allowing them to detect carbon with high sensitivity [23].
To address this issue, this paper employs standard coal samples to quantitatively analyze the carbon content of pulverized coal using a self-built LIBS experimental platform, without the need for the coal to be pressed into briquettes. To effectively deduct background noise, the baseline correction was performed initially using the P operation, an advanced operation of digital morphology, and the adaptive iterative-weighted penalized-least-squares (P-airPLS) method. Second, the LIBS signal has a quadratic form based on the spectral normalization technique and the Boltzmann plane equation. The corrections effectively compensate for the influence of the matrix effect [24].
2. Double Spectral Correction Method
2.1. Baseline Correction
The basic operations of the mathematical morphology include erosion, dilation, and opening operations, which are defined in the spectral corrections as:
where, represents the original spectral intensity of the i-th point of the LIBS signal, while , , and denote the spectral intensity after the erosion, expansion, and opening operations of the i-th point, respectively. w indicates the half-width of the operation.
The signal-to-background ratio of the LIBS signal processed by the open operation was high, with poor performance in the spectral peak region along with certain distortions. In response to this issue, Chen et al. [25] proposed the morphological P operation, which can reduce the baseline fitting deviation in the spectral peak region more efficiently. The P operation can be defined as:
where represents the intensity of the spectral line with wavelength i following the P operation. Using airPLS, the LIBS baseline signal obtained in the previous step was smooth. Zhang et al. initially proposed this algorithm [26]. The specific steps are shown in Figure 1.
The arithmetic expression of the airPLS is represented as:
where, Q is the fitting balance coefficient between the fidelity and the smoothness of the baseline, t is the iteration number, w is the weight vector, x and are the original and the fitting vectors of x, respectively. m is the length and λ represents the roughness, which is set by the user according to the roughness of the desired baseline.
Before the iteration starts, let , and in each subsequent iteration, w can be found from the following formula:
where vector is formed by the negative difference of x and over t iteration steps. For iterating at step t − 1, if the i-th data point is greater than the -th data point, this position can be considered as a point on the peak. The weight w is then set to zero and the iteration is stopped. The iterative and reweight methods are used in the airPLS algorithm to automatically and gradually eliminate peak points while preserving baseline points in the weight vector w. The iteration ends when the maximum number of iterations has been reached, or the following condition has been met:
Ultimately, the baseline correction operation was completed by subtracting the fitted data from the original LIBS signal. Then, the corrected signal can be expressed as:
2.2. Plasma Temperature Compensation and Spectral Normalization
The LIBS signal requires temperature compensation after baseline correction. In the field of LIBS, plasma temperature not only describes a portion of the plasma’s properties, but also determines the spectral intensity along with the ground-state particle number density. This is considered an essential thermodynamic state parameter [27]. The Boltzmann slope method [28] was used in this paper to determine the intensity of the spectrum. When the plasma is in local thermal equilibrium, the following equation can be used to calculate the plasma temperature:
where λ represents the wavelength of the spectral line, is the degeneracy of the upper energy level, A is the transition probability of the spectral line, is the energy value of the upper energy level, K is the Boltzmann constant, T is the plasma temperature, and Q was determined from the total particle number density and the partition function. The latter is constant for the same ionization order spectrum of the same element and it can be regarded as a constant. In theory, the spectral line intensity, I, of an element can be expressed as:
where, is the particle number density of the ground state, is the lower energy level degeneracy, h is the Planck’s constant, and v is the frequency of the characteristic spectral line.
Multiple spectral lines of the same element were then selected, the upper energy level was set as the abscissa, and was selected for the ordinate. The plasma temperature T was then calculated from the slope of the curve. After obtaining the plasma temperature, Equation (10) was transformed to produce the following:
The left-hand side of the above expression corrects the spectral line intensity of the plasma temperature fluctuation. This implies that the spectral line intensity is only related to the ground-state particle number density and that the spectral normalization method enhanced the optimization of the LIBS signal.
In chemometrics, spectral normalization is a commonly used spectral preprocessing technique. It can be used to reduce the spectral fluctuation caused by the matrix effects and certain experimental parameters. This paper utilized the local spectral normalization method, which can be expressed as:
where represents the normalized spectral intensity of the i-th point in the LIBS signal, w is the half-width of the operation, and m denotes the total number of all the signals in the band containing the spectral line.
The basic idea behind this normalization method is to normalize the intensity of the characteristic spectral peak by using the area of the band where the characteristic spectral line is located. In this paper, the intensity of the spectral peak and the intensity of the i points on the left and right of the spectral peak were used to replace the intensity of the characteristic spectral peak for the spectral peak to encompass more spectral information. For example, if C247.840 nm is in the 182.450–309.864 nm band of the spectrometer, the normalized half-width w = 1 is set. This means that the normalized intensity at C247.840 nm can be obtained by dividing the sum of the intensities of C247.840 nm and one pixel on the left and right, with C247.840 nm as the center, by the 182.45–309.864 nm band area.
3. Experiment
3.1. Experimental Setup
Figure 2 depicts the LIBS experimental platform employed in this work. The laser wavelength was set to 1064 nm, pulse width was set to 10 ns (with a repetition frequency of 1 Hz), while the laser pulse energy was around 100 mJ pulse−1. The focal length of the focusing lens was 80 mm, whereas the parallel laser beam was focused around 1 mm below the surface of the pulverized coal sample. The diameter of the focused spot was about 2 mm and the laser energy density was calculated to be 31.83 mJ mm−2. The fiber-optic probe used to collect the signal was at an angle of 45 degrees to the coal sample. The delay and the integration durations of the spectrometer were set to 2 μs and 2 ms, respectively.
After placing the coal powder into the mold and scraping off the top surface uniformly, the sample points were changed after each stroke. A single sample was hit 12 times per round and there were 5 rounds in total. Hence, 60 sets of spectral data corresponding to a single sample were obtained.
To reduce the impact of noise and abnormal fluctuations, the mean and variance of the 60 data sets were calculated. If the strength of the data was greater than the sum of mean and variance or less than the difference between mean and variance, the measurement was discarded. The average value was determined after discarding to ensure the stability of the LIBS signal. The mold is shown in Figure 3.
3.2. Sample Setup
Experimental samples of fourteen standard pulverized coal types from Shandong Metallurgical Science Research (Jinan, China) were selected [29]. The carbon content of each sample was determined by the three-section furnace method. The measurement process involved using a certain amount of coal sample, burning the oxygen flow and using a carbon dioxide absorbent to absorb the carbon dioxide gas thus generated. The mass fraction of the carbon element in the coal sample was then calculated from the increment in the absorbent and has been listed in Table 1 as the content of carbon.
In addition, the element Ca in these coal samples was detected based on the EDXRF (energy-dispersive X-ray fluorescence) method, which needs to rely on the SPECTRO XEPOS spectrometer from SPECTRO Analytical Instruments GmbH (Kleve, Germany). For example, in Table 1, the mass fraction for the element Ca of sample No. 1 is 0.53%, sample No. 2 is 1.07%, and sample No. 3 is 0.85%. These figures can prove that the coal samples in Table 1 contain the element Ca, which can be used for plasma temperature compensation correction.
The experimental method described in this paper can be used to obtain spectral data from 182.450 nm to 849.338 nm. In total, 16,376 spectral data sets were obtained. Due to a large amount of data, it is very important to choose a suitable stoichiometry method.
Partial least squares [30] is a statistical analysis method that is more suitable for many-to-many modeling than traditional univariate models for the problems encountered in this paper. By combining the benefits of principal component analysis and linear correlation analysis, the partial-least-squares method can combine and transform the input and the output variables, respectively, to project them into a new space, thus establishing a suitable linear regression model. The number of principal components (referred to as K) must be set when constructing the model in the actual utilization process [31]. The number K must be set based on the contribution rate of each principal component. The principal components correspond to the first K eigenvalues of the COV (covariance) matrix. The formula for the determination of the contribution rate can be expressed as:
where λ represents the eigenvalues of the covariance matrix and S is the total number of eigenvalues. The contribution rate of the principal component vector is shown in Figure 4.
Figure 4 shows that the first four principal components can represent more than 99.98% of the information content of the spectral matrix. Hence, the principal component factor of the partial-least-squares method was set as 4.
4. Results and Discussion
4.1. Spectral Correction
The aforementioned experimental procedures were used to directly calibrate the measurement data of the fourteen standard pulverized coals. The nonlinear curve fitting for the calibration of the three spectral lines, C193.045 nm and C247.840 nm, did not meet the requirements of quantitative analysis. Initial baseline correction of the original LIBS was performed using the P operation with a half-width w = 50. The baselines following P operation and P-airPLS method displayed in red lines are depicted in Figure 5, and the original and the corrected signals are depicted in Figure 6.
In this paper, the four Ca spectral lines were used to calculate the plasma temperature. The parameters of the spectral lines are shown in Table 2.
The plasma temperatures of the fourteen standard pulverized coals were calculated using the parameters described in Table 2 and displayed in Table 3.
The plasma temperature given in Table 3 was incorporated into Equation (11) to complete the correction of the intensity of the analyzed spectral line. The corrected signal was then placed into Equation (12) for spectral normalization. The normalized half-width w was set to 1, and the rest of the spectral lines were normalized together with the analytical spectral line range during the calculation.
The original LIBS signal has been corrected so far, and the spectral intensity of the i-th point can be expressed as follows:
Calibration was performed after correction, and the fitting effect of the two carbon spectral lines C193.045 nm and C247.840 nm is shown in Figure 7.
Figure 8 shows that the fitting effect of the corrected two carbon spectral lines was significantly better than the original data, indicating that the DSC method described in this paper can eliminate certain matrix effects and improve the stability of the pulverized coal LIBS signal.
4.2. Predictive Effect of the Model
This paper utilized one coal sample as the prediction sample and the other thirteen coal samples for modeling to validate the prediction effect of the dual-spectrum correction method. The LIBS signal and the original signal within 182.40–309.837 nm were both modeled and predicted.
GBW11107-i, GBW11101-o, GBW1111-t, and GBW11110-t were selected as prediction samples, while other samples were used for model development. According to Table 4, the average carbon-content prediction error of the PLS model derived from the original data was approximately 4.66%, whereas the average carbon-content prediction error of the DSC-PLS method was approximately 0.31%, representing a significant improvement over the former. The model has the goodness of fit equivalent to 0.991.
5. Conclusions
The dual spectral correction of the LIBS signals of fourteen coal samples revealed that the goodness of fit of the two carbon lines at 193.045 and 247.840 nm can increase from nonlinearity to greater than 0.94 and 0.91, respectively. Simultaneously, when compared to the original PLS model, the DSC-PLS method improved the prediction ability for the carbon content of unknown samples. Prediction error was reduced from about 4.66% to about 0.41%, which is less than the uncertainty of the concentrations but is computed using a simpler way, demonstrating that use of the DSC-PLS method proposed in this paper is worth applying in practical circumstances. There is a serious matrix effect and a self-absorption phenomenon in the fluctuating pulverized coal LIBS signal, which also has some anti-interference capabilities. It is a novel approach to data processing.
Author Contributions
Conceptualizetion, C.G.; methodology, J.C.; software, T.W.; validation, M.L.; formal analysis, T.W.; resources, J.C.; data curation, T.W.; writing—original draft preparation, T.W.; writing—review and editing, C.G. All authors have read and agreed to the published version of the manuscript.
Funding
This research was funded by the Beijing Municipal Natural Science Foundation, grant number KZ202110009013.
Institutional Review Board Statement
Not applicable.
Informed Consent Statement
Not applicable.
Data Availability Statement
Not applicable.
Conflicts of Interest
The authors declare no conflict of interest.
References
- Xu, Y.M.; Chen, X.; Wang, L.; Bei, K.; Wang, J.L.; Chou, L.M.; Pan, Z.Y. Progress of Raman spectroscopic investigations on the structure and properties of coal. J. Raman. Spectrosc. 2020, 51, 1874–1884. [Google Scholar] [CrossRef]
- Sheta, S.; Afgan, M.X.; Hou, Z.Y.; Yao, S.C.; Zhang, L.; Li, Z.; Wang, Z. Coal analysis by laser-induced breakdown spectroscopy: A tutorial review. J. Anal. Atom. Spectrom. 2019, 34, 1047–1082. [Google Scholar] [CrossRef]
- Oliveira, C.; Salgado, J. Elemental composition of coal by using prompt gamma-neutron activation analysis. J. Radioanal. Nucl. Chem. 1993, 167, 153. [Google Scholar] [CrossRef]
- Yao, S.C.; Mo, J.H.; Zhao, J.B.; Li, Y.S.; Zhang, X.; Lu, W.Y.; Lu, Z.M. Development of a Rapid Coal Analyzer Using Laser-Induced Breakdown Spectroscopy (LIBS). Appl. Spectrosc. 2018, 72, 1225–1233. [Google Scholar] [CrossRef] [PubMed]
- Cremers, D.A.; Radziemski, L.J. Handbook of Laser-Induced Breakdown Spectroscopy, 2nd ed.; John Wiley & Sons, Ltd.: New York, NY, USA, 2013. [Google Scholar]
- Ray Bauer, A.J.; Buckley, S.G. Novel Applications of Laser-Induced Breakdown Spectroscopy. Appl. Spectrosc. 2017, 71, 553–566. [Google Scholar] [CrossRef] [Green Version]
- Du, Y.; Wang, Q.Q.; Yang, R.Z.; Cui, X.T. Quantitative determination of hydrogen isotope in titanium using LIBS. In Proceedings of the Applied Optics and Photonics China (AOPC2019), Beijing, China, 7–9 July 2019; SPIE: Beijing, China, 2019; Volume 11337, p. 1133712. [Google Scholar]
- Yao, S.C.; Zhao, J.B.; Wang, Z.Z.; Deguchi, Y.; Lu, Z.M.; Lu, J.D. Analysis of spectral properties for coal with different volatile contents by laser-induced breakdown spectroscopy. Spectrochim. Acta B 2018, 149, 249–255. [Google Scholar] [CrossRef]
- Liu, K.; He, C.; Zhu, C.W.; Chen, J.; Zhan, K.P.; Li, X.Y. A review of laser-induced breakdown spectroscopy for coal analysis. Trac-Trend. Anal. Chem. 2021, 143, 116357. [Google Scholar] [CrossRef]
- Hai, R.; Tong, W.N.; He, Z.L.; Sattar, H.; Li, C.; Ding, H.B. Quantitative analysis of titanium alloys using one-point calibration laser-induced breakdown spectroscopy. Appl. Phys B 2021, 127, 37. [Google Scholar] [CrossRef]
- Mo, Y.J.; Chen, Y.Q.; Li, R.H.; Zhou, Q.; Lou, Y. Microanalysis of silver jewellery by laser-ablation laser-induced breakdown spectroscopy with enhanced sensitivity and minimal sample ablation. Chin. Opt. Lett. 2014, 12, 083001. [Google Scholar]
- Chatterjee, S.; Singh, M.; Biswal, B.P.; Sinha, U.K.; Patbhaje, S.; Sarkar, A. Application of laser-induced breakdown spectroscopy (LIBS) coupled with PCA for rapid classification of soil samples in geothermal areas. Anal. Bioanal. Chem. 2019, 411, 2855–2866. [Google Scholar] [CrossRef]
- Bol, A.A.; Pandey, S.J.; Mao, X.L.; Liu, C.Y. Analysis of liquid petroleum using a laser-induced breakdown spectroscopy instrument. Spectrochim. Acta B 2021, 179, 106094. [Google Scholar]
- Han, W.W.; Su, M.G.; Sun, D.X.; Ying, Y.P.; Wang, Y.P.; Gao, C.L.; Yang, F.C.; Fu, Y.B. Analysis of metallic elements dissolution in the Astragalus at different decocting time by using LIBS technique. Plasma. Sci. Technol. 2020, 22, 156. [Google Scholar] [CrossRef]
- Lu, P.; Zhuo, Z.; Zhang, W.H.; Tang, J.; Xing, T.; Wang, Y.; Sun, T.F.; Lu, J.Q. Determination of calorific value in coal by LIBS coupled with acoustic normalization. Appl. Phys B 2021, 127, 82. [Google Scholar] [CrossRef]
- Yan, C.H.; Zhang, T.L.; Sun, Y.Q.; Tang, H.S.; Li, H. A hybrid variable selection method based on wavelet transform and mean impact value for calorific value determination of coal using laser-induced breakdown spectroscopy and kernel extreme learning machine. Spectrochim. Acta B 2019, 154, 75–81. [Google Scholar] [CrossRef]
- Stefano, L.; Beatrice, C.; Stefano, P.; Francesco, P.; Vincenzo, P. Determination of Ash Content of coal by Laser-Induced Breakdown Spectroscopy. Spectrochim. Acta B 2019, 155, 123–126. [Google Scholar]
- Peng, H.B.; Chen, G.H.; Chen, X.X.; Lu, Z.M.; Yao, S.C. Hybrid classification of coal and biomass by laser-induced breakdown spectroscopy combined with K-means and SVM. Plasma. Sci. Technol. 2019, 21, 034008. [Google Scholar] [CrossRef]
- Song, W.R.; Hou, Z.Y.; Afgan, M.S.; Gu, W.L.; Wang, H.; Cui, J.C.; Wang, Z.; Wang, Y. Validated ensemble variable selection of laser-induced breakdown spectroscopy data for coal property analysis. J. Anal. Atom. Spectrom. 2021, 36, 111–119. [Google Scholar] [CrossRef]
- Zheng, J.P.; Lu, J.D.; Zhang, B.; Dong, M.R.; Yao, S.C.; Lu, W.Y.; Dong, X. Experimental Study of Laser-Induced Breakdown Spectroscopy (LIBS) for Direct Analysis of Coal Particle Flow. Appl. Spectrosc. 2014, 68, 672–679. [Google Scholar] [CrossRef]
- Li, X.W.; Yang, Y.; Li, G.D.; Chen, B.W.; Hu, W.S. Accuracy improvement of quantitative analysis of calorific value of coal by combining support vector machine and partial least square methods in laser-induced breakdown spectroscopy. Plasma. Sci. Technol. 2020, 22, 122. [Google Scholar] [CrossRef]
- Yao, S.C.; Xu, J.L.; Bai, K.J.; Lu, J.D. Improved Measurement Performance of Inorganic Elements in Coal by Laser-Induced Breakdown Spectroscopy Coupled with Internal Standardization. Plasma. Sci. Technol. 2015, 17, 938. [Google Scholar] [CrossRef]
- Zhao, N.; Li, J.M.; Ma, Q.X.; Guo, L.; Zhang, Q.M. Periphery excitation of laser-induced CN fluorescence in plasma using laser-induced breakdown spectroscopy for carbon detection. Chin. Opt. Lett. 2020, 18, 083001. [Google Scholar] [CrossRef]
- Li, X.W. Matrix Effect in Measurements of Carbon Content in Coal by Laser Induced Breakdown Spectroscopy and Its Correction Methods. Ph.D. Thesis, Tsinghua University, Beijing, China, 2014. [Google Scholar]
- Chen, Y.L.; Dai, L.K. An Automated Baseline Correction Method Based on Iterative Morphological Operations. Appl. Spectrosc. 2018, 72, 731–739. [Google Scholar] [CrossRef]
- Zhang, Z.M.; Chen, S.; Liang, Y.Z. Baseline correction using adaptive iteratively reweighted penalized least squares. Analyst 2010, 135, 1138–1146. [Google Scholar] [CrossRef]
- Najarian, M.L.; Chinni, R.C. Temperature and electron density determination on Laser-Induced Breakdown Spectroscopy(LIBS) plasmas: A physical chemistry experiment. J. Chem. Educ. 2013, 90, 244–247. [Google Scholar] [CrossRef]
- Lin, J.Y.; Yang, J.F.; Huang, Y.T.; Lin, X.M. A study of the temperature variation effect in a steel sample for rapid analysis using LIBS. Opt. Laser. Technol. 2020, 147, 107707. [Google Scholar] [CrossRef]
- Determination of Carbon and Hydrogen in Coal, National Standards of People’s Republic of China. Available online: https://www.chinesestandard.net/PDF/English.aspx/GBT476-2008 (accessed on 1 November 2022).
- Gabrielli, M.; LanconVerdier, V.; Picouet, P.; Maury, C. Hyperspectral Imaging to Characterize Table Grapes. Chemosensors 2021, 9, 71. [Google Scholar] [CrossRef]
- Ribeiro, M.C.S.; Senesi, G.S.; Cabral, K.S.; Cena, C.; Marangoni, B.S.; Kiefer, C.; Nicolodelli, G. Evaluation of rice varieties using LIBS and FTIR techniques associated with PCA and machine learning algorithms. Appl. Optics. 2020, 59, 10043–10048. [Google Scholar] [CrossRef]
Figure 1.
Plot of the airPLS step.
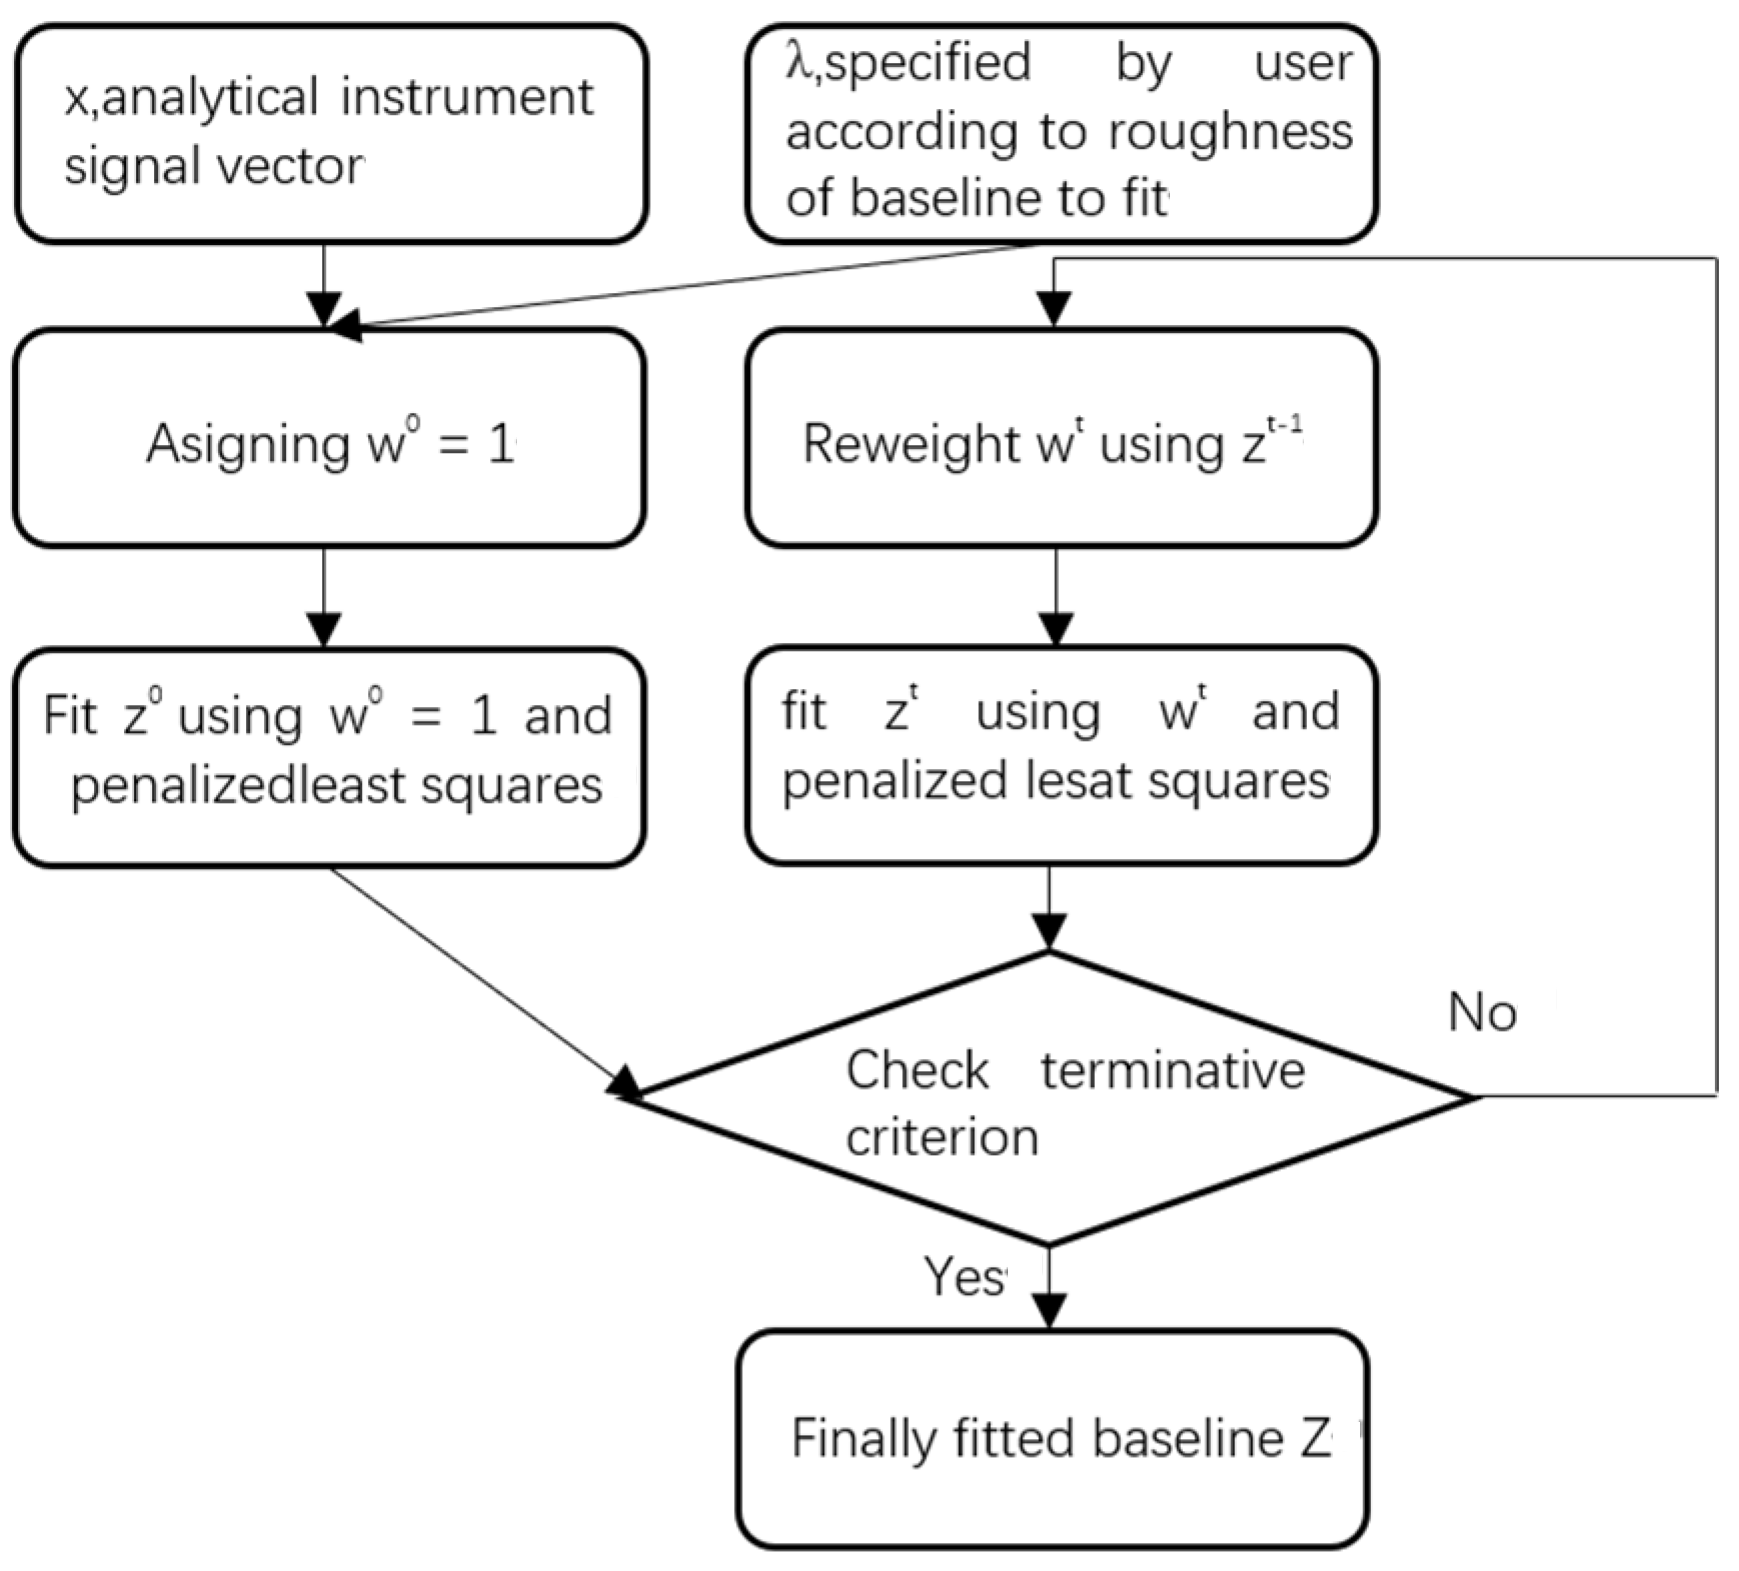
Figure 2.
Plot of the LIBS experimental platform.
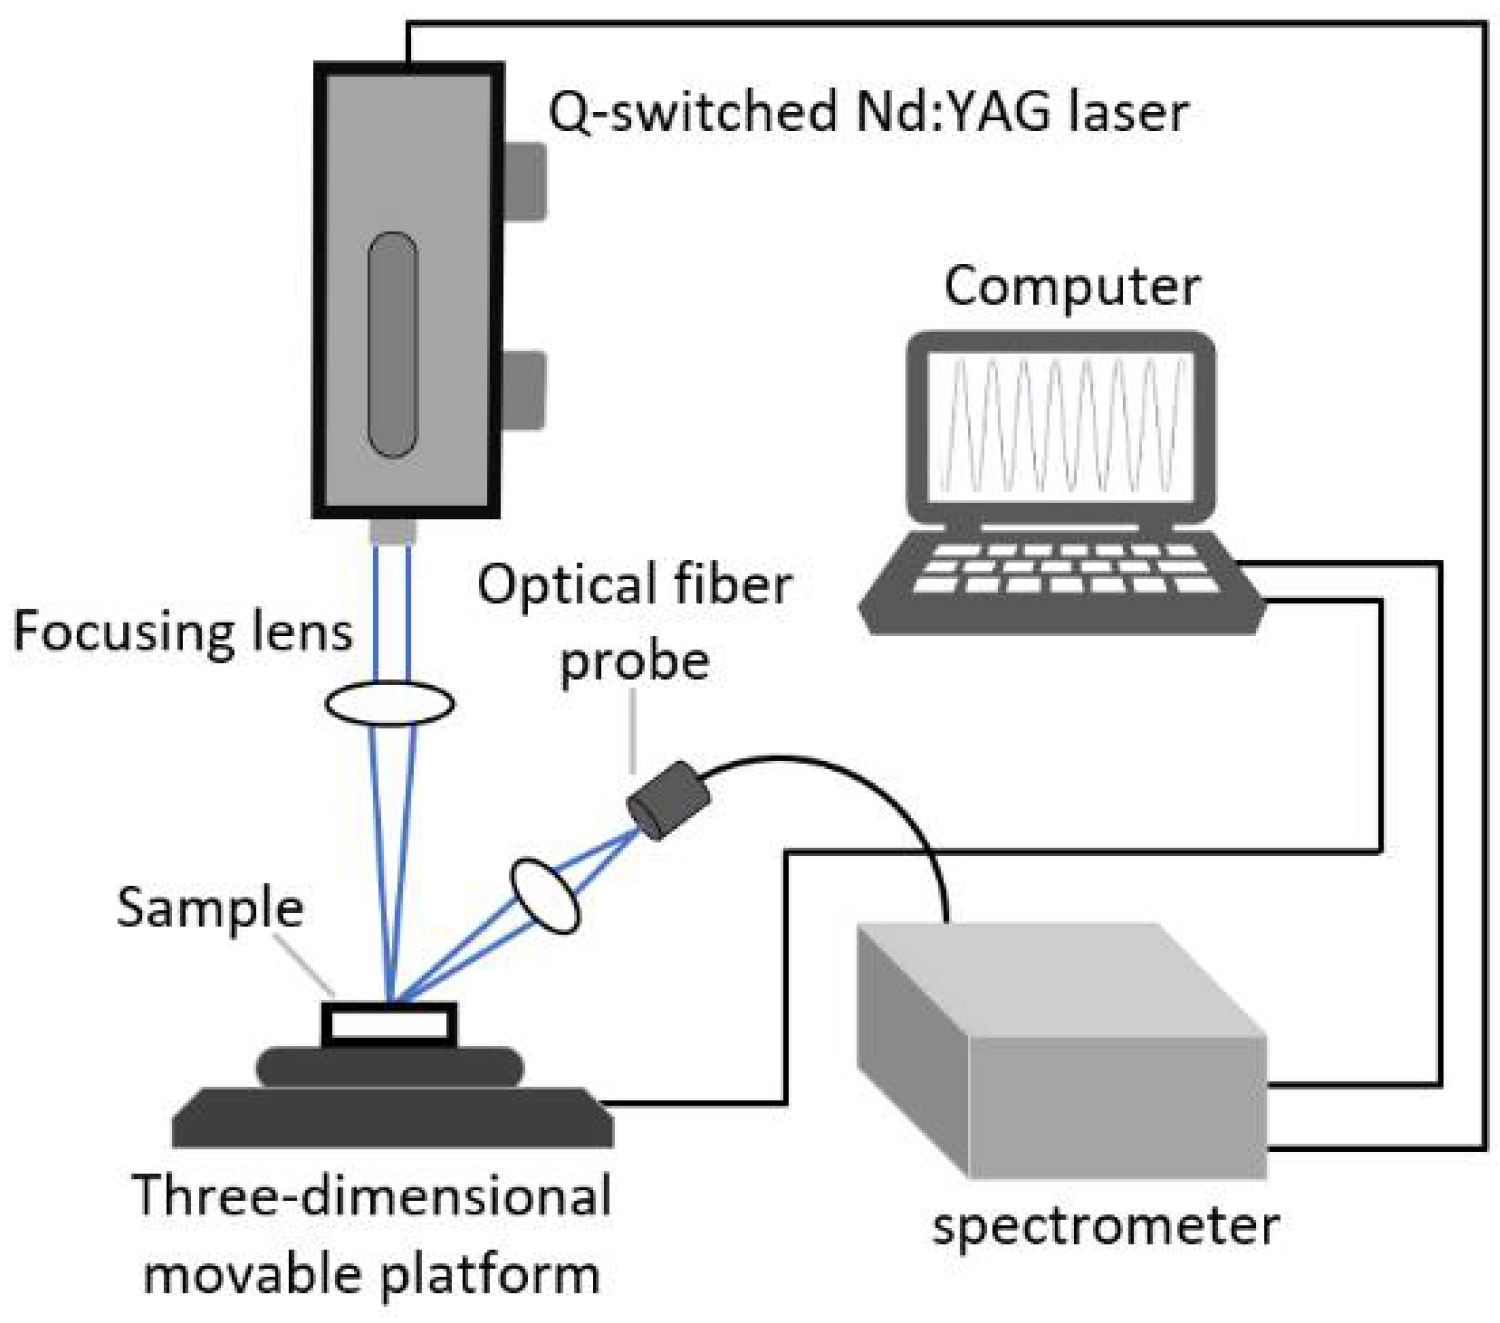
Figure 3.
Plot of the mold during experiments. (a) unfilled mold; (b) mold filled with pulverized coal.
Figure 3.
Plot of the mold during experiments. (a) unfilled mold; (b) mold filled with pulverized coal.

Figure 4.
The contribution rate of the principal component vector.

Figure 5.
Plot of the baseline correction process. The red line represents the signal processed by different operations. (a) Baseline following P operation; (b) baseline following P-airPLS method.
Figure 5.
Plot of the baseline correction process. The red line represents the signal processed by different operations. (a) Baseline following P operation; (b) baseline following P-airPLS method.
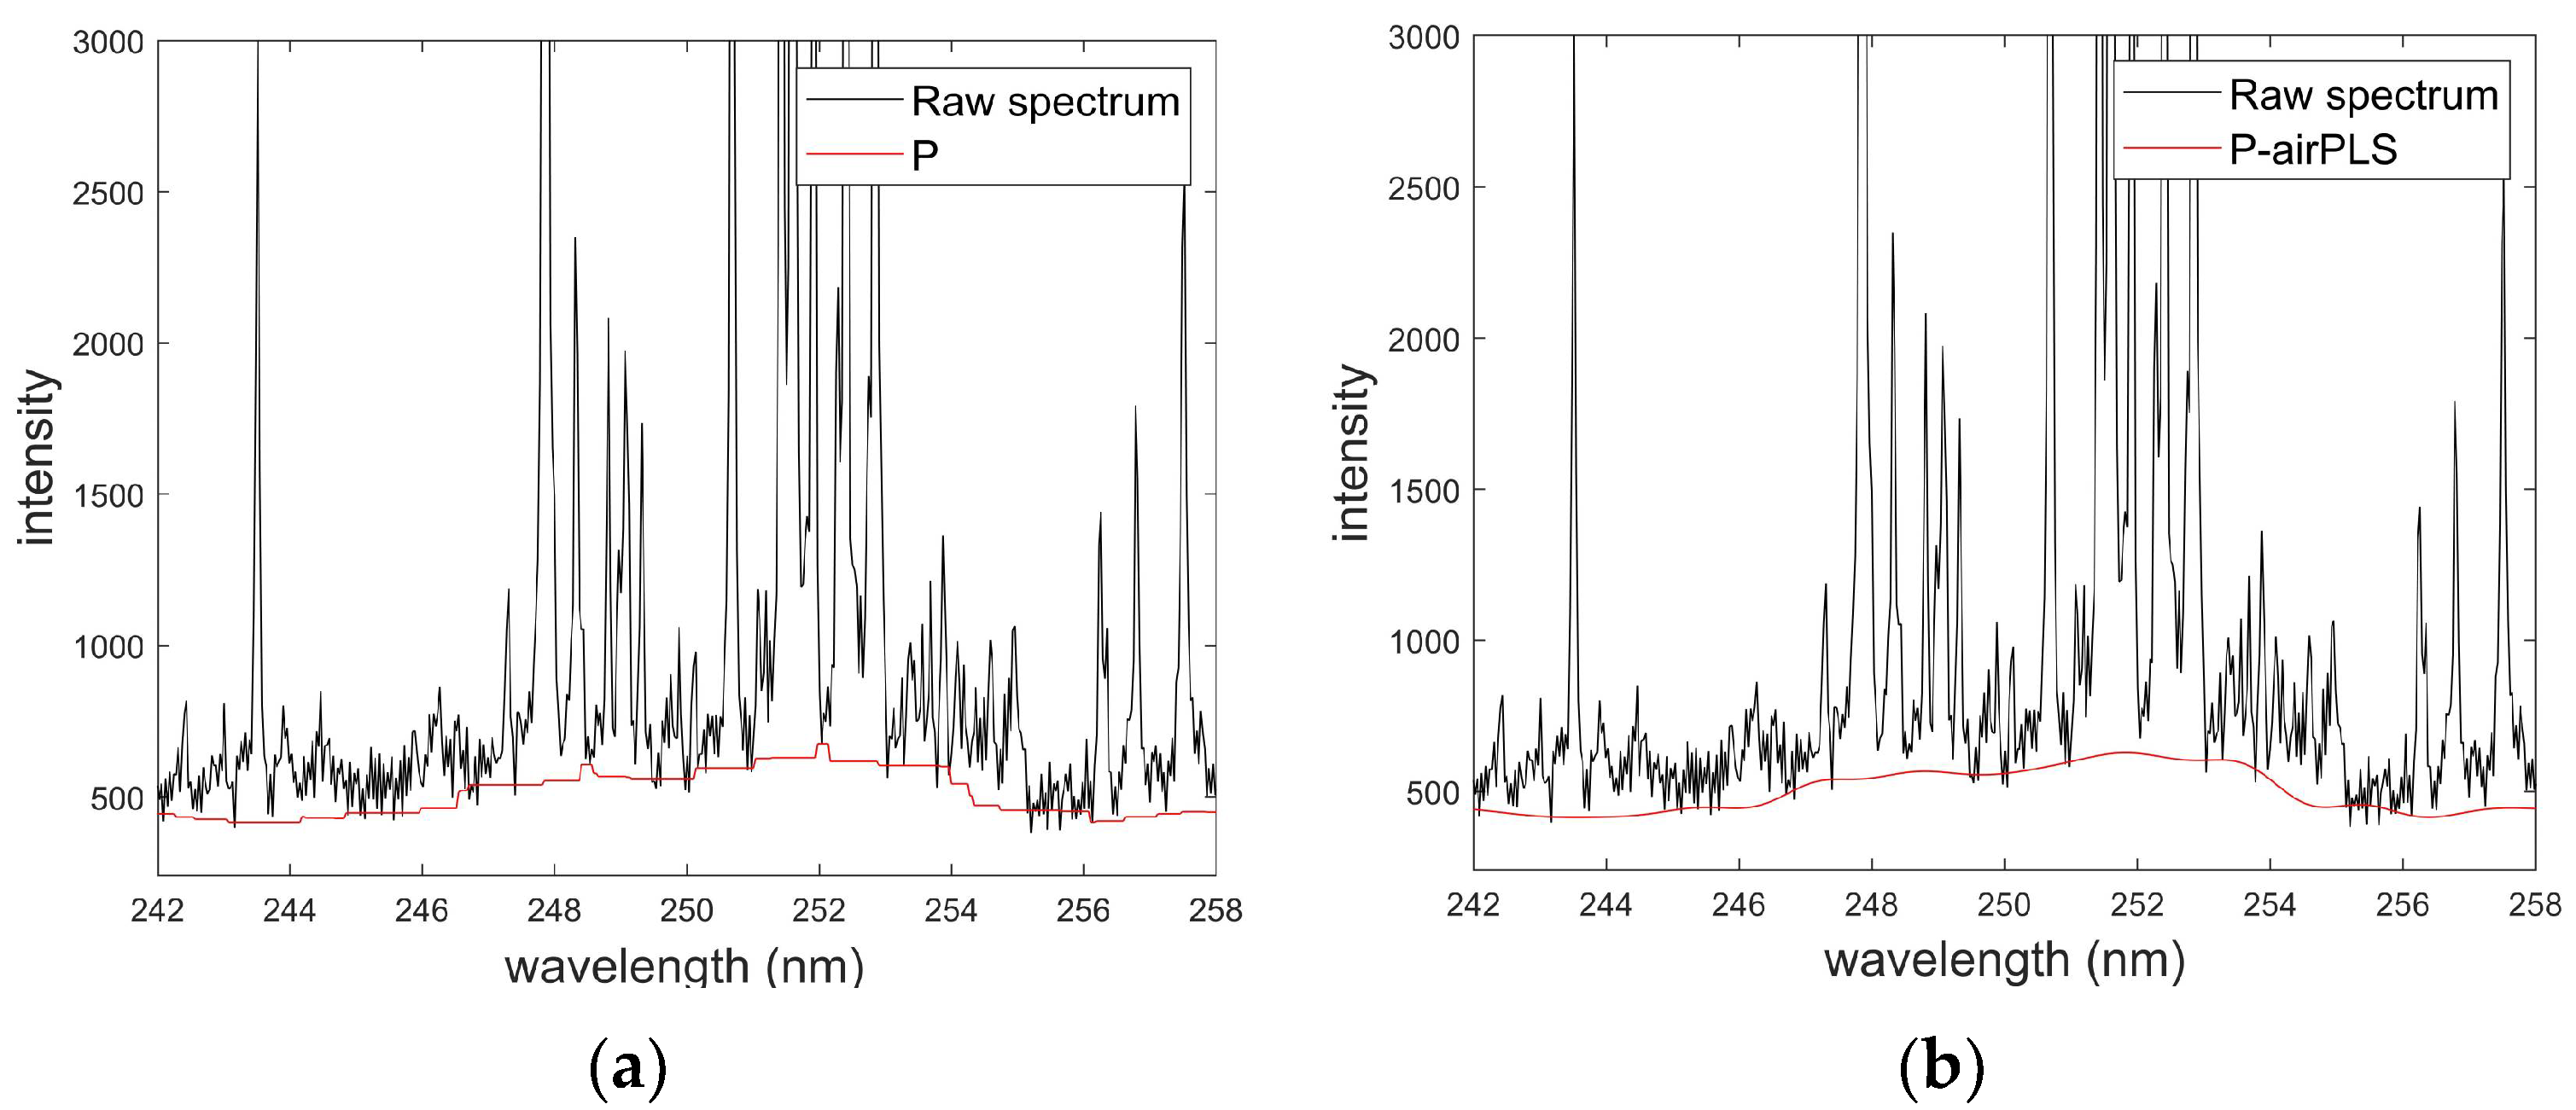
Figure 6.
Plot of the effect of baseline correction. (a) Original data; (b) data following baseline correction.
Figure 6.
Plot of the effect of baseline correction. (a) Original data; (b) data following baseline correction.

Figure 7.
Plot of the fitting effect of C193.045 nm after P-airPLS method. The goodness of fit for C193.045 nm improved from being nonlinear to linear with the value of 0.948. (a) The goodness of fit for original data; (b) goodness of fit for processed data.
Figure 7.
Plot of the fitting effect of C193.045 nm after P-airPLS method. The goodness of fit for C193.045 nm improved from being nonlinear to linear with the value of 0.948. (a) The goodness of fit for original data; (b) goodness of fit for processed data.
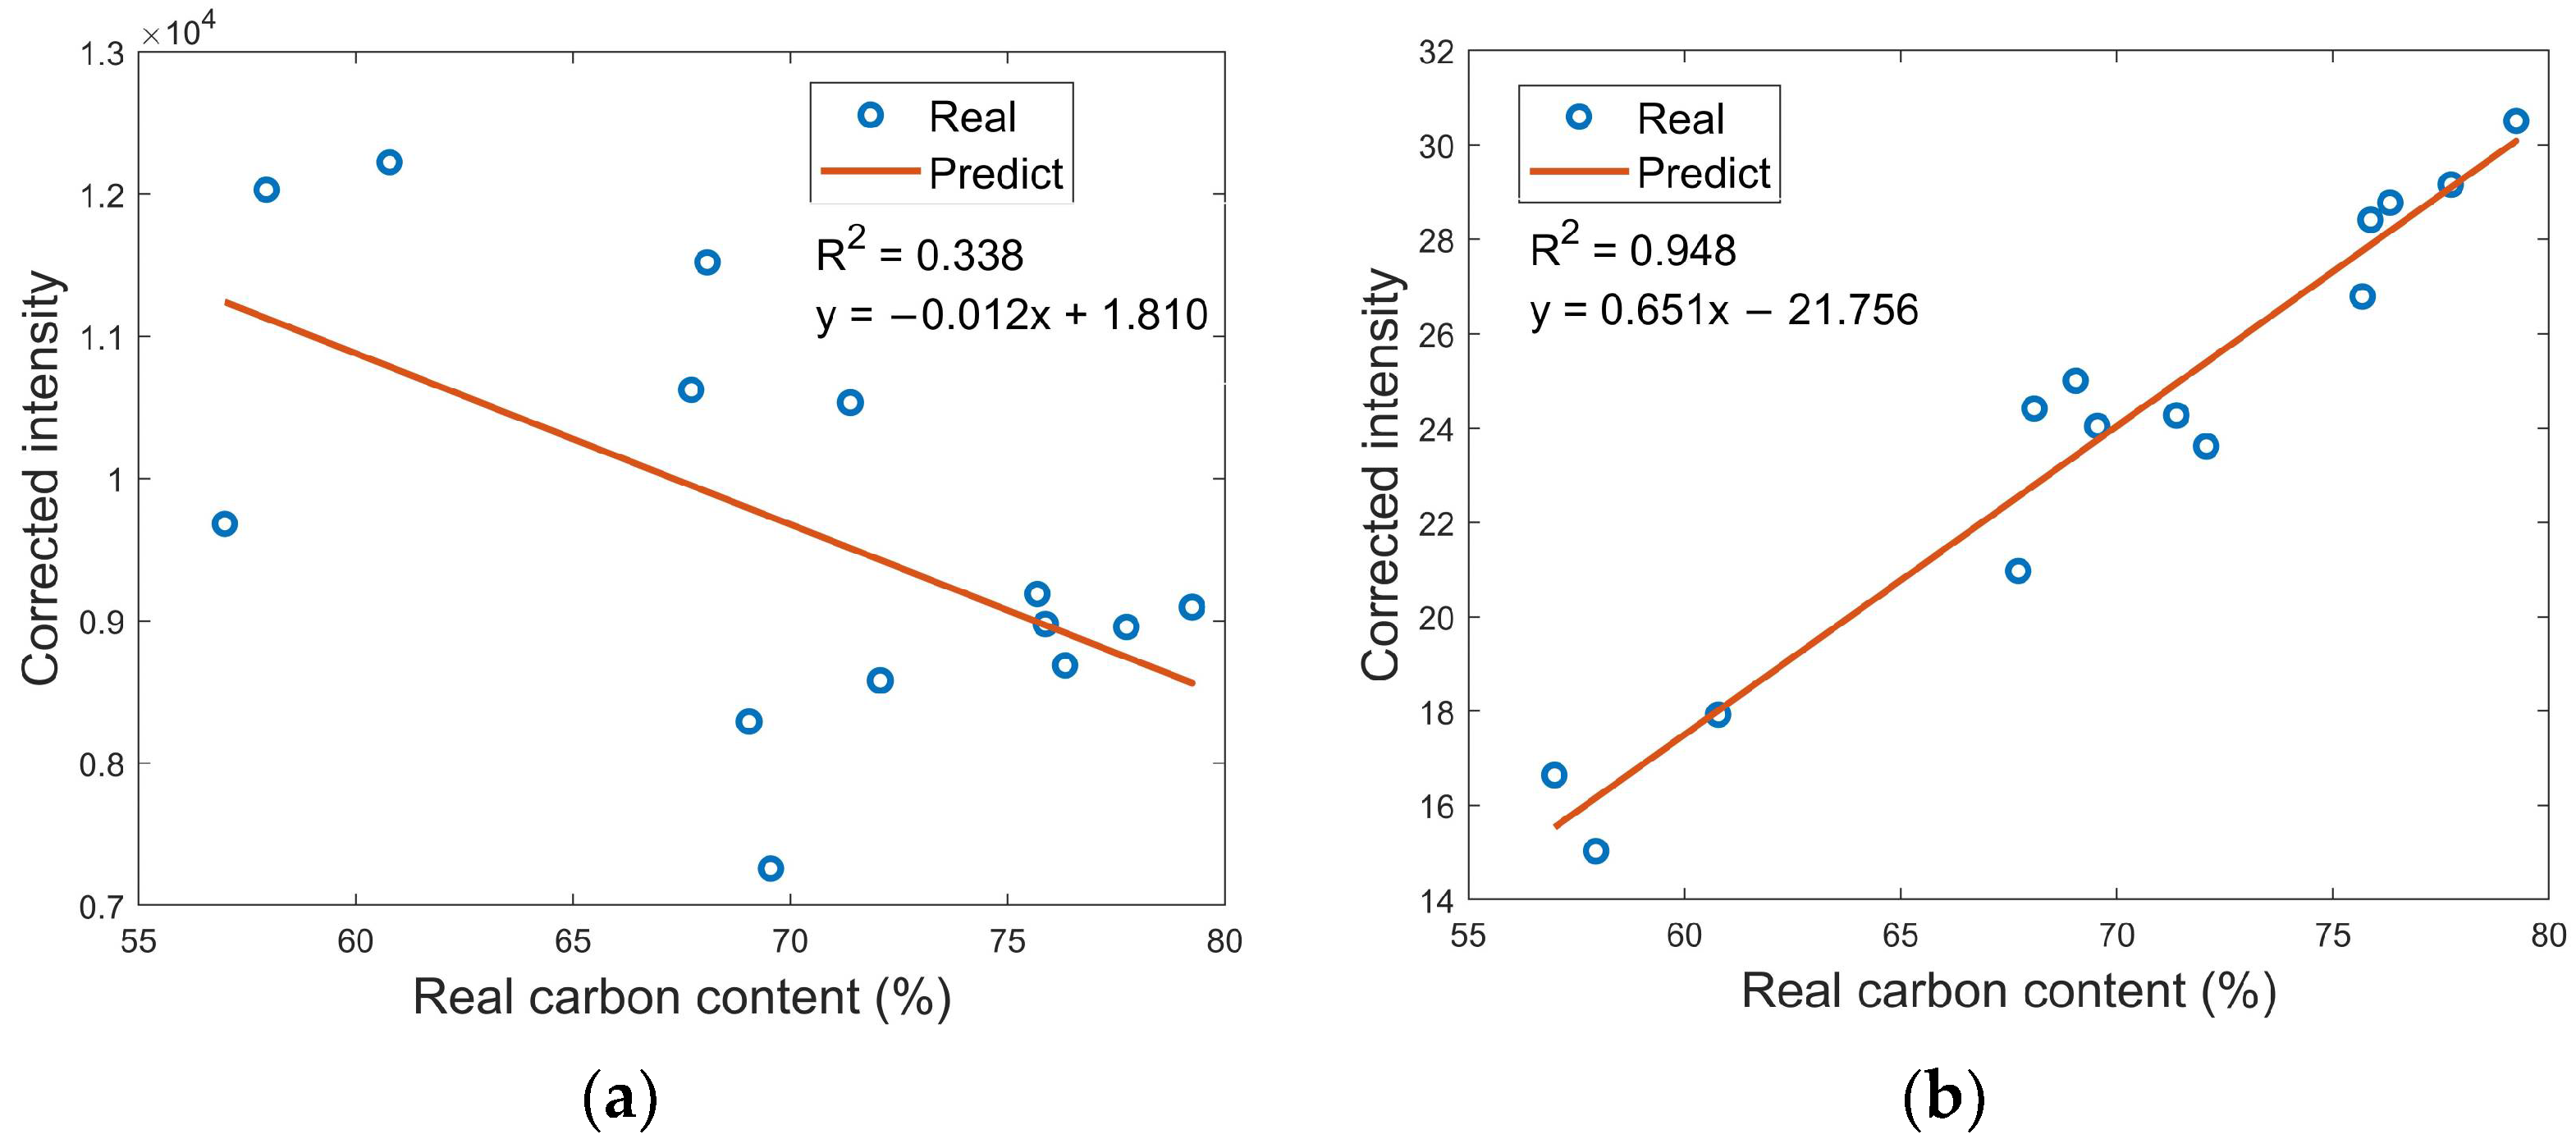
Figure 8.
Plot of the fitting effect of C247.840 nm after P-airPLS method. (a) The goodness of fit for original data; (b) goodness of fit for processed data.
Figure 8.
Plot of the fitting effect of C247.840 nm after P-airPLS method. (a) The goodness of fit for original data; (b) goodness of fit for processed data.


Table 1.
Elemental content of coal sample.
| No. | Sample Number | Carbon Content (%) | Content Fluctuation (%) |
|---|---|---|---|
| 1 | GBW11110-q | 56.99 | 0.47 |
| 2 | GBW11110-u | 57.95 | 0.47 |
| 3 | GBW11110-t | 60.78 | 0.53 |
| 4 | GBW11102-d | 67.72 | 0.42 |
| 5 | GBW11111-w | 68.09 | 0.61 |
| 6 | GBW11108-u | 69.05 | 0.48 |
| 7 | GBW11108-t | 69.55 | 0.34 |
| 8 | GBW11111-t | 71.38 | 0.34 |
| 9 | GBW11111-u | 72.07 | 0.49 |
| 10 | GBW11102-b | 75.68 | 0.33 |
| 11 | GBW11107-k | 75.87 | 0.44 |
| 12 | GBW11107-i | 76.32 | 0.37 |
| 13 | GBW11101-o | 77.73 | 0.49 |
| 14 | GBW11101-l | 79.24 | 0.46 |
Table 2.
Ca spectral line parameters.
| Wavelength (nm) | Degeneracy | Transition Probability (108 s−1) | Energy Value (eV) |
|---|---|---|---|
| Ca315.919 | 4 | 3.10 | 7.04717 |
| Ca317.948 | 6 | 3.60 | 7.04955 |
| Ca393.341 | 4 | 1.47 | 3.15098 |
| Ca396.829 | 2 | 1.40 | 3.12335 |
Table 3.
The plasma temperatures of the fourteen standard pulverized coals.
| No. | Sample Number | Plasma Temperature (K) |
|---|---|---|
| 1 | GBW11110-q | 10,088.25 |
| 2 | GBW11110-u | 10,886.04 |
| 3 | GBW11110-t | 10,649.28 |
| 4 | GBW11102-d | 10,066.38 |
| 5 | GBW11111-w | 10,089.13 |
| 6 | GBW11108-u | 10,294.08 |
| 7 | GBW11108-t | 10,174.94 |
| 8 | GBW11111-t | 10,119.93 |
| 9 | GBW11111-u | 10,003.03 |
| 10 | GBW11102-b | 10,483.80 |
| 11 | GBW11107-k | 10,020.31 |
| 12 | GBW11107-i | 10,063.76 |
| 13 | GBW11101-o | 10,461.12 |
| 14 | GBW11101-l | 10,122.57 |
| Standard deviation | \ | 258.86 |
Table 4.
The prediction ability of two methods for the carbon content of unknown samples.
| Sample | Content (%) | Uncertainty of the Concentrations (%) | PLS | DSC-PLS | ||
|---|---|---|---|---|---|---|
| Predict (%) | Error (%) | Predict (%) | Error (%) | |||
| GBW 11107-i | 76.32 | 0.37 | 74.361 | 2.57 | 76.748 | 0.56 |
| GBW 11101-o | 77.73 | 0.49 | 76.563 | 4.68 | 77.974 | 0.31 |
| GBW 11102-b | 75.68 | 0.33 | 72.902 | 0.75 | 75.309 | 0.49 |
| GBW 11102-d | 67.72 | 0.42 | 68.367 | 0.96 | 67.428 | 0.43 |
| GBW 11110-t | 60.78 | 0.53 | 52.185 | 14.14 | 60.751 | 0.05 |
| GBW 11110-u | 57.95 | 0.47 | 60.762 | 4.85 | 58.298 | 0.60 |
| Average | \ | 0.435 | \ | 4.658 | \ | 0.406 |
Publisher’s Note: MDPI stays neutral with regard to jurisdictional claims in published maps and institutional affiliations. |
© 2022 by the authors. Licensee MDPI, Basel, Switzerland. This article is an open access article distributed under the terms and conditions of the Creative Commons Attribution (CC BY) license (https://creativecommons.org/licenses/by/4.0/).
Share and Cite
MDPI and ACS Style
Guan, C.; Wu, T.; Chen, J.; Li, M. Detection of Carbon Content from Pulverized Coal Using LIBS Coupled with DSC-PLS Method. Chemosensors 2022, 10, 490. https://doi.org/10.3390/chemosensors10110490
AMA Style
Guan C, Wu T, Chen J, Li M. Detection of Carbon Content from Pulverized Coal Using LIBS Coupled with DSC-PLS Method. Chemosensors. 2022; 10(11):490. https://doi.org/10.3390/chemosensors10110490
Chicago/Turabian StyleGuan, Congrong, Tianyu Wu, Jiwen Chen, and Ming Li. 2022. "Detection of Carbon Content from Pulverized Coal Using LIBS Coupled with DSC-PLS Method" Chemosensors 10, no. 11: 490. https://doi.org/10.3390/chemosensors10110490
Note that from the first issue of 2016, this journal uses article numbers instead of page numbers. See further details here.