
Detection of Azo Dyes Using Carbon Dots from Olive Mill Wastes


1
Department of Chemical Engineering, Instituto Superior de Engenharia de Lisboa, Instituto Politécnico de Lisboa, 1959-007 Lisbon, Portugal
2
CQ-VR-Centro de Química-Vila Real, Universidade de Trás-os-Montes e Alto Douro, 5001-801 Vila Real, Portugal
3
BSIRG-iBB-Institute for Bioengineering and Biosciences, and Associate Laboratory i4HB—Institute for Health and Bioeconomy, Instituto Superior Técnico, Universidade de Lisboa, 1049-001 Lisbon, Portugal
*
Author to whom correspondence should be addressed.
Chemosensors 2022, 10(11), 487; https://doi.org/10.3390/chemosensors10110487
Submission received: 17 October 2022
/
Revised: 10 November 2022
/
Accepted: 12 November 2022
/
Published: 16 November 2022
(This article belongs to the Special Issue Chemosensors for Ion Detection)
Abstract
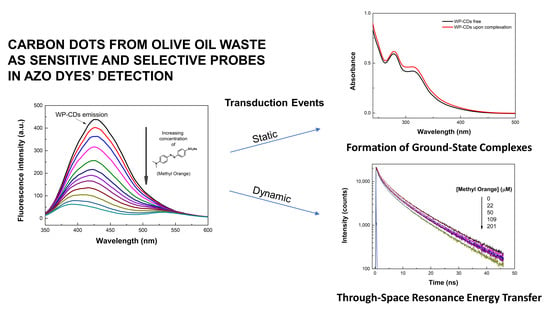
:Azo dyes are widely spread in our day life, being heavily used in cosmetics, healthcare products, textile industries, and as artificial food colorants. This intense industrial activity, which inherently includes their own production, inexorably leads to uncontrolled release of dyes into the environment. As emerging pollutants, their detection, particularly in water systems, is a priority. Herein, a fluorescence-based method was employed for the sensitive and selective detection of anionic and neutral azo dyes. Carbon dots (CDs) synthesized from wet pomace (WP), an abundant semi-solid waste of olive mills, were used as probes. An outstanding capability for detection of azo dyes methyl orange (MO) and methyl red (MR) in aqueous solutions was disclosed, which reached a limit of detection (LOD) of 151 ppb for MO. The selectivity of WP-CDs for the anionic azo dye (MO) was established through competitive experiments with other dyes, either anionic (indigo carmine) or cationic (fuchsin, methylene blue, and rhodamine 6G); perchlorate salts of transition metal cations (Cu(II), Co(II), Fe(II), Fe(III), Hg(II), and Pb(II)); and sodium salts of common anions (NO3−, CO32−, Cl−, and SO42−). Evidence has been collected that supports static quenching as the main transduction event underlying the observed quenching of the probe’s fluorescence, combined with a dynamic resonance energy transfer (RET) mechanism at high MO concentrations.
1. Introduction
The convergent synthetic pathways to azo dyes allied to their high color density and good-to-excellent fastness properties makes them the most widely used synthetic colorants, covering all the visible spectrum. They are ubiquitously used in a variety of industries, ranging from textiles and cosmetics to healthcare sectors. As artificial food colorants, they represent a significant part of allowed color additives in foods (5 out of 9) in the U.S. [1] and European Union (7 out of 13) [2], most of them being anionic (sulphonic) azo dyes. As a consequence of uncontrolled anthropogenic activities, they may, however, pose significant risks to the environment, particularly in water systems, with adverse ecological and human health effects. Several analytical methods, each with its own merits, have been implemented over the years for dyes’ detection, which include SERS [3,4], LC/ESI-MS [5], voltammetry [6], and HPLC [7]. Nonetheless, the above methods suffer in general from being time-consuming, making use of expensive analytical instruments and materials, and, in many cases, involving complex operations.
Fluorescence sensing is among the most powerful techniques for detection of trace amounts of neutral and ionic (bio)molecular species and inorganic ions in a variety of environments, ranging from aqueous media to vapor phase, owing to rapid responses and high sensitivity [8,9]. Development of efficient, reliable, and simple fluorescence-based sensing methods for detection of azo dyes as emerging pollutants is happening at a fast pace. Recent examples of probes used for that purpose include mesoporous silica functionalized with terthiophene units [10], lanthanide-doped NaBiF4 nanosheets [11], conjugated fluorene-based polymers [12], citric acid/urea-based carbon dots (CDs) [13], CDs derived from rubber tires’ waste [14], and CDs obtained from the fruit extract of Averrhoa carambola and arginine [15].
One of our current endeavors on carbon nanomaterials synthesis for various applications relies on the use of wastes from the olive oil industry [16,17]. In particular, the currently most used and environmentally friendly extraction method (two-phase extraction) of olive oil produces, nonetheless, huge amounts of a semi-solid waste called wet pomace (WP), which accounts for nearly 80% by weight of the processed olives [18]. This waste, containing holocellulose (~40%), lignin (~33%), triglycerides (~13%), and proteins (~5%) as its main macro-organic constituents [17], was very recently used by us as a renewable and sustainable raw material for the synthesis of highly luminescent carbon dots (CDs) following hydrothermal carbonization (HTC) processes [17]. In the current work, and employing our previously developed synthetic procedures, WP-CDs were investigated as fluorescent probes toward azo dyes. Herein, we report our findings relating to the fluorescence detection of anionic (methyl orange, MO) and neutral (methyl red, MR) azo dyes in aqueous media. The ability of WP-CDs to detect other anionic (indigo carmine, IC) and cationic (methylene blue, MB; fuchsin, Fch; rhodamine-6G, Rh-6G) dyes; perchlorate salts of transition metal cations Cu(II), Co(II), Fe(II), Fe(III), Hg(II) and Pb(II); and sodium salts of NO3−, CO32−, Cl−, and SO42− is also assessed. As will be shown, WP-CDs are highly sensitive and selective sensors for azo dyes.
2. Materials and Methods
2.1. Instruments and Methods
Ground-state absorption spectra were recorded on a Jasco UV V-750 spectrophotometer (Jasco Inc., Tokyo, Japan) using 1 cm quartz cells at 25 °C. Steady-state fluorescence spectra were acquired on a Perkin Elmer LS45 fluorometer (PerkinElmer Life and Analytical Sciences, Shelton, USA) using a 1 cm quartz cuvette in a right angle (RA) setup at 25 °C and in air-equilibrated conditions.
Fluorometric experiments were carried out in buffered solutions (acetate (50 mM, pH = 2.2), phosphate (50 mM, pH = 7.2), and glycine (59 mM, pH = 11.4) buffers) or in water, using WP-CDs at a concentration of 0.1 mg/mL except otherwise noted, with the data being acquired in RA geometry. In all assays (duplicated), either using a single concentration of analytes (dyes, metal salts, and anions at 10 μM) or in dye titrations, spectral readings were obtained 2 min after the admixture. The acquired fluorescence intensities (Fobs) were corrected (Fcorr) to account for inner filter effects (IFEs) by using the expression [19]: Fcorr = Fobs × (2.303 × Aexc × (y − x)/10−Aexc×x − 10−Aexc×y) × (2.303 × (−Aem) × (v − u)/10−Aem×v − 10−Aem×u), where Aexc and Aem are the optical densities of the solution at the excitation and emission wavelengths, and x, y, u, and v are the geometric parameters determined for our instrument, as depicted in Scheme 1. The second term of the equation corresponds to the correction applied to primary IFEs and the third term to the secondary IFEs.
Steady-state Stern-Volmer constants (KSV) were determined from IFEs-corrected fluorescence data (duplicate assays), according to the equation: F0/F = 1 + KSV [Q], where F0 and F are the corrected fluorescence intensities of WP-CDs in the absence and presence of the quencher, and [Q] is the quencher concentration. The limit of detection (LOD = 3σ/slope of the calibration curve) was determined in accordance to the 3σ IUPAC criteria [20], where σ is the standard deviation of the instrument response for 13 blank measurements of WP-CDs (0.1 mg/mL) in phosphate buffer (pH = 7.2).
Förster radii R0 were calculated from the expression R06 = 8.79 × 10⁻⁵ (κ2 n−4 ΦD J(λ)), in Å6, where κ2 is the spatial orientation factor expressing the orientation of the interacting D-A transition dipoles, n is the refractive index of the medium, ΦD is the fluorescence quantum yield of D (in the absence of A), and J(λ) is the overlap integral of the fluorescence emission spectrum of the donor and the absorption spectrum of the acceptor. The overlap integral is in turn given by: J(λ) = ∫FD(λ)εA(λ)λ4dλ, expressed in M−1 cm−1 nm4, where FD(λ) is the corrected fluorescence of D in the wavelength range λ to (λ + Δλ) with the total intensity (area under the curve) normalized to unity, and εA(λ) is the molar absorption coefficient of the acceptor at λ [9]. The overlap integrals (J) were calculated from the emission spectrum of WP-CDs obtained under 340 nm excitation in a concentration of 0.1 mg/mL in phosphate buffer at pH = 7.2 and the absorption spectra of the dyes in the same medium at 1.0 × 10⁻⁵ M. The Förster radii (R0) were calculated using n = 1.333 (water), κ2 = 2/3, and a quantum yield of 0.2. The overlap integrals used in the calculation of the Förster distances were computed using a free software tool [21].
Time-resolved fluorescence was measured by the single-photon timing (SPT) method using a mode-locked DPSS Nd:YVO4 green laser (Vanguard 2000-HM532, Spectra Physics Inc., Santa Clara, CA, USA) synchronously pumping a cavity dumped dye laser (701, Coherent, delivering frequency-doubled 3–4 ps pulses of about 40 nJ/pulse at 3.4 MHz) working with 4-(dicyanomethylene)-2-methyl-6-(4-dimethylaminostyryl)-4H-pyran (DCM). Emission light was detected by a Hamamatsu 2809U-01 microchannel plate photomultiplier (Hamamatsu Photonics K.K., Ichino-cho, Higashi-ku, Japan) at 426 nm, using an excitation wavelength of 340 nm. Experimental intensity decays were fitted to the multi-exponential model: , where αi are the amplitudes of the component decays at t = 0 and τi the fluorescence lifetimes. The intensity average lifetime was determined by the expression 〈τ〉int = ∑αiτi2/∑αiτi, while the amplitude average lifetime was calculated by 〈τ〉amp = ∑αiτi/∑αi.
The pHs of aqueous/buffered solutions were determined at ca. 25 °C with a pH VWR pHenomenal® UM 6100L equipped with a pH electrode phenomenal 221 (VWR International BVBA, Leuven, Belgium).
2.2. Materials
Methylene blue (MB, reagent grade, Merck, Darmstadt, Germany), methyl orange (MO, for microscopy, Merck, Darmstadt, Germany), fuchsin (Fch, for microscopy, Merck, Darmstadt, Germany), indigo carmine (IC, pro analysis, Riedel-de Haën, Hannover, Germany), methyl red (MR, reagent grade, BDH, BDH Chemicals, London, UK), rhodamine 6G (Rh-6G, 99%, Acros Organics, Thermo Fisher Scientific, Bridgewater, NJ, USA), Rhodamine 101 (99%, Radiant Dyes Laser & Accessories GmbH, Wermelskirchen, Germany), copper(II) perchlorate hexahydrate (98%, Acros Organics, Thermo Fisher Scientific, NJ, USA), lead(II) perchlorate trihydrate (99%, Acros Organics, Thermo Fisher Scientific, NJ, USA), iron(II) perchlorate hydrate (reagent grade, Alfa Aesar, Kandel, Germany), cobalt(II) perchlorate hexahydrate (reagent grade, Alfa Aesar, Kandel, Germany), iron (III) perchlorate hydrate (reagent grade, Alfa Aesar, Kandel, Germany), and mercury(II) perchlorate trihydrate (reagent grade, Alfa Aesar, Kandel, Germany), sodium nitrate (extra pure, crystalized, Merck, Darmstadt, Germany), sodium carbonate (pro analysis, 99.5%, anhydrous, Merck, Darmstadt, Germany), sodium chloride (pro analysis, 99.5%, Panreac, Barcelona, Spain), sodium sulphate (pro analysis, 99%, anhydrous, Panreac, Barcelona, Spain), and ethylenediamine (EDA, >99.5%, Fluka, Sigma-Aldrich Corp., St. Louis, MO, USA) were used as received. All other reagents and solvents were of analytical grade and were purified and/or dried by standard methods. Ultrapure water (Milli-Q, Millipore; Merck KGaA, Darmstadt, Germany) was used in all the experiments unless otherwise stated.
3. Results and Discussion
3.1. Synthesis and Characterization of WP-CDs
The WP-CDs used in the present study were synthesized and fully characterized (FT-IR, Raman, XPS, 1H/13C NMR, and TEM) according to our recent report [17]. A brief account of their synthesis and representative structural and morphological analysis (Figure S1) of WP-CDs may be found in the Supplementary Materials.
3.2. Photophysical Properties of WP-CDs
A detailed description and discussion of the photophysical properties of WP-CDs have been given elsewhere [17]; hence, only a brief account of the most relevant properties pertinent to the current work will be given here. The absorption spectrum of WP-CDs in phosphate-buffered solutions (0.1 mg/mL) extends from the far UV into the visible region (absorption cut-off near 600 nm), displaying bands at around 247 nm, 278 nm, and 318 nm, with a profile very similar to that shown in water medium (Figure 1a). The higher-energy bands were attributed to π - π* transitions of sp2 hybridized carbon structures typically existent in short-conjugated olefin systems and aromatic moieties, while that peaking at the longer wavelength was assigned to π-conjugated systems (olefinic and aromatic) with an extended conjugation lengths and n - π* and π - π* mixed transitions of conjugated carbonyl, carboxyl, and imine functions. WP-CDs display a strong blue luminescence at around 426 nm when excited at 340 nm (Figure 1a), with the emission maximum depending on the excitation wavelength (see [17] for a detailed analysis).
The WP-CDs are characterized by a high-fluorescence quantum yield (QY ~0.20) in aqueous solutions [17]. Time-resolved fluorescence measurements by the single-photon timing (SPT) method have shown that WP-CDs’ decay times are multi-exponential and best described by a sum of three exponentials either in water or in buffered solutions at pH ~ 7 (Figure 1b). Intensity average lifetimes (〈τ〉int) of 9.9 ns (χ2 = 1.17) and 8.5 ns (χ2 = 1.07) were obtained for water and buffered solutions, respectively.
3.3. Sensing of Dyes, Transition Metal Cations, and Anions by WP-CDs
Six dyes (Chart 1) were screened for their interaction with WP-CDs probes.
The photostability of the WP-CDs (0.1 mg/mL) in air-equilibrated buffered solutions (pH = 7.2) has been previously assessed under the same conditions used in the sensing assays (pulsed xenon discharge lamp with an average power of 7.3 W at 50 Hz); no noticeable photodegradation was apparent up to 1.5 h of irradiation [17]. The photostability over time was also examined. The results showed that the WP-CDs’ QY remains essentially the same (±3%) over at least a 10-month period provided the samples are kept refrigerated and protected from light. Furthermore, a negligible effect on the WP-CDs’ PL was found on media of increasing ionic strength (I). Indeed, when I is raised from 0.15 M (phosphate buffer 50 mM) to 1.15 M (phosphate buffer 50 mM plus 1000 mM of NaCl) through the addition of NaCl at 25 °C, only a minor decrease of PL was observed (Figure S2) even at the highest NaCl concentration, assuring the potential use of WP-CDs probes in media of high ionic strength. A slightly higher quenching effect was noticed at 50 °C (Figure S2).
The sensing assays were carried out at a fixed concentration (10 μM) of the dyes in a phosphate buffer (pH = 7.2), using a probe’s concentration of 0.1 mg/mL. Figure 2a depicts the observed variation of photoluminescence (PL) intensity of WP-CDs upon irradiation at 340 nm. As may be clearly seen from the data gathered in Figure 2b, the higher sensitivity was attained for the azo dyes and was largely superior for MO. The other anionic dye (IC) and all the cationic dyes (Fch, MB. and Rh-6G) are either insensitive or present only a marginal effect on the nanoparticles’ emission.
The quenching dependence on pH was ascertained for the two azo dyes (Figure 3). From these experiments, it resulted that the fluorometric detection of the two azo dyes may be distinguishable by a pH change. Indeed, while for MO a very slight increase (~5%) in the quenching efficiency is observed when the pH is raised from 7.2 to 11.4, the neutral azo dye decreases its quenching activity by ca. 25%.
In aqueous acidic media (pH = 2.2), the WP-CDs emission is barely disturbed by the two azo dyes, with MO reducing less than 5% of the pristine PL intensity and MR enhancing it by a near amount (Figure 3). The lack of significant fluorescence quenching in this condition may reflect the protonation of the dimethylamino group present in both dyes, precluding the electronic delocalization toward the azo group and the distal aryl ring of the dyes (extended to the sulfonate group in MO and carboxylate group in MR compared to the structures attained in neutral and basic pH) and to the protonation of the carboxylate and amino functionalities existing in the WP-CDs [17]. These two effects taken together should result in a reduction of the ionic and dipolar interactions between the probe and the dyes since all the interacting species are now positively charged. In other words, the binding interaction is reduced as well as, concomitantly, the association constant of complex formation (see below the notes on the quenching mechanism).
Possible interference of transition metal cations in the detection of MO by WP-CDs was next evaluated. For that, perchlorate salts of Cu(II), Co(II), Fe(II), Fe(III), Hg(II), and Pb(II) were first assayed independently at a concentration of 10 μM in phosphate buffer. Figure 4 shows the observed results compared to MO. All the metal cations showed a low or null quenching effect on the WP-CDs emission.
Competitive experiments with the highest effective quencher (MO) in the presence of other dyes, metal cations (perchlorate salts), and anions (sodium salts) were next carried out, with the concentration of all species being maintained at 10 μM. The outcome of such assays (Figure 5) undoubtedly showed that the presence of additional dyes, cations, or anions in the media does not have a significant impact on the PL quenching attained by MO alone.
Therefore, according to all the foregoing results, WP-CDs are highly capable of selectively detecting the methyl orange dye in the presence of various competing dyes, transition metal cations, and anions.
3.4. Sensitivity of WP-CDs toward Methyl Orange Dye
Having established the superior sensing behavior of WP-CDs to MO, fluorescence titration studies were then undertaken. The response of WP-CDs to MO was evaluated in a concentration range of 1.2 μM to 53 μM in phosphate buffer (pH = 7.2). Upon successive additions of the analyte with increasing concentrations (Figure 6), while keeping a constant fluorophore concentration (0.1 mg/mL), a strong quenching of WP-CDs emission was observed upon irradiation at 340 nm.
Plotting the as-acquired fluorescence intensity data (F0/F) versus MO concentration, one immediately sees an upward curvature (Figure 6b), top curve). Reasons for this behavior may have diverse origins that are usually traced to combined static and dynamic quenching mechanisms (F0/F = (1 + KD[Q])(1 + KS[Q]), where KD and KS are the dynamic and static Stern-Volmer (SV) constants and Q the quencher) or to a sphere of effective quenching model (F0/F = exp(VqNa[Q]), where Vq is the volume of the sphere-of-action, and Na is the Avogadro constant) [9]. A closer look at the fluorescence titration curves shows that their shape changes as the concentration of MO is raised, with a concomitant apparent blue shift at the emission maxima. This clearly indicates that hetero inner-filter effects (h-IFEs), resulting from the absorption of radiation by MO at the excitation (340 nm) and emission (426 nm) of WP-CDs, are in play [9]. Correction of primary (at excitation wavelength) and secondary (at emission wavelength) IFEs was then undertaken following accepted literature procedures [19], as early used by Parker et al. [22] and Christmann et al. [23], respectively; both correction functions take into account the geometry of the fluorescence observation window of the cell (see the Materials and Methods section for details). After applying such corrections to the full concentration range, an almost-linear Stern-Volmer (SV) plot (Figure 6b, bottom curve) was obtained (F0/Fcorr = 1 + KSV[MO]), indicating that the observed quenching is essentially either purely static or dynamic (see discussion on the mechanism below). Deviations from linearity were most noticed at concentrations of MO above ca. 15 μM, showing a downward curvature of the SV plot that probably reflects an over-correction effect owing to the inability of the correction functions to deal with highly optically dense samples. For this reason, the calculation of the corrected SV constant was restrained to the linear range.
From the fluorescence-corrected titration data up to [MO] of 15.1 μM, a KSV of 2.0 ± 0.155 × 10⁴ M−1 (R2 = 0.9656) was retrieved, showing an impressive sensitivity of WP-CDs to MO (Figure 6c, bottom curve). Following the 3σ convention, the limit of detection (LOD) of MO was estimated as 0.46 μM (151 ppb). Benchmarks against reported literature values are difficult to make, mainly because many of the reported LOD results from fluorometric measurements [10,11,12,13,15] do not undertake any correction for IFEs; actually, in some of the reports, trivial quenching effects (IFEs) are indicated as the “quenching mechanism” in action. Failure to adhere to IFEs corrections may have a strong impact on the magnitude of Stern-Volmer constants [24] and on the calculation of the LOD. To have a small glimpse of such an impact on the SV constant and on the limits of detection of methyl orange by WP-CDs’ probe without any correction for IFEs, the linear part (up to 15.1 μM of MO; seven data points, with the last showing a F0/F = 2.32) of the uncorrected SV plot (Figure 6b, top curve) was considered. The uncorrected KSV (Figure 6c), top curve) is more than fourfold higher than the corrected one, increasing to 8.5 ± 0.205 × 10⁴ M−1 (R2 = 0.9980). The LOD is reduced to 0.11 μM (37 ppb). This outcome shows that a careful correction for IFEs should always be carried out in order to obtain meaningful and reliable results of sensitivity. Sensing based on direct IFEs readouts is limited by its inherent lack of selectivity in the way that every single analyte with a similar absorption profile will generate the same quenching effect unless proper ratiometric or sensor array-based fluorescence methods are used [19]. Nonetheless, Table 1 presents a comparison of recent reported fluorescence methods for MO detection along with the proposed mechanisms of quenching and LOD. As it seems evident, our sensing system based on WP-CDs displays an outstanding behavior even after correction for IFEs. It is noteworthy that studies conducted with different batches of WP-CDs, differing in their preparation by 15 months, did not reveal any significant differences on their ability for MO sensing.
As a demonstration of the feasibility of WP-CDs to work as a luminescent probe for MO detection in real water samples, known amounts of MO were spiked into tap water (Lisbon public water system, EPAL) [25], and the calculated concentrations of MO retrieved from interpolation on a standard working curve compared to those of MO previously added. Recoveries ranging from 94.1% to 103.8% with RSDs below 1.63% were obtained (Table S1). These results suggest that the proposed sensing method is reliable and may be applied to real samples.
3.5. Quenching Mechanism
The processes by which the WP-CDs’ fluorescence intensity is decreased upon addition of MO may involve: (i) the formation of a non-fluorescent ground-state complex (static quenching); (ii) a through-space resonance energy transfer (RET); and (iii) collisional quenching. The latter two are dynamic processes, both occurring during the lifetime of the excited-state of the intervening species. Excluded are the already-mentioned trivial quenching effects (IFEs) owing to the correction applied.
From the foregoing quenching results, a high KSV (2.0 × 10⁴ M−1) was found in the titration experiments of WP-CDs with the methyl orange dye. Such a magnitude for an SV constant is usually indicative of systems showing medium-to-strong binding interactions between the fluorophore and the quencher in the ground state, pointing in general to a static mechanism, with KSV having the meaning of the association constant of complex formation. Evidence for the formation of non-fluorescent ground-state complexes may be found, in some cases, upon examination of the absorption spectra of mixtures and that of the isolated components. In the present case, a perceptible change in the absorption spectrum of WP-CDs in the region between 240–450 nm was found upon complexation; indeed, a hyperchromic shift was observed in the absorption spectrum of the experimental mixture (WP-CDs and MO) when compared to the sum of spectra of the individual components of the mixture (Figure 7a).
We interpreted this rise in the absorption intensity of the complex to an increase of the molar absorption coefficient of the complexed WP-CDs compared to the free chromophore (Figure 7b), hence suggesting the presence of static quenching. Furthermore, the fluorescence lifetime measurement of WP-CDs in phosphate buffer at pH = 7.2 (Figure 2b) resulted in an intensity average lifetime (〈τ〉int) of 8.5 ns. Considering the Stern-Volmer constant calculated for the same system (KSV = 2.0 × 10⁴ M−1 M−1), the apparent bimolecular quenching constant (kqapp = KSV/〈τ〉int) was estimated as 2.3 × 10¹² M−1 s−1. This value is over two orders of magnitude higher than that accepted for collisional quenching processes limited by diffusion in aqueous solutions (ca. 1.0 × 10¹⁰ M−1 s−1) [26]. Such a high value for kqapp is clearly indicative of binding interactions between the WP-CDs and the dye, again pointing to a static mechanism and ruling out collisional quenching.
The possibility of having any dynamic component combined with the static quenching was evaluated by time-resolved fluorescence titrations of WP-CDs with increasing amounts of MO (up to 201 μM).
Figure 8a shows the decay curves obtained. After fitting the lifetime decays to a sum of three exponentials (best fit), the amplitude lifetime averages (〈τ〉amp) were calculated. By plotting the ratio of the average lifetimes (〈τ0〉amp/〈τ〉amp) against the dye’s concentration (Figure 8b), a dynamic quenching constant (KD) of 2.4 × 10³ M−1 was obtained. Therefore, a dynamic process is also undoubtedly operative, at least at the higher dye concentration. The dynamic component is only clearly observed at concentrations of the dye above 20 μM (until that concentration, corresponding nearly to the highest concentration used in the steady-state experiments that yields a linear relationship, the 〈τ0〉amp/〈τ〉amp is ~1). Therefore, this helps to explain why, though being an apparent combined quenching mechanism (static plus dynamic), a linear relationship of F0/F vs. [Q] was obtained in the low-concentration regime (see Figure 6b).
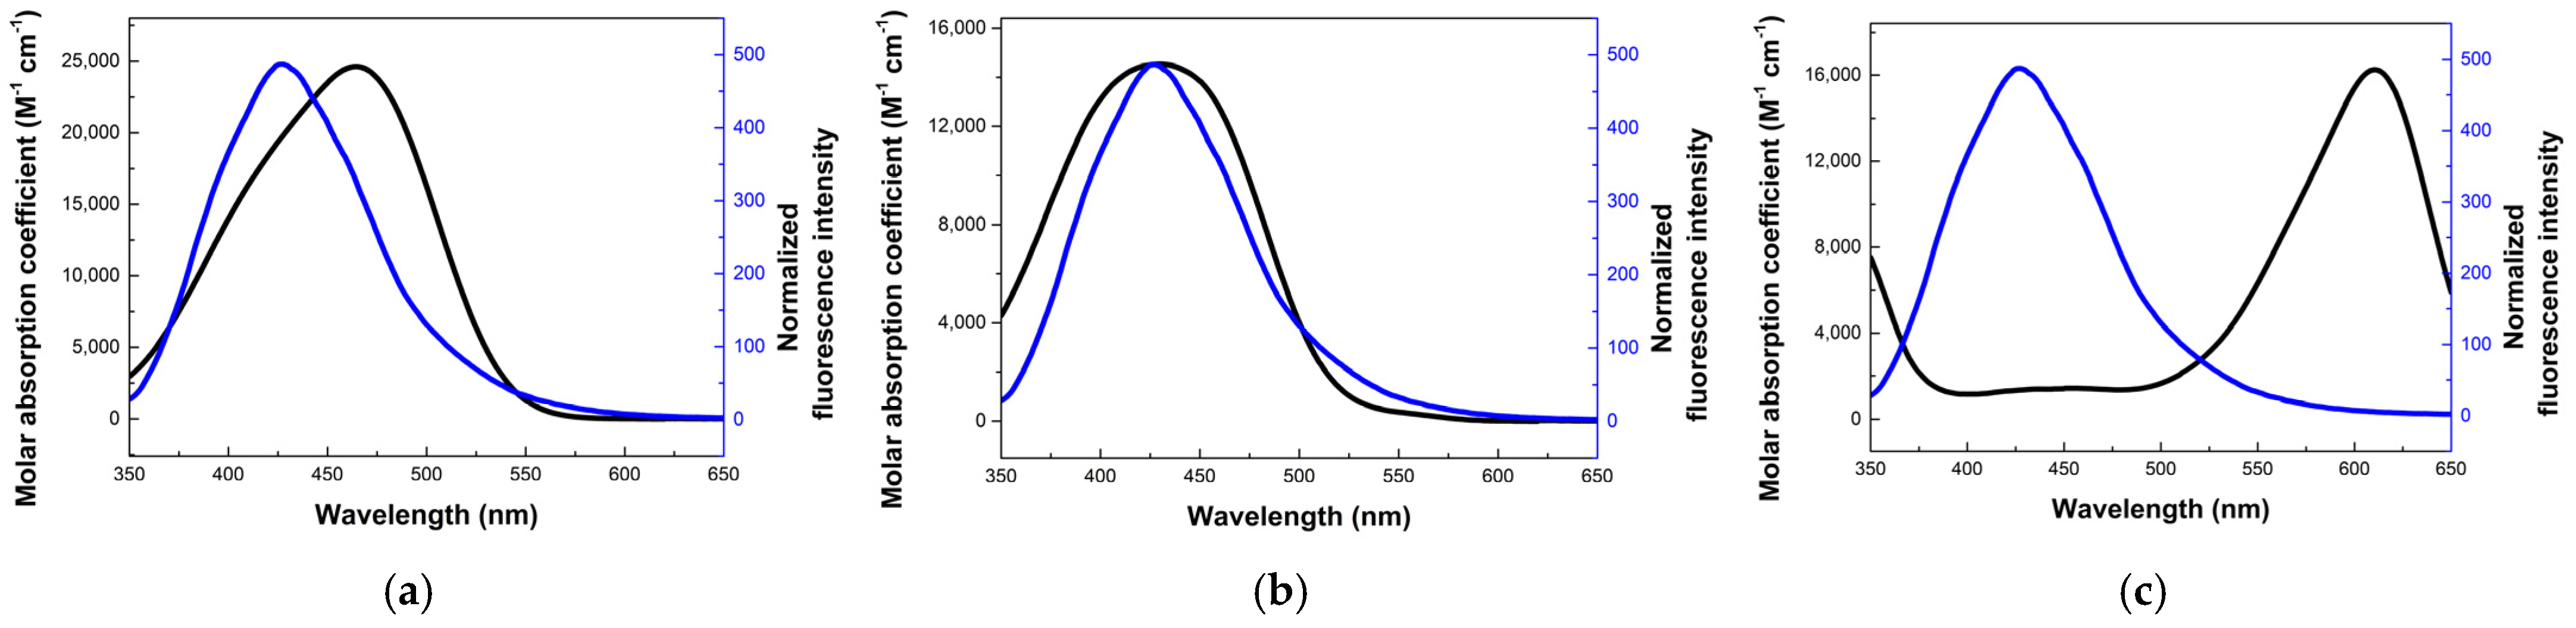
The origin of the dynamic quenching ought to be explained. A collisional mechanism may again be ruled out because the obtained KD translates into a kqapp of 2.8 × 10¹¹ M−1s−1, which is well over that expected for a diffusion-controlled mechanism of fluorescence quenching. On the other hand, considering that the emission spectrum of WP-CDs strongly overlaps the absorption spectrum of MO (Figure 9a), the existence of a non-radiative resonance energy transfer (RET) between these partners should be considered as a possible mechanistic pathway to account for the observed reduction of emission under the time-resolved experiment. If such an excited-state event is occurring, it is governed by long-range dipole–dipole excitation energy transfer, as described by the Förster theory [9], requiring very weak coupling interactions between the energy donor (WP-CDs) and the acceptor (MO). In the general description of the RET theory, the rate of energy transfer (kET) from a donor (D) to an acceptor (A) is given by kET = 1/τD × (R0/r)6, where τD is the lifetime of the D in the absence of ET, R0 is the critical ET distance (or Förster distance) at which half of D molecules decay by RET and the other half by radiative and non-radiative decays, and r is the D-A distance. After performing the calculations for the WP-CDs-MO system (see the Materials and Methods section for details), an R0 = 36.9 Å was reached. For the other surveyed dyes, lower critical distances were found (Table 2), reflecting the smaller spectral overlap occurring within those systems (Figure 9b–f and Table 2). Based on these results, a somewhat higher RET efficiency is expected for the WP-CDs-MO pair. Upper and lower estimates of the EET in the WP-CDs-MO system can be obtained considering the RET dynamic and static limits for a homogeneous solution, respectively [9].
For [MO] = 200 μM, the experimental value is F0/F = 1.5. In the case of static quenching (lower limit), F0/F = 1.04. In the case of the dynamic limit, and assuming a distance of closest approach of 16.6 Å, roughly given by the sum of the radii of WP-CDs (~12.5 Å) and MO (~4.14 Å), one obtains a kqapp of 1.5 × 10¹¹ M−1 s−1 corresponding to F0/F = 1.3. Considering all approximations involved, including inner the filter corrections and the use of average lifetimes, it can be concluded that RET is the likely dynamic quenching mechanism.
4. Conclusions
A highly sensitive and selective fluorescent probe to azo dyes has been disclosed. The research has highlighted that carbon dots synthesized from an abundant and highly localized olive mill waste have a remarkable ability to sense anionic and neutral azo dyes. Through competitive fluorescence experiments with other dyes, transition metal salts, and common anions, a high selectivity was witnessed for methyl orange, a model of the widely used sulphonic azo dyes. Fluorometric titration revealed that WP-CDs has a very high sensitivity to MO, allowing its detection at sub-micromolar levels (LOD = 0.46 μM) in aqueous media. Detailed photophysical studies were carried out, which allowed us to suggest a static quenching mechanism as the main mechanistic pathway responsible for the reduction of PL intensity at low MO concentrations (up to near 20 μM). Above that concentration, a dynamic mechanism based on non-radiative resonance energy transfer is also clearly operative.
Supplementary Materials
The following supporting information can be downloaded at: https://www.mdpi.com/article/10.3390/chemosensors10110487/s1; Procedure for the synthesis of WP-CDs; Figure S1: FTIR, XPS, 13C NMR spectra and STEM image of WP-CDs; Figure S2: Effect of ionic strength on photoluminescence; Table S1: Detection of methyl orange in tap water.
Author Contributions
Conceptualization, J.V.P.; methodology, J.V.P. and M.N.B.-S.; investigation, D.A.S. and J.V.P.; resources, J.V.P. and M.N.B.-S.; data curation, J.V.P.; supervision, J.V.P. and M.N.B.-S.; writing—original draft preparation, J.V.P.; writing—review and editing, J.V.P. All authors reviewed and/or revised the manuscript. All authors have read and agreed to the published version of the manuscript.
Funding
This research was partially funded by Fundação para a Ciência e a Tecnologia/Ministério da Ciência, Tecnologia e Ensino Superior (FCT/MCTES), Portugal, under the research units grants to CQ-VR (UIDB/00616/2022 and UIDP/00616/2022) and iBB (UIDB/04565/2020, UIDP/04565/2020) and i4HB (LA/P/0140/2020).
Institutional Review Board Statement
Not applicable.
Informed Consent Statement
Not applicable.
Data Availability Statement
Not applicable.
Acknowledgments
We thank A.A. Fedorov (IST, Universidade de Lisboa) for his assistance on SPT measurements and A.I. Costa (ISEL, Instituto Politécnico de Lisboa) for her assistance on some PL measurements. D.A.S. thanks FCT for the doctoral grant SFRH/BD/143369/2019.
Conflicts of Interest
The authors declare no conflict of interest. The funders had no role in the design of the study; in the collection, analyses, or interpretation of data; in the writing of the manuscript; or in the decision to publish the results.
Sample Availability
Samples of reported nanomaterials are available from the authors upon request.
References
- Summary Color Additives for Use in the United States in Foods, Drugs, Cosmetics and Medical Devices. Available online: https://www.fda.gov/industry/color-additive-inventories/summary-color-additives-use-united-states-foods-drugs-cosmetics-and-medical-devices#ftnote3 (accessed on 10 March 2022).
- Regulation (EC) Nº 1333/2008 of the European Parliament and of the Council of 16 December 2008 on Food Additives. Available online: https://eur-lex.europa.eu/legal-content/EN/TXT/HTML/?uri=CELEX:02008R1333-20200702#tocId52 (accessed on 10 March 2022).
- Nguyen, T.V.; Vu, D.C.; Pham, V.H.; Pham, T.B.; Pham, V.H.; Bui, H. Improvement of SERS for detection of ultra-low concentration of methyl orange by nanostructured silicon decorated with Ag nanoparticles. Optik 2021, 231, 166431. [Google Scholar] [CrossRef]
- Wu, L.; Pu, H.; Huang, L.; Sun, D.W. Plasmonic nanoparticles on metal-organic framework: A versatile SERS platform for adsorptive detection of new coccine and orange II dyes in food. Food Chem. 2020, 328, 127105. [Google Scholar] [CrossRef] [PubMed]
- Fang, G.; Wu, Y.; Dong, X.; Liu, C.; He, S.; Wang, S. Simultaneous determination of banned acid orange dyes and basic orange dyes in foodstuffs by liquid chromatography-tandem electrospray ionization mass spectrometry via negative/positive ion switching mode. J. Agric. Food Chem. 2013, 61, 3834–3841. [Google Scholar] [CrossRef] [PubMed]
- Ghoreishi, S.M.; Behpour, M.; Golestaneh, M. Simultaneous voltametric determination of Brilliant Blue and Tartrazine in real samples at the surface of a multi-walled carbon nanotube paste electrode. Anal. Methods 2011, 3, 2842–2847. [Google Scholar] [CrossRef]
- Chen, B.; Huang, Y. Dispersive liquid-phase microextraction with solidification of floating organic droplet coupled with high-performance liquid chromatography for the determination of Sudan dyes in foodstuffs and water samples. J. Agric. Food Chem. 2014, 62, 5818–5826. [Google Scholar] [CrossRef] [PubMed]
- Demchenko, A.P. Introduction to Fluorescence Sensing; Springer Science & Business Media: Berlin/Heidelberg, Germany, 2009. [Google Scholar]
- Valeur, B.; Berberan-Santos, M.N. Molecular Fluorescence: Principles and Applications, 2nd ed.; Wiley-VCH: Weinheim, Germany, 2012. [Google Scholar]
- Huang, J.; Wang, J.; Li, D.; Chen, P.; Liu, H.-B. Terthiophene-functionalized mesoporous silica-based fluorescence sensor for the detection of trace methyl orange in aqueous media. Microchim. Acta 2021, 188, 410. [Google Scholar] [CrossRef] [PubMed]
- Li, X.; Wang, Y.; Zhang, P.; Ge, W. Highly sensitivity, selectivity chemosensor for methyl orange using upconversion NaBiF4: Yb/Tm nanosheets. J. Solid State Chem. 2021, 301, 122307. [Google Scholar] [CrossRef]
- Tropp, J.; Ihde, M.H.; Crater, E.R.; Bell, N.C.; Bhatta, R.; Johnson, I.C.; Bonizzoni, M.; Azoulay, J.D. Sensor Array for the Nanomolar Detection of Azo Dyes in Water. ACS Sens. 2020, 5, 1541–1547. [Google Scholar] [CrossRef] [PubMed]
- Bogireddy, N.K.R.; Lara, J.; Fragoso, L.R.; Agarwal, V. One-step hydrothermal preparation of highly stable N doped oxidized carbon dots for toxic organic pollutants sensing and bioimaging. Chem. Eng. J. 2020, 401, 126097. [Google Scholar] [CrossRef]
- Hu, Y.; Gao, Z. Sensitive detection of Sudan dyes using tire-derived carbon dots as a fluorescent sensor. Spectrochim. Acta A Mol. Biomol. Spectrosc. 2020, 239, 118514. [Google Scholar] [CrossRef] [PubMed]
- Zulfajri, M.; Dayalan, S.; Li, W.-Y.; Chang, C.-J.; Chang, Y.-P.; Huang, G.G. Nitrogen-Doped Carbon Dots from Averrhoa carambola Fruit Extract as a Fluorescent Probe for Methyl Orange. Sensors 2019, 19, 5008. [Google Scholar] [CrossRef] [PubMed] [Green Version]
- Sousa, D.A.; Costa, A.I.; Alexandre, M.R.; Prata, J.V. How an environmental issue could turn into useful high-valued products: The olive mill wastewater case. Sci. Total Environ. 2019, 647, 1097–1105. [Google Scholar] [CrossRef] [PubMed]
- Sousa, D.A.; Ferreira, L.F.V.; Fedorov, A.A.; Rego, A.M.B.; Ferraria, A.M.; Cruz, A.B.; Berberan-Santos, M.N.; Prata, J.V. Luminescent Carbon Dots from Wet Olive Pomace: Structural insights, photophysical properties and cytotoxicity. Molecules 2022, 27, 6768. [Google Scholar] [CrossRef] [PubMed]
- Tsagaraki, E.; Lazarides, H.N.; Petrotos, K.B. Olive Mill Wastewater Treatment. In Utilization of By-Products and Treatment of Waste in the Food Industry; Oreopoulou, V., Russ, W., Eds.; Springer: New York, NY, USA, 2007. [Google Scholar]
- Panigrahi, S.K.; Mishra, A.K. Inner filter effect in fluorescence spectroscopy: As a problem and as a solution. J. Photochem. Photobiol. C Photochem. Rev. 2019, 41, 100318. [Google Scholar] [CrossRef]
- Long, G.L.; Winefordner, J.D. Limit of detection A closer look at the IUPAC definition. Anal. Chem. 1983, 55, 712A–724A. [Google Scholar] [CrossRef]
- Preus, S. a|e—UV-Vis-IR Spectral Software Version 2.2, FluorTools. Available online: www.fluortools.com (accessed on 20 March 2022).
- Parker, C.A.; Barnes, W.J. Some Experiments with Spectrofluorimeters and Filter Fluorimeters. Analyst 1957, 82, 606–618. [Google Scholar] [CrossRef]
- Christmann, D.R.; Crouch, S.R.; Holland, J.F.; Timnick, A. Correction of right-angle molecular fluorescence measurements for absorption of fluorescence radiation. Anal. Chem. 1980, 52, 291–295. [Google Scholar] [CrossRef]
- Stella, L.; Capodilupo, A.L.; Bietti, M. A reassessment of the association between azulene and [60] fullerene. Possible pitfalls in the determination of binding constants through fluorescence spectroscopy. Chem. Commun. 2008, 39, 4744–4746. [Google Scholar] [CrossRef] [PubMed]
- Dados da Qualidade da Água/Torneiras da Cidade de Lisboa. EPAL, Grupo Águas de Portugal, 2022. Available online: https://www.epal.pt/EPAL/menu/%C3%A1gua/divulga%C3%A7%C3%A3o-de-dados-da-qualidade-da-%C3%A1gua/controlo-legal/torneiras-na-cidade-de-lisboa (accessed on 3 November 2022).
- Lakowicz, J.R. Principles of Fluorescence Spectroscopy, 3rd ed.; Springer: New York, NY, USA, 2006; p. 282. [Google Scholar]
Scheme 1.
Top view of the 1 cm quartz cell used in the experiments. The geometric parameters used in the calculation of the IFEs were determined using Rhodamine 101 in water (excitation at 577 nm) and are as follows (in cm): x = 0.1, y = 0.9, u = 0.55, and v = 0.75.
Scheme 1.
Top view of the 1 cm quartz cell used in the experiments. The geometric parameters used in the calculation of the IFEs were determined using Rhodamine 101 in water (excitation at 577 nm) and are as follows (in cm): x = 0.1, y = 0.9, u = 0.55, and v = 0.75.

Figure 1.
(a) Absorption spectra of WP-CDs (0.1 mg/mL) in water (green line) and phosphate buffer (pH = 7.2) (black line) and the corresponding emission spectra (orange line, water; blue line, buffer), when excited at 340 nm. (b) time-resolved intensity decays (excitation at 340 nm and observation at 426 nm) obtained by SPT method of WP-CDs in the two media.
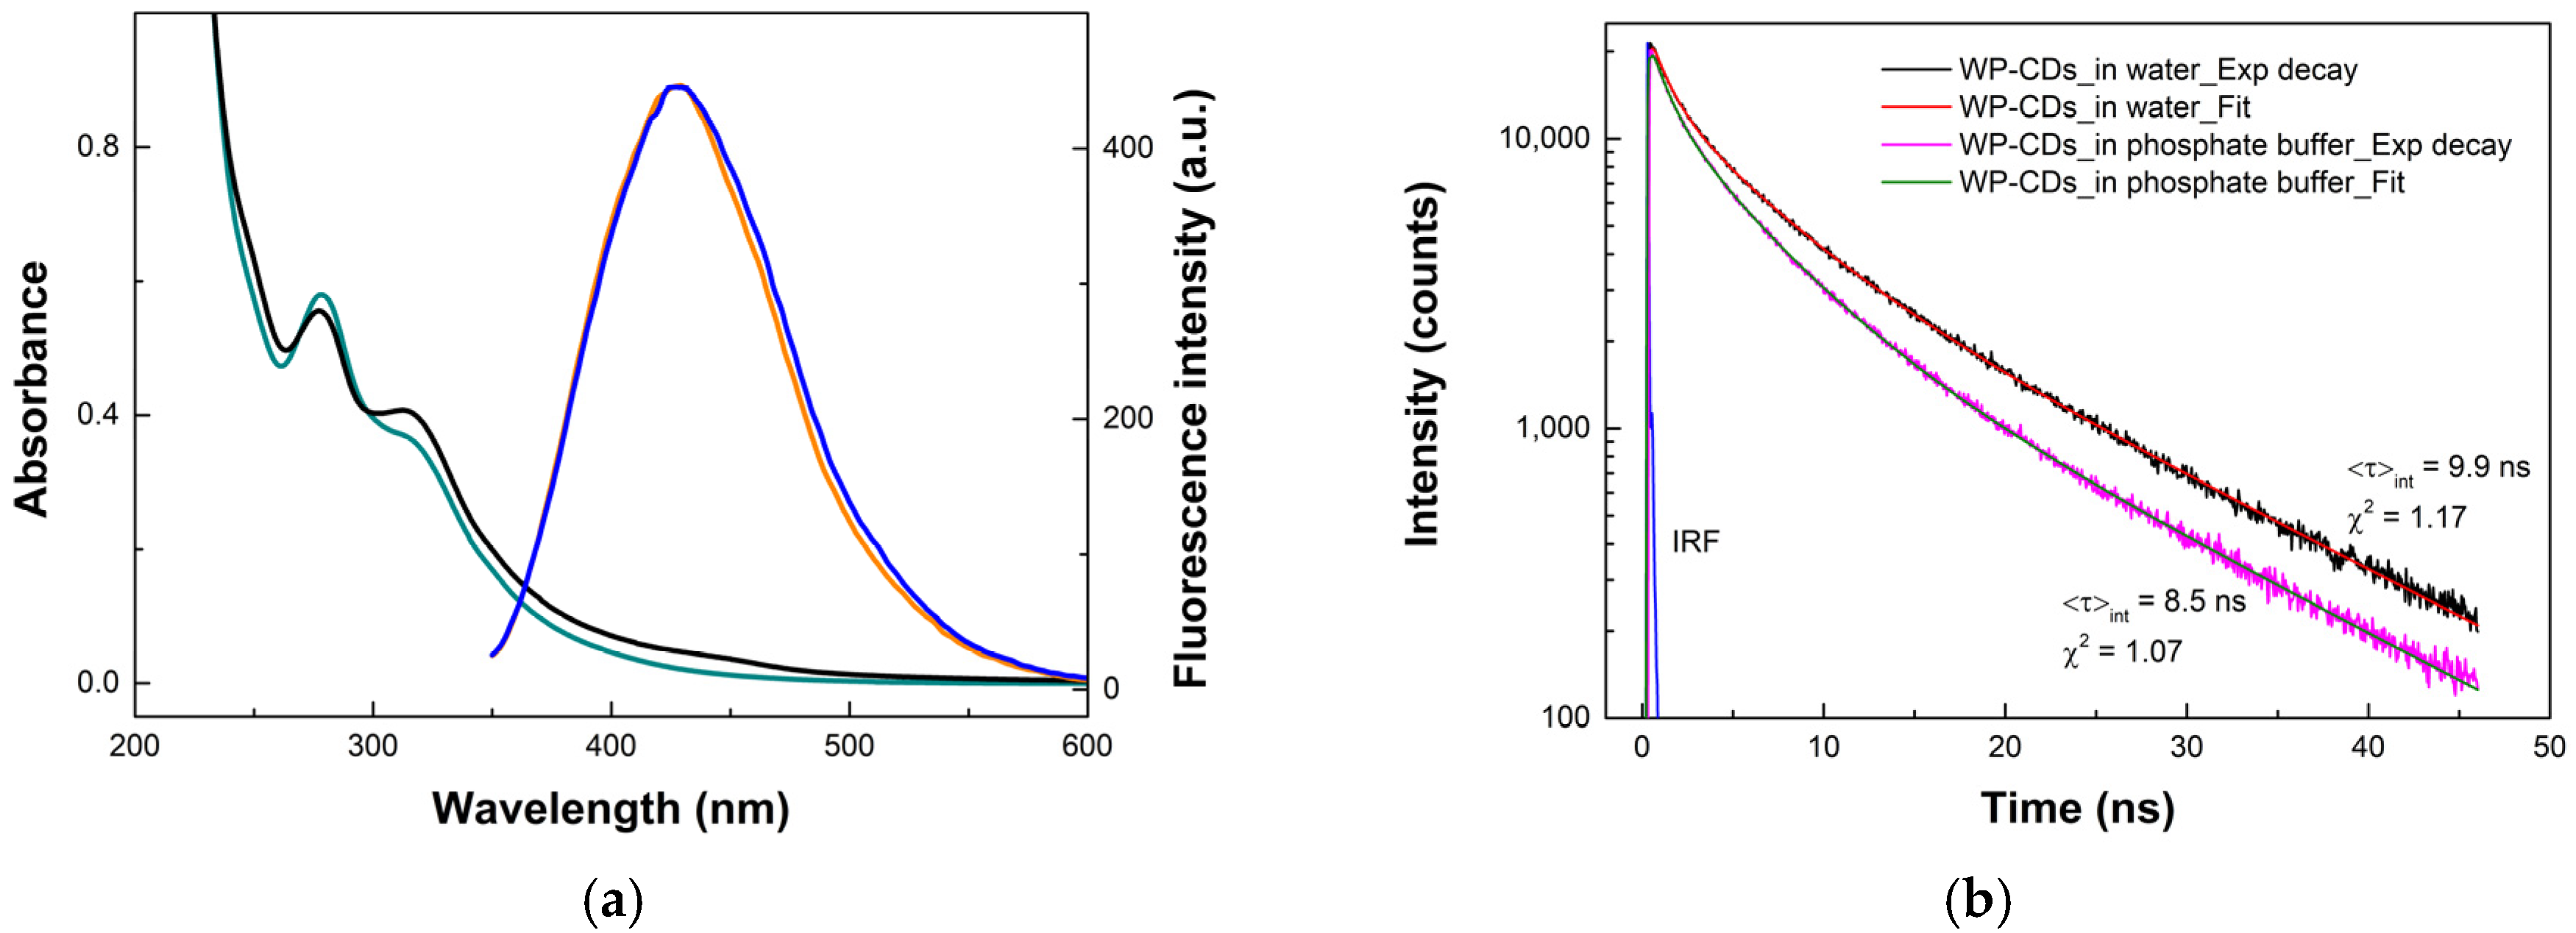
Chart 1.
Chemical structures of anionic, cationic, and neutral dyes used in the study.
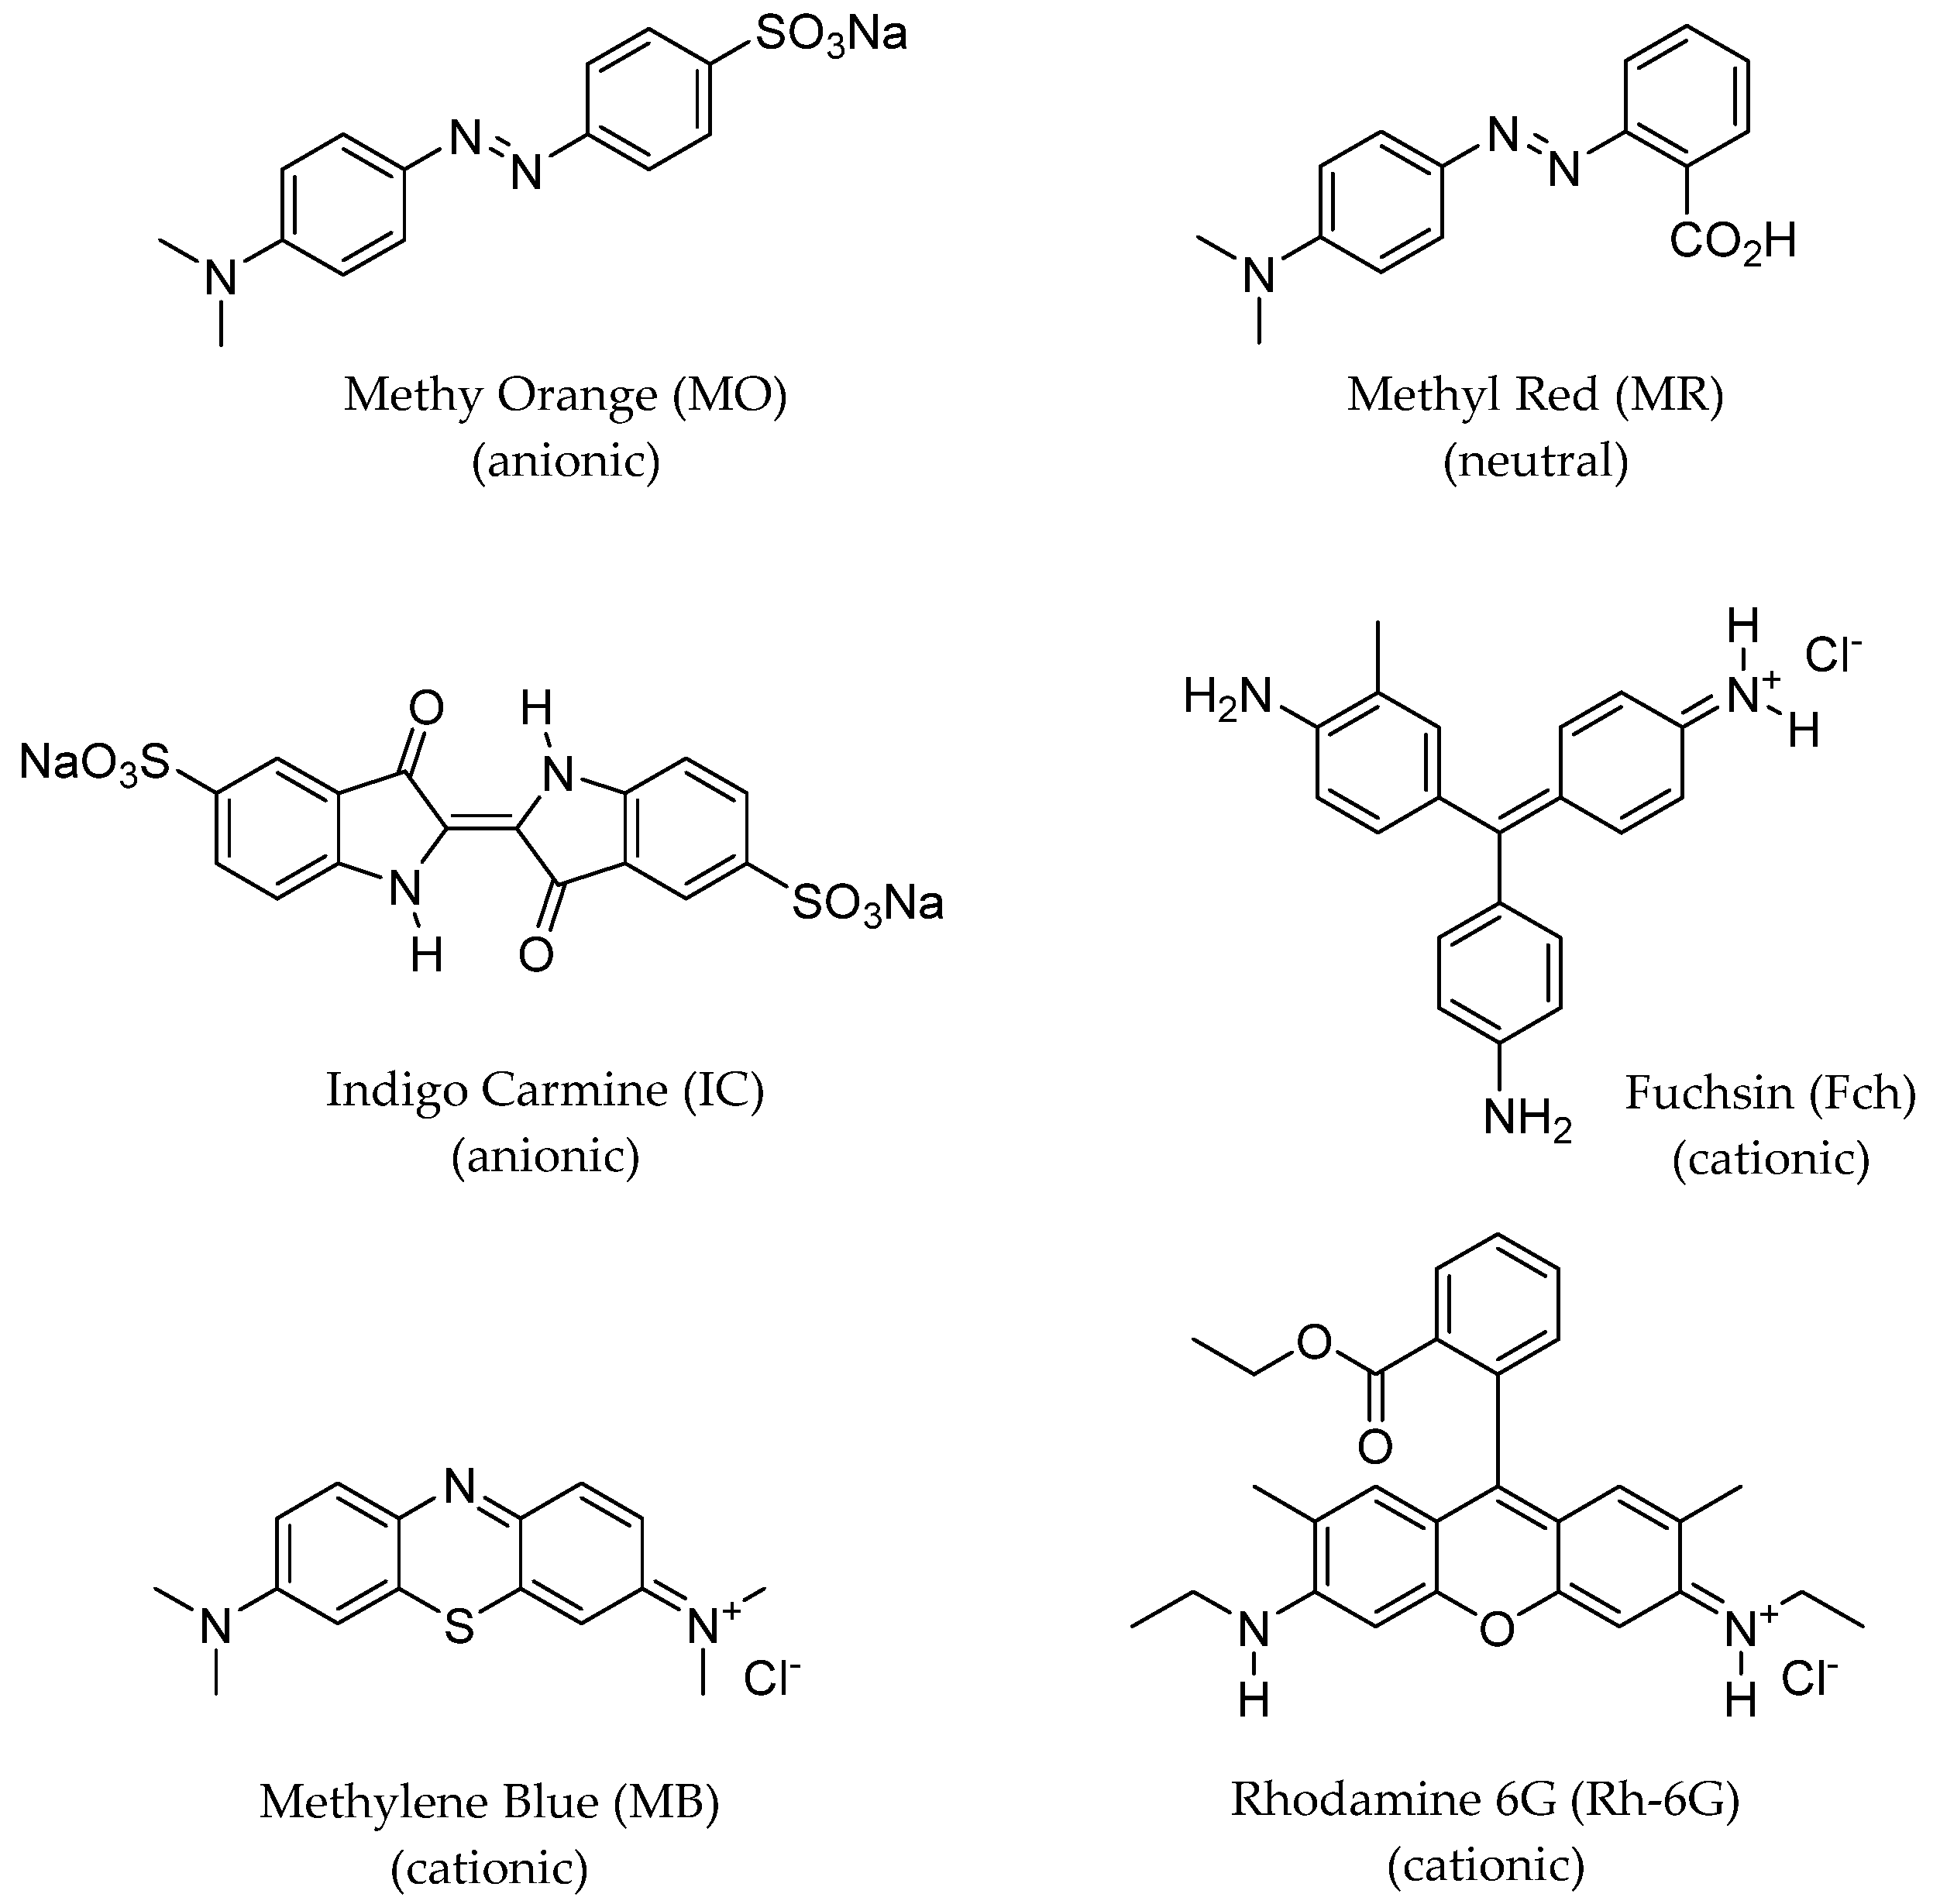
Figure 2.
(a) Emission spectra of WP-CDs in phosphate buffer (pH = 7.2) in the absence and upon addition of the dyes (10 μM). Excitation at 340 nm. (b) Extent of quenching of WP-CDs’ PL after contact with the dyes, corrected for inner filter effects at excitation (340 nm) and emission (426 nm) wavelengths.

Figure 3.
Quenching dependance on varying the pH (2.2, 7.2, and 11.4) of buffered solutions of WP-CDs (0.1 mg/mL) for 10 μM of MO (a) and MR (c) and the corresponding quenching efficiencies (b) and (d). Excitation at 340 nm in acetate (pH = 2.2), phosphate (pH = 7.2), and glycine (pH = 11.4) buffers. All data corrected for IFEs at excitation (340 nm) and emission (426 nm at pH 2.2 and 7.2 and 468 nm at pH 11.4).
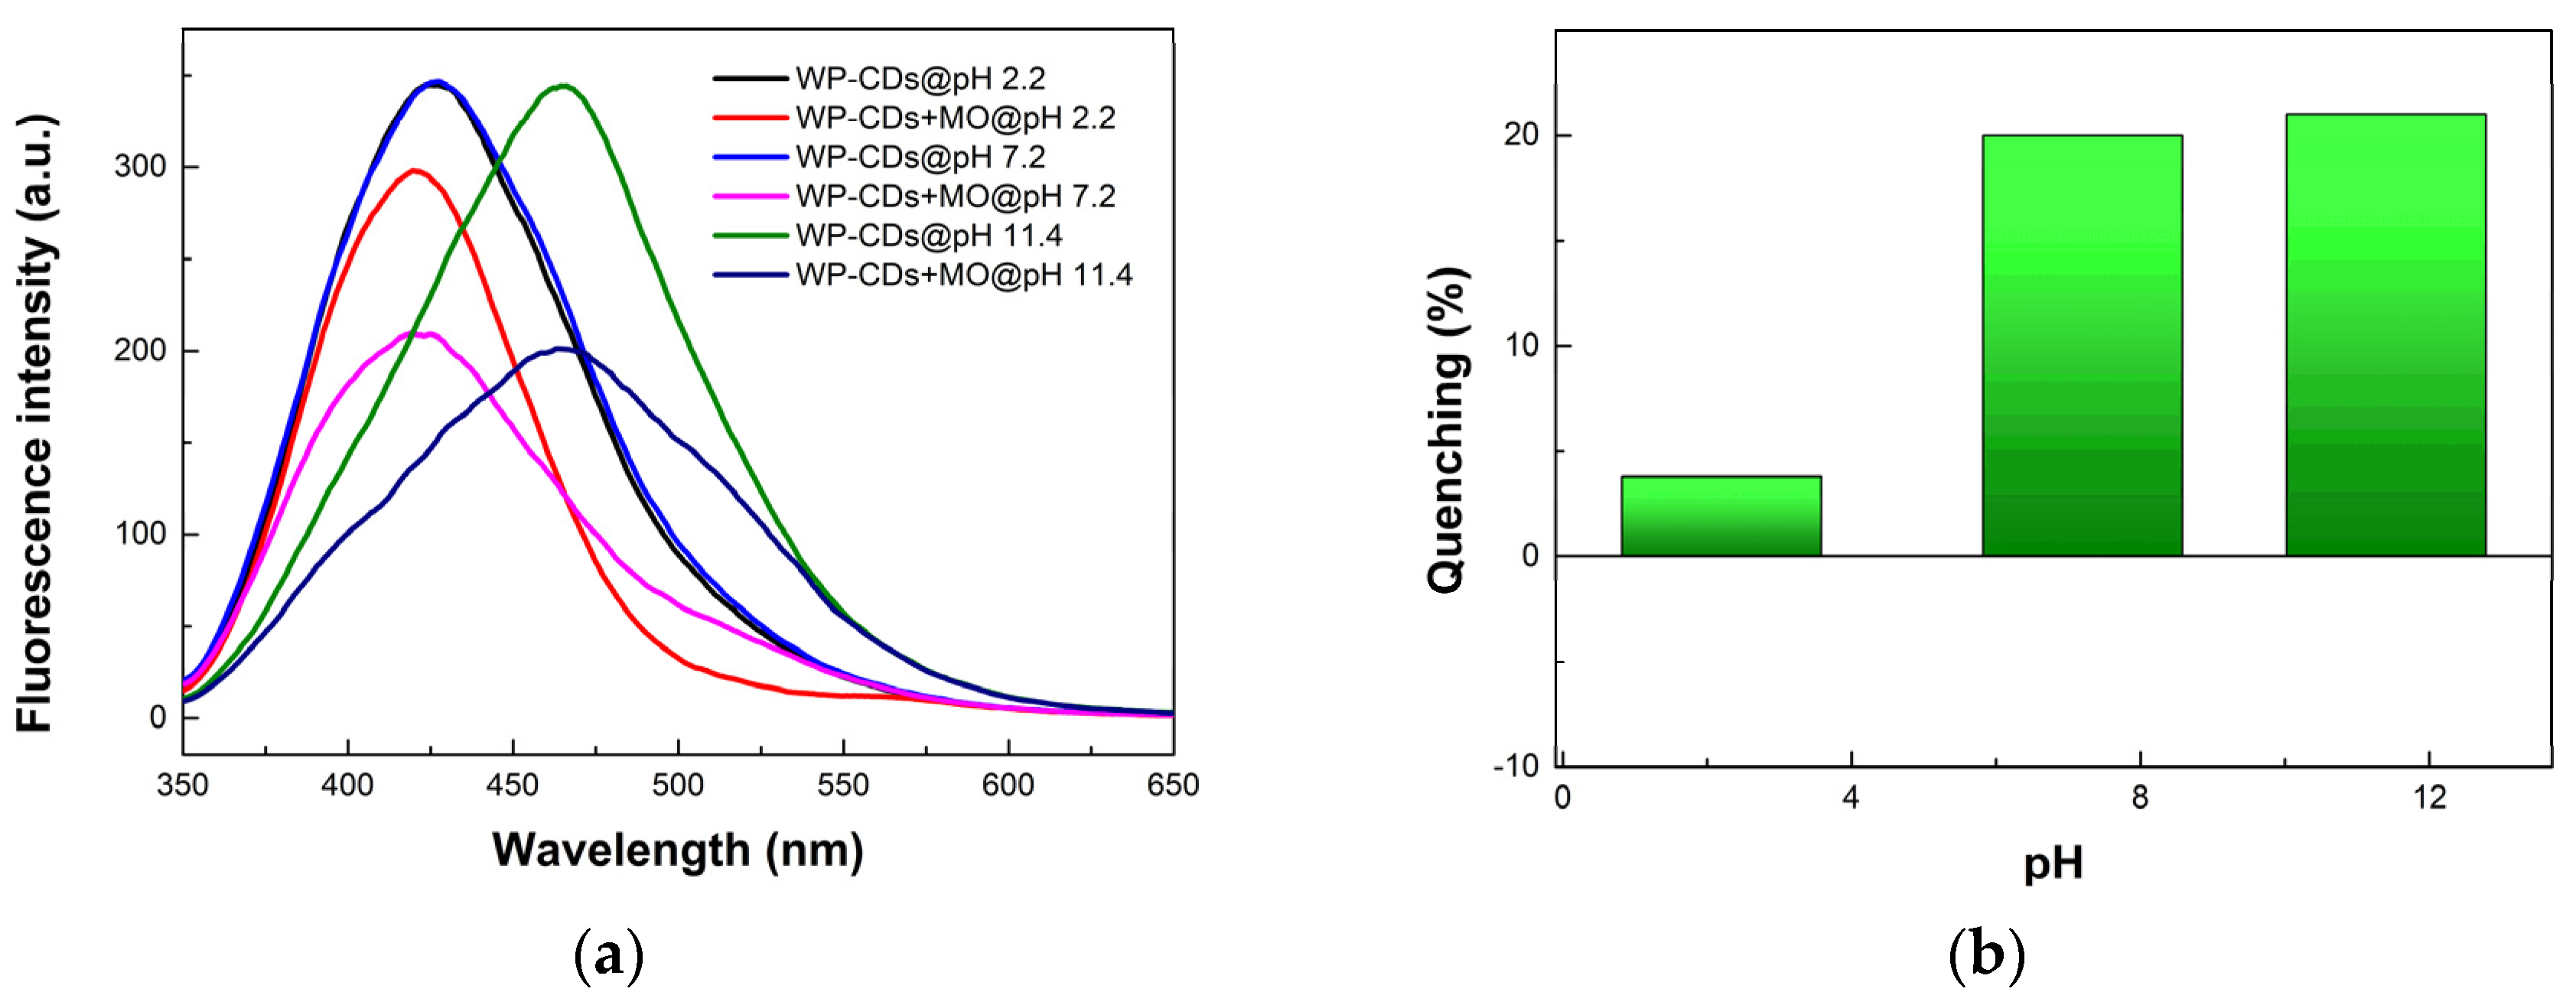
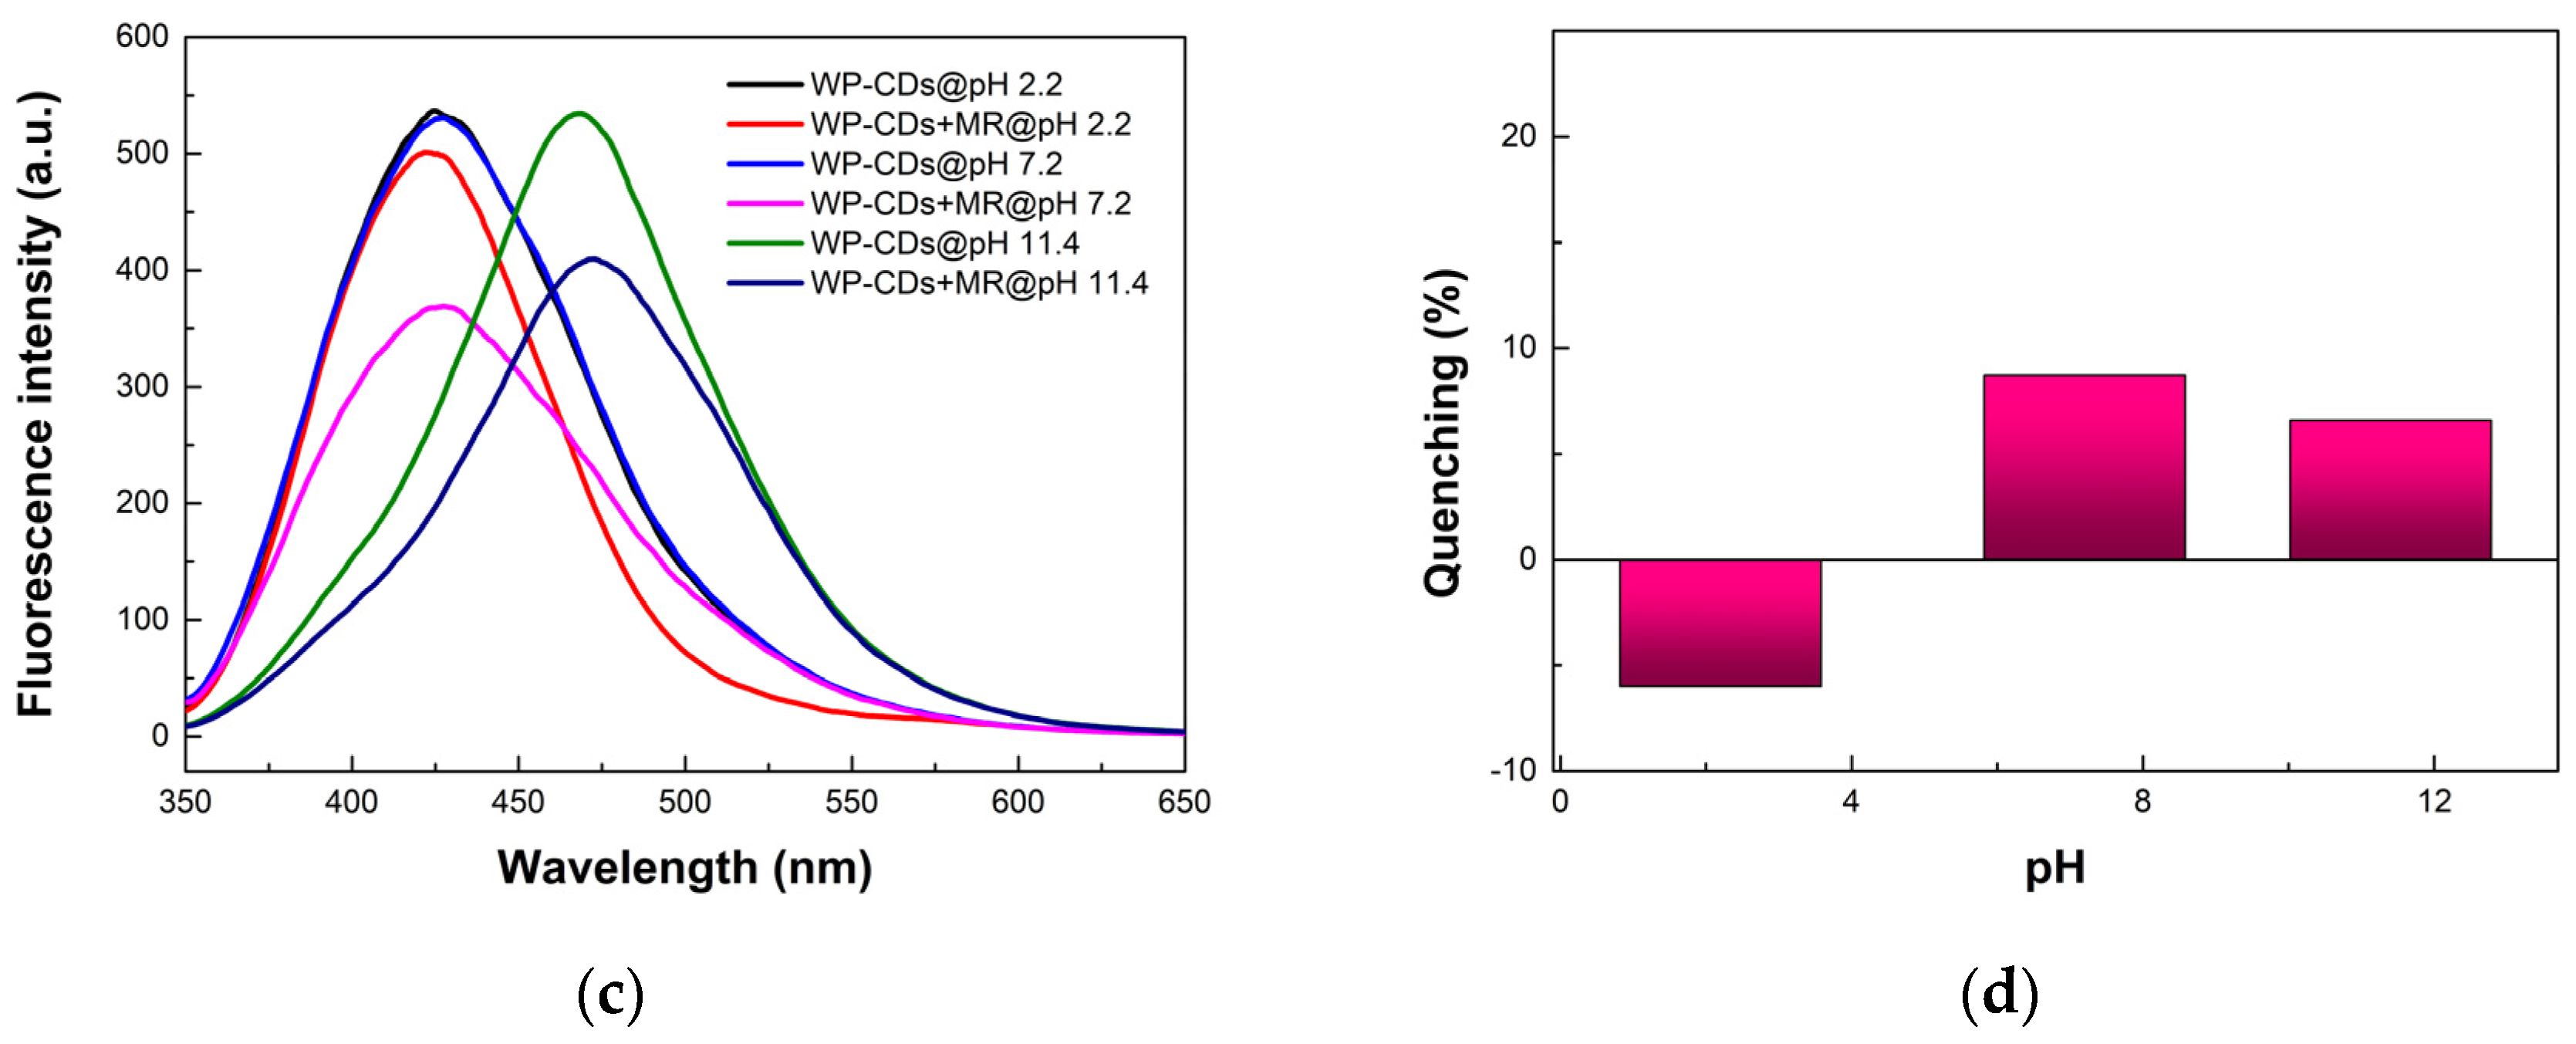
Figure 4.
(a) Emission spectra of WP-CDs in phosphate buffer (pH = 7.2) in the absence and upon addition of the metal salts (10 μM). Excitation at 340 nm. (b) Extent of quenching of WP-CDs fluorescence emission after contact with metal salts and MO. Data from MO corrected for IFEs; no correction was applied for the metal salts (optical densities at excitation and emission below 0.05).
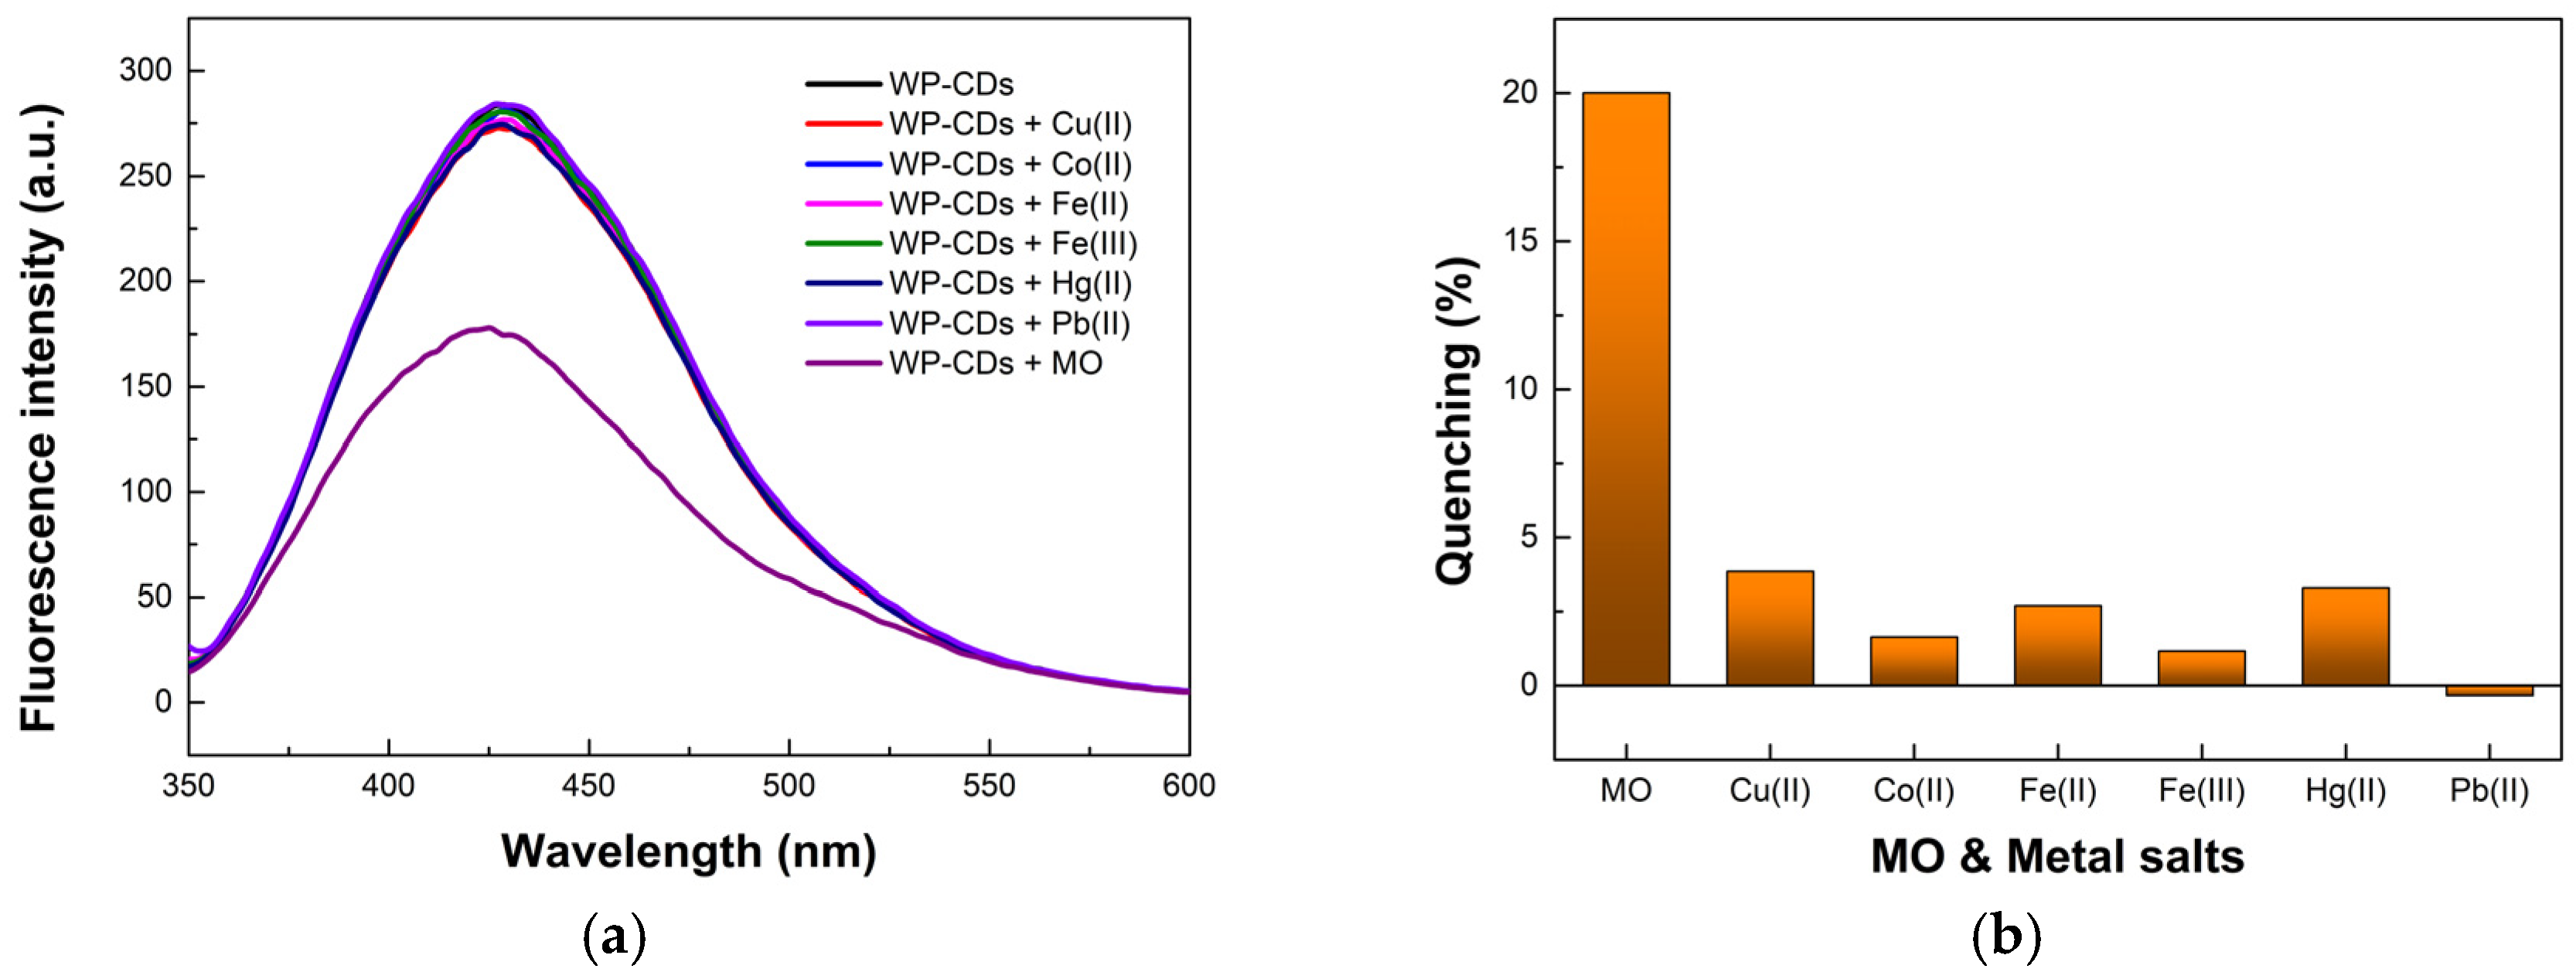
Figure 5.
Competitive quenching assays of WP-CDs emission upon addition of MO (10 μM) and equimolar amounts of possible interferents (other dyes (a), metal salts (b), and anions (c)) in phosphate buffer (pH = 7.2). Excitation at λ = 340 nm. All data corrected for IFEs.
Figure 5.
Competitive quenching assays of WP-CDs emission upon addition of MO (10 μM) and equimolar amounts of possible interferents (other dyes (a), metal salts (b), and anions (c)) in phosphate buffer (pH = 7.2). Excitation at λ = 340 nm. All data corrected for IFEs.
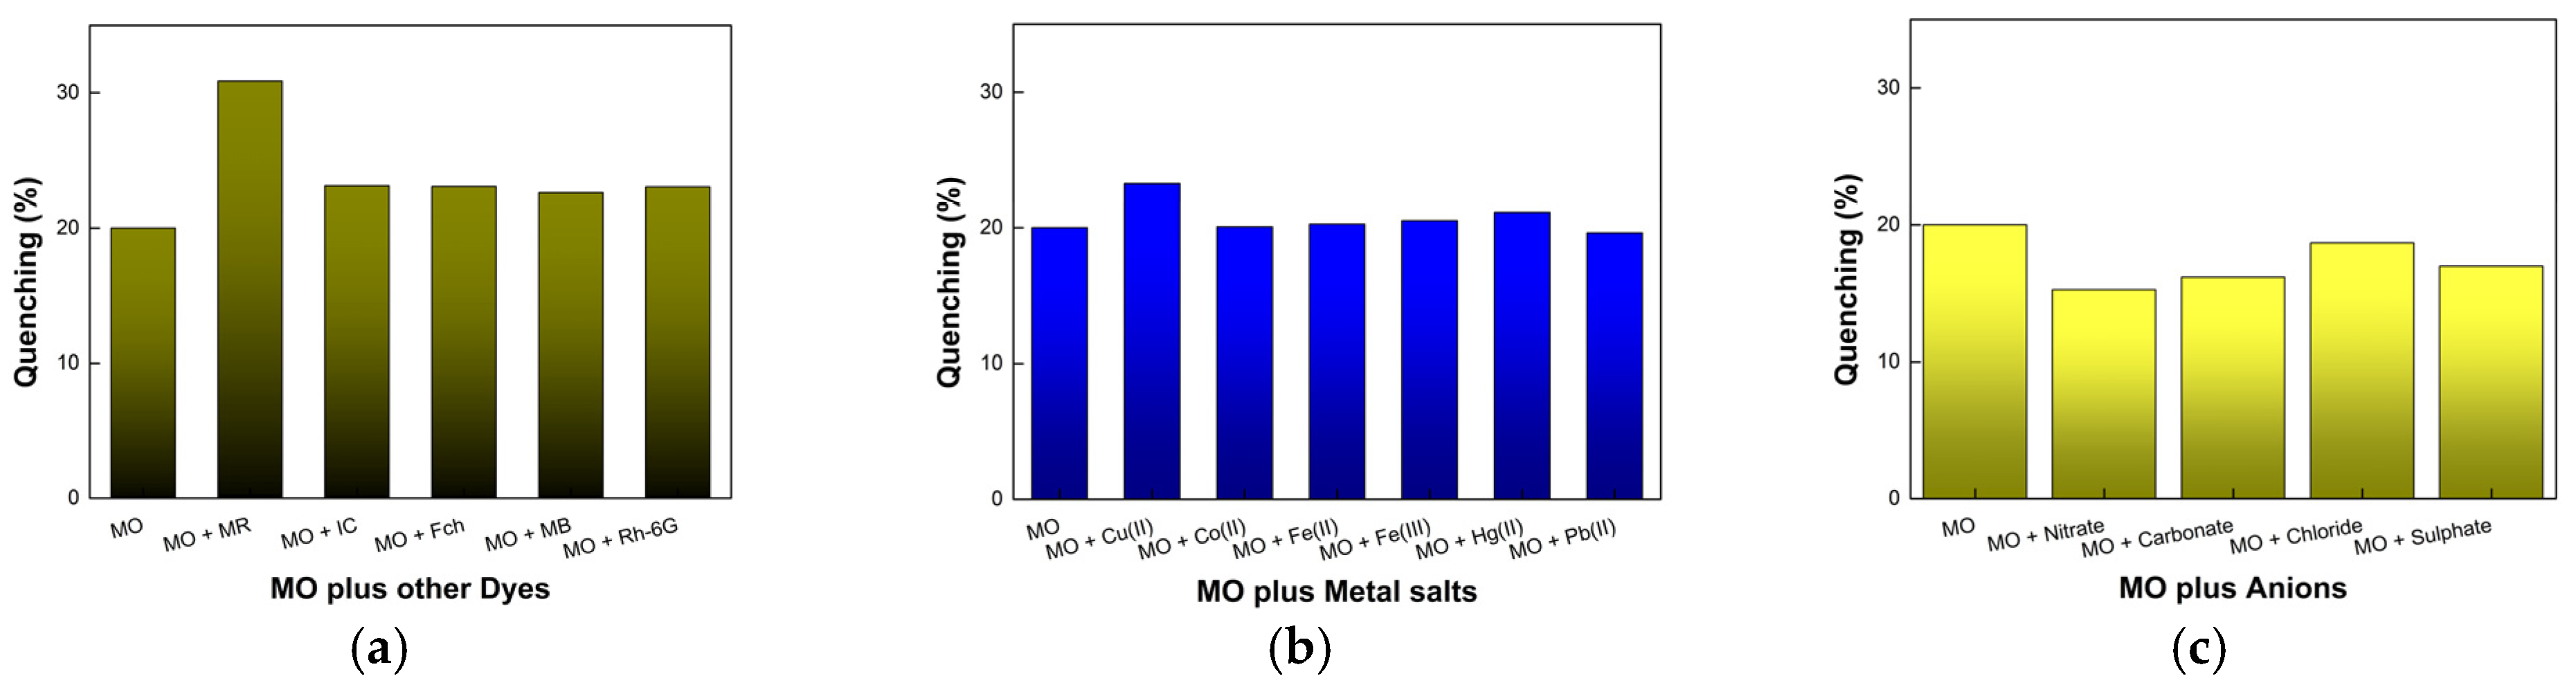
Figure 6.
(a) Emission spectra of WP-CDs (0.1 mg/mL) on titration with MO (0.0–53.0 μM) in phosphate buffer (pH = 7.2) at 25 °C. (b) Uncorrected (blue dots) and corrected (green dots) plots showing the observed fluorescence intensity behavior of WP-CDs-MO system at the full concentration range of MO (dotted lines drawn as an eye guide). (c) Stern-Volmer plots obtained from uncorrected fluorescence intensities (blue dots) and after correction for IFEs (green dots), up to [MO] = 15.1 μM. Steady-state data acquired under excitation at 340 nm and 426 nm observation.

Figure 7.
(a) Absorption spectrum of WP-CDs (0.1 mg/mL) upon addition of MO in a concentration of 52.4 μM in phosphate buffer (pH = 7.2) (red line) and the sum of the absorption spectra of each component taken separately (black line) under the same experimental conditions. (b) Absorption spectrum of WP-CDs alone (black line), and that obtained by subtraction of the MO spectrum from that obtained upon complexation (red line).

Figure 8.
(a) Time-resolved intensity decays (excitation at 340 nm; observation at 426 nm) of WP-CDs (0.1 mg/mL) upon addition of MO in aqueous solution. (b) Stern-Volmer plot of the amplitude average lifetimes of WP-CDs in the absence and presence of increasing concentrations of the dye.
Figure 8.
(a) Time-resolved intensity decays (excitation at 340 nm; observation at 426 nm) of WP-CDs (0.1 mg/mL) upon addition of MO in aqueous solution. (b) Stern-Volmer plot of the amplitude average lifetimes of WP-CDs in the absence and presence of increasing concentrations of the dye.
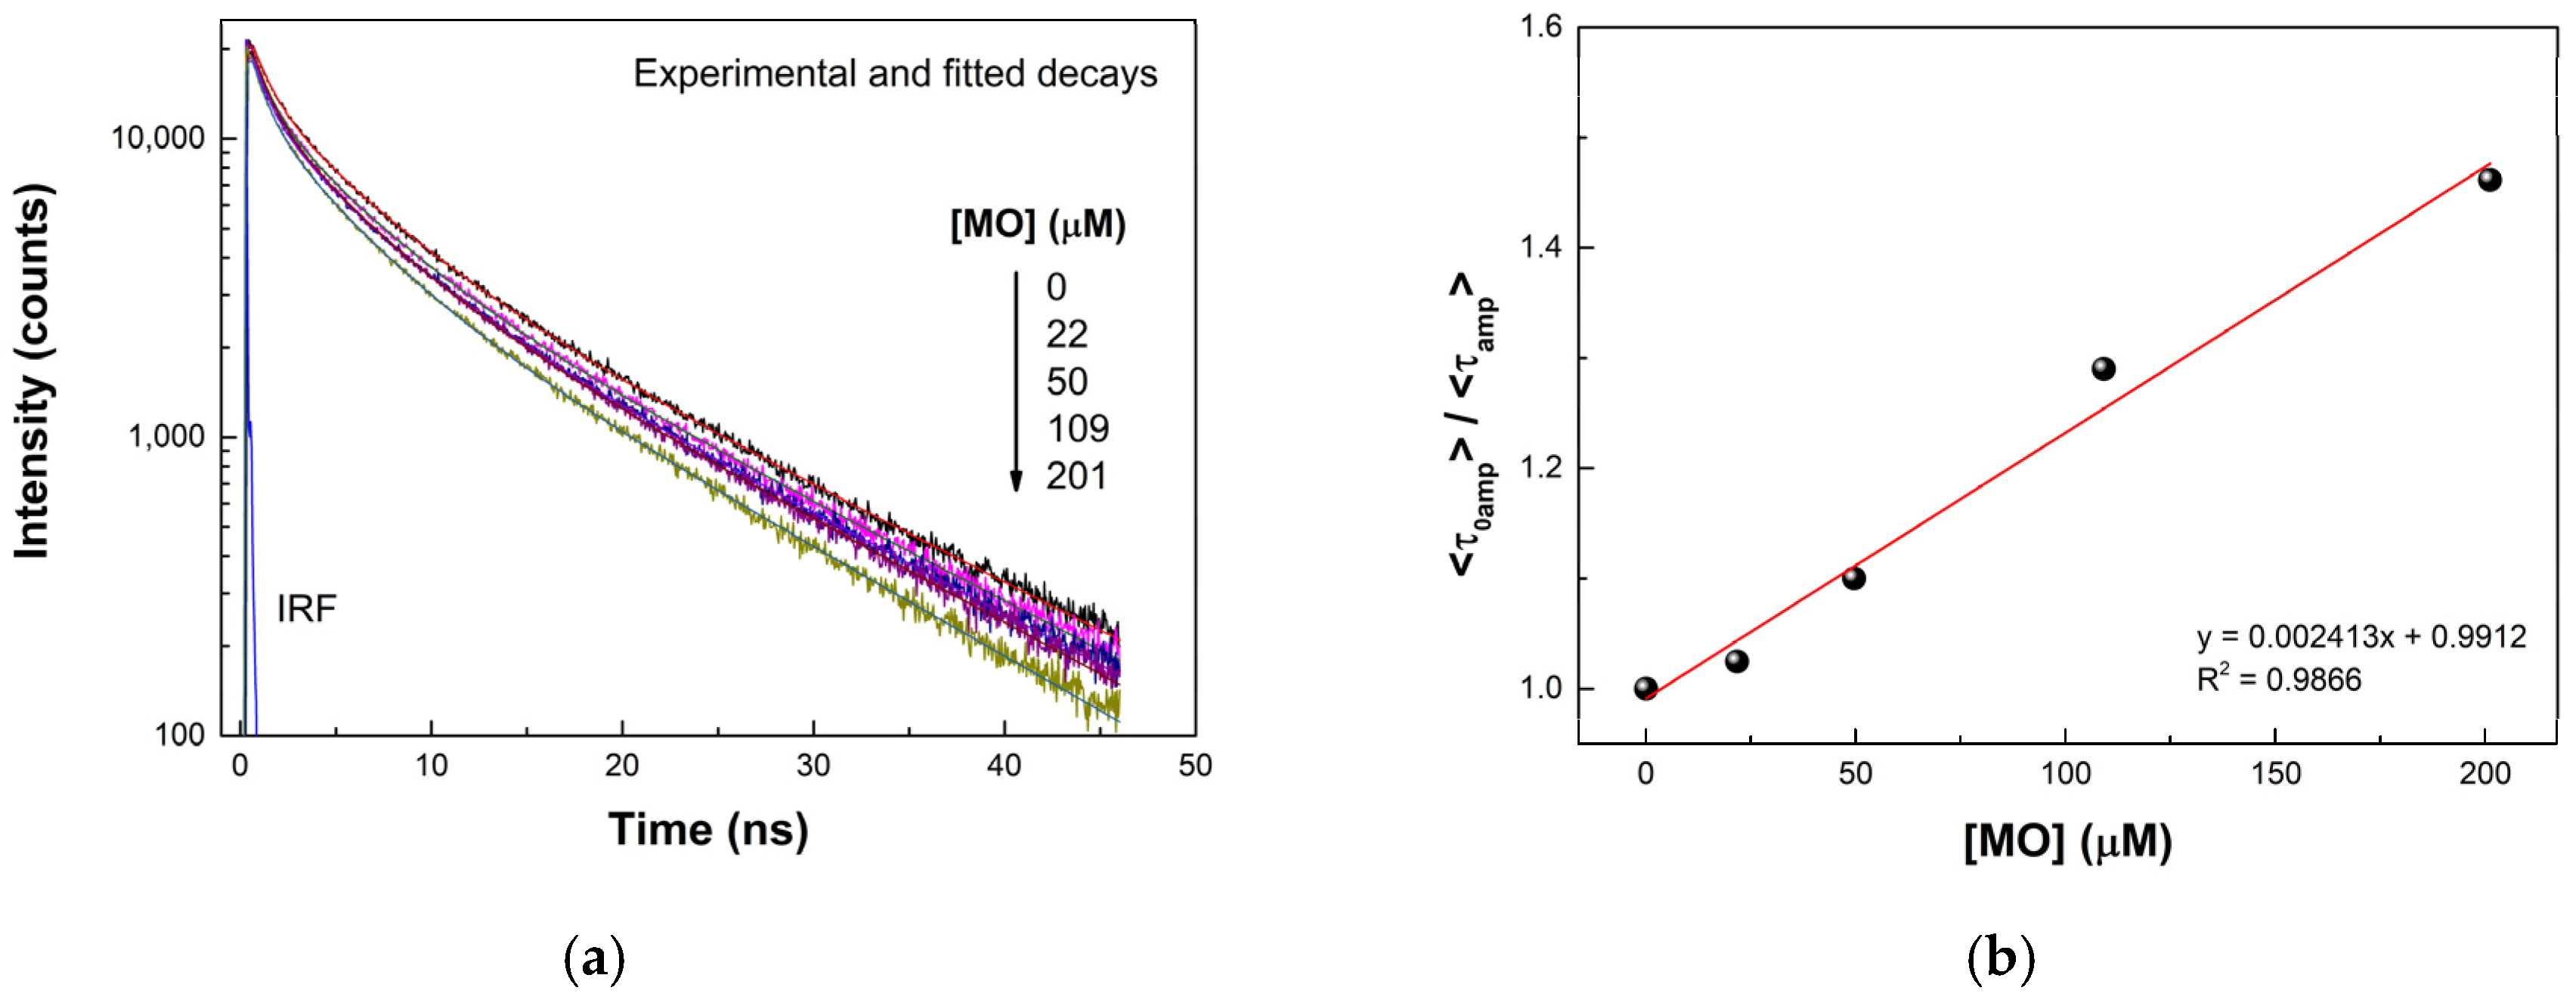
Figure 9.
Normalized emission spectrum (blue line; excitation at 340 nm) of WP-CDs (0.1 mg/mL) and absorption spectra of (a) MO, (b) MR, (c) IC, (d) Fch, (e) MB, and (f) Rh-6G, all in phosphate buffer (pH = 7.2).
Figure 9.
Normalized emission spectrum (blue line; excitation at 340 nm) of WP-CDs (0.1 mg/mL) and absorption spectra of (a) MO, (b) MR, (c) IC, (d) Fch, (e) MB, and (f) Rh-6G, all in phosphate buffer (pH = 7.2).


Table 1.
Comparison of recent methods of MO detection based on nanostructured materials and polymers.
Table 1.
Comparison of recent methods of MO detection based on nanostructured materials and polymers.
| Probes | Method | Mechanism 1 | LOD (μM) | Ref. |
|---|---|---|---|---|
| Silica functionalized with terthiophene | Fluorescence (turn-off) | IFEs or RET | 0.09 | [10] |
| Citric acid/urea CDs | Fluorescence (turn-off) | IFEs | 0.04 | [13] |
| Lanthanide-doped NaBiF4 nanosheets | Fluorescence (turn-off) | IFEs/RET | 4.6 | [11] |
| Conjugated fluorene-based polymers | Fluorescence (turn-off) | IFEs (sensor array) | n/a 2 | [12] |
| Extract of A. carambola and arginine CDs | Fluorescence (turn-off) | IFEs/RET | 0.30 | [15] |
| WP-CDs | Fluorescence (turn-off) | Static & RET | 0.46 3 | This work |
1 As proposed by the authors. 2 Not directly available; detection at sub-μM levels. 3 After correction for IFEs (see text).
Table 2.
Critical energy transfer distances (R0) for RET between WP-CDs and several dyes.
| Acceptor Dye | R0 (Å) 1 |
|---|---|
| Methyl Orange (MO) | 36.9 |
| Methyl Red (MR) | 33.8 |
| Indigo Carmine (IC) | 26.3 |
| Fuchsin (Fch) | 26.2 |
| Methylene Blue (MB) | 24.6 |
| Rhodamine-6G (Rh-6G) | 34.6 |
1 The Förster radii (R0) were calculated using n = 1.333 (water), κ2 = 2/3, and a quantum yield of 0.2.
Publisher’s Note: MDPI stays neutral with regard to jurisdictional claims in published maps and institutional affiliations. |
© 2022 by the authors. Licensee MDPI, Basel, Switzerland. This article is an open access article distributed under the terms and conditions of the Creative Commons Attribution (CC BY) license (https://creativecommons.org/licenses/by/4.0/).
Share and Cite
MDPI and ACS Style
Sousa, D.A.; Berberan-Santos, M.N.; Prata, J.V. Detection of Azo Dyes Using Carbon Dots from Olive Mill Wastes. Chemosensors 2022, 10, 487. https://doi.org/10.3390/chemosensors10110487
AMA Style
Sousa DA, Berberan-Santos MN, Prata JV. Detection of Azo Dyes Using Carbon Dots from Olive Mill Wastes. Chemosensors. 2022; 10(11):487. https://doi.org/10.3390/chemosensors10110487
Chicago/Turabian StyleSousa, Diogo A., Mário N. Berberan-Santos, and José V. Prata. 2022. "Detection of Azo Dyes Using Carbon Dots from Olive Mill Wastes" Chemosensors 10, no. 11: 487. https://doi.org/10.3390/chemosensors10110487
Note that from the first issue of 2016, this journal uses article numbers instead of page numbers. See further details here.